Article

Preferences and Expectations of Japanese Employees toward Telecommuting Frequency in the Post-Pandemic Era

1
Department of Civil and Environmental Engineering, Nagoya University, Furocho, Chikusa Ward, Nagoya 464-8603, Japan
2
Institute of Materials and Systems for Sustainability, Nagoya University, Furocho, Chikusa Ward, Nagoya 464-8603, Japan
3
Institute of Innovation for Future Society, Nagoya University, Furocho, Chikusa Ward, Nagoya 464-8603, Japan
*
Author to whom correspondence should be addressed.
Sustainability 2023, 15(16), 12611; https://doi.org/10.3390/su151612611
Submission received: 19 July 2023 / Revised: 16 August 2023 / Accepted: 18 August 2023 / Published: 21 August 2023
(This article belongs to the Section Sustainable Transportation)

Abstract

:
Telecommuting has reached unprecedented levels in Japan, previously established due to the sudden outbreak of the COVID-19 pandemic; however, there is a lack of in-depth research on telecommuting frequency from the perspective of the post-pandemic era. Hence, this study investigated the relationship between employees’ expected levels of telecommuting allowed by the company and their preferred telecommuting frequency after the pandemic using an ordered response probit model with a correlation effect. Data were collected through an online questionnaire in three major metropolitan areas of Japan; the questionnaire included questions on sociodemographic, commuting, household, and work-related characteristics. The findings revealed that work-environment characteristics are prime factors influencing both expected and preferred telecommuting frequency; therefore, a telecommuting-oriented work environment is crucial for bridging the gap between employees and employers regarding telecommuting. Also, the results indicated that the preferred level of telecommuting is unattainable probably due to a lack of support from the company. Finally, a gap was identified between the expected telecommuting frequency that companies would allow and the preferred telecommuting frequency. This study provides implementations to achieve a work environment better adapted to the post-pandemic era and contributes to the establishment of future traffic forecasting models that enable effective mobility management through telecommuting.

1. Introduction

The development of information and communication technology (ICT) has led to telecommuting becoming an alternative way to work worldwide. The number of employees working elsewhere rather than in traditional offices is increasing. According to related surveys, the number of weekly telecommuters increased by 3.21% between 2001 and 2017 [1,2]. After the first confirmed case of COVID-19 was reported in Wuhan, China, in December 2019, the pandemic disseminated widely around the world [3,4]. Subsequently, the World Health Organization (WHO) declared the COVID-19 outbreak a severe pandemic that caused challenges for healthcare systems, the workforce, and transportation sectors. To avoid the spread of the virus, travel restrictions imposed by governments and office closures conducted by companies led to an unprecedented level of telecommuting in many parts of the world. In the United States, the number of employees working from home increased from 8% in February to 35% in May 2020 [5]. Similar growth patterns were observed in European countries. For example, up to 50% of workers telecommuted during the pandemic in the Netherlands and Switzerland [6,7]. Telecommuting has reshaped the travel behavior and daily routines of employees by releasing the spatial and temporal constraints associated with work; consequently, these pandemic-induced increases in telecommuting have led to dramatic changes in travel demands and mobility in metropolitan areas.
This massive spread of telecommuting is likely to have a long-term effect, reshaping commuting and travel behavior among employees in the post-pandemic era. Studies investigating the intention to telecommute have shown that workers will continue to adopt telecommuting in the post-epidemic future and even telecommute more frequently than they did during the epidemic [8,9,10,11,12]; however, there remains uncertainty regarding how telecommuting behavior will evolve in the post-pandemic future. Most employees who want to continue telecommuting are probably motivated by its advantages in promoting work–life balance, reducing commuting time and costs, and facilitating flexibility in scheduling activities. Transportation planners may promote telecommuting as an effective travel-demand management tool owing to its potential benefits in reducing traffic congestion, vehicle miles traveled, and vehicle emissions. Additionally, the government has taken the opportunity to implement telecommuting reforms in order to increase women’s employment in the workforce; however, telecommuting adoption is subject to certain constraints, including the availability of telecommunication infrastructure, productivity, and work suitability [13,14]. From the perspective of travel demand forecasting and the development of a more resilient and sustainable city, exploring the scale at which telecommuting will grow in the post-epidemic era is critical.
Although telecommuting is a rather complex choice-making process, previous studies have explored the factors influencing telecommuting frequency using different discrete choice models; most have focused on the pre-pandemic period. One of the objectives of this study was to examine the factors affecting employees’ telecommuting frequency in the post-pandemic phase. To obtain a more comprehensive analysis of telecommuting behavior, this study analyzed two types of post-pandemic telecommuting frequency. The first is the telecommuting frequency that employees expect to achieve within a company’s policy; the second is the preferred frequency, which is the telecommuting frequency that employees want to implement. Another objective of this study was to analyze factors that affect employees’ expectations and preferences toward telecommuting frequency, including socio-demographics, household attributes, trip-related and job-related characteristics, and work-environment characteristics. In addition, telecommuting usage was relatively low in Japan among developed countries before the pandemic. The onset of the pandemic created unprecedented opportunities for employees to telecommute; however, the constraints set by corporate systems further determine whether telecommuting will continue in the post-pandemic era or return to pre-pandemic levels. Therefore, from the perspective of better understanding travel demand and telecommuting policy reform, a further objective of this study is to discuss the gap between the expectations and preferences of employees regarding telecommuting frequency.
Data were obtained from a web-based survey conducted in three major metropolitan areas of Japan from November to December 2020. As the data were collected during a period after the outbreak began, employees experienced the merits and demerits of telecommuting for a reasonably extended period, resulting in a clear perception of and plan for post-pandemic telecommuting behavior. The results of this study will provide useful insights into commuting behaviors, travel demands, and telecommuting policies in a society in which telecommuting is widespread. The reshaped commuting trends caused by the post-pandemic diffusion of telecommuting may have a significant impact on transportation policy and urban network planning in the coming years.
The remainder of this paper is organized as follows: Section 2 provides a brief review of the literature on telecommuting frequency. Section 3 presents the experimental design of the survey, the descriptive statistics of the sample, and the model structure used for estimation. The main findings of this analysis are summarized in Section 4. Finally, the conclusions and implications for policymakers and the transportation sector are discussed in Section 5.

2. The Literature Review

Telecommuting can shift the travel priorities of employees and reshape their daily tasks and lifestyles; therefore, exploring the level of telecommuting is important for a better understanding of travel and a more accurate representation of how employees plan and schedule their activities. To address these issues, research on telecommuting choices, preferences, and frequency has been of significant interest for over three decades. Owing to the limitations of the low adoption rate of telecommuting and the conduction of surveys, early research was mostly quantitative and aggregate analyses based on small sample sizes of stated preference (SP) surveys (see, for example, Bernardino et al. [15]; Drucker and Khattak [16]; Sullivan et al. [17]). Later studies focused on empirical analyses to identify the effects of personal, household, work-related, and built-environment characteristics on telecommuting choices and frequency.
Pouri and Bhat [18] established a joint model to investigate the choice and weekly frequency of home-based telecommuting in the New York Metropolitan area using data conducted from a revealed-preference (RP) survey. These findings suggest that individual and household demographics, as well as the occupational characteristics of employees, significantly impact their telecommuting frequency. The correlation between unobserved factors affecting the choice and frequency of telecommuting is also underlined. In a more recent study, telecommuting choice and frequency were analyzed jointly with a copula-based model using data from the Chicago Regional Household Travel Inventory [19]. In this study, the telecommuting choice was estimated using a binary choice model, while its frequency was analyzed using an ordered response model. The empirical results identified a relationship between several demographic and work-related variables and telecommuting frequency. In addition to explanatory variables such as sociodemographic characteristics and commuting time, which have been explored in previous studies, Tang et al. [20] focused primarily on examining the impact of residential neighborhood-built environment (BE) factors on telecommuting frequency. The study developed a multinomial logit (MNL) model to estimate telecommuting frequency using data from a survey of eight neighborhoods in Northern California and pointed out the associations between built environment variables and the frequency of working at home. Singh et al. [21] further explored telecommuting frequency from a supply perspective (i.e., the telecommuting options offered by employers). The study proposed a joint trivariate model including a generalized ordered response (GOR) model to analyze the precise count of telecommuting days per month using data from the 2009 National Household Travel Survey conducted in the San Francisco Bay area to estimate the option, choice, and frequency of telecommuting. Several studies examining the impact and consequences of telecommuting adoption on trips, vehicle miles traveled, and environmental emissions have also applied ordered logit or probit models to estimate the factors affecting telecommuting frequency [22,23].
Although telecommuting adoption grew steadily prior to the COVID-19 outbreak, many employees had not experienced it; as a result, either the sample of surveys on telecommuting was relatively small or the perception of their preference for telecommuting lacked a practical basis. The Coronavirus disease (COVID-19) pandemic has dramatically changed this situation, driving telecommuting to an unprecedented level in many countries. The aforementioned literature on telecommuting adoption and frequency is from the period prior to the pandemic outbreak. Because some employees were forced to telecommute during the pandemic, to avoid the spread of the virus, much of the subsequent research also focused on telecommuting usage in a COVID-19 pandemic context. With the global spread of COVID-19, several surveys on telecommuting usage have been conducted in different countries, and a pandemic-induced rise in telecommuting usage has been observed in the Netherlands, Switzerland, Australia, and the United States (see, for example, Beck et al. [5]; de Haas et al. [7]; Shamshiripour et al. [24]; Zhang et al. [25]). Eurofound [26] reported that about 48% of employees in European countries were telecommuting to some degree during the pandemic. A similar pattern of dramatic telecommuting growth facilitated by the pandemic was also observed in Asian regions, such as China (e.g., Sun et al. [27]; Ma et al. [28]) and South Korea (e.g., Ha [29]). In addition, since the outbreak began, numerous studies have been conducted in many developing countries on the impact of telecommuting on transportation, commuting, and mobility (see, for example, Anwari et al. [30]; Bhaduri et al. [31]; Dandapat et al. [32]; Ivanova et al. [33]).
In addition to the aggregation analysis of telecommuting adoption and the exploration of telecommuting characteristics, several studies have provided quantitative analyses of telecommuting behavior covering during the pandemic as well as the post-pandemic period, considering preferences toward telecommuting. A recent study used binary logit models to explore factors affecting telecommuting in Vietnam during and after the COVID-19 era [34]. The results indicated that issues such as distractions and data-access constraints were the main factors hindering employees from telecommuting during the pandemic. Gender, commuting distance, the presence of children in the household, and attitudinal factors were the main indicators of future telecommuting adoption. On a similar note, Nguyen and Armoogum [4] used the same dataset to examine the role gender played in telecommuting preferences from a post-epidemic perspective. The findings show that women are more likely to have positive perceptions of telecommuting before and after the pandemic. Another study examined telecommuting frequency during the pandemic and analyzed the factors influencing telecommuting after the pandemic using data collected in India [35]. Factors such as the working environment at home, household responsibilities, distraction by other household members, and network connectivity were identified as having an impact on telecommuting frequency during the pandemic. The results also indicate that socioeconomic characteristics and activity-travel patterns during the pandemic are key parameters affecting future decisions on telecommuting adoption. Also, studies focusing on major metropolitan areas in Japan have identified a number of demographic and work-related variables that affect telecommuting frequency based on data collected during the pandemic by applying an ordered probit model [36].
Based on the above literature review, there is a lack of in-depth research on telecommuting frequency from the perspective of the post-pandemic era. Factors affecting post-pandemic preferences for telecommuting frequency have not been identified. If increased levels of telecommuting are the “new normal” in a post-pandemic world, exploring telecommuting frequency in a society where telecommuting is widespread has important implications for strategic transportation models that predict transportation demand and simulate network traffic. On the one hand, many employees are willing to continue telecommuting in the post-pandemic era. On the other hand, with the release of mobility restrictions, advances in telecommunications technology, and the emergence of coworking spaces, a hybrid work model that combines telecommuting and office-based work is the trend after the pandemic [37,38,39]. Therefore, to better understand work scheduling and implement better telecommuting innovations, it is imperative to examine the factors that influence telecommuting frequency after the pandemic. In addition, the expected frequency with which a company will allow employees to telecommute in the aftermath of the pandemic may differ by industry. To better propose telecommuting policies that adapt to the post-pandemic period, it is also vital to explore the telecommuting frequency from both the employer’s and industry’s perspectives. Peters et al. [40] used a 2001 Work and Information Technology Survey in the Netherlands to investigate whether an employee is offered the opportunity to telecommute by the employer and whether the employee is willing to telecommute; however, this study ignores the important dimension of the frequency of telecommuting. Later, Singh et al. [21] estimated a joint model of three dimensions—option, choice, and frequency of telecommuting—which indicate that ignoring the employer’s perspective may lead to incorrect conclusions regarding the behavioral processes governing telecommuting decisions. However, the pandemic has rapidly accelerated the use of telecommuting and may result in changes in employer attitudes and policies toward telecommuting. Both studies cannot draw timely conclusions about the stage of the pandemic. More recent studies have discussed various aspects of the challenges of telecommuting in the post-pandemic era, as well as considerations, from an employer’s perspective (e.g., Hajal [41]; Mohammadi et al. [42]). For example, companies need to propose policies that meet the different needs of their employees, practice trust-based leadership, and consider issues such as the mentality of their employees [43]. Yet, these studies did not use empirical research to examine the frequency of telecommuting in the post-epidemic phase from the employer’s perspective. Also, previous studies have failed to examine the gap between the frequency of telecommuting preferred by employees and that expected by organizations. These insights will contribute to improving telecommuting policies in the post-pandemic era to create a better work environment that meets both business interests and employee needs. Therefore, this study fills this research gap by comprehensively examining the factors affecting both the expected and preferred telecommuting frequency of employees after the pandemic.

3. Data and Method

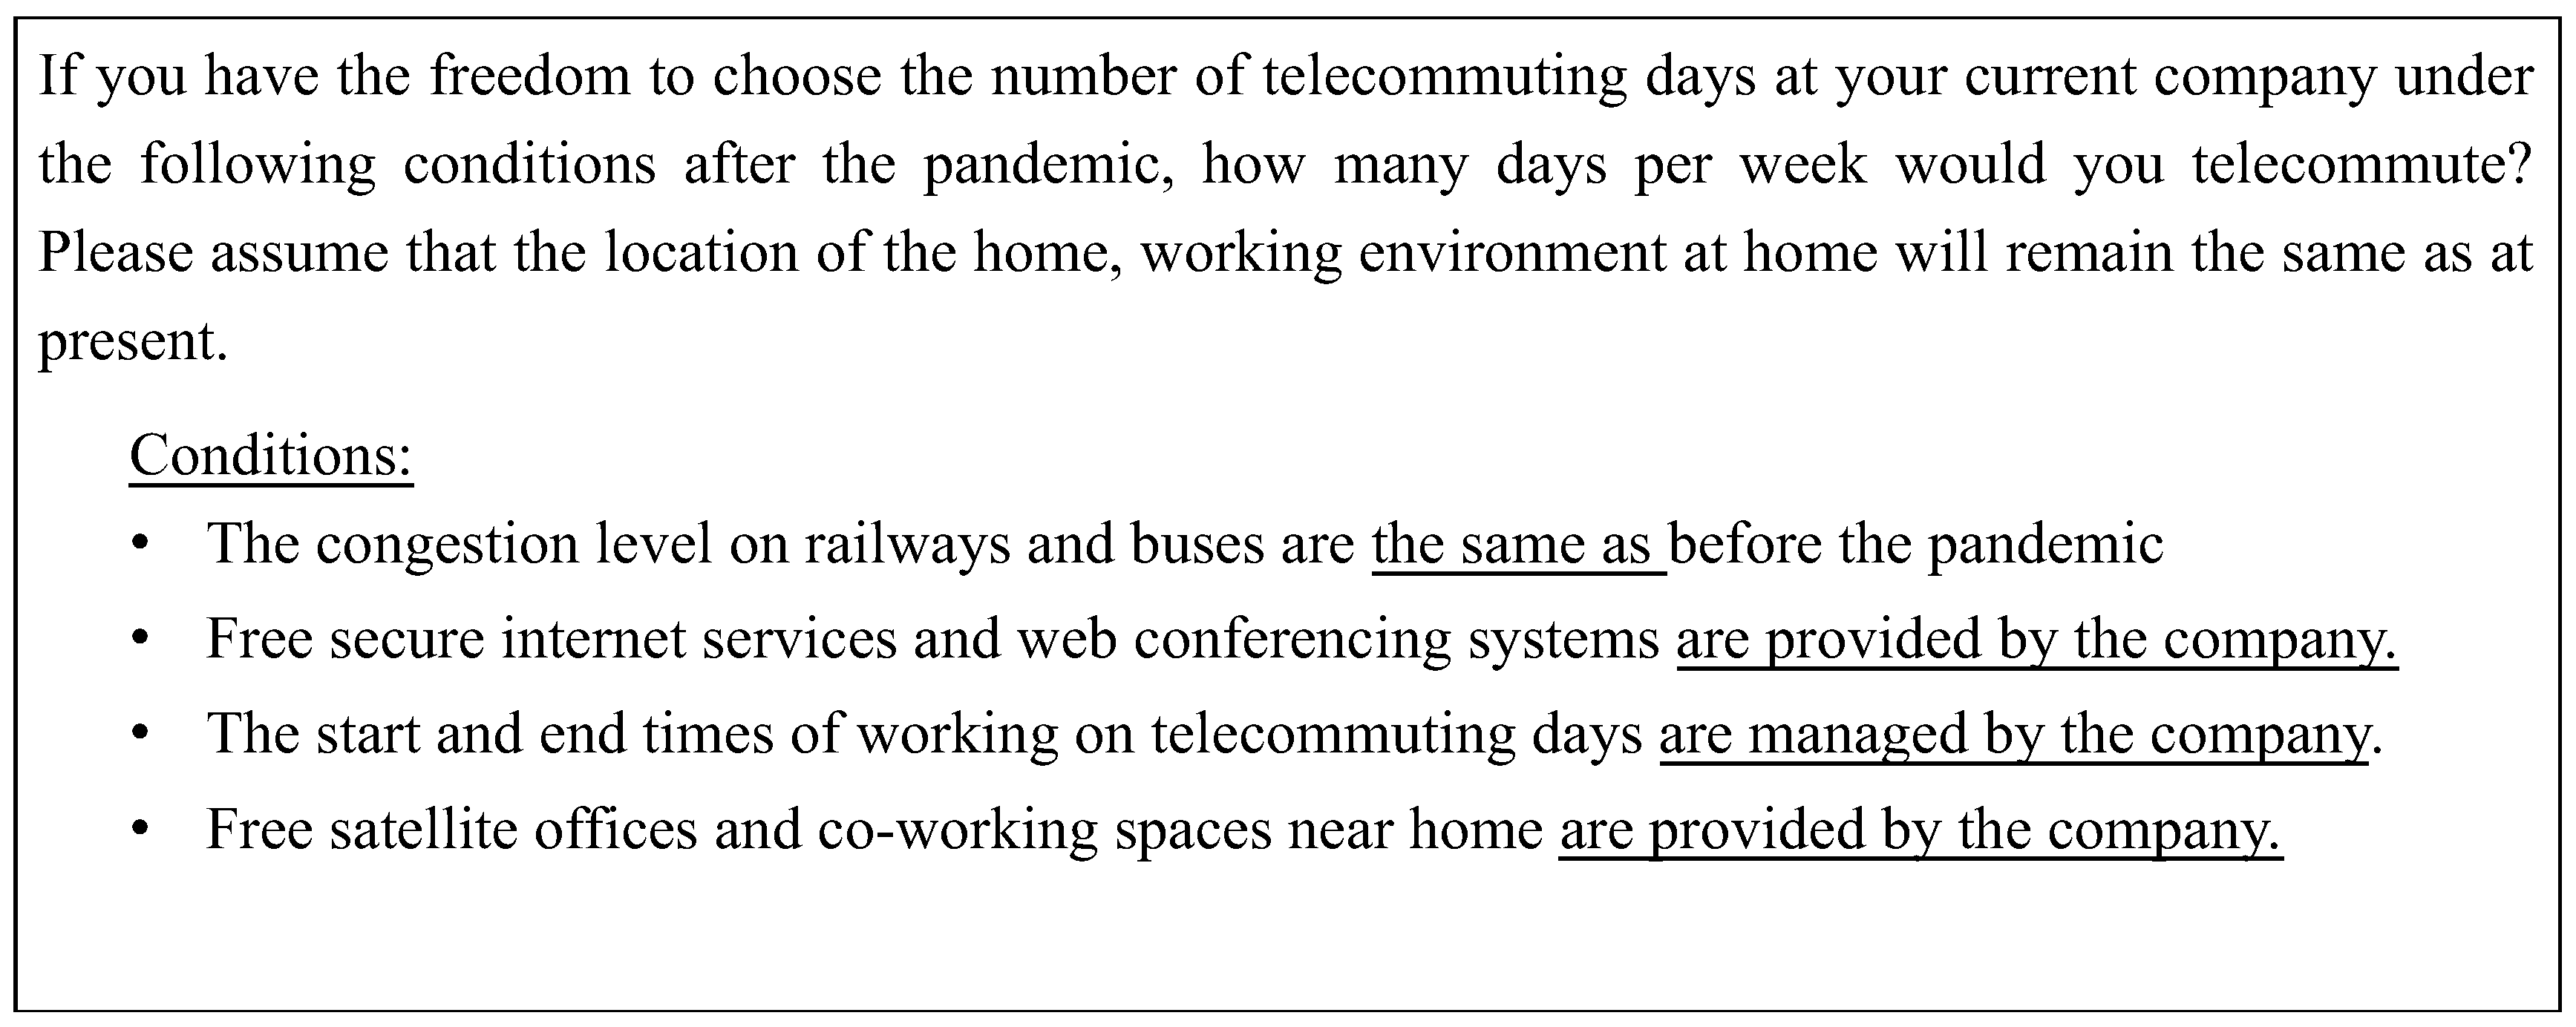
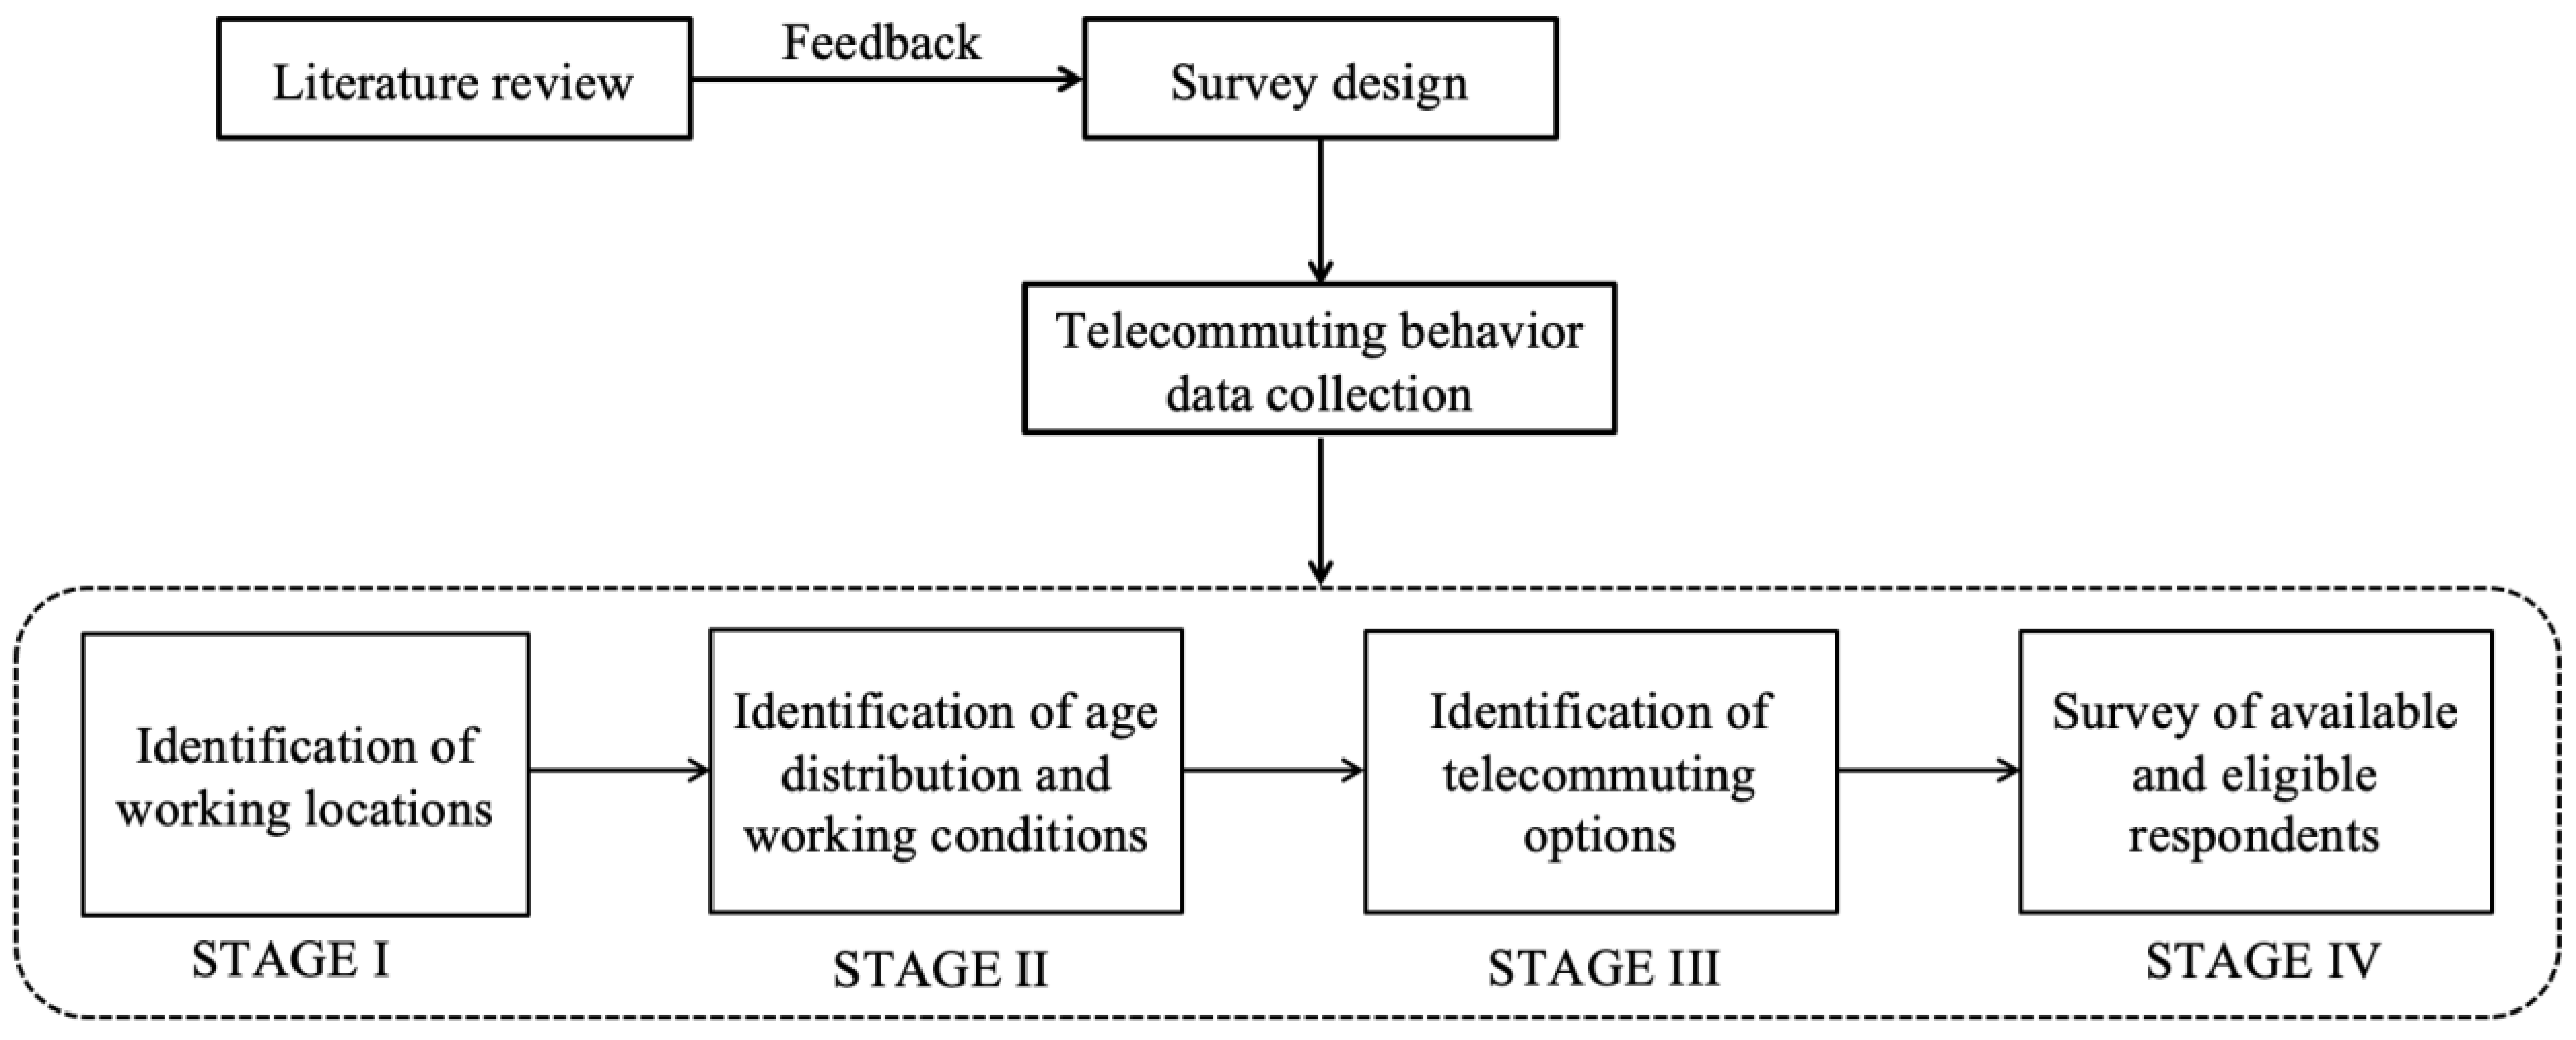
3.1. Design of Experiment, Questionnaire, and Survey

To understand how the pandemic has reshaped people’s telecommuting behaviors and their post-pandemic expectations, a web-based questionnaire survey was conducted from November 26 to 2 December 2020 in three major metropolitan areas in Japan. The survey consisted of the following sections: socio-demographics, commuting- and work-related information, household structure, and telecommuting frequency. The telecommuting frequency of employees was collected for three periods: before the pandemic (before October 2019); in November 2020, when the pandemic was severe in Japan; and long after the pandemic, when people returned to normal life after effective vaccines and medications were available.
The survey on post-pandemic telecommuting frequency incorporated two components: an expected and a preferred frequency. On the one hand, the respondents were asked to answer what their expected telecommuting frequency will be, considering their companies’ policies and culture. On the other hand, the respondents were asked to indicate their preference for telecommuting frequency after the pandemic without considering their companies’ policies and culture in the stated preference question. Both expectations and preferences for telecommuting frequency were measured on a 6-point scale: five times a week (no office commutes at all), four times a week, three times a week, twice a week, once a week, and never (commutes to the office every day). The four two-level factors applied in the experimental design for the stated preference survey are listed in Table 1. Based on the orthogonal Taguchi array, eight combinations of the four factors representing the eight hypothesized scenarios were obtained, and one scenario was randomly selected and presented to each respondent. Figure 1 illustrates how one of the hypothesized scenarios was presented to the respondents in the questionnaire.

3.2. Sample Formation and Descriptive Statistics

The study sample was obtained from MACROMILL, an online research company. A prescreening of 10,000 employees (excluding self-employed employees) in three major metropolitan areas of Japan was conducted in five phases. The data collection process is shown in Figure 2. The first stage involved identifying the distribution of their work locations. Particularly, employees whose workplaces were within a 50 km radius of the city center of Tokyo’s 23 special wards, Osaka City, and Nagoya City, were selected. Screening questions for controlling the sample of respondents aged 25 years or older with more than one year of experience in their current workplace and working five days per week were implemented in the second phase. The purpose was to eliminate the effect of unstable work status on employees’ telecommuting options. To avoid bias in telecommuting preferences arising from the supply side, the third stage confirmed whether the respondents in the sample had telecommuting options. The age distribution of participants was determined in the fourth step. The proportion of employees in each age group with telecommuting options obtained in the third phase was multiplied by the census age distribution to obtain the sample size for each age group. Finally, the ratio of employees in Tokyo, Osaka, and Nagoya was set at 2:1:1 to maintain consistency with the census data.
Questionnaire surveys were administered to 2045 eligible employees after the pre-screening was completed. After removing erroneous and outlier data, a sub-sample of 1820 employees was used. Among them, 1163 (64%) were telecommuters who had telecommuted at least once a week before or during the pandemic, whereas 657 employees (36%) reported no previous telecommuting experience. Table 2 presents the age distribution of the survey sample compared to the census data of employees in the Tokyo, Osaka, and Nagoya metropolitan areas. The age distribution of the respondents in this study was consistent with the census, indicating that the results can be applied to the working population in these three metropolitan areas. Table 3 presents the definitions of the explanatory variables used in the estimation and their statistical attributes.
To provide a more comprehensive estimate of telecommuting behavior in the post-pandemic era, we first analyzed the expected and preferred telecommuting frequency of employees at the aggregate level. Figure 3 shows that employees’ expectations and preferences differ across frequency levels. Almost half (48%) of the employees expected to telecommute after the pandemic, while only 15% reported a preference for telecommuting; in addition, workers’ expectations and preferences for frequent telecommuting (i.e., complete telecommuting during the week without commuting to the office) differed after the pandemic. Employees were conservative in their expectations and plans for post-pandemic telecommuting. In terms of their preferences for telecommuting, 85% were willing to telecommute after the pandemic at a certain frequency per week. Therefore, a joint analysis of both the expected and preferred frequency is necessary to identify the factors influencing telecommuting levels in the post-pandemic era.

3.3. Method

Previous studies have utilized a number of methodological approaches to analyze telecommuting frequency before the outbreak of the pandemic in different regions, including ordered probit or logit models, multinomial logit (MNL) models, binary logit models, and generalized ordered responses (GOR) [18,19,21,22,23]. With respect to post-pandemic telecommuting frequency, respondents were first asked to report their expectations of telecommuting frequency. The SP questions collected preferences for telecommuting frequency in different work environment settings.
An ordered probit model was applied, and the ordinal dependent variable was telecommuting frequency (i.e., no telecommuting, one, two, three, four, or five times a week). To investigate the differences in the influence of various variables on the two types of telecommuting frequency, the thresholds were shared. Additionally, considering the unobservable similarity between the expected and preferred telecommuting frequency answered by the same respondent, a common random term was introduced into these ordered probit models to account for the correlation.
The ordered probit model is an extension of the binary probit model, which assumes that the error term follows a standard normal distribution [44]. In the first step, the unobserved latent variable y l i of the telecommuting frequency type l (where 1 refers to expectation and 2 refers to preference) for each individual i is as follows:
y l i = x l i β l + u i + ε l i
where β l is the vector of the parameters to be estimated; x l i is a vector of explanatory variables; ε l i is the error term for each type of telecommuting frequency, which is normally distributed with a zero mean. The standard deviation of either error term can be set to 1 without loss of generality. In this study, the standard deviation σ 1 of error term ε 1 i for the expected telecommuting frequency is set to 1. The ratio of the standard deviation σ 2 of error term ε 2 i to σ 1 is estimated as σ . u i represents the unobserved common random component in both types of frequency and is assumed to follow a normal distribution with a zero mean and variance of σ . In the ordered probit model, both the expected and preferred telecommuting frequency are assumed to be observed as frequency levels y l i :
y l i = 0     i f   y l i μ 1                     1     i f   μ 1 < y l i μ 2 2     i f   μ 2 < y l i μ 3 J     i f   μ J < y l i                    
where μ 1 , ,   μ J are thresholds to be estimated; J is the number of telecommuting frequency levels, which is 6 in this study (0, once a week, twice a week, three times a week, four times a week, and five times a week). Note that these thresholds were shared between both types of telecommuting frequency in this study. The probability that an individual i answers a certain frequency for a type of telecommuting frequency l can be calculated using the following equation:
P y l i = 0 | u i = μ 1 x l i β l ϕ ε l i d ε l i = Φ μ 1 x l i β l u i P y l i = 1 | u i = μ 1 x l i β l μ 2 x l i β l ϕ ε l i d ε l i = Φ μ 2 x l i β l u i Φ μ 1 x l i β l u i P y l i = J | u i = μ J x l i β l ϕ ε l i d ε l i = 1 Φ μ J x l i β l u i
where ϕ · and Φ · are the density and cumulative functions of the standard normal distribution, respectively. The joint probability of the two types of telecommuting frequency is represented as the product of each probability. Considering the common random component u i as a randomly simulated variable, the unconditional log-likelihood that an individual i answers the expected telecommuting frequency m and the preferred telecommuting frequency k , respectively, can be defined as
log L ( β 1 , β 2 , σ | y 1 i , y 2 i , x 1 i , x 2 i ) = i = 1 N ln P y 1 i = m | u i P y 2 i = k | u i f u i | σ
where f · | σ is the density function of the normal distribution with standard deviation σ . The parameters β 1 , β 2 , σ , σ , and μ j ( j = 1 ,   2 ,   ,   J ) are estimated by the maximum simulated likelihood procedure using the Monte Carlo method with 250 Halton draws regarding the random component u i .

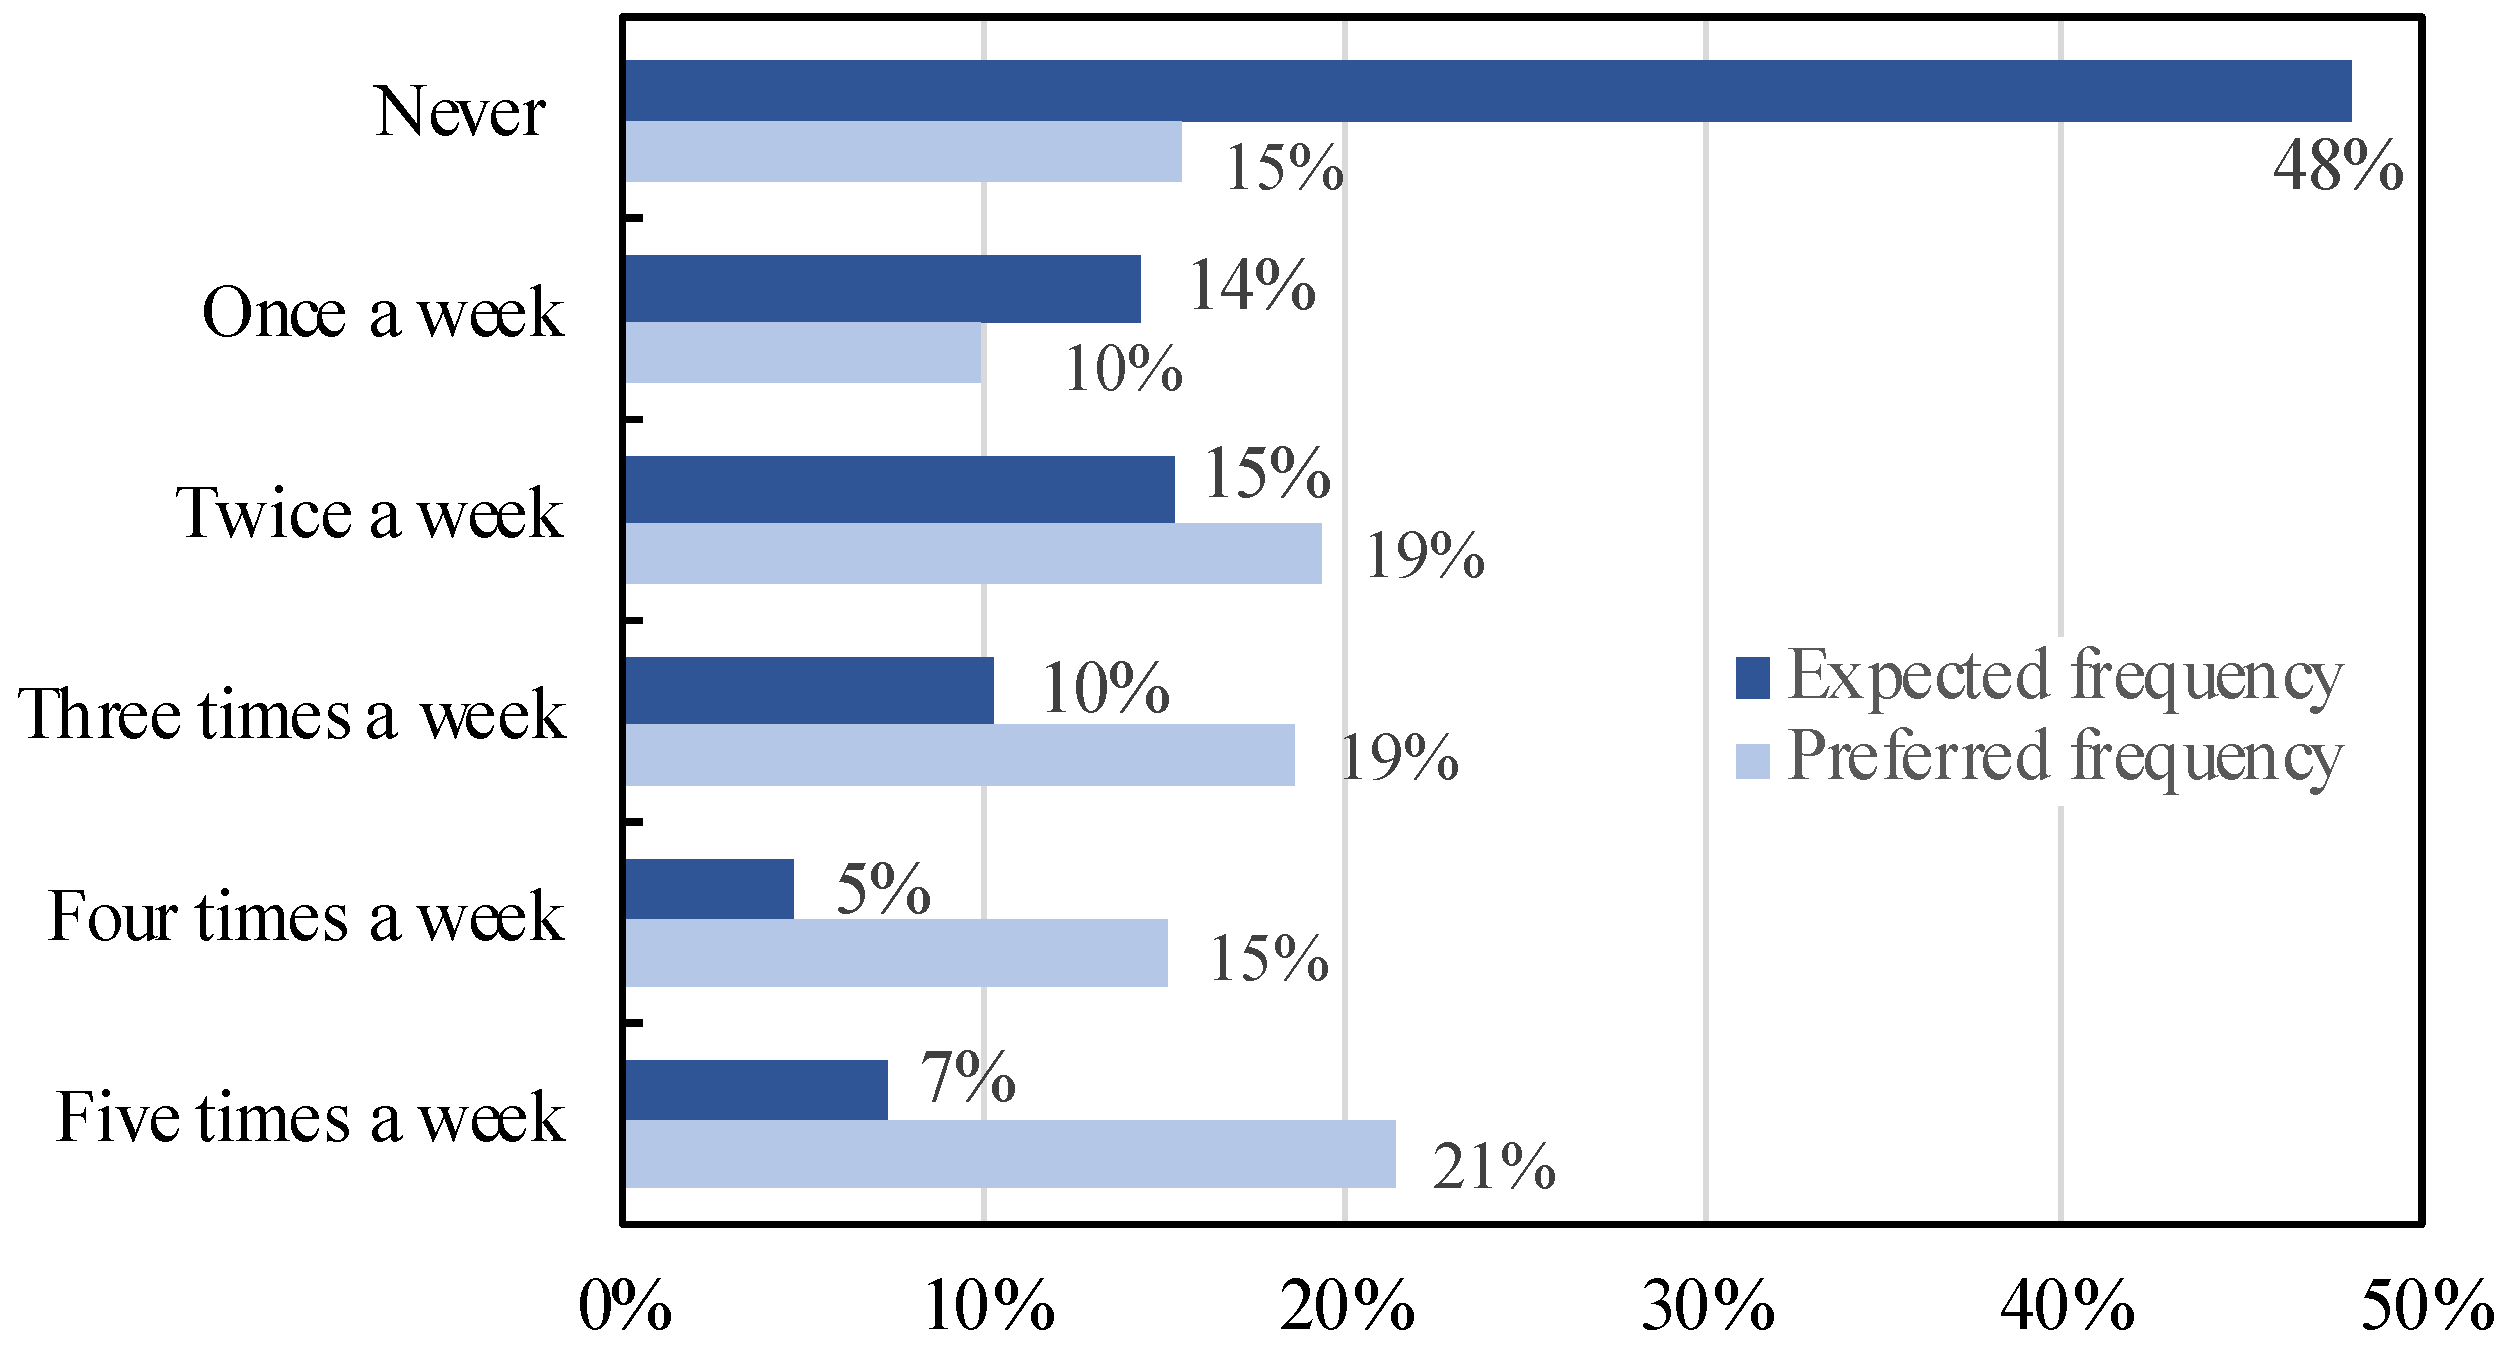
4. Model Estimation Results and Discussion

The estimated results of the expected and preferred telecommuting frequency are presented in Table 4. All variables were introduced into the model to investigate the indicative insights they provided.

4.1. Effects of Personal and Household Attributes

Although both were significant, the estimates associated with gender revealed different signs between the expected and preferred telecommuting frequency. This suggests that female employees may prefer telecommuting frequently but are less likely to expect frequent telecommuting after the pandemic. This partly reflects the fact that the working environment in Japan is less favorable for women; in particular, companies may discourage them from telecommuting. This finding is somewhat consistent with previous studies indicating that gender does not have a significant effect on the frequency of telecommuting, as women have less access to telecommuting options than men [19,45]. Also, Japanese women play a major role in fulfilling family obligations, and telecommuting enables them to manage their careers alongside their family responsibilities [46]; therefore, they valued the opportunity to telecommute. However, women are relatively dominant in industries that rely on their physical presence in the workplace, such as sales and services. Companies provide fewer telecommuting opportunities because of productivity and practical concerns. The outbreak has forced industries that do not lend themselves to telecommuting to look for additional telecommuting opportunities; however, their telecommuting use is likely to approach pre-pandemic levels. The post-pandemic workplace must be designed to take advantage of telecommuting to better balance women’s domestic and working responsibilities. Examples include the adoption of a work style that combines telecommuting with office work.
Additionally, age had a significant effect on the preferred frequency of telecommuting, whereas its impact on the expected frequency was statistically insignificant. Younger workers under 29 years of age might be willing to perform frequent telecommuting after the pandemic, whereas senior workers over 60 years of age are less likely to engage in frequent telecommuting in the post-pandemic period. This could be attributed to the low diffusion of telecommuting in Japan, as most employees began to avail themselves of telecommuting only following the outbreak of the pandemic. This finding is consistent with those of several studies conducted prior to the pandemic. Singh et al. [21] indicated that older workers are more likely to be in powerful positions, thereby requiring a physical presence in the workplace, whereas younger people have a higher propensity for a free and diverse working culture created by telecommuting. Furthermore, the massive expansion of telecommuting in Japan caused by the outbreak was abrupt, and it is unknown whether certain companies will continue to adopt telecommuting after the outbreak. As a result, the post-pandemic telecommuting plans of both younger and senior employees are closely tied to the future direction of company policy.
Given the potential benefits of telecommuting, younger female employees are inclined to frequently telecommute after the pandemic; however, there is a barrier between their expected and preferred telecommuting frequency because their plans to telecommute are likely to lack support from company policies. Employers should propose further approaches to sustain telecommuting from the perspective of strengthening the labor market.
Regarding household characteristics, the presence of preschool children is associated with both high expectations and preferred telecommuting. The presence of preschool children is usually associated with increased family responsibilities and reduced mobility [47]. In addition, income and car ownership have no significant effect on preferred telecommuting frequency. The results indicate that mid- to high-income employees are more likely to frequently telecommute. Their industry or position probably allows greater flexibility in the workplace. For those with cars, the company is less likely to offer frequent telecommuting opportunities. This is perhaps because they have more commuting options than those without cars.

4.2. Effects of Commuting Characteristics

The effects of most trip-related variables on expected telecommuting frequency are statistically insignificant. In terms of preferred frequency, employees with longer commuting times and higher commuting costs favor higher levels of telecommuting after the pandemic. In regions with high commuting pressure, employees’ preference for telecommuting also reflects their potential to alleviate traffic problems. From workers’ perspectives, telecommuting serves as an effective mobility management tool that relieves commuting stress. This finding is also in line with some pre-pandemic reports that the time spent commuting has a positive effect on telecommuting frequency [23]. Therefore, it is vital for the transport sector to seize the opportunity for the rapid spread of telecommuting in Japan as a result of the pandemic and ensure its implementation in the post-pandemic era.
Moreover, this study included a broader range of commuting variables compared to previous studies that primarily discussed the effects of one-way commuting distance and workplace parking fees on telecommuting frequency [19,21,48]. The results reveal that employees who commute by railway are inclined to telecommute frequently after the pandemic, whereas those who commute by bus are reluctant to engage in high levels of telecommuting. This may be a consequence of the strong, long-term reliance of workers in Japan’s metropolitan railway areas. In addition, Liang et al. [36] noted that in the Tokyo, Osaka, and Nagoya metropolitan areas, railway congestion is a serious issue, with more than half of the commuters experiencing some degree of physical contact with other passengers. In regions where railways are the main mode of commuting, the spread of telecommuting in the aftermath of the pandemic deserves strong support from the standpoint of benefiting commuters and addressing transport issues. It is worth noting that the congestion levels on railways have no significant effect on telecommuting frequency, whereas the congestion levels on buses positively affect telecommuting frequency. The reasons for this need to be explored, given that public transport plays an important role in urban commuting.
In summary, from an employee’s perspective, commuting-related variables are key factors affecting employees’ post-pandemic telecommuting preferences. For Japan’s major metropolitan areas, with heavy commuting pressure and extreme dependence on rail transportation, the coming era of telecommuting seems to be a boon in solving these problems for commuters; however, as policy designers and providers, employers appear to take little account of employees’ commuting issues when deciding the level of telecommuting that they expect employees to implement after the pandemic. The gap between demand and supply further illustrates the need for companies to coordinate their employees’ needs when developing telecommuting policies in the post-pandemic era; meanwhile, from the standpoint of mitigating commuting problems, transportation departments must take advantage of this rapidly growing use of telecommuting as an effective tool for managing mobility and creating a more efficient traffic network.

4.3. Effects of Job-Related and Work-Environment Characteristics

In terms of industry sectors, the results show that IT professionals tend to telecommute at a high level after the pandemic, and their organizations expected them to do so. This is in line with several previous studies that show that employees in the IT industry are offered more telecommuting options and are more inclined to telecommute [18,19,49]. Among all industries, IT is the most favorable for telecommuting in terms of job content. Both employees and companies benefit from telecommuting. To anchor the continued growth of telecommuting in the post-pandemic era, governments and IT companies should be geared toward developing more secure telecommuting technologies and building more efficient telecommuting facilities.
Looking at industries other than IT, employees in the retail, real estate, education, and healthcare industries had no significant preference for frequent telecommuting. Since the nature of work in these industries is less conducive to telecommuting, employers are less likely to allow employees to telecommute frequently after the pandemic because of productivity and profitability concerns. Owing to the limitations of the questionnaire, the telecommuting flexibility variable was collected only from the SP survey. In general, work-environment characteristics have a significant impact on both expected and preferred telecommuting frequency. The results suggest that in the post-pandemic era, the flexibility of telecommuting options, the availability of space dedicated to telecommuting, and access to telecommuting facilities may encourage frequent telecommuting. To sustain the scale of pandemic-induced telecommuting, telecommuting-oriented work environments must be created and developed. Additionally, companies with telecommuting-friendly work environments are likely to offer opportunities for frequent telecommuting in the post-epidemic era. To expand telecommuting, a work environment that facilitates it is the key to bridging the gap between providers and users. Organizations should put more effort into providing better, more feasible, and more convenient telecommuting environments for employees.

4.4. Random Effects and Correlations

As shown in Table 4, the scale parameter introduced into the error term of the latent variable, indicating the preferred frequency, is significantly greater than one. This means that the unobserved heterogeneity exists between the latent variables indicating expected and preferred frequency. In addition, the significant standard deviation of common random term σ shows the correlation between them. The correlation coefficient ρ could be calculated as follows:
ρ = c o v u i + ε 1 i , u i + ε 2 i v a r u i + ε 1 i v a r u i + ε 2 i = v a r u i v a r u i + ε 1 i v a r u i + ε 2 i = σ 2 σ 2 + 1 σ 2 + σ 2
The calculated correlation coefficient is 0.44. Since a statistically significant correlation is identified between the error terms, estimating the expected and preferred frequency independently would ignore the difference between them.

5. Conclusions and Policy Implementations

The COVID-19 pandemic outbreak was a catalyst for the massive spread of telecommuting on a global scale. And as the widespread availability and maturity of modern information and communication technologies (ICT) and the benefits of telecommuting become more widely recognized, a dramatic shift has occurred in how organizations and employees view work and the role of the physical office. The spread of telecommuting in the metropolitan areas of Japan has reshaped the travel demands and priorities of employees. These changes have persisted in the post-pandemic era. This study attempts to capture the factors that affect telecommuting frequency from both employees’ and companies’ perspectives. Data were collected through an online questionnaire administered in the Tokyo, Osaka, and Nagoya metropolitan areas. An ordered probit model with random effects was used to estimate both expected and preferred telecommuting frequency among 1820 employees.
First, the results revealed a gap between expected and preferred telecommuting frequency. While younger female employees are more likely to telecommute after the pandemic, company policies hindered their plans to telecommute. In addition, the preferred telecommuting frequency is significantly associated with commuting characteristics, whereas employers rarely consider them when offering telecommuting options. Therefore, bridging the gap between expectations and preferences is a top priority in the telecommuting era. The findings also show that IT professionals are most likely to telecommute post-pandemic with organizational support. Finally, this study identifies work-environment characteristics as prime factors influencing both expected and preferred telecommuting frequency.
Our findings have several implications. For theoretical implications, this study deepens the understanding of the level of telecommuting in the post-pandemic era. Previous research on telecommuting frequency has mostly been conducted in a Western context, resulting in limited generalizability. Accelerated by the emergence of advanced telecommunications technologies and the COVID-19 pandemic, telecommuting has spread dramatically and will continue after the pandemic in Japan; therefore, it is necessary to understand what factors influence the frequency of telecommuting in the Japanese context to strengthen the literature and external validity. On a practical side, as the continued use of telecommuting in the post-pandemic era is a mainstream shift, it should be in line with broader societal trends. First of all, the conflict between family and work that women face in the labor market is a social problem that needs to be addressed urgently. Telecommuting is a good opportunity to solve this issue. In addition, younger workers increasingly expect a more flexible and liberated work environment, which telecommuting can provide. Therefore, employers and policymakers should undertake reforms to increase the participation of women and younger workers in the telecommuting market. For the transportation sector, the establishment of effective traffic networks and supply systems for the post-pandemic telecommuting era are essential. Regarding managerial implications, the nature of different industries must be considered when expanding telecommuting usage. For example, companies can adopt hybrid working arrangements that combine telecommuting and traditional office work. Governments should continue to develop safer telecommuting technologies and more efficient teleworking facilities. Organizations should be aware that a telecommuting-friendly work environment is key to bridging the gap between employees and employers in terms of telecommuting usage levels.
The novelty of this study lies in exploring both expectations and preferences regarding telecommuting frequency after the pandemic in three major metropolitan areas of Japan. This knowledge will contribute to a better working environment and can be drawn upon by other large metropolitan areas facing similar management and transportation issues. Despite the significance of our study, there are also some limitations and directions for future research worth noting. First, the data applied in this paper were collected at the beginning of the COVID-19 outbreak, and the analysis conducted is to provide a preliminary identification of the main factors that affect the frequency of telecommuting in a post-pandemic phase. As such, a post-pandemic survey is essential to provide data to support future research for a more accurate and timely estimate of telecommuting adoption levels. Second, previous research has shown that the telecommuting decision process is more of a medium- to long-term plan [50,51]; however, due to the limitations of our survey, the investigation of telecommuting frequency in this study is in a short-term scope, which may also lead to bias. For this reason, future studies could estimate the factors affecting telecommuting frequency by conducting a long-term trajectory survey of telecommuting behavior. Finally, although this study examined the frequency of telecommuting from the employer’s perspective, it was analyzed indirectly through the expected frequency of employees. Therefore, future research efforts can be directed toward analyzing the expected telecommuting frequency from the employer’s perspective by using data collected from the telecommuting questionnaire that is directly responded to by employers.

Author Contributions

J.L.: Conceptualization, Methodology, Software, Validation, and Writing—original draft. T.M. (Tomio Miwa): Conceptualization, Investigation, Methodology, and Supervision. T.M. (Takayuki Morikawa): Conceptualization, Writing—review and editing. All authors have read and agreed to the published version of the manuscript.

Funding

This research was funded by Japan Society for the Promotion of Science KAKENHI (Grant Number: 19H02260) and Nagoya University Interdisciplinary Frontier Fellowship (Grant Number: JPMJFS2120).

Institutional Review Board Statement

This study did not require ethical approval.

Data Availability Statement

Not applicable.

Conflicts of Interest

The authors declare that they have no known competing financial interests or personal relationships that could have appeared to influence the work reported in this paper.

References

  1. US Department of Transportation. National Household Travel Survet: User’s Guide. Volume 2001. 2004. Available online: https://nhts.ornl.gov/2001/usersguide/UsersGuide.pdf (accessed on 3 December 2022).
  2. US Department of Transportation. National Household Travel Survet: User’s Guide. 2017. Available online: https://nhts.ornl.gov/assets/2017UsersGuide.pdf (accessed on 3 December 2022).
  3. De Vos, J. The effect of COVID-19 and subsequent social distancing on travel behavior. Transp. Res. Interdiscip. Perspect. 2020, 5, 100121. [Google Scholar] [CrossRef] [PubMed]
  4. Nguyen, M.H.; Armoogum, J. Perception and preference for home-based telework in the Covid-19 era: A gender-based analysis in Hanoi, Vietnam. Sustainability 2021, 13, 3179. [Google Scholar] [CrossRef]
  5. Beck, M.J.; Hensher, D.A.; Wei, E. Slowly coming out of COVID-19 restrictions in Australia: Implications for working from home and commuting trips by car and public transport. J. Transp. Geogr. 2020, 88, 102846. [Google Scholar] [CrossRef] [PubMed]
  6. Hiselius, L.W.; Arnfalk, P. When the impossible becomes possible: COVID-19’s impact on work and travel patterns in Swedish public agencies. Eur. Transp. Res. Rev. 2021, 13, 17. [Google Scholar] [CrossRef]
  7. de Haas, M.; Faber, R.; Hamersma, M. How COVID-19 and the Dutch ‘intelligent lockdown’ change activities, work and travel behaviour: Evidence from longitudinal data in the Netherlands. Transp. Res. Interdiscip. Perspect. 2020, 6, 100150. [Google Scholar] [CrossRef]
  8. Barbour, N.; Menon, N.; Mannering, F. A statistical assessment of work-from-home participation during different stages of the COVID-19 pandemic. Transp. Res. Interdiscip. Perspect. 2021, 11, 100441. [Google Scholar] [CrossRef] [PubMed]
  9. Ceccato, R.; Baldassa, A.; Rossi, R.; Gastaldi, M. Potential long-term effects of Covid-19 on telecommuting and environment: An Italian case-study. Transp. Res. D Transp. Environ. 2022, 109, 103401. [Google Scholar] [CrossRef]
  10. Hensher, D.A.; Balbontin, C.; Beck, M.J.; Wei, E. The impact of working from home on modal commuting choice response during COVID-19: Implications for two metropolitan areas in Australia. Transp. Res. Part A Policy Pract. 2022, 155, 179–201. [Google Scholar] [CrossRef]
  11. Mouratidis, K.; Papagiannakis, A. COVID-19, internet, and mobility: The rise of telework, telehealth, e-learning, and e-shopping. Sustain. Cities Soc. 2021, 74, 103182. [Google Scholar] [CrossRef]
  12. Schur, L.A.; Ameri, M.; Kruse, D. Telework after COVID: A ‘silver lining’ for workers with disabilities? J. Occup. Rehabil. 2020, 30, 521–536. [Google Scholar] [CrossRef]
  13. Aguilera, A.; Lethiais, V.; Rallet, A.; Proulhac, L. Home-based telework in France: Characteristics, barriers and perspectives. Transp. Res. A 2016, 92, 1–11. [Google Scholar] [CrossRef]
  14. Asgari, H.; Gupta, R.; Jin, X. Impacts of COVID-19 on future preferences toward telework. Transp. Res. Rec. 2023, 2677, 611–628. [Google Scholar] [CrossRef]
  15. Bernardino, A.; Ben-Akiva, M.; Salomon, I. Stated preference approach to modeling the adoption of telecommuting. Transp. Res. Rec. 1993, 1413, 22–30. [Google Scholar]
  16. Drucker, J.; Khattak, A.J. Propensity to work from home: Modeling results from the 1995 nationwide personal transportation survey. Transp. Res. Rec. 2000, 1706, 108–117. [Google Scholar] [CrossRef]
  17. Sullivan, M.A.; Mahmassani, H.S.; Yen, J.-R. Choice model of employee participation in telecommuting under a cost-neutral scenario. Transp. Res. Rec. 1993, 1413, 42–48. [Google Scholar]
  18. Pouri, Y.D.; Bhat, C.R. On modeling choice and frequency of home-based telecommuting. Transp. Res. Rec. 2003, 1858, 55–60. [Google Scholar] [CrossRef]
  19. Sener, I.N.; Bhat, C.R. A copula-based sample selection model of telecommuting choice and frequency. Environ. Plan. A 2011, 43, 126–145. [Google Scholar] [CrossRef]
  20. Tang, W.; Mokhtarian, P.L.; Handy, S. The impact of the residential built environment on work at home adoption frequency: An example from Northern California. J. Transp. Land Use 2011, 4, 3–22. [Google Scholar] [CrossRef]
  21. Singh, P.; Paleti, R.; Jenkins, S.; Bhat, C.R. On modeling telecommuting behavior: Option, choice, and frequency. Transportation 2013, 40, 373–396. [Google Scholar] [CrossRef]
  22. Asgari, H.; Jin, X.; Mohseni, A. Choice, frequency, and engagement. Transp. Res. Rec. 2014, 2413, 101–109. [Google Scholar] [CrossRef]
  23. Shabanpour, R.; Golshani, N.; Tayarani, M.; Auld, J.; Mohammadian, A. Analysis of telecommuting behavior and impacts on travel demand and the environment. Transp. Res. D 2018, 62, 563–576. [Google Scholar] [CrossRef]
  24. Shamshiripour, A.; Rahimi, E.; Shabanpour, R.; Mohammadian, A. How is COVID-19 reshaping activity-travel behavior? Evidence from a comprehensive survey in Chicago. Transp. Res. Interdiscip. Perspect. 2020, 7, 100216. [Google Scholar] [CrossRef] [PubMed]
  25. Zhang, J.; Hayashi, Y.; Frank, L.D. COVID-19 and transport: Findings from a world-wide expert survey. Transp. Policy 2021, 103, 68–85. [Google Scholar] [CrossRef] [PubMed]
  26. EuroFound. Living, Working and COVID-19. Publications Office of the European Union. 2020. Available online: http://eurofound.link/ef20059 (accessed on 17 August 2023).
  27. Sun, L.; Liu, T.; Wang, W. Working from Home in Urban China during the COVID-19 Pandemic: Assemblages of Work-Family Interference. Work Employ. Soc. 2023, 37, 157–175. [Google Scholar] [CrossRef] [PubMed]
  28. Ma, L.; Zheng, Y.; Wei, Y. The double-edged sword effect of telecommuting on employees’ work engagement: Evidence from China during COVID-19. Front. Psychol. 2023, 14, 1110108. [Google Scholar] [CrossRef] [PubMed]
  29. Ha, T. COVID-19 and remote work inequality: Evidence from South Korea. Labor Hist. 2022, 63, 406–420. [Google Scholar] [CrossRef]
  30. Anwari, N.; Tawkir Ahmed, M.; Rakibul Islam, M.; Hadiuzzaman, M.; Amin, S. Exploring the travel behavior changes caused by the COVID-19 crisis: A case study for a developing country. Transp. Res. Interdiscip. Perspect. 2021, 9, 100334. [Google Scholar] [CrossRef]
  31. Bhaduri, E.; Manoj, B.S.; Wadud, Z.; Goswami, A.K.; Choudhury, C.F. Modelling the effects of COVID-19 on travel mode choice behaviour in India. Transp. Res. Interdiscip. Perspect. 2020, 8, 100273. [Google Scholar] [CrossRef]
  32. Dandapat, S.; Bhattacharyya, K.; Annam, S.K.; Saysardar, K.; Maitra, B. Policy interventions for COVID 19 and their impact on activity and travel in India: Present trends and future implications. SSRN Electron. J. 2020. [Google Scholar] [CrossRef]
  33. Ivanova, M.; Ivanov, I.K.; Ivanov, S. Travel behaviour after the pandemic: The case of Bulgaria. Anatolia 2021, 32, 1–11. [Google Scholar] [CrossRef]
  34. Nguyen, M.H. Factors influencing home-based telework in Hanoi (Vietnam) during and after the COVID-19 era. Transportation 2021, 48, 3207–3238. [Google Scholar] [CrossRef]
  35. Nayak, S.; Pandit, D. Potential of telecommuting for different employees in the Indian context beyond COVID-19 lockdown. Transp. Policy 2021, 111, 98–110. [Google Scholar] [CrossRef]
  36. Liang, J.; Miwa, T.; Wang, J.; Morikawa, T. Impact of telecommuting on Japanese Citizen’s travel, activities, and residential locations: Experiences and future expectations under COVID-19 pandemic. Asian Transp. Stud. 2023, 9, 100105. [Google Scholar] [CrossRef]
  37. Hopkins, J.; Bardoel, A. The Future Is Hybrid: How Organisations Are Designing and Supporting Sustainable Hybrid Work Models in Post-Pandemic Australia. Sustainabiliy 2023, 15, 3086. [Google Scholar] [CrossRef]
  38. Singh, J.; Steele, K.; Singh, L. Combining the Best of Online and Face-to-Face Learning: Hybrid and Blended Learning Approach for COVID-19, Post Vaccine, & Post-Pandemic World. J. Educ. Technol. Syst. 2021, 50, 140–171. [Google Scholar] [CrossRef]
  39. Smite, D.; Moe, N.B.; Hildrum, J.; Huerta, J.G.; Mendez, D. Work-from-home is here to stay: Call for flexibility in post-pandemic work policies. J. Syst. Softw. 2023, 195, 111552. [Google Scholar] [CrossRef] [PubMed]
  40. Peters, P.; Tijdens, K.G.; Wetzels, C. Employees’ opportunities, preferences, and practices in telecommuting adoption. Inf. Manag. 2004, 41, 469–482. [Google Scholar] [CrossRef]
  41. Hajal, G.E. Teleworking and the jobs of tomorrow. Res. Hosp. Manag. 2022, 12, 21–27. [Google Scholar] [CrossRef]
  42. Mohammadi, M.; Rahimi, E.; Davatgari, A.; Javadinasr, M.; Mohammadian, A.; Bhagat-Conway, M.W.; Salon, D.; Derrible, S.; Pendyala, R.M.; Khoeini, S. Examining the persistence of telecommuting after the COVID-19 pandemic. Transp. Lett. 2022, 15, 608–621. [Google Scholar] [CrossRef]
  43. Chafi, M.B.; Hultberg, A.; Yams, N.B. Post-pandemic office work: Perceived challenges and opportunities for a sustainable work environment. Sustainability 2022, 14, 294. [Google Scholar] [CrossRef]
  44. McKelvey, R.D.; Zavoina, W. A statistical model for the analysis of ordinal level dependent variables. J. Math. Sociol. 1975, 4, 103–120. [Google Scholar] [CrossRef]
  45. Walls, M.; Safirova, E.; Jiang, Y. What drives telecommuting? Relative impact of worker demographics, employer characteristics, and job types. Transp. Res. Rec. 2007, 2010, 111–120. [Google Scholar] [CrossRef]
  46. Sato, A. Telework and its effects in Japan. In Telework in the 21st Century; Edward Elgar Publishing: Northampton, MA, USA, 2019; pp. 76–127. [Google Scholar] [CrossRef]
  47. Calastri, C.; Hess, S.; Daly, A.; Carrasco, J.A. Does the social context help with understanding and predicting the choice of activity type and duration? An application of the Multiple Discrete-Continuous Nested Extreme Value model to activity diary data. Transp. Res. A 2017, 104, 1–20. [Google Scholar] [CrossRef]
  48. Mokhtarian, P.L.; Meenakshisundaram, R. Patterns of telecommuting engagement and frequency: A cluster analysis of telecenter users. Prometheus 2002, 20, 21–37. [Google Scholar] [CrossRef]
  49. Okubo, T. Telework in the spread of COVID-19. Inf. Econ. Policy 2022, 6, 100987. [Google Scholar] [CrossRef]
  50. Asgari, H.; Jin, X. An evaluation of part-day telecommute impacts on work trip departure times. Travel Behav. Soc. 2018, 12, 84–92. [Google Scholar] [CrossRef]
  51. Paleti, R.; Vukovic, I. Telecommuting and its impact on activity-time use patterns of dual-earner households. Transp. Res. Rec. 2017, 2658, 17–25. [Google Scholar] [CrossRef]
Figure 1. Example of a hypothesized scenario in SP survey (factor levels are shown underlined).
Sustainability 15 12611 g001
Figure 2. Flow Chart of Data Collection Process.
Sustainability 15 12611 g002
Figure 3. Expected and preferred telecommuting frequency of the sample (n = 1820).
Sustainability 15 12611 g003
Table 1. Factors and levels set in the experiment design.
AspectsFactorsLevel 1Level 2
Commuting conditionCongestion level on bus or on railwaySame level as before pandemicSufficient distance from other passengers (1–2 m and more)
Telecommuting environment conditionHighly secure Internet services and web conferencing systems at homeProvided free of charge by the companyNot provided by the company
(this factor is not shown)
Flexibility in telecommutingManaged by the companyNot managed by the company
Availability of free satellite officeProvided by the company near a station closest to your homeNot provided by the company
Table 2. Age distribution of respondents compared with census.
Social DemographicsSampleCensus
Age:
25–299.6%10.8%
30–3411.5%11.7%
35–3912.8%12.5%
40–4412.5%12.4%
45–4917.1%16.0%
50–5413.3%12.8%
55–5911.4%12%
>6011.6%11.8%
Table 3. Descriptive statistics of the variables used in the model estimation.
VariablesDescription% or MeanStd. Dev.
Person demographics
Gender: female1: if respondent is male; 0: o/w30.49%n/a
Age: younger1: if respondent is less than 29 years old; 0: o/w8.19%n/a
Age: senior1: if respondent is more than 60 years old; 0: o/w9.62%n/a
Household characteristics
Number of preschoolersNumber of children aged ≤ 60.170.47
Income1: if the annual household income is more than 8 million yen; 0: o/w41.43%n/a
Car ownership1: if the household owns a car; 0: o/w61.15%n/a
Commuting characteristics
Commuting timeAverage time spend on commuting per day (mins)52.3624.18
Commuting costout-of-pocket commuting cost per day (yen)25.26145.40
Parking costout-of-pocket parking cost per month (yen)6736.5411,577.28
Commuting mode: railway1: if the main mode of commuting is by railway; 0: o/w87.53%n/a
Commuting mode: bus1: if the main mode of commuting is by bus; 0: o/w13.63%n/a
Congestion level on bus1: if congestion level on the railway is over 100%; 0: o/w18.79%n/a
Job-related characteristics
IS: IT1: if the respondent is in IT industry; 0: o/w19.45%n/a
IS: Retail1: if the respondent is in wholesale and retail trade industry; 0: o/w12.64%n/a
IS: Estate1: if the respondent is in real estate industry; 0: o/w3.90%n/a
IS: Education1: if the respondent is in education and learning support industry; 0: o/w2.47%n/a
IS: Medical care and welfare1: if the respondent is in medical care and welfare industry; 0: o/w1.65%n/a
Work-environment characteristics
Telecommuting flexibility1: if flexibility in telecommuting is not managed by the company; 0: o/wSP datan/a
Telecommuting facilities1: if highly secure Internet services and web conferencing systems at home are provided free of charge by the company; 0: o/wSP datan/a
Dedicated telecommuting space1: if space is available at home to concentrate on telecommuting; 0: o/wSP datan/a
Mobile office availability1: if free satellite office provided by the company is near home; 0: o/wSP datan/a
Note: IS refers to the industrial sector. The congestion level of the railway/bus is calculated by dividing the number of passengers by the passenger capacity, and a congestion level of 100% implies a certain level of physical contact among passengers.
Table 4. Bivariate ordered probit model estimation results.
ExpectationsPreference
Explanatory VariablesEstimatest-ValueEstimatest-Value
Constant--1.927.70 ***
Person demographics
Gender: female−0.198−2.63 ***0.4775.34 ***
Age: younger0.01190.0740.2361.71 *
Age: senior−0.177−1.2−0.296−2.37 **
Household characteristics
Number of preschoolers0.242.57 ***0.1271.59 *
Income0.2282.46 ***−0.0110−0.14
Car ownership−0.154−1.71 *−0.0186−0.22
Commuting characteristics
Commuting time0.002081.060.003602.14 **
Commuting cost−0.0168−0.5380.07242.57 ***
Commuting mode: railway0.1621.190.1981.69 *
Commuting mode: bus−0.232−1.30−0.182−1.50 *
Congestion level on bus0.2422.44 ***0.2732.60 ***
Job-related characteristics
(Base: other IS)
IS: IT0.4834.25 ***0.5595.61 ***
IS: Retail−0.218−1.91 **−0.0269−0.24
IS: Estate−0.497−2.16 **−0.101−0.54
IS: Education−0.621−2.14 **−0.250−1.08
IS: Medical care and welfare−1.470−3.52 ***0.1610.56
Work-environment characteristics
Telecommuting facilities0.1961.93 **0.1111.75 *
Dedicated telecommuting space0.5255.76 ***0.4435.95 ***
Mobile office availability0.7875.92 ***−0.0166−0.26
Thresholds
θ 1 1.21 (5.41 ***)
θ 2 1.80 (49.51 ***)
θ 3 2.60 (60.39 ***)
θ 4 3.33 (84.90 ***)
θ 5 2.63 (75.5 ***)
Correlation effects σ 3.95 (107.63 ***)
Scale parameter σ 1.21 (2.63 ***)
Goodness of fit
No. of observations1820
Log-likelihood at convergence−5567.652
Log-likelihood at zero−8232.829
Rho-squared0.324
Adjusted Rho-squared0.316
*** p < 0.01, ** p < 0.05, * p < 0.1. Note: IS refers to industry sector and the scale parameters σ are significantly different from 1 (t = 2.14; p < 0.05).
Disclaimer/Publisher’s Note: The statements, opinions and data contained in all publications are solely those of the individual author(s) and contributor(s) and not of MDPI and/or the editor(s). MDPI and/or the editor(s) disclaim responsibility for any injury to people or property resulting from any ideas, methods, instructions or products referred to in the content.

