Article

Study on the Spatial and Temporal Evolution of Ecosystem Service Values and Driving Mechanism in the Yan River Basin from 1990 to 2020

1
College of Urban and Environmental Sciences, Northwest University, Xi’an 710127, China
2
Historical Geography Research Center, Institute of Silk Road Studies, Northwest University, Xi’an 710069, China
*
Author to whom correspondence should be addressed.
Sustainability 2023, 15(16), 12550; https://doi.org/10.3390/su151612550
Submission received: 13 July 2023 / Revised: 7 August 2023 / Accepted: 17 August 2023 / Published: 18 August 2023

Abstract

:
Ecological and environmental degradation are among the major challenges facing humanity today. The analysis of ecosystem service value assessments can therefore serve as a means to guide ecosystem restoration, as well as provide indications for sustainable land use and land management decisions. The present study examines changes in land use and the associated ecosystem service values in the Yan River Basin in China for the period of 1990–2020. Based on high-resolution Landsat satellite data, we obtained detailed land type distribution data for the basin, allowing the analysis of the internal structure and the degree of influence of the land use by using information entropy and elasticity coefficient. We also explored the spatiotemporal differentiation of ESVs by applying the method of equivalent factors and hotspot analysis. Finally, we identified possible drivers for development patterns observed in the watershed using geodetector models. During the study period, the area of arable land dropped continuously, while the scope of forest land, grassland, and construction land increased. The land type layout developed in the direction of reduced uniformity. ESVs measured in monetary terms first rose and later fell, but nevertheless increased by 1.152 billion yuan overall. The decrease was mainly due to the accelerated urbanization construction in the later stage. Spatially, ESV distribution coincided with the land-use pattern, showing a growing pattern from north to south. The changes were due not to the role of a single factor but the joint interactions between multiple factors such as human activities, natural factors, and landscape patterns. The results can provide a basis for constructive suggestions to connect and promote the basin’s natural and socio-economic surroundings, and also reflect the effectiveness of the policy of systematically stopping cultivation and planting trees and grass on stunted cultivated land.

1. Introduction

Ecosystem services represent ecological benefits and services humans can obtain through natural conditions and values [1]. Ecosystem structure, performance, and processes provide these benefits and services to meet various human needs for life maintenance, health status, and welfare [2]. Ecological, human, economic, and other factors can affect the generation and development of ecosystem services [3]. An ESV assessment is a way to measure the ecosystem value in terms of money and perform calculations [4]. It can show changes in ecosystem services [5]. The Millennium Ecosystem Assessment showed that the change in terms of land use represents a significant driver of changes in land ecosystem service values [6], while improving our understanding of land use impacts constitutes a key element in climate mitigation efforts. The proposal by American ecologist Constanza et al. [7] in 1997 to calculate land-use values based on size by land types has generated the subsequent emergence of a research field on accounting for ESVs from a land utilization perspective.
In China, scholars have widely used the equivalent factor approach to study ESVs. Equivalent factors in different regions may affect the calculation of ESVs with the changes in surface cover types [8], regional resources, biodiversity, and distribution of ecological system types [9,10]. Scholars such as Ouyang Zhiyun accounted for terrestrial ecosystem service functions based on Constanza’s calculations [11], and Xie Gaodi [12] developed the “Chinese terrestrial ecosystem service value equivalent factor table” using biomass parameters. This table has been continuously optimized and improved and has been adopted and promoted by more scholars. Current Chinese ESV research is conducted with a variety of aims and at different scales, including national [13,14,15], watershed [16,17,18], urban cluster [19,20,21], province [22,23], city [24,25], county [26,27] scales, or with focus on a particular region [28]. These studies mainly discuss the evolution characteristics and patterns of ESVs and provide base cases and experience references for subsequent research on related topics and promote the continuous and in-depth development of regional sustainability research.
The present study examines ESV and land-use changes in the Yan River Basin. The basin belongs to the Yellow River’s middle reaches. Over the years, soil erosion and sanding have created hilly and gully areas where human activities have had a more significant effect. Consequently, it is one of the areas with the most severe soil erosion in the Loess Plateau region, which is one of the reasons why the Yan River Basin was chosen as the first area for the implementation of the national afforestation project to reverse and mitigate further land degradation [29]. With the gradual improvement of Chinese ecological protection and development policies, the government issued documents related to ecological protection, such as the Outline of the National Ecologically Vulnerable Areas Protection Plan in 2008 and the National Main Functional Areas Plan in 2010. Related studies, such as a study by Qiulei Ji [30], identified critical land class nodes and transfer types controlling the land system utilizing the GEE platform and analyzed the characteristics of the Yellow River Basin’s land system over time. Zaixing Zhi [31] used a biomass factor correction approach to assess ESVs in northern Shaanxi between 1985 and 2013. He also investigated land-use change impact on ESVs. Xie Mingyang and Jiao Chunmeng [32] invoked the temporal information entropy model to analyze the recurrence pattern of ESVs in Yan’an City from 1990 to 2020. They explored the study object’s spatial and temporal change information at the image element scale. Standard methods to analyze the factors affecting ESVs include establishing regression models [33], panel quantile models [21], and geodetector models. Among them, geodetector models can not only spatially quantitatively detect the factor drivers, but also calculate the interaction between the two factors [34], which is of great advantage in the research related to the influencing factors, and its application is becoming more and more widespread.
From the initial review of earlier research that we conducted to prepare the current study, it appears that scholars establishing ESVs have mainly focused on administrative districts such as Yan’an City rather than the Yan River Basin. The research on the Yan River Basin mainly focuses on the evolution of water and sand [35,36,37,38], soil erosion [39], land-use change [40,41], runoff change [42], and other natural aspects. Watersheds have obvious geographic boundaries, and taking the watershed as the research object can not only combine the natural and anthropogenic factors more organically and rationally, but also simplify and eliminate the description of the actual complexity as much as possible. The study in this paper involves ESV evolution characteristics. It combines natural and anthropogenic factors to explore the degree of influence on ESV disturbance from the perspective of watersheds, which can partly compensate for lack of data from previous studies. In our research, we utilized the information structure entropy system to evaluate land-use change patterns. We also used the equivalent factor method to evaluate the ESVs. Firstly, we analyzed ESV evolution characteristics, then explored the connection between land-use patterns and ecosystems, and finally, with the help of geodetectors, pointed to likely driving factors underlying the spatial differentiation of ESVs in the watershed. The present study can provide directions and suggestions for the future development of the Yan River Basin and present research cases for the current Yellow River Basin governance.

2. Materials and Methods
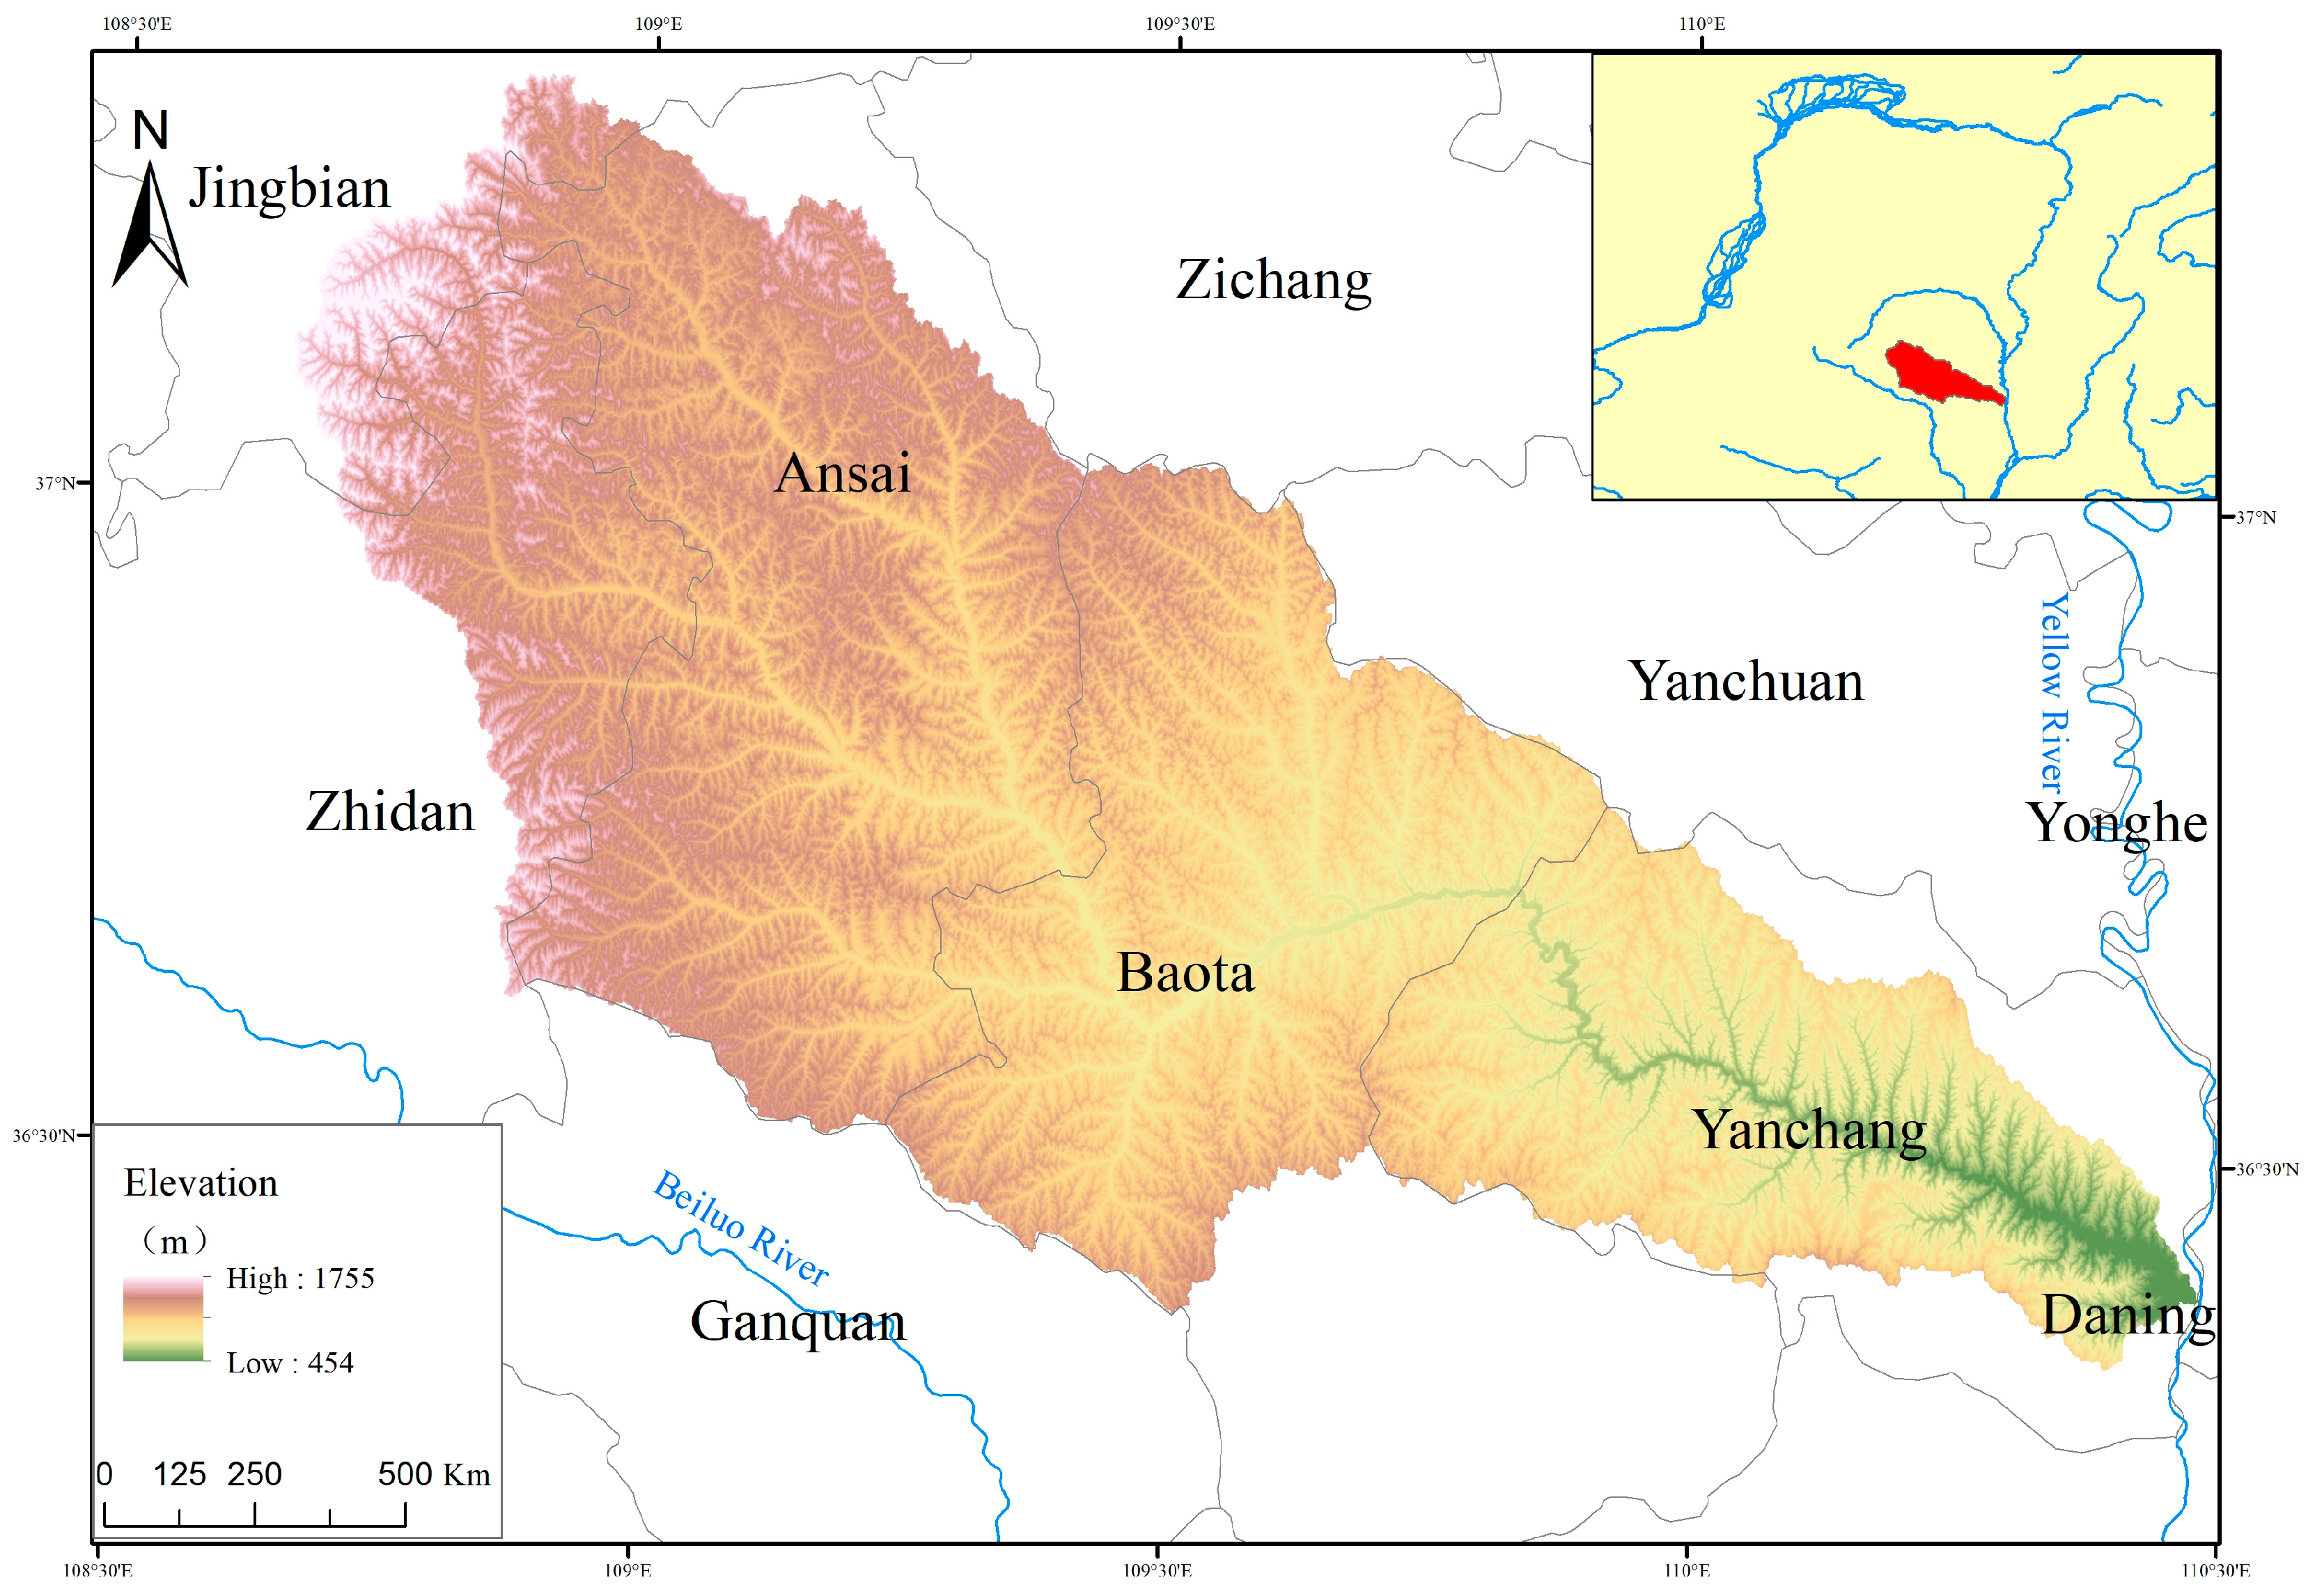
2.1. Study Area

The Yan River Basin belongs to the intermediate region of the Loess Plateau. It is about 7642 km2 in size and starts in Tianciwan Township, Jingbian County, Yulin City. Additionally, it covers Jingbian County, Zhidan County, Ansai District, Baota District, and Yanchang County from the northwest to the southeast. The Yan River Basin’s geographical location is 36°23′–37°17′ north latitude and 108°45′–110°28′ east longitude. The area’s average elevation is about 1214 m above sea level, and altitudes gradually increase from southeast to northwest, with considerable topographical variation (Figure 1). This location has a warm temperate continental semi-arid climate. Its annual mean temperature is 9 °C, and its annual mean rainfall is 500 mm. From the northwest to the southeast, the climatic gradient changes significantly, and vegetation is distinctly zonal in its presentation on the surface, basically grassland zones, forested grassland zones, and forest zones [43]. The region has the highest yellow loam soil, slopes greater than 15°, and a dominant hilly and gully landscape [44]. Affected by the original natural and early urbanization factors in the 1990s, Yan River Basin’s ecosystems had been significantly disturbed, with a sharp decrease in vegetation cover, water conservation capacity, and infertile soils [45]. Since 1999, the state has promulgated sustainable ecological construction regulations to hinder the continued deterioration of the natural ecosystem. Following local conditions, they include the planned and systematic vegetation restoration on arable land that has a poor ecological environment and low food production [46,47].

2.2. Data Sources and Construction of the Driving Index System

The land-use data (1990, 2000, 2010, and 2020) were provided by the Resource and Environment Data Center of the Chinese Academy of Sciences (http://www.resdc.cn/) (accessed on 3 January 2023) with a resolution of 30 m × 30 m. The data are based on Landsat satellite data in the Google Earth Engine cloud computing platform to complete the long time series of surface cover detection and finally generate the global 30 m fine surface cover dynamic monitoring data. The Shaanxi Provincial Statistical Yearbook and the National Compilation of Agricultural Product Prices provide grain production and price data. Eleven indicators in four categories (see Table 1) were selected for evaluation as likely impact factors. The selection of indicators was based on previous research [48,49], taking into account that ESVs are subject to the joint influence of both natural and human factors.

2.3. Research Methodology

2.3.1. Land-Use Structural Information Entropy

Information entropy is a measure in systems theory of the degree of stability and uncertainty of information contained in a dissipative structured system. As the adopted ESV calculation methods are derived according to land use, structural information entropy could better demonstrate the related regularity of the overall land use and the uniformity of the layout of the Yan River Basin [52].
P i = C i C = C i i = 1 n P i ,             i = 1 n P i = 1 ,
H = i = 1 n P i ln i = i = 1 n ( C i i = 1 n C i ) ln ( C i i = 1 n C i ) ,
where H represents the information entropy, C i stands for the i land class, and P i is the land area ratio. H represents the land function class ratio and layout area distribution balance. The higher the entropy value, the more land function classes, the larger the average land-class area, the smaller the regularity, and the greater the layout balance. The lower the entropy value, the more significant the land-class area gap, the greater the regularity, and the smaller the layout equilibrium [53].
J = H H m a x = H ln n = ( P i ln P i ) ln n ,
I = 1 J ,
where J indicates the balance of land utilized space regional component units in the watershed, and I represents the dominance degree, showing the dominant degree of some land utilized space regional component units over the other land types in the region.

2.3.2. ESV Accounting

ESV of an equivalent factor is the annual economic value of food crops in a standard farmland unit [12,50].
W a = 1 7 × i = 1 n m i × p i × q i M ,
where W a [54] is the number of ESVs of a standard equivalent factor in an area, i stands for the food crop kind, m i represents the i th food crop’s sown area, p i stands for the ith food crop’s average price, q i represents the ith food crop’s yield in a standard unit, M stands for n food crops, and 1/7 [55] means that the ESVs given by natural ecosystems under the condition of no human investment occupies 1/7 of the ESVs brought by food output services as for the farmland in a standard unit.
In the present study, by investigating the Yulin Statistical Yearbook, the Yan’an Statistical Yearbook, and the China Agricultural Product Price Compendium, we obtained the base data of the planted area, harvested quantity, and average sale values of four critical economic grains—wheat, corn, rice, and soybeans—in the region. We deduced the standard equivalent factor’s ESVs of 1280.53 yuan/hm2 from 1990 to 2020. Based on Xie Gaodi’s [13] table of equivalent ecosystem service values per unit area, by setting the value of construction land to 0 and the corresponding land-use types of arable land, desert, river, and forest to arable land, unused land, water area, and forest land, we obtained the ESV coefficients for the study area (Table 2).
The formula for calculating the total value is as follows [56]:
E S V = k = 1 n A k × V C K ,
where A k stands for the area of the k th land use type in the study, and V C K is the ESVs’ equivalent coefficient per unit area.

2.3.3. Elasticity Coefficient

Elasticity is the percentage changes to which one variable changes in response to a change in another variable [57]. In the present study, the elasticity coefficient was used to measure the percentage change in ESVs brought by land use in Yan River Basin without considering the time lag.
J = E S V E S V a C C ,
where J is the elasticity of the area under study, C represents total area converted by land utilized space regional component unit, E S V is the trend of changes obtained by a dynamic analysis of the ecosystem service values during the study period, C is the total area, and E S V a is the services and economic benefits generated by the natural ecosystems at the beginning of the period. When the elasticity coefficient of the land use type is greater, the effect of that land use type on total ESVs is also more pronounced [57].

2.4. Geographical Detectors

Geodetectors represent some related statistical methods that can expose the characteristics of spatial heterogeneity as well as the implicit driving forces by finding the likely driving forces of independent factors on dependent variables, which are shown as q value fluctuates at [0,1], with larger values showing more explanatory power [35]. With the help of several factors, our analysis found the main factors that affect the ways in which ecosystem service values vary across space in Yan River Basin. Furthermore, interaction detection helped to identify related interactions between multiple factors and their explanatory power changes.
q = 1 h = 1 L N h σ h 2 N σ 2 ,
where N h is the number of cells in layer h , N is the number of cells in the whole area, σ h 2 is the Y-value variance of layer h , and σ 2 is the Y-value variance of the whole area.

3. Results

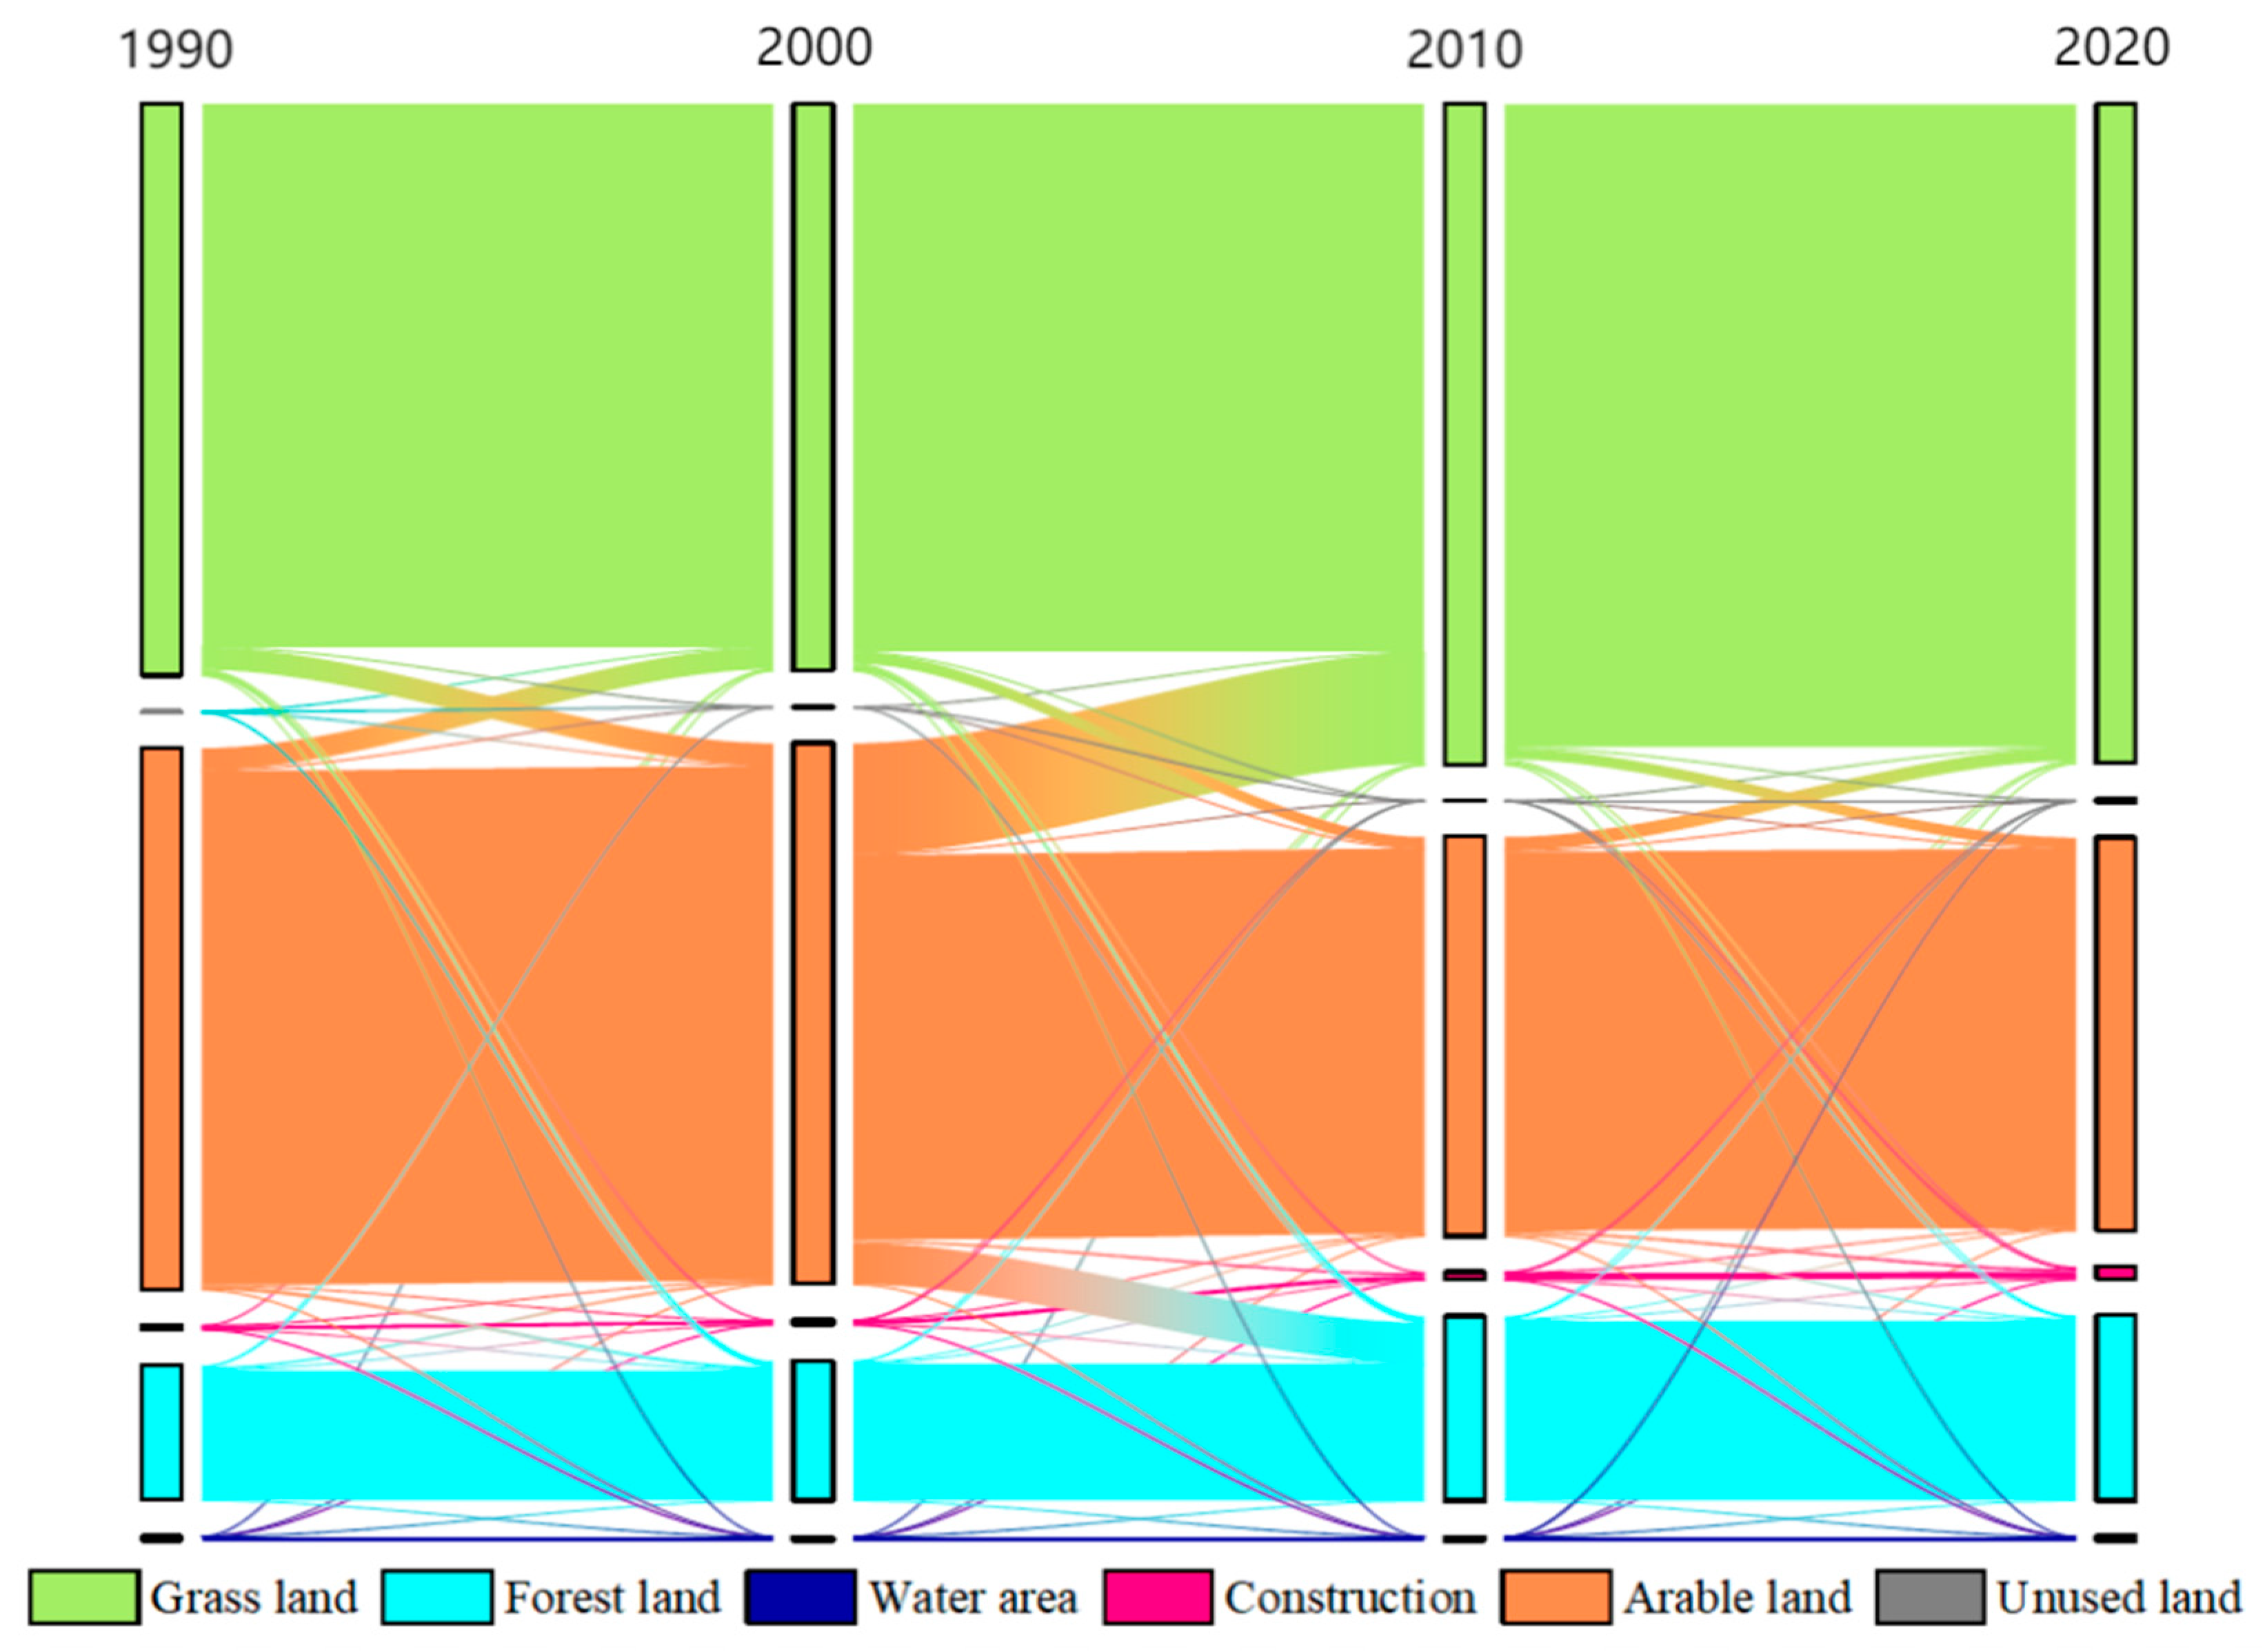
3.1. Changes in Land-Use Structure Characteristics

Both equilibrium degree and information entropy were calculated, in addition to the degree of dominance of the land-use structure using the primary data (Table 3), indicating that the land-use structure had more obvious variation characteristics. From such perspective, an increasing trend was observed from 1990 to 2020, while for the dominance degree, it was the opposite, indicating that during this period, the equilibrium degree of land categories increased, the dominance degree of a single category decreased, the area difference of all types decreased, and the layout and structure of land use changed irregularly.
Arable land areas, grassland, and water area declined slowly from 1990 to 2000, with the decline in water area reaching 6.7%. Forest land and construction land gradually expanded, with the growth rate of construction land reaching 13.3%, and its increased land area mainly came from arable land and grassland (Figure 2). Forest land areas, grassland, and construction land increased significantly from 2000 to 2010, among which the grassland area increased by 571.9 km2, and the expansion rate reached 74.8%; the addition used to be arable land. Areas for arable land, water area, in addition to unused land, all decreased, among which the decrease rate that occurred in unused land was 53.8% and mainly turned out to be related to grassland and forest land. Arable land areas, grassland, forest land, water area, construction land, and unused land expanded from 2010 to 2020, among which the expansion rate for construction land reached 62.7%, as a result of the transfer of forest land and grassland. However, the overall increase and decrease were less apparent in forest land and grassland. Thus, this indicated that the increase in related information entropy structures from 1990 to 2020 happened because of the grassland expansion, forest land, construction land, and the tightening of the arable land area.

3.2. The ESV Evolution Characteristics

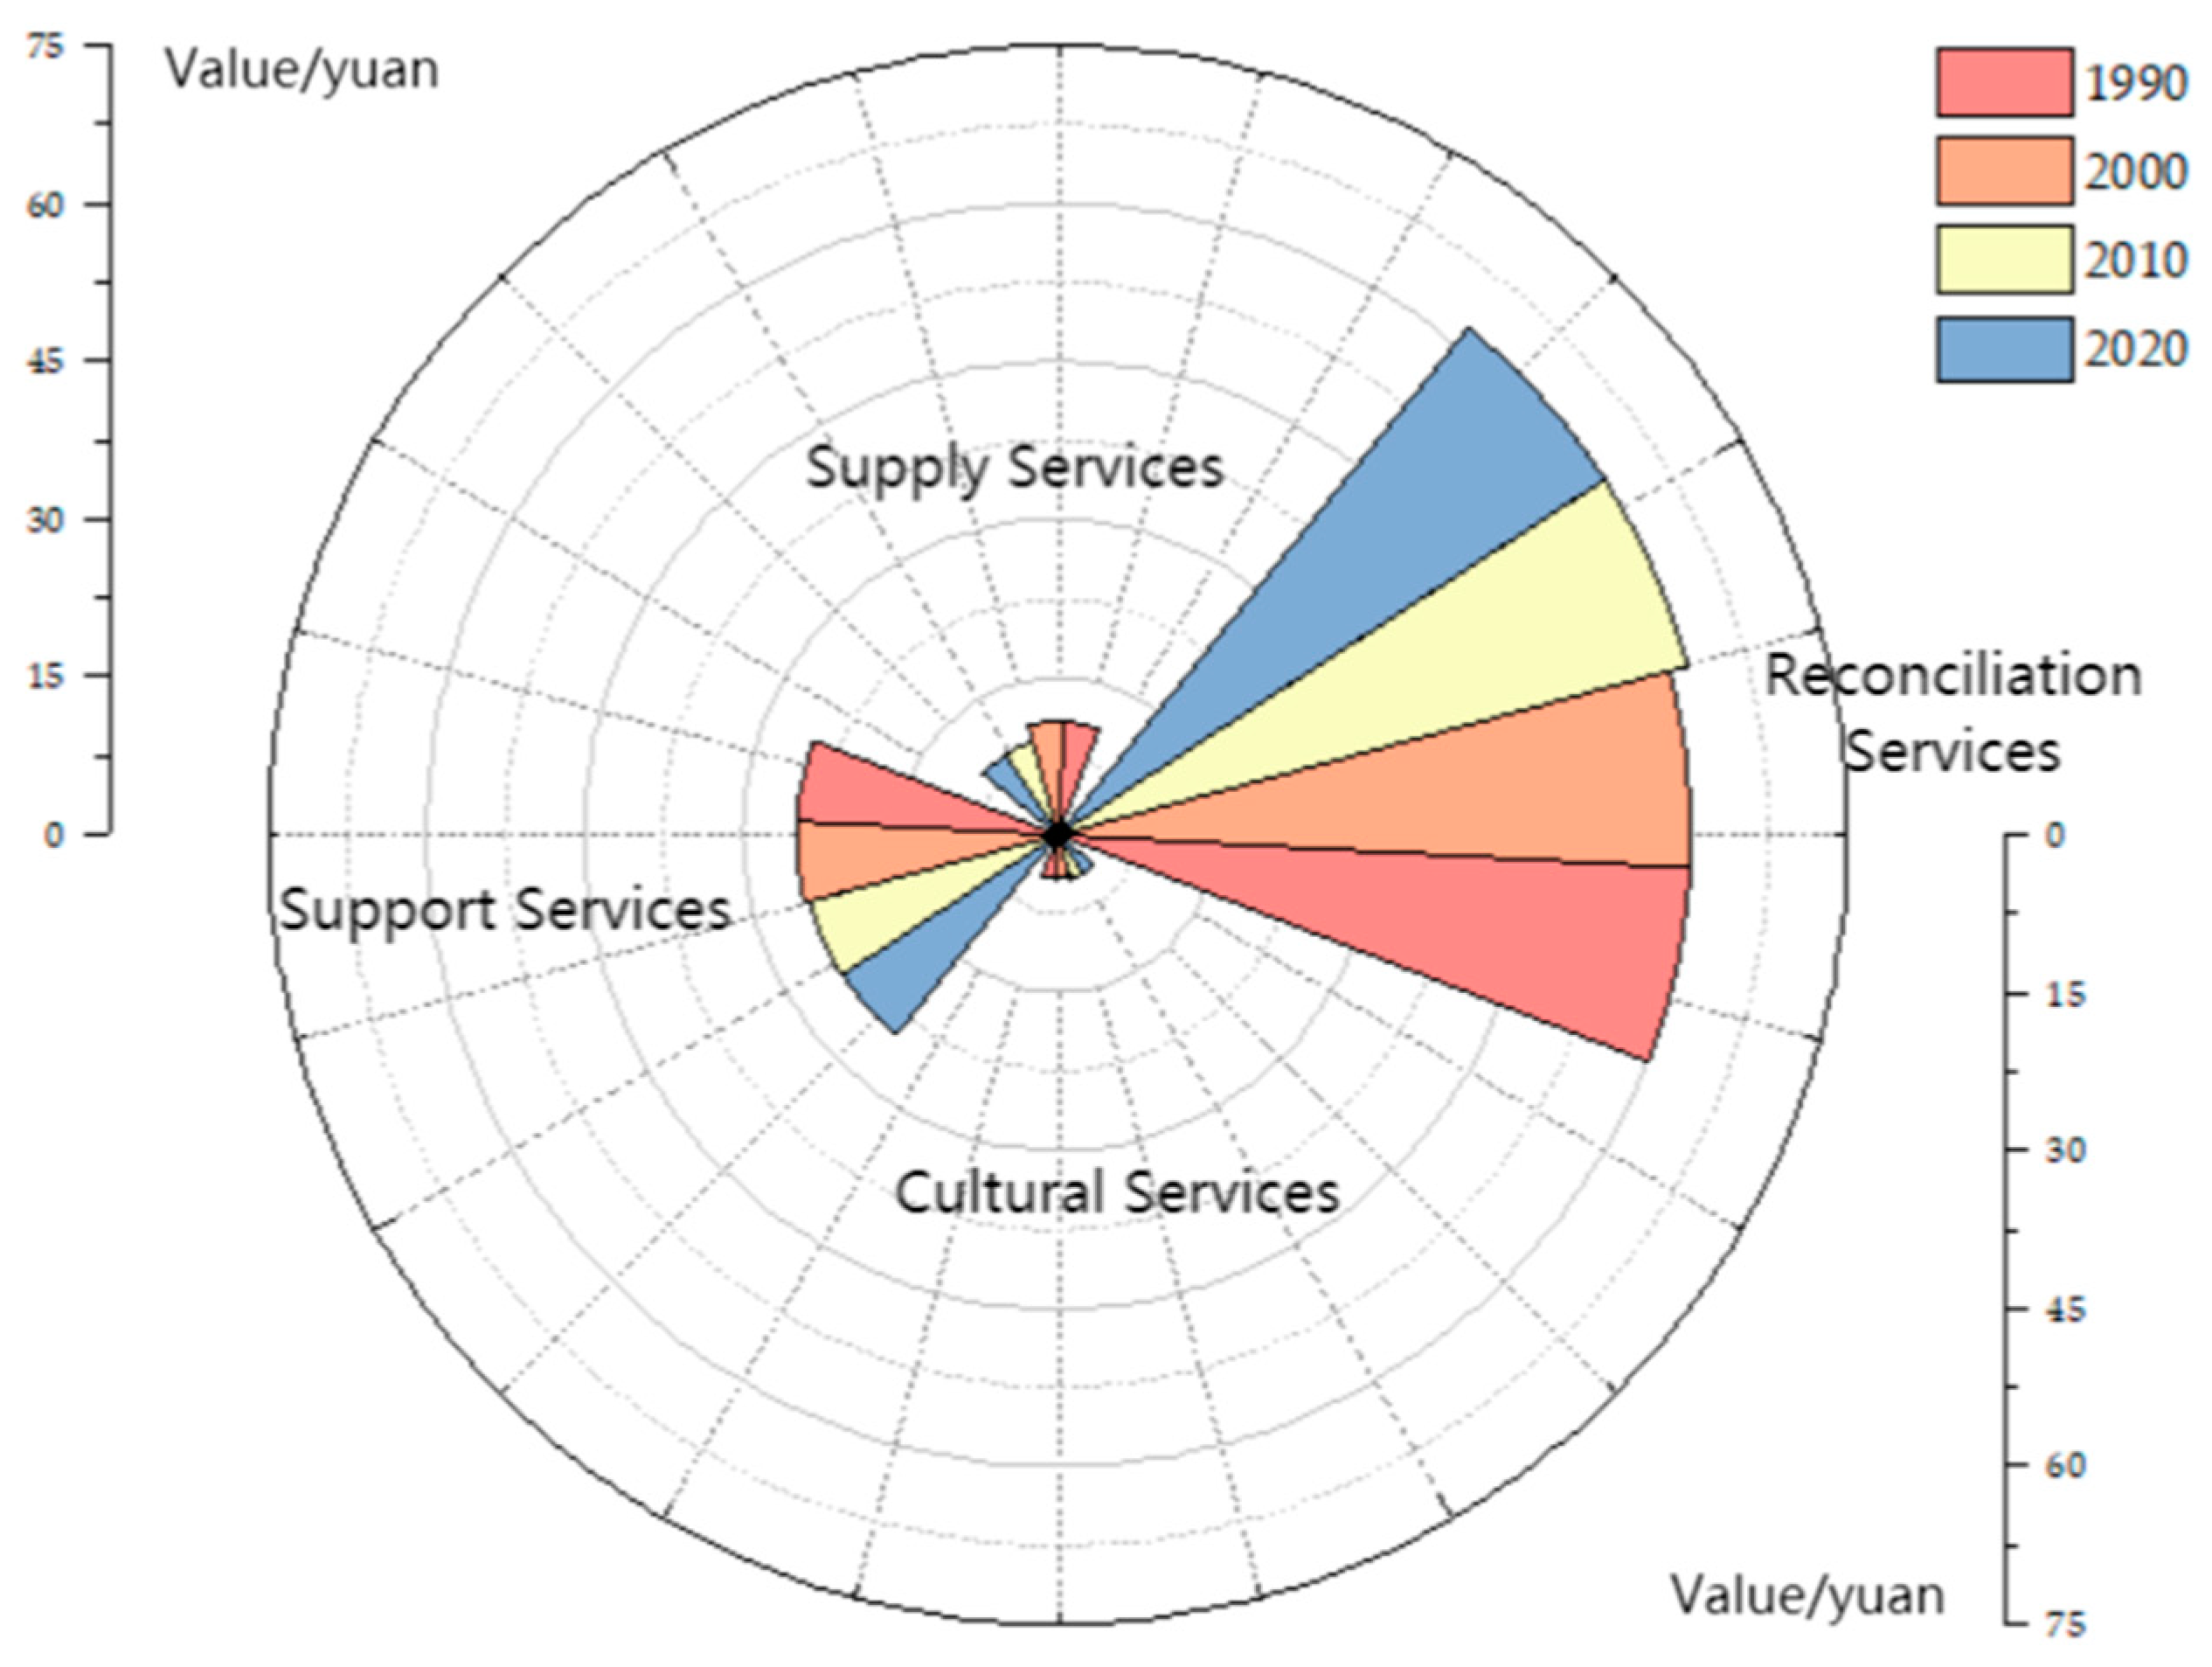
3.2.1. The ESV Temporal Evolution

Without taking inflation into account, the ESVs were 9.434, 9.447, 10.563, and 10.559 billion yuan in 1990, 2000, 2010, and 2020, severally. The ESV continued to increase from 1990 to 2010. Subsequently, it started to decrease. The ESVs in the Yan River Basin increased by 1.125 billion yuan, or about 0.37 billion yuan per year, from 1990 to 2020, in a descending order presenting as grassland, forest land, arable land, water area, and construction land. Forest land and grassland played a significant role in ecosystem service functions, providing 75% of the ESVs (Table 4).
Soil erosion is one of the most critical environmental problems facing northern Shaanxi. Since the establishment of the Three-North Shelter Forestation Project in 1978 and critical projects of returning farmland to forests, as well as soil and water conservation, great changes have taken place in the land use here. The forest and grassland area has increased significantly, contributing to the rise in ESVs from 1990 to 2010, and the improvement was also achieved in the environment of Yan River Basin. The population density, per capita GDP density, and urbanization in the districts and counties have grown faster since 2010. Population growth and GDP led to problems such as the consumption of resources and waste emissions, which intensified the degree of influence caused by human activities on the ecosystem. Urbanization led to urban expansion in space, inducing changes in the ground layout of land types, which, therefore, changed the regional economy [34]. The ESVs decreased by 0.04% from 2010 to 2020 because of the negative impacts of population growth and urbanization. Since 2016, the Yan River Basin has been gradually testing ways to protect the environment and restore mountains, forests, fields, and lakes. Shaanxi Province’s Thirteenth Five-Year Ecological Environmental Protection Plan was released in 2017 to encourage transformational development and strengthen the restoration and reconstruction of the environment. These measures have been effective in hindering further severe ecological conditions. Therefore, although ecosystem service value decreased from 2010 to 2020, the ESVs declined slowly and showed an increasing pattern overall due to relevant ecological management and prevention measures.
The first-level indicators of ecosystem services (supply services, reconciliation services, support services, and cultural services) showed the same overall changes as the ecosystem service values, with no significant changes in the relative proportions and relatively stable changes in the structure of ecosystem values (Figure 3). The four first-level ecosystem services changed rapidly from 2000 to 2010 but less from 1990 to 2000 and 2010 to 2020. The fact that the Yan River Basin’s ecosystems had the highest number of reconciliation services showed that it eliminated pollution and stabilized the environment.

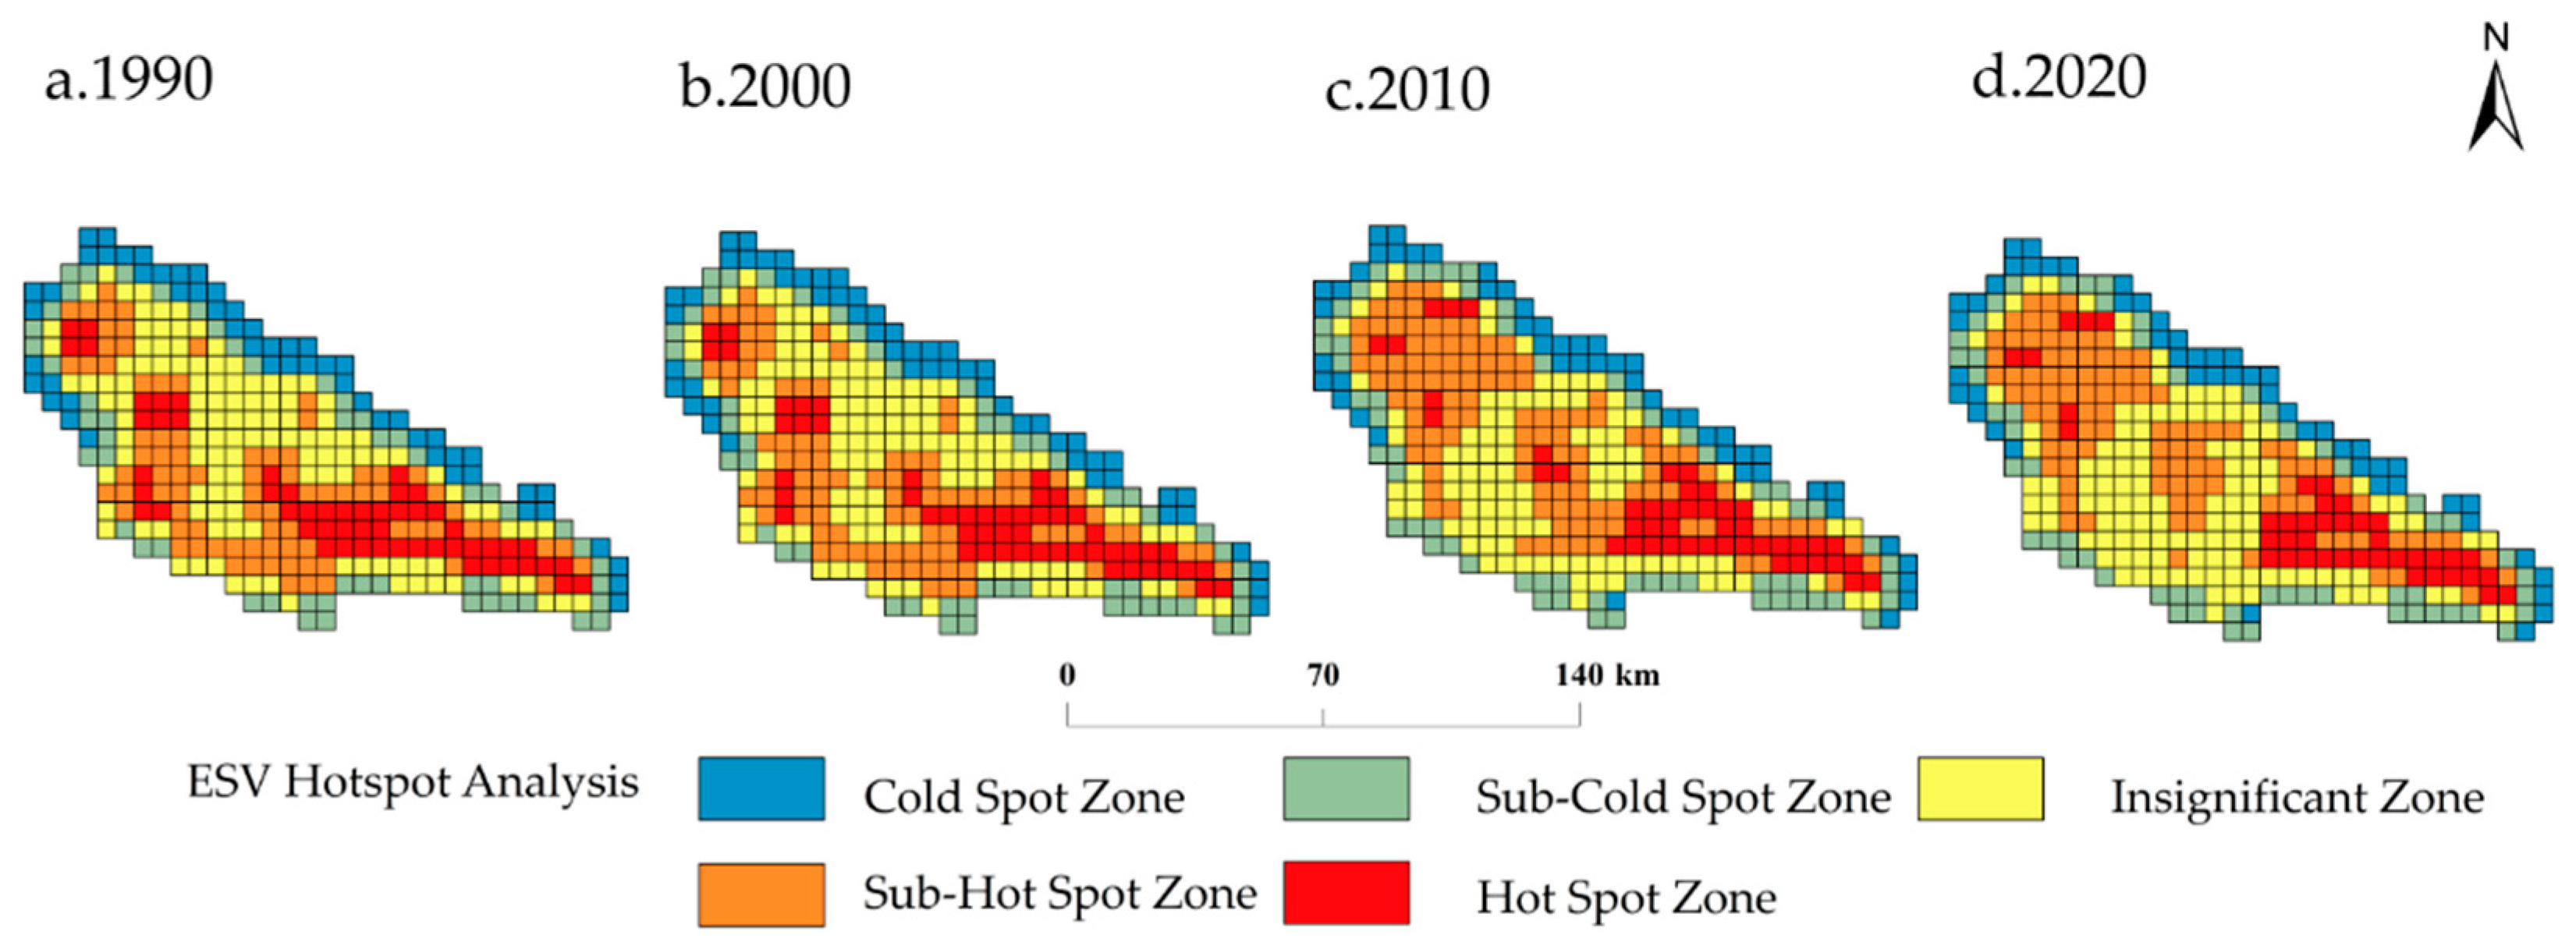
3.2.2. Spatial ESV Land Distribution

In order to analyze the land distribution spatially, we divided the Yan River Basin into 5 km × 5 km grid cells. Five levels were concluded after dividing the ESVs using the natural discontinuity method, and therefore the spatial variation features were disclosed in terms of ecosystem service values (Figure 4). The overall ESV land distribution pattern in the Yan River Basin was more south than north and low in the middle, which went consistently with the land-use pattern. The middle part is located in a hilly area with low elevation, suitable for cultivation, and a high proportion of arable land, involving Zhidan County and the middle of the Baota District, with sizeable anthropogenic disturbance and severe soil erosion. The middle of the Baota District is rich in coal and oil storage. With the fast development of construction land, high-intensity mining has a significant negative impact on vegetation, land resources, and surface water resources, such as river, lake, and spring environments. Hence, the ecosystem service value is low. The northern part is located south of Jingbian County, with a large proportion of grassland. The southern part belongs to the residual Loess Plateau valley area of the Loess broad beam [45], located in Yanchang County, which has a large proportion of forest land area, relatively rich ecological resources, and a high ecosystem service value. Together with the gradual increase in anthropogenic protection, the overall ESVs were shown to increase.
Their evolutionary features were further analyzed using a hotspot analysis (Figure 5). The hotspot areas were mainly located in Yanchang County, which has much forest land and high ecosystem service values. The Cold Spot areas were situated on the northwestern and eastern edges. The sub-hotspots were located almost north of Zhidan County, the west-central and southwestern parts of the Ansai District, and the southern part of the Baota District from 1990 to 2000. The sub-hotspots expanded significantly from 2010 to 2020, mainly in the whole area of Zhidan County and the northwestern part of the Ansai District, which resulted from the growth in the grassland area that shifted the former insignificant areas to the sub-hotspots. The sub-hotspots in the Ansai and Baota districts tended to shift northward. The rapid development of construction land in the south-central Baota District reduced ecological land. On the other hand, the northern part of the two districts shifted their arable land to forest land and grassland areas, which increased the ESVs.

3.3. ESV Response to Land-Use Changes

Land-use area was 37,358, 108,784, and 27,040 hm2, respectively, in 1990–2000, 2000–2010, and 2010–2020, and the ESV elasticity change was 0.028, 0.83, and 0.013. The results showed that the ecosystem service values were more affected by changes in land use from 2000 to 2010 than from 2010 to 2020. Land use can regulate ecosystem improvement [58] and degradation because each land-use type provides different ecosystem service values per unit (Table 5). Transfer from arable land to grassland and forest land contributed 82.96% to improving ecosystem services from 1990 to 2000; the elasticity coefficient was low because different types of land have two-way conversion. Grassland and forest land were converted into arable land, meaning that up to 64.39 percent of ecosystem services were lost. This change canceled out the effect of the higher ESVs; thus, there was a small change in its value, and the average elasticity coefficient was small. There was significant growth in its overall amount between 2000 and 2010. The arable land’s revegetation served as the essential reason for ecosystem improvement. The role of forest planting policy in this period was prominent, with an increased average elasticity coefficient. After being offset, the contribution of arable conversion to forest land and grassland to ecosystem enhancement reached 28.39%. Land-use types had a greater impact on the total ESVs, with a significant increase in ecosystem services. Notably, the number of other land types that changed into construction land increased during this period. The impact brought by arable, forest, and grassland conversion on the ecosystem service system was substantially offset from 2010 to 2020. The areas of other ecological lands converted to construction land proliferated due to urbanization, especially the contribution of grassland conversion to construction land to ecosystem function degradation (12.58%), resulting in a slight decrease in ecosystem services and the average elasticity coefficient. Thus, in the future development of Yan River Basin, attention should be further attached to consolidating the achievements in planting forests to prevent them from influencing ecosystem functions. Simultaneously, the government should strengthen the scientific management and planning for construction land expansion in urban areas to reduce encroachment on ecological land.

3.4. Driving Mechanisms of Ecosystem Service Values

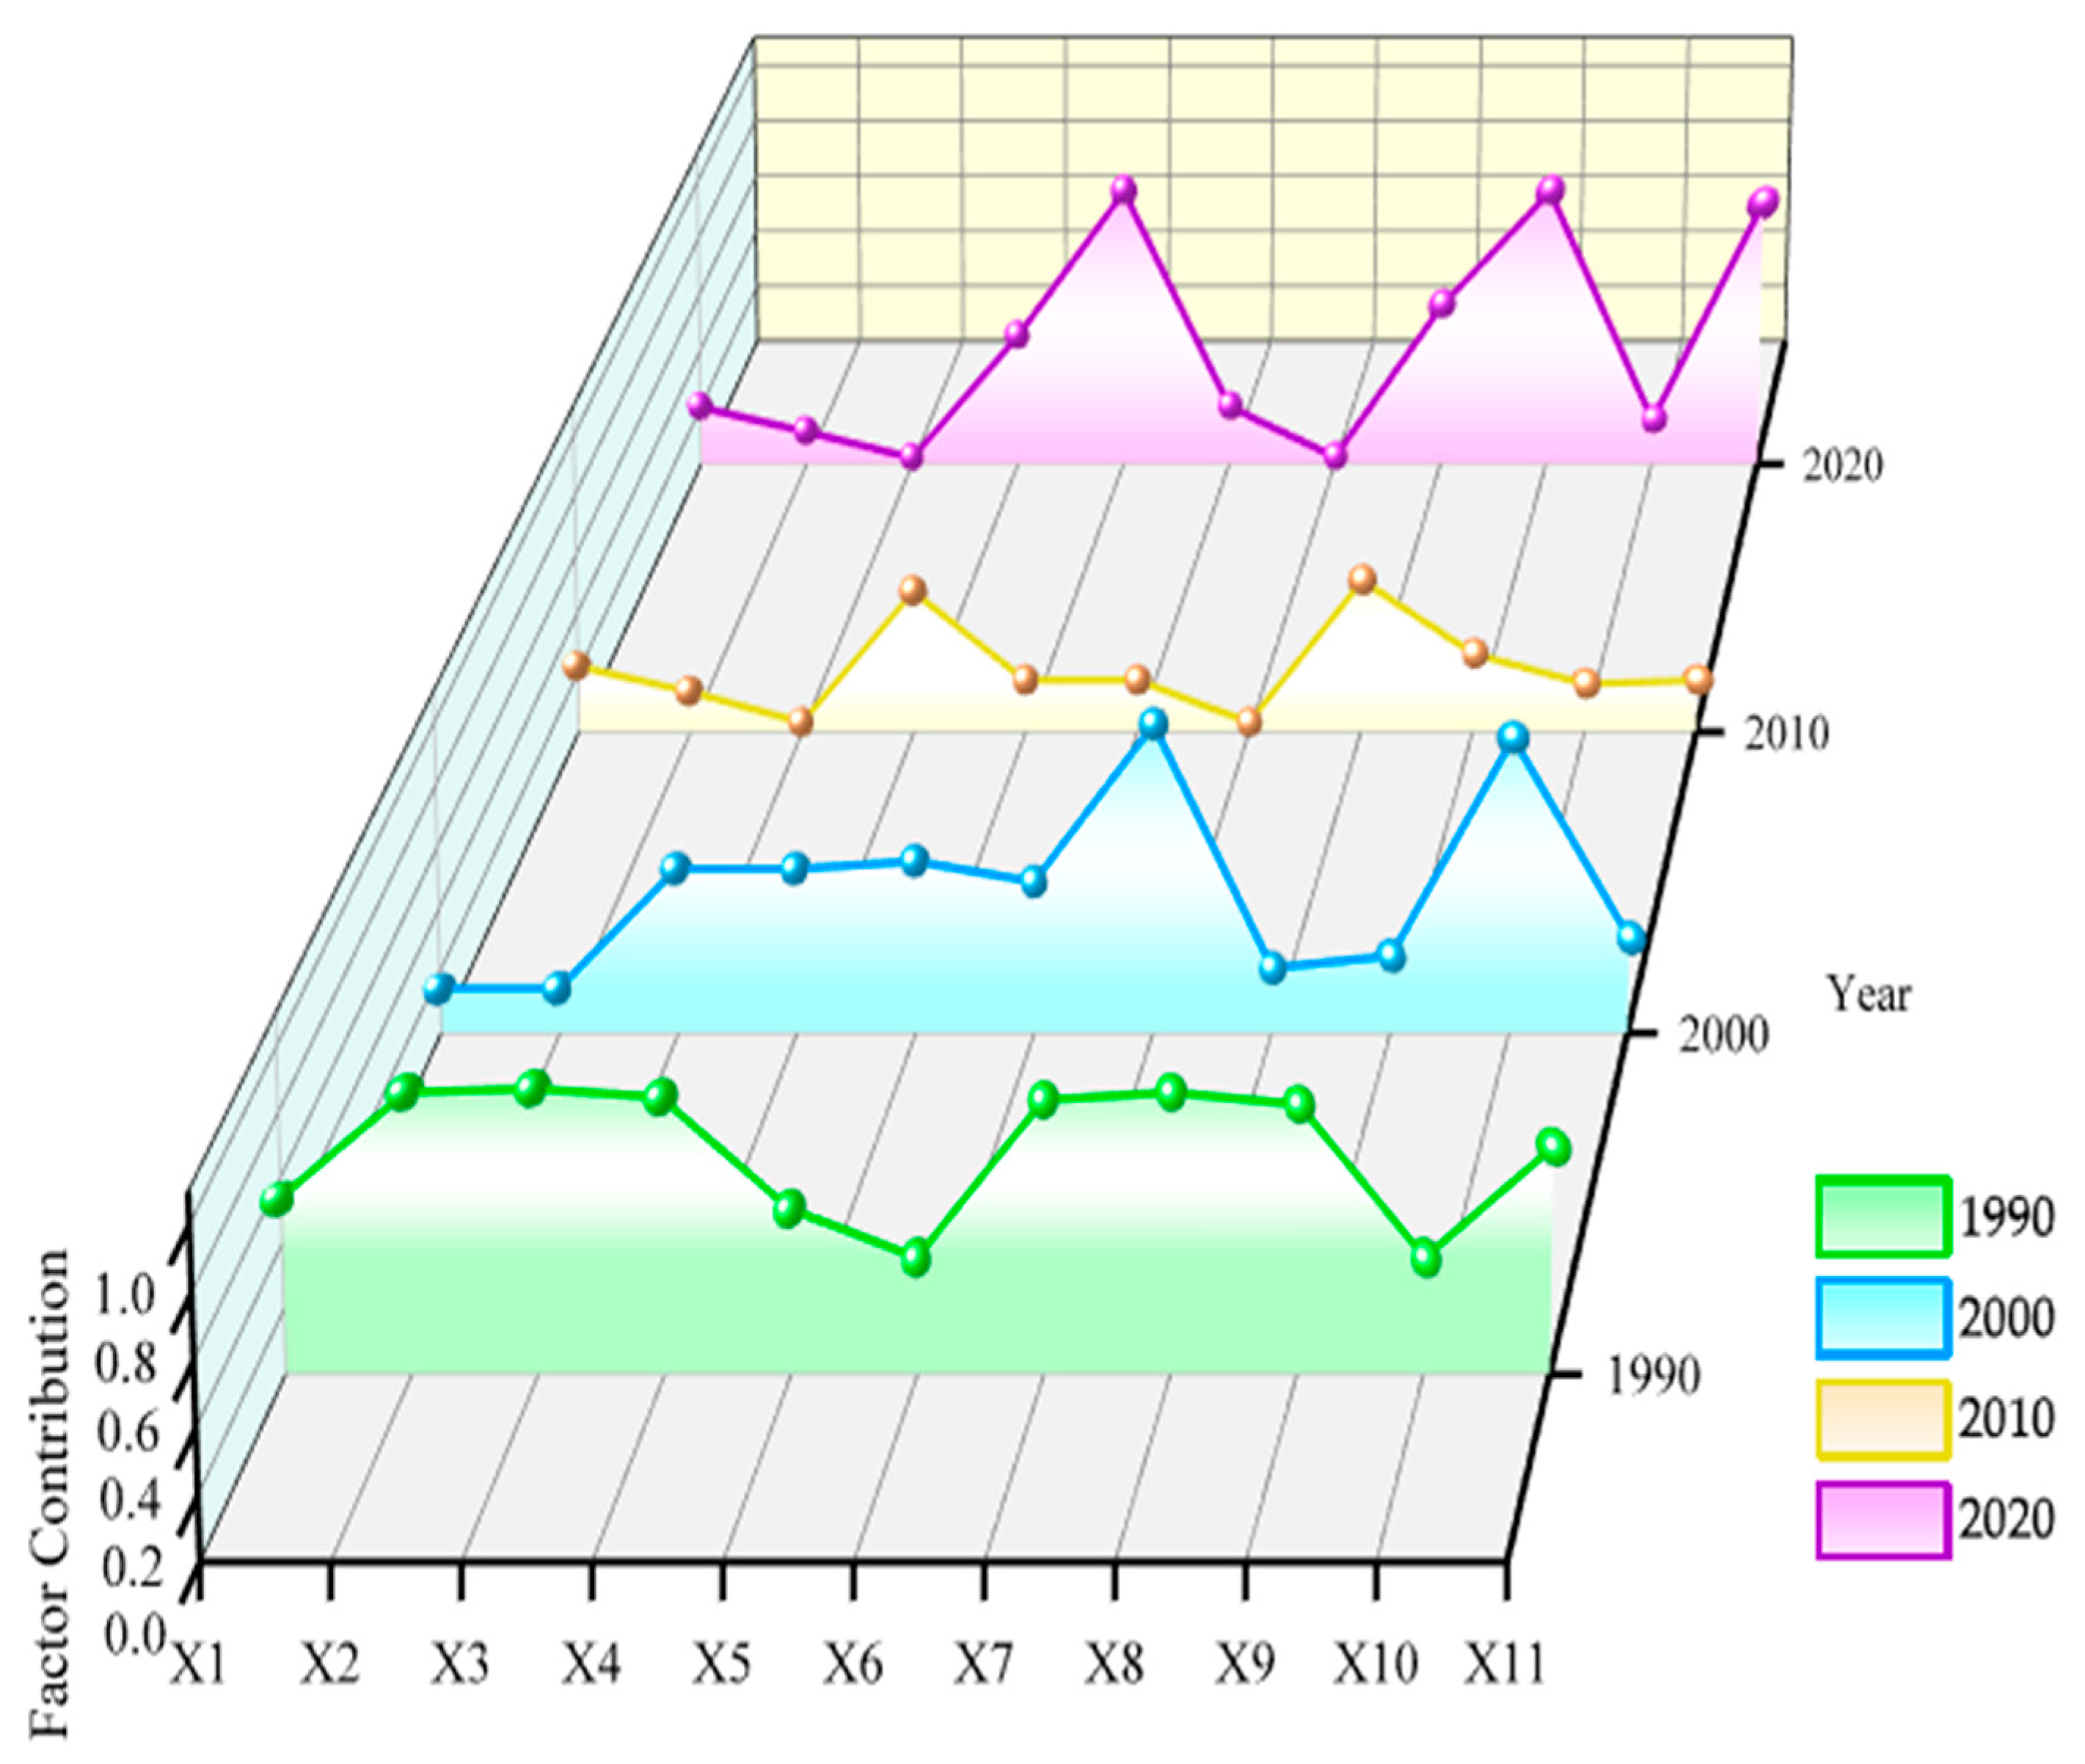
3.4.1. Factor Detection

With the aid of a geodetector model, it was possible to classify the four different types of drivers as dependent variables and the ecosystem service value as an independent variable using the abovementioned index (Figure 6). This demonstrated how various natural, socio-economic landscape patterns and policy factors affect ESVs in Yan River Basin and that there were huge differences in the influence of each driver over time. The contribution of the ESVs change factors in 1990 was ranked from most significant to not significant according to q-values as follows: X3 > X2 > X10 > X4 > X9 > X7 > X11 > X1 > X5 > X6 > X8. The most influential factor was precipitation; however, slope, landscape connectivity, elevation, and landscape diversity were also significantly associated with the ESVs. The social development degree was relatively low at this time, and the precipitation pattern distribution resembled ESVs spatially, increasing from north to south. Climate controls the amount of water and heat, directly affecting the way things grow, develop, and spread out [59].
The contribution of the ESV change factors in 2000 was as follows: X9 > X8 > X5 > X3 > X4 > X6 > X11 > X7 > X10 > X1 > X2. The development of the return of farmland to forests and grasslands in several areas let the layout of the surface landscape change, causing changes in the ecological structure so that landscape diversity became the dominant factor. At this time, urbanization and economic construction began to accelerate, and the impact of human activity intensity began to increase dramatically. The influence of precipitation was still not negligible.
The 2010 ESV change factors were ranked as follows: X10 > X4 > X7 > X1 > X5 > X6 > X11 > X8 > X2 > X9 > X3. Accelerated economic development led to expansion of urbanization, and the construction land’s agglomeration reduced the degree of surface fragmentation, making landscape connectivity the most vital explanatory factor. At the same time, the influence of population density and GDP per land also expanded.
The ESV change factors were ranked as follows in 2020: X5 > X7 > X11 > X10 > X4 > X6 > X1 > X8 > X2 > X9 > X3. In order to consolidate afforestation achievements and expand afforestation area, the development speed of Yan River Basin slowed down. However, the economic and social level of Yan River Basin was still improving, so the GDP per land became the dominant factor, the population density, the afforestation area, the landscape connectivity, and the urbanization rate decreased in that order.

3.4.2. Interaction Factor Detection

The geodetector models used interaction detection to find out how the combined effects of the drivers affected the dependent variable (Table 6). The interaction was in the form of bifactor enhancement and nonlinear enhancement. The mutual effect between natural and socio-economic factors was more substantial than that between other primary indicators. The interaction between the afforestation area and other factors was the strongest among the secondary indicators. There were two categories of interaction–detection-factor q values that reached one, which were as follows: the interaction between landscape pattern factors with natural factors, policy factors, and urbanization rate, and the interaction of afforestation area with natural factors, urbanization rate, and human activity intensity. The contribution of the remaining factors was more significant than that of a single factor. The detection indicated that ESV evolution in Yan River Basin was not influenced by a single factor but rather by the mutual interaction between human activities, natural factors, and landscape patterns.

4. Discussion

In terms of the applicability of land types as well as ESVs, during the period between 1990 and 2020, influenced by the policy, as well as economic and social progress, construction land areas gradually increased, arable land areas gradually decreased, and grassland areas increased at first and then dropped in size. The results showed the same development trend as that in the research results of Qiulei Ji [30]. The results indicated that the spatial distribution of ESVs was less prominent in the north and more so in the south and that the values increased temporally, in accordance with the results reported by Wang [60] and Zhang Kun [61]. The agreement of findings on this point confirms the reliability and validity of our analysis, and supports the conclusion that although the policy of returning farmlands to forests has achieved a certain degree of success, it is still critically important to focus on the consolidation and development of the existing results.
In the aspect of exploring the influencing factors of ecosystem service values, the present study selected the afforestation area as its supporting indicator for the policy factors that are currently difficult to quantify. The interactive form of the influencing factors presented bifactor enhancement and nonlinear enhancement, which were the same as the research results of Ming-Yang Xie and Chun-Meng Jiao [31]. Tian Wei Geng’s research [62] concluded that the overall socio-economic factors had a more substantial explanatory power for ESVs, which is consistent with the present study. Wei Fu’s research [63] concluded that the intensity factor of human activity was weaker than the urbanization rate factor, which is different from the present study, probably due to differences in the methods of quantifying the intensity of human activity. This shows that using geodetectors to explore influencing factors is helpful for the reliability of the present study.
The level of ecosystem services changed closely according to the well-being of human beings. Therefore, the ecological environment should be strictly controlled and protected through relevant initiatives: (1) Reduce the erosion of grasslands, forests, and other ecological land by construction land, improve the utilization rate of construction land per unit area, and realize intensive land use in the economical manner at the time of economic development. (2) Pay attention to consolidating the results of the forest recover policy and optimizing the development speed of ecological restoration and reconstruction measures in the north of the basin where the value of ecosystem services is relatively low. (3) The policy factors positively affect the adjustment of ESVs, and Yan River Basin should strictly carry out the national strategic policies to realize sustainable development.

5. Conclusions

ESVs are spatially consistent with land types in Yan River Basin, increasing in value from north to south, and the overall trend is rising over time. There is a dramatic growth in land type changes, which interferes with ESVs from 2000 to 2010. The vegetation restoration of arable land is the main reason to improve the ecosystem. Under the influence of urbanization factors, the construction land area grows significantly; arable land‘s area is similar to the area of shift between forest and grassland, resulting in a reduction in ESVs growth and the elasticity coefficient, resulting in a decline in ESV growth and the elasticity coefficient from 2010 to 2020. Explanations of afforestation area, precipitation, GDP per land, and landscape connectivity are more vital through geodetector detection. The interaction detection shows that a single factor does not drive the spatial pattern changes in ESVs here; instead, they are subject to the combined effects of multiple factors, such as economic and social progress, natural conditions, and landscape pattern changes. Thus, in the future development of Yan River Basin, attention should be further attached to consolidating the achievements in returning farmland to forest policy to prevent ecosystem function degradation and achieve sustainable development.

Author Contributions

Conceptualization, J.Z. and W.Z.; methodology, W.Z.; software, W.Z.; validation, J.Z. and W.Z.; formal analysis, W.Z.; resources, W.Z.; data curation, W.Z.; writing—original draft preparation, W.Z.; writing—review and editing, J.Z.; visualization, W.Z.; supervision, J.Z. All authors have read and agreed to the published version of the manuscript.

Funding

This research received no external funding.

Institutional Review Board Statement

Not applicable.

Informed Consent Statement

Not applicable.

Data Availability Statement

Not applicable.

Acknowledgments

Major Project of Key Research Base of Humanities and Social Sciences of Ministry of Education, No. 22JJD770020.

Conflicts of Interest

The authors declare no conflict of interest.

References

  1. Chen, Y.; Li, Z.; Li, P.; Zhang, Y.; Liu, H.; Pan, J. Impacts and Projections of Land Use and Demographic Changes on Ecosystem Services: A Case Study in the Guanzhong Region, China. Sustainability 2022, 14, 3003. [Google Scholar] [CrossRef]
  2. Ma, Y.W.; Pan, J.F.; Cai, S.Q.; Chen, Y.M.; Chen, Y. Trade-offs and Synergies between Social Value and Ecological Value of Ecosystem Services: A Case Study of the Potatso National Park. Sci. Geogr. Sin. 2022, 42, 1283–1294. [Google Scholar] [CrossRef]
  3. Dade, M.C.; Mitchell, M.G.E.; McAlpine, C.A.; Rhodes, J.R. Assessing ecosystem service trade-offs and synergies: The need for a more mechanistic approach. Ambio 2018, 48, 1116–1128. [Google Scholar] [CrossRef] [PubMed]
  4. Yin, Y.C.; Xi, F.M.; Wang, J.Y.; Bing, L.F.; Du, L.Y. Application of Ecosystem Value in Policy System Design: A Case Study of Fuzhou City, China. Chin. J. Appl. Ecol. 2021, 32, 3815–3823. [Google Scholar] [CrossRef]
  5. de Groot, R.; Brander, L.; van der Ploeg, S.; Costanza, R.; Bernard, F.; Braat, L.; Christie, M.; Crossman, N.; Ghermandi, A.; Hein, L.; et al. Global estimates of the value of ecosystems and their services in monetary units. Ecosyst. Serv. 2012, 1, 50–61. [Google Scholar] [CrossRef]
  6. Brown, G. The relationship between social values for ecosystem services and global land cover: An empirical analysis. Ecosyst. Serv. 2013, 5, 58–68. [Google Scholar] [CrossRef]
  7. Costanza, R.; d’Arge, R.; de Groot, R.; Farber, S.; Grasso, M.; Hannon, B.; Limburg, K.; Naeem, S.; O’Neill, R.V.; Paruelo, J.; et al. The value of the world’s ecosystem services and natural capital. Nature 1997, 387, 253–260. [Google Scholar] [CrossRef]
  8. Liu, S.Y. Modern Human-earth Relationship and Human-earth System Science. Sci. Geogr. Sin. 2020, 40, 1221–1234. [Google Scholar] [CrossRef]
  9. Fu, B.J.; Zhang, L.W. Land-use Change and Ecosystem Services: Concepts, Methods and Progress. Prog. Geogr. 2014, 33, 441–446. [Google Scholar]
  10. Adams, R.; Berrens, R.; Cerda, A.; Li, H.W.; Klingeman, P.C. Developing a bioeconomic model for riverine management: Case of the John Day River, Oregon. Rivers 1993, 4, 213–226. [Google Scholar]
  11. Ouyang, Z.Y.; Wang, X.K.; Miao, H. A Primary Study on Chinese Terrestrial Ecosystem Services and their Ecological-economic Values. Acta Ecol. Sin. 1999, 5, 19–25. [Google Scholar]
  12. Xie, G.D.; Xiao, Y.; Zhen, L.; Lu, C.X. Study on Ecosystem Services Value of Food Production in China. Chin. J. Eco-Agric. 2005, 13, 10–13. [Google Scholar]
  13. Xie, G.D.; Zhang, C.X.; Zhang, L.M.; Chen, W.H.; Li, S.M. Improvement of the Evaluation Method for Ecosystem Service Value Based on Per Unit Area. J. Nat. Resour. 2015, 30, 1243–1254. [Google Scholar]
  14. Yan, Y.; Yao, L.Y.; Lang, L.M.; Zhao, M.J. Revaluation of Ecosystem Services in Inland River Basins of China: Based on Meta-Regression Analysis. J. Geogr. Sci. 2019, 74, 1040–1057. [Google Scholar]
  15. Zhang, L.J.; Bai, Y.P.; Hu, Y.C.; Deng, X.Z.; Wei, L. Valuation of Ecosystem Services in China under Different SSP-RCP Scenarios. Acta Ecol. Sin. 2023, 43, 510–521. [Google Scholar]
  16. Li, Z.J.; Liu, J.Y.; Jiang, A.X.; Yu, Y.H. Temporal and Spatial Dynamics of Ecosystem Service Value in Benghe River Basin based on Land Use Change. Res. Soil Water Conserv. 2020, 27, 269–275+283. [Google Scholar] [CrossRef]
  17. Liu, M.; Fan, J.; Wang, Y.; Hu, C. Study on Ecosystem Service Value (ESV) Spatial Transfer in the Central Plains Urban Agglomeration in the Yellow River Basin, China. Int. J. Environ. Res. Public Health 2021, 18, 9751. [Google Scholar] [CrossRef]
  18. Wang, Y.H.; Ding, J.L.; Li, X.H.; Zhang, Y.Y.; Ma, G.L. Impact of LUCC on Ecosystem Services Values in the Yili River Basin based on an Intensity Analysis Model. Acta Ecol. Sin. 2022, 42, 3106–3118. [Google Scholar]
  19. Wang, W.T.; Sun, T.; Wang, J.X.; Fu, Q.; An, C.Y. Annual Dynamic Monitoring of Regional Ecosystem Service Value based on Multi-source Remote Sensing Data: A Case of Central Plains Urban Agglomeration Region. Sci. Geogr. Sin. 2019, 39, 680–687. [Google Scholar] [CrossRef]
  20. Liu, J.Y.; Wang, D.C.; Zhang, L.H.; Wang, F.C.; Hu, B.X.; Chen, J.H.; Sun, Z.C. Estimation of the Ecosystem Service Value of the Beijing-Tianjin-Hebei Urban Agglomeration based on Multi-boundary Improvement. Acta Ecol. Sin. 2018, 38, 4192–4204. [Google Scholar]
  21. Liu, Z.T.; Wang, S.J.; Fang, C.L. Spatiotemporal Evolution and Influencing Mechanism of Ecosystem Service Value in the Guangdong-Hong Kong-Macao Greater Bay Area. J. Geogr. Sci. 2021, 76, 2797–2813. [Google Scholar] [CrossRef]
  22. An, G.Q.; Han, Y.X.; Gao, N.; Ji, L.S.; Gao, H.B.; Tan, X.Q.; Xu, Y.T. Quantity and Equilibrium of Ecosystem Service Value and their Spatial Distribution Patterns in Shandong Province. China Popul. Resour. Environ. 2021, 31, 9–18. [Google Scholar]
  23. Liu, C.F.; Li, P.J.; Liu, L.C.; Wang, W.T. Ecological Restoration Zoning of Provincial Territorial Space in the Ecologically Fragile Areas of Northwest China. Trans. Chin. Soc. Agric. Eng. 2020, 36, 254–263. [Google Scholar]
  24. Guo, M.M.; Lu, X.; Ma, Q. Study on Eco-economic Value Evaluation and Compensation from the Perspective of Small Watershed: A Case Study of Zhuanghe City in Liaoning province. J. Nat. Resour. 2022, 37, 2884–2897. [Google Scholar] [CrossRef]
  25. Li, T.; Chen, T.Y.; Hui, B.H. Economic Value of Forest Ecosystem Services in Huangshan City based on Meta-Analysis. J. Geogr. Sci. 2022, 42, 2179–2188. [Google Scholar] [CrossRef]
  26. Liu, D.Q.; Zhang, J.Q.; Jie, G.; Qian, C.Y. Spatial and Temporal Relations among Land-use Intensity, Ecosystem Services, and Human Well-being in the Longzhong Loess Hilly Region: A Case Study of the Anding District, Gansu Province. Acta Ecol. Sin. 2019, 39, 637–648. [Google Scholar]
  27. Qu, W.; Chen, Y.; Xie, B.P.; Pei, T.T.; Ren, X.J.; He, Y. Spatio-temporal Dynamics of Land Use Transition and Ecosystem Service Value in Yuzhong County. Ecol. Sci. 2022, 41, 197–207. [Google Scholar] [CrossRef]
  28. Sun, J.; Zhang, Y.; Qiao, Q.H.; Liu, J.; Zhai, L. Reclamation Project Monitoring and Ecosystem Servive Value Change Analysis. Sci. Surv. Mapp. 2020, 45, 197–204. [Google Scholar] [CrossRef]
  29. Liu, T.; Zhou, Z.X.; Zhu, Q.; Bai, J.Z. Spatiotemporal Change of Soil Conservation Service in Yanhe Watershed. Res. Soil Water Conserv. 2021, 28, 93–100. [Google Scholar] [CrossRef]
  30. Ji, Q.L.; Liang, W.; Fu, B.J.; Lv, Y.H.; Yan, J.W.; Zhang, W.B.; Jin, Z.; Lan, Z.Y. Land Use/Cover Change in the Yellow River Basin based on Google Earth Engine and Complex Network. Acta Ecol. Sin. 2022, 42, 2122–2135. [Google Scholar]
  31. Zhi, Z.X.; Li, Z.B.; Yu, K.X.; Li, P.; Gao, H.D.; Yao, J.W. Impact of land Use Change on Ecosystem Services Value in Northern Shaanxi. Sci. Soil Water Conserv. 2017, 15, 23–30. [Google Scholar] [CrossRef]
  32. Xie, M.Y.; Jiao, C.M.; Han, X.Y.; Jiao, F. Spatio-temporal Transmutation and Impact Factors of Ecosystem Servive Value in Yan’an City from the Perspective of Entropy. J. Soil Water Conserv. 2022, 36, 247–254. [Google Scholar] [CrossRef]
  33. Zhu, H.H.; Zhang, Y. Analysis of Changes in Farmland Ecosystem Services Value and its Influencing Factors in Xinjiang. J. Shihezi Univ. 2020, 38, 340–346. [Google Scholar] [CrossRef]
  34. Wang, J.F.; Xu, C.D. Geodetector: Principle and Prospective. J. Geogr. Sci. 2017, 72, 116–134. [Google Scholar]
  35. Ren, Z.P.; Zhang, G.H.; Yang, Q.K. Characteristics of Runoff and Sediment Variation in Yanhe River Basin in Last 50 Years. J. China Hydrol. 2012, 32, 81–86. [Google Scholar]
  36. Miao, L.P.; Wen, Z.M.; Zhang, L. Study on the Relationship between Vegetation Change and Runoff-Sediment: A Case of the Yanhe Basin. J. Arid Land Resour. Environ. 2015, 29, 75–81. [Google Scholar] [CrossRef]
  37. Ran, D.C.; Yao, W.Y.; Wu, Y.H.; Li, X.M.; Lv, X.Z. Effect of Forest-grass Vegetation on Reducing Flood and Sediment from 1997 to 2006 in Yanhe Basin. Sci. Soil Water Conserv. 2014, 12, 1–9. [Google Scholar] [CrossRef]
  38. Wang, Y.; Feng, Q. Characteristics of Runoff and Sediment Transport during 1960-2010 and its Response to Grain for Green Project in Yanhe River. Sci. Soil Water Conserv. 2017, 15, 1–7. [Google Scholar] [CrossRef]
  39. Li, T.H.; Zheng, L.N. Soil Erosion Changes in the Yanhe Watershed from 2001 to 2010 based on RUSLE Model. Nat. Resour. 2012, 27, 1164–1175. [Google Scholar]
  40. Zhang, W.S.; Wang, F.; Mu, X.M.; Li, R.; He, Y. Spatio-temporal Characteristics of Land Use/Land Cover Change (LUCC) over the Past 25 Years in the Yan River Basin. Res. Soil Water Conserv. 2012, 19, 148–157. [Google Scholar]
  41. Lou, H.Z.; Yang, S.T.; Zhou, Q.W.; Luo, Y.; Hou, L.P. Analysis of the Land Use/Cover Change and Driving Forces in Yan River Basin from 2000 to 2010. J. Arid Land Resour. Environ. 2014, 28, 15–21. [Google Scholar] [CrossRef]
  42. Qiu, L.J.; Zheng, F.L.; Yin, R.S. Trend Analysis of Precipitation and Streamflow during 1952–2008 in Yanhe River Basin. J. Soil Water Conserv. 2011, 25, 49–53. [Google Scholar] [CrossRef]
  43. Qi, D.H. Variation Characteristics of the Stoichiometry Characterustics of Zonalvegetation Community and Soil in the Yan River Catchment. Master’s Thesis, Northwest A&F University, Xi’an, China, 2016. [Google Scholar]
  44. Li, C.Z.; Wang, H.; Yu, F.L.; Yang, A.M.; Yan, D.H. Impact of Soil and Water Conservation on Runoff and Sediment in Yan River Basin. Sci. Soil Water Conserv. 2011, 9, 1–8. [Google Scholar] [CrossRef]
  45. Wang, C.J. Temporal Information Entropy and its Application in the Evaluation of Ecological Environment Quality in Yan Watershed. Master’s Thesis, Tsinghua University, Beijing, China, 2016. [Google Scholar]
  46. Zhu, Q.; Zhou, Z.X.; Liu, T.; Bai, J.Z. Vegetation Restoration and Ecosystem Soil Conservation Service Value Increment in Yan Watershed, Loess Plateau. Acta Ecol. Sin. 2021, 41, 2557–2570. [Google Scholar]
  47. Zhong, X.; Jiang, X.; Li, L.; Xu, J.; Xu, H. The Impact of Socio-Economic Factors on Sediment Load: A Case Study of the Yanhe River Watershed. Sustainability 2020, 12, 2457. [Google Scholar] [CrossRef]
  48. Zhuo, J.; Zhu, Y.N.; Li, T.; Yang, C.R. Response of Ecological Service Value and Quality to Land Use Change in China′s Loess Plateau. Res. Soil Water Conserv. 2022, 29, 336–342. [Google Scholar] [CrossRef]
  49. Huang, M.Y.; Yue, W.Z.; Fang, B.; Feng, S.R. Scale Response Characteristics and Geographic Exploration Mechanism of Spatial Differentiation of Ecosystem Service Values in Dabie Mountain Area, Central China from 1970 to 2015. J. Geogr. Sci. 2019, 74, 1904–1920. [Google Scholar]
  50. Xu, Y.; Xu, X.R.; Tang, Q. Human Activity Intensity of Land Surface: Concept, Methods and Application in China. J. Geogr. Sci. 2016, 26, 1349–1361. [Google Scholar] [CrossRef]
  51. Peng, J.; Wang, Y.; Zhang, Y.; Wu, J.; Li, W.; Li, Y. Evaluating the effectiveness of landscape metrics in quantifying spatial patterns. Ecol. Indic. 2010, 10, 217–223. [Google Scholar] [CrossRef]
  52. Cui, J.C.; Guo, G.C. Research on Spatio-temporal Evolution of Urban Land-use Structure in Inter-Provincial Border Areas and the Influencing Factors: Based on Information Entropy Theory. Urban Probl. 2022, 33–42+65. [Google Scholar] [CrossRef]
  53. Chen, H.; Zhang, Y.J.; Wu, X.Y.; Yu, H.Y. Analysis of Urban Land Use Change based on ArcGIS and Information Entropy Method in Jilin Province. China Soft Sci. Mag. 2020, S1, 181–186. [Google Scholar]
  54. Huang, M.Y.; Fang, B.; Yue, W.Z.; Feng, S.R. Spatial Differentiation of Ecosystem Service Values and its Geographical Detection in Chaohu Basin during 1995–2017. Geogr. Res. 2019, 74, 1904–1920. [Google Scholar]
  55. Pan, L.L.; Wu, N. Evaluation of Ecosystem Services Value of Eco-redline Region in Anhui Province. J. Anhui Agric. Sci. 2020, 48, 52–59. [Google Scholar]
  56. Yu, H.X.; Wang, Y.X. Spatio-temporal Evolution of Ecosystem Service Value and its Spatial Heterogeneity Mechanism in the Dongjiang River Basin, China. Chin. J. Appl. Ecol. 2023, 1–12. [Google Scholar] [CrossRef]
  57. Yuan, S.; Zhu, C.A.-O.; Yang, L.; Xie, F. Responses of Ecosystem Services to Urbanization-Induced Land Use Changes in Ecologically Sensitive Suburban Areas in Hangzhou, China. Int. J. Environ. Res. Public Health 2019, 16, 1124. [Google Scholar] [CrossRef]
  58. Lu, X.H.; Li, J.; Liu, C.; Kuang, B.; Cai, D.W.; Hou, J. Driving Factors and Spatial Differentiation of Urban Land Green Use Efficiency in China. Sci. Geogr. Sin. 2022, 42, 611–621. [Google Scholar] [CrossRef]
  59. Shang, X.; He, Z.Q.; Zhang, T.H. Spatio-temporal Variation of NDVI and Geographical Detection of its Driving Factors in the ‘Grain for Green’ Project in Northern Shaanxi. Ecol. Sci. 2022, 41, 66–76. [Google Scholar] [CrossRef]
  60. Wang, X.F.; Ma, X.; Feng, M.; Zhou, C.W.; Fu, B.J. Spatial-temporal Characteristics of Trade-off and Synergy of Ecosystem Services in Key Vulnerable Ecological Areas in China. Acta Ecol. Sin. 2019, 39, 7344–7355. [Google Scholar]
  61. Zhang, K.; Lv, Y.H.; Fu, B.J.; Yin, L.C.; Yu, D.D. The Effects of Vegetation Coverage Changes on Ecosystem Service and their Threshold in the Loess Plateau. J. Geogr. Sci. 2020, 75, 949–960. [Google Scholar]
  62. Geng, T.W.; Chen, H.; Zhang, H.; Shi, Q.Q.; Liu, D. Spatiotemporal Evolution of Land Ecosystem Service Value and its Influencing Factors in Shaanxi Province based on GWR. J. Nat. Resour. 2020, 35, 1714–1727. [Google Scholar]
  63. Fu, W.; Lv, Y.H.; Fu, B.J.; Hu, W.Y. Landscape Ecological Risk Assessment Under the Influence of Typical Human Activities in Loess Plateau, Northern Shaanxi. J. Ecol. Rural Environ. 2019, 35, 290–299. [Google Scholar] [CrossRef]
Figure 1. The location map of the study.
Sustainability 15 12550 g001
Figure 2. The Sankey map of land-use change.
Sustainability 15 12550 g002
Figure 3. The polar map of sub-ESVs.
Sustainability 15 12550 g003
Figure 4. The distribution map of ESVs. (ad) represent the characteristics of ESVs in 1990, 2000, 2010, 2020, respectively.
Sustainability 15 12550 g004
Figure 5. The evolution map of ESV hotspot areas. (ad) represent the evolution of ESV hotspot areas in 1990, 2000, 2010, 2020, respectively.
Sustainability 15 12550 g005
Figure 6. The 3D waterfall map of driver contribution.
Sustainability 15 12550 g006
Table 1. ESV likely driving factors.
Primary IndicatorsSpecific IndicatorsData Source
natural factorstemperature (X1)China Meteorological Data Sharing Network
(http://data.cma.cn/) (accessed on 3 January 2023)
DEM data from Geospatial Data Cloud
(http://www.gscloud.cn/) (accessed on 3 January 2023)
slope (X2)
precipitation (X3)
elevation (X4)
socio-economic factorsGDP per land (X5)Statistical Yearbook of Shaanxi Province, Statistical Yearbook of Yan’an City, Statistical Yearbook of Yulin City; Calculated with reference to the relevant literature [50]
urbanization rate (X6)
population density (X7)
human activity intensity (X8)
landscape pattern factorslandscape diversity (X9)SHDI and AI indices were selected in Fragstats 4.2 landscape categories to represent landscape diversity and landscape connectivity, respectively [51]
landscape connectivity (X10)
policy factorafforestation area (X11)Statistical Yearbook of Shaanxi Province, Statistical Yearbook of Yan’an City, Statistical Yearbook of Yulin City
Table 2. Equivalent factor value per unit area in the study area.
Service TypeLand Type
Primary TypeSecondary TypeArable LandForest LandGrasslandWater AreaUnused Land
supply servicesfood production108832329983913
raw material production51274344046738
water resource supply26384243696626
regulation servicesgas regulation858244315451710141
climate regulation461730940853771128
environmental purification128214213495858397
hydrological regulation3464783299280,974269
support servicessoil conservation1319297418822074166
nutrient cycling maintenance15422714516013
biodiversity166270817126672154
cultural servicesaesthetic landscape771188756423964
Table 3. Land-use changes and information entropy.
Land TypeParameter1990200020102020
arable landarea/hm2329,423.22328,995.02242,727.01238,988.24
proportion43.11%43.05%31.76%31.27%
forest landarea/hm281,979.4785,135.25112,421.75112,809.56
proportion10.73%11.14%14.71%14.76%
grasslandarea/hm2347,502.87344,613.32401,803.35400,981.28
proportion45.47%45.09%52.58%52.47%
water areaarea/hm22694.062511.122415.632552.97
proportion0.35%0.33%0.32%0.33%
construction landarea/hm22382.392698.754718.367678.23
proportion0.31%0.35%0.62%1.00%
unused landarea/hm2249.39248.88114.571183.85
proportion0.03%0.03%0.01%0.15%
information entropy H0.43480.43770.44960.4602
equilibrium degree J0.55870.56250.57770.5914
dominance degree I0.56520.43750.42230.4086
Table 4. ESV changes in different land types.
Land TypeESVs/MillionRate of Change/%
19902000201020201990–20002000–20102010–20201990–2020
arable land169,156.36 168,942.07 124,705.76 122,775.06 −0.13 −26.18 −1.55 −27.42
forest land206,778.78 214,937.26 283,831.14 284,811.82 3.95 32.05 0.35 37.74
grassland536,803.68 532,217.03 620,347.87 619,120.54 −0.85 16.56 −0.20 15.33
water area30,639.62 28,550.51 27,440.95 28,998.83 −6.82 −3.89 5.68 −5.36
unused land35.13 35.10 16.07 166.52 −0.08 −54.20 935.88 374.02
Table 5. The contribution of land changes to ESVs.
Mode1990–20002000–20102010–2020
Land-Use ConversionESVs Change/Billion YuanContribution/%Land-Use ConversionESVs Change/Billion YuanContribution/%Land-Use ConversionESVs Change/Billion YuanContribution/%
improvement1→34951.7 81.1 1→330,578.7 44.29 1→34172.1 79.00
2→3254.4 4.2 1→22918.6 4.23 2→3519.6 9.84
1→2113.7 1.9 2→3266.3 0.39 1→2245.0 4.64
4→370.3 1.2 6→384.5 0.12 5→3150.1 2.84
4→129.00 0.5 4→341.9 0.06 4→330.0 0.57
Total5419.1 88.7 Total33,890.149.09 Total5116.8 96.89
degradation3→15101.1 63.5 3→12893.2 19.41 3→13439.4 49.27
3→21118.5 13.9 3→2942.3 6.32 3→5878.1 12.58
2→175.4 0.9 1→5262.1 1.76 3→2634.7 9.09
1→556.1 0.7 3→5252.1 1.69 3→6461.2 6.61
3→444.2 0.6 2→1107.7 0.72 1→5218.0 3.12
Total6395.3 79.6 Total4457.3 29.90 Total5631.4 80.67
Note: 1–6 stand for arable land, forest land, grassland, water area, construction land, and unused land, severally; 1→2 represents the conversion of arable land to forest land.
Table 6. Interaction factor detection in 2020.
X1X2X3X4X5X6X7X8X9X10X11
X10.202
X20.227 **0.115
X30.265 **0.268 *0.022
X40.959 *0.492 **0.999 *0.455
X50.979 **0.971 **0.999 **0.999 **0.965
X60.2279 **0.227 **0.268 **0.959*1 **0.205
X70.979 **0.971 **0.999 **0.999 **0.966 **1 **0.965
X80.268 **0.181 **0.268 *0.533 **0.971 **0.268 **0.971 **0.157
X90.268 **0.268 *0.053 **0.999 *0.999 **0.268 **0.999 **0.268 *0.025
X101 *0.971 *1 *1 **0.971 **1 *0.971 **0.971 *1 *0.565
X110.979 **1 **1 *0.948 **0.979 **1 **0.979 **1 **1 *1 **0.924
Note: ** denotes bifactor enhancement; * denotes nonlinear enhancement.
Disclaimer/Publisher’s Note: The statements, opinions and data contained in all publications are solely those of the individual author(s) and contributor(s) and not of MDPI and/or the editor(s). MDPI and/or the editor(s) disclaim responsibility for any injury to people or property resulting from any ideas, methods, instructions or products referred to in the content.

