Article

Postsecondary Students’ Social Stress and Learning Styles

Department of Agricultural Leadership, Education, and Communications, Texas A&M University, College Station, TX 77843, USA
*
Author to whom correspondence should be addressed.
Sustainability 2023, 15(16), 12540; https://doi.org/10.3390/su151612540
Submission received: 15 June 2023 / Revised: 3 August 2023 / Accepted: 15 August 2023 / Published: 18 August 2023
(This article belongs to the Section Sustainable Education and Approaches)

Abstract

:
Postsecondary students can experience anxiety or stress upon initial entry into large campus classrooms or education abroad settings. Social phobia scrutiny fears combined with social interaction anxieties may culminate in social anxiety disorder or social stress. Social stress may negatively affect one’s enjoyment and fulfillment of learning and one’s ability to learn. This study investigated relationships between students’ social stress, educational setting, learning style, and demographics using the Social Phobia Scale, Social Interaction Anxiety Scale, and the Learning Styles Inventory. Through a multiple correlational design, quantitative analysis revealed that social stress was positively associated with reflective observation and assimilative learning styles, but negatively associated with active experimentation learning styles for 144 students at a large southern US university. Females and on-campus students experienced more social stress than did males or those who participated in education abroad. Multiple linear regression revealed a significant increased level of social stress among minority students. About 18% of the variance in social stress was accounted for by significant independent variables (accommodative and convergent learning styles, being male, and Caucasian). Increased understanding of associations between social stress and learning style will help educators develop learning activities that promote inclusiveness for all. Continued research is needed to learn how to decrease social stressors in postsecondary education, especially for female and minority students to enable equitable learning spaces.

1. Introduction

Some postsecondary students experience anxiety or stress upon entering new learning situations like first-time entry into large campus classrooms or education abroad settings. These stressors may negatively affect one’s ability to learn, enjoyment, and fulfillment of learning. Social phobia scrutiny fears (i.e., fear of being observed or watched during routine activities) and social interaction anxieties (i.e., distress caused by common social interaction in groups) interact to create social anxiety disorder (SAD) or social stress. SAD is a persistent and intense fear of being embarrassed, humiliated, or negatively evaluated in social situations [1]. It is one of the most common psychiatric disorders, typically occurring between ages 8 and 15 years, and occurs more frequently in women than in men [2,3,4]. However, men are more likely than women to seek treatment. SAD can trigger behavioral tendencies to avoid situations that cause social stress, including some on-campus [5,6] and education abroad activities [7]. Avoidance behaviors can impair occupational and/or social development beyond academia [1], and these behaviors could be linked with learning styles.
Postsecondary students’ learning styles may conflict with instructors’ expectations of traditional in-class participation or instructor/classmate behaviors within groups, which can cause social stress, especially for those with SAD [8]. Previous research shows significant relationships exist between learning styles and anxiety (stress) levels in education. For example, the transition from high school to college can produce multiple relationship stressors (i.e., family, romantic, peer, and faculty) that affect new college students’ learning [9]. For some, being away from home and parents, and making new friends in college while maintaining old high school friendships, worsens students’ perceptions of ideal vs. actual collegiate experiences [10]. Mahmoud et al. [10] found young college students experienced increased levels of depression, anxiety, and stress. Conley et al. [11] found personal wellbeing and social stress shared an inverse relationship. We postulate that increased social stress, for whatever reason, is associated with decreased wellbeing and learning in on-campus settings. The inverse may be true, too; decreased social stress correlates with increased wellbeing and learning.
However, associations between social stress and preferred learning style are not bound to on-campus situations only and could be exacerbated in education abroad settings. More students are returning to education abroad since COVID-19 pandemic travel restrictions were lifted; understanding the associations between social stress and learning styles can foster improved pre-travel programming for education abroad students. For example, Nickols et al. [12] found students’ anxieties and intra-group relationships produced significant stress for those participating in international service-learning programs. The authors found that social stress morphed from an individual (i.e., nervous anxieties about international travel) to a group (e.g., annoyance, intolerance for others) level. Such outcomes beg the question: Do meaningful relationships exist between social stress and learning style in differing educational settings?
Social phobia scrutiny fears develop when we perceive others are observing our actions and/or while participating in activities in the presence of others [13]. Common activities that produce social phobia scrutiny fears among students include walking to class, finding a seat in a crowded classroom, or simply being looked at by another person [14,15]. Such fears may affect academic performance negatively, thereby decreasing one’s quality of life and collegiate experience. Social interaction anxiety occurs when an aversion to interacting with others outside one’s common group [13] develops because of increased awareness of self-conscious behaviors. In postsecondary education, when socially anxious students are required to interact with others such as when completing group assignments, they may experience social stress [8]. According to Kolb and Kolb [16], anxious students may not fully realize their learning potential because their anxieties inhibit their engagement with others.
Social stress is particularly evident among female college students. Ulutürk Akman [17] found that women were exposed to more social pressure (especially in terms of attire) at much higher rates than men, resulting in gender inequality between men and women. This difference could indicate that women may make alternative education abroad choices than men. Social pressure increases with age and education (in terms of marital status). Prowse et al. [18] found social stress caused by the COVID-19 pandemic affected female and male college students differently. Females, more so than males, experienced the pandemic’s negative effects on their academic success, social isolation, stress levels, and mental health. Other studies [19,20] found females experienced negative effects of social stress on their quality of life (physical and psychological domains) significantly more often than males during the pandemic.
Significant associations exist between stress, academic performance, and demographic variables other than sex. Stress and academic performance were significantly associated in studies focused on class status [21,22] and race or ethnicity [21,23,24]. In general, younger undergraduates had significantly more occurrences of self-perceived poor mental health, which negatively affected academic performance. Racial tensions on campus contributed to psychological distress among college students [23]. In contrast, foreign countries may have differing attitudes about class, race, and ethnicity than in the US, which could impact students’ social stress levels abroad. Several studies revealed that significant associations exist between academic achievement, stress, and learning styles [16,25,26,27].
Kolb’s [28] Experiential Learning Theory (ELT), inspired by the works of John Dewey, Kurt Lewin, Carl Jung, Jean Piaget, and Carl Rogers, informed the framework for this study. Kolb and Kolb’s [16] ELT has six propositions: (1) learning is best conceived as a process, not in terms of outcomes; (2) all learning is relearning; (3) learning requires the resolution of conflicts between dialectically opposed phases of adaptation to the world; (4) learning is a holistic process of adaptation to the world; (5) learning results from synergetic transactions between the person and the environment; and (6) learning is the process of creating knowledge (pp. 6–7). This study’s framework centered on ELT propositions 4 through 6 to help us understand whether and how students’ social stress in domestic and education abroad settings may be correlated with their learning styles and/or selected demographics.
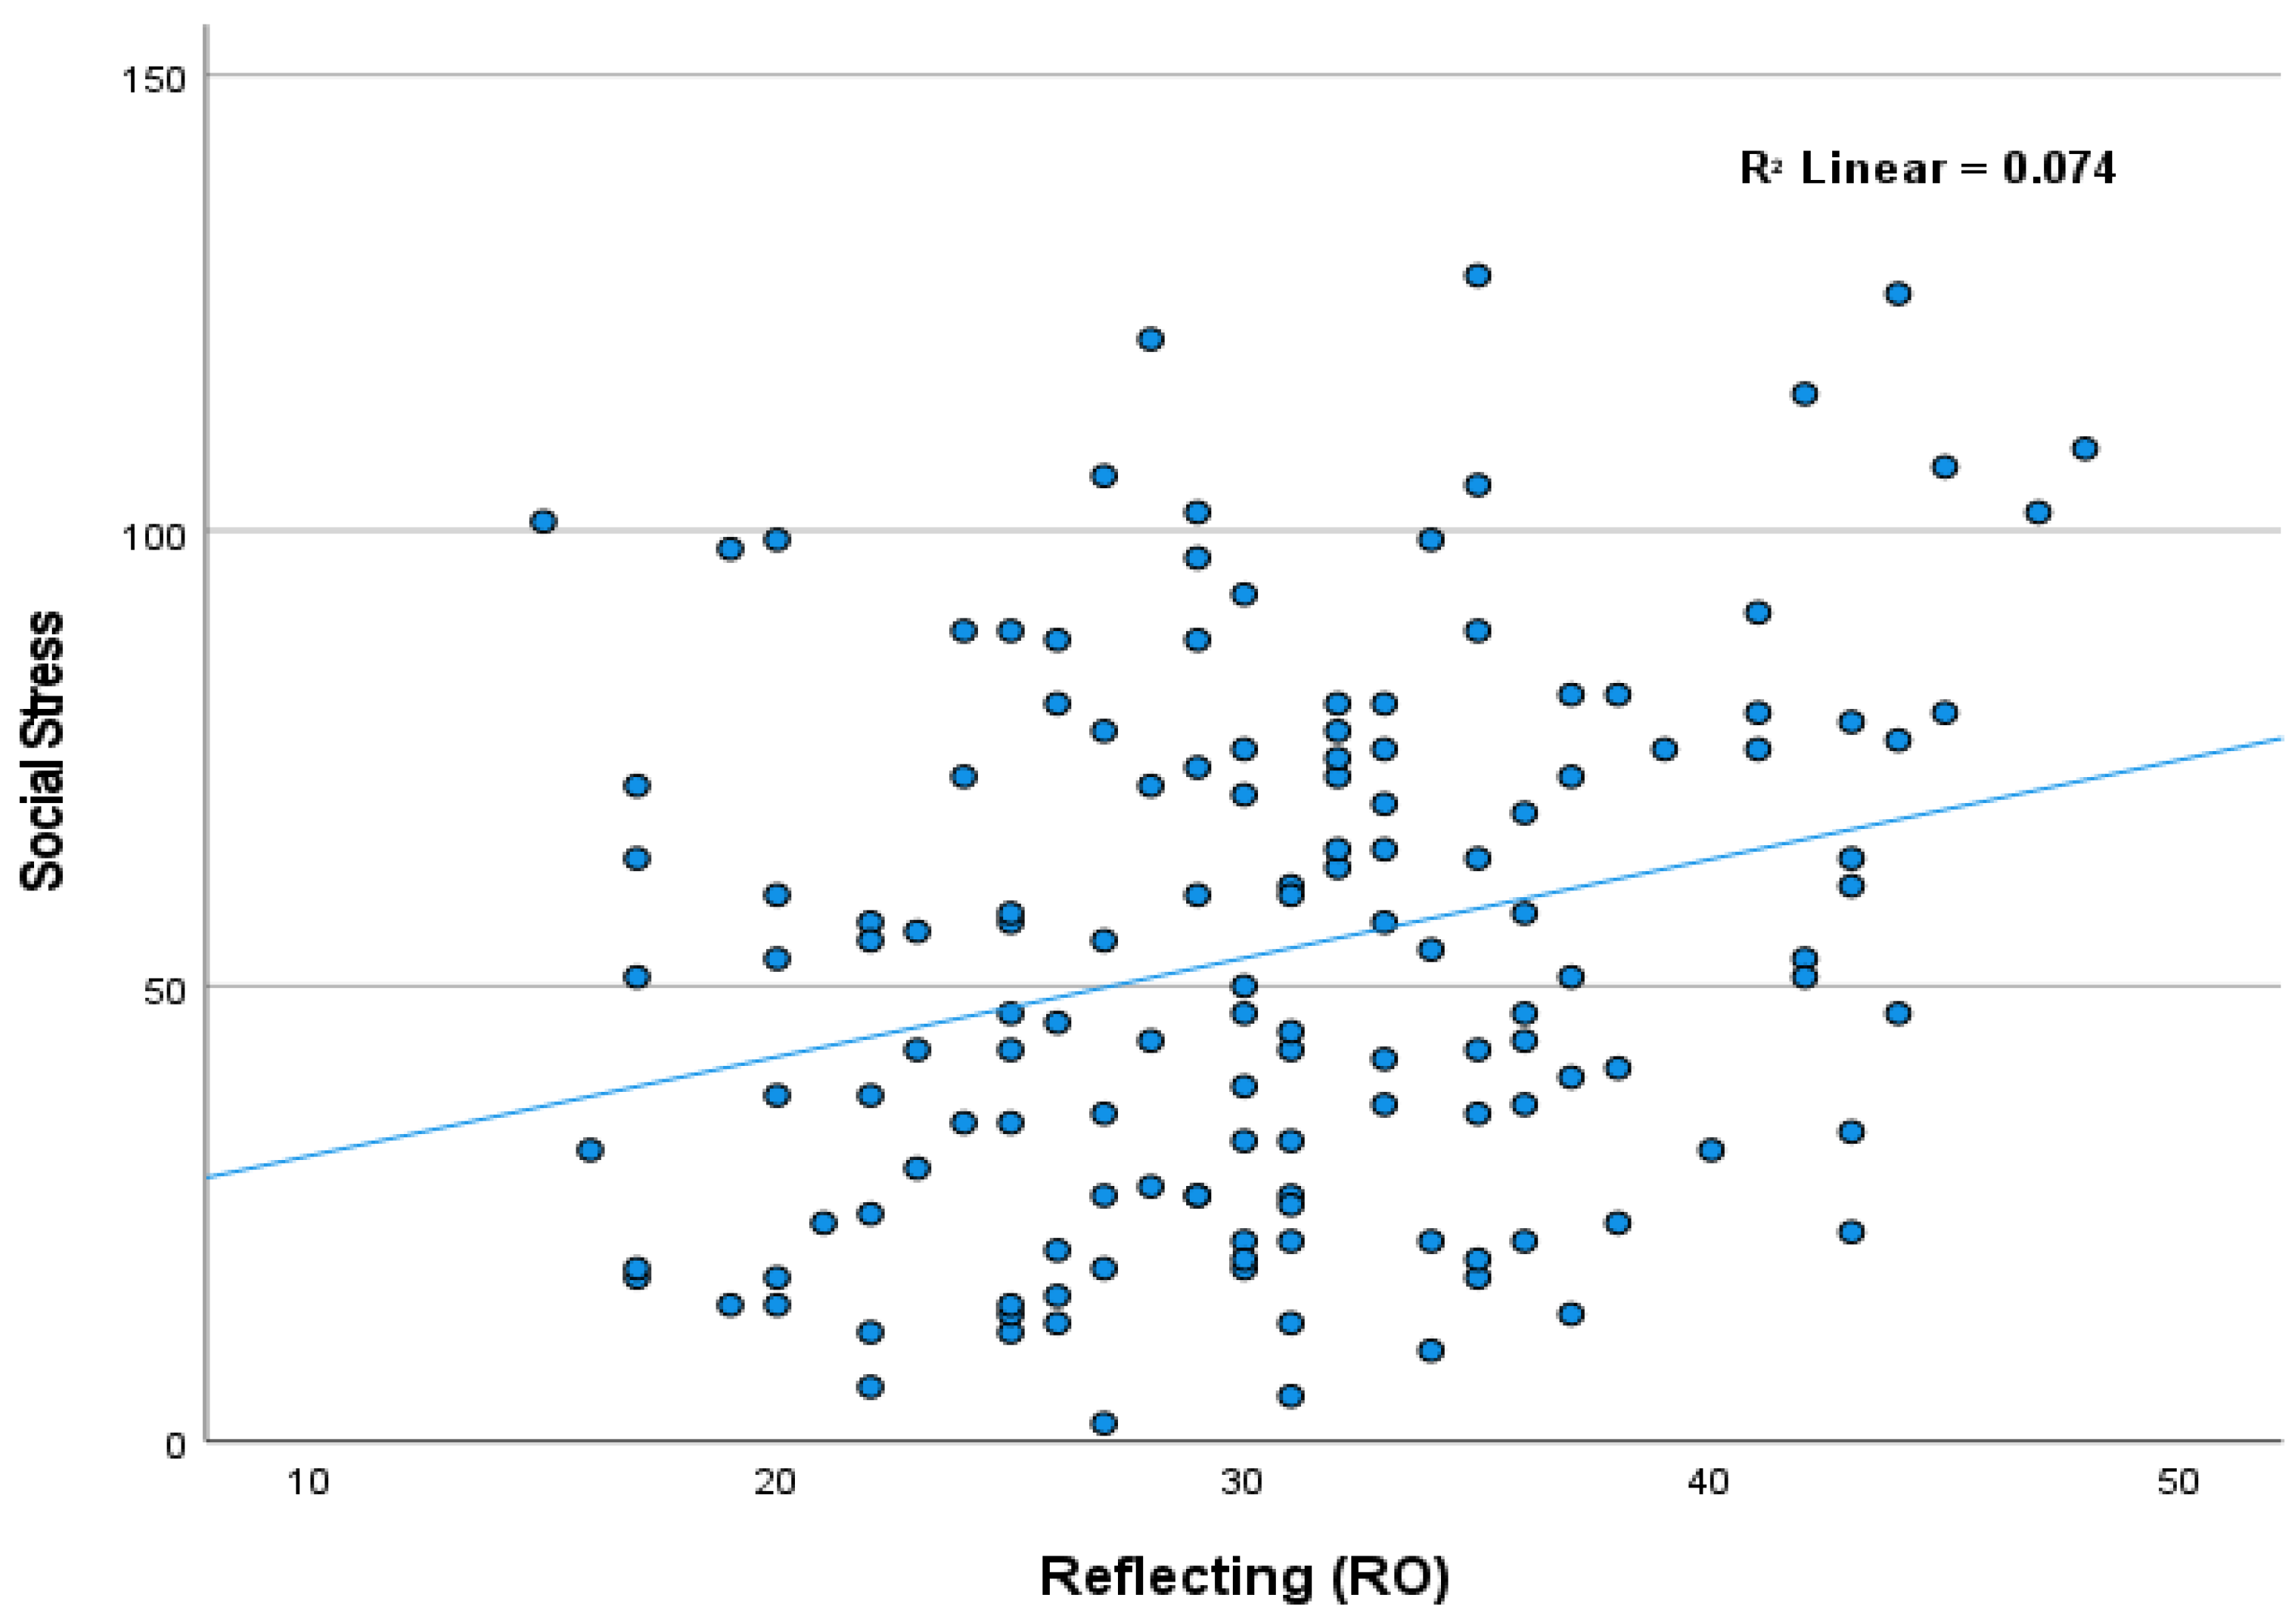
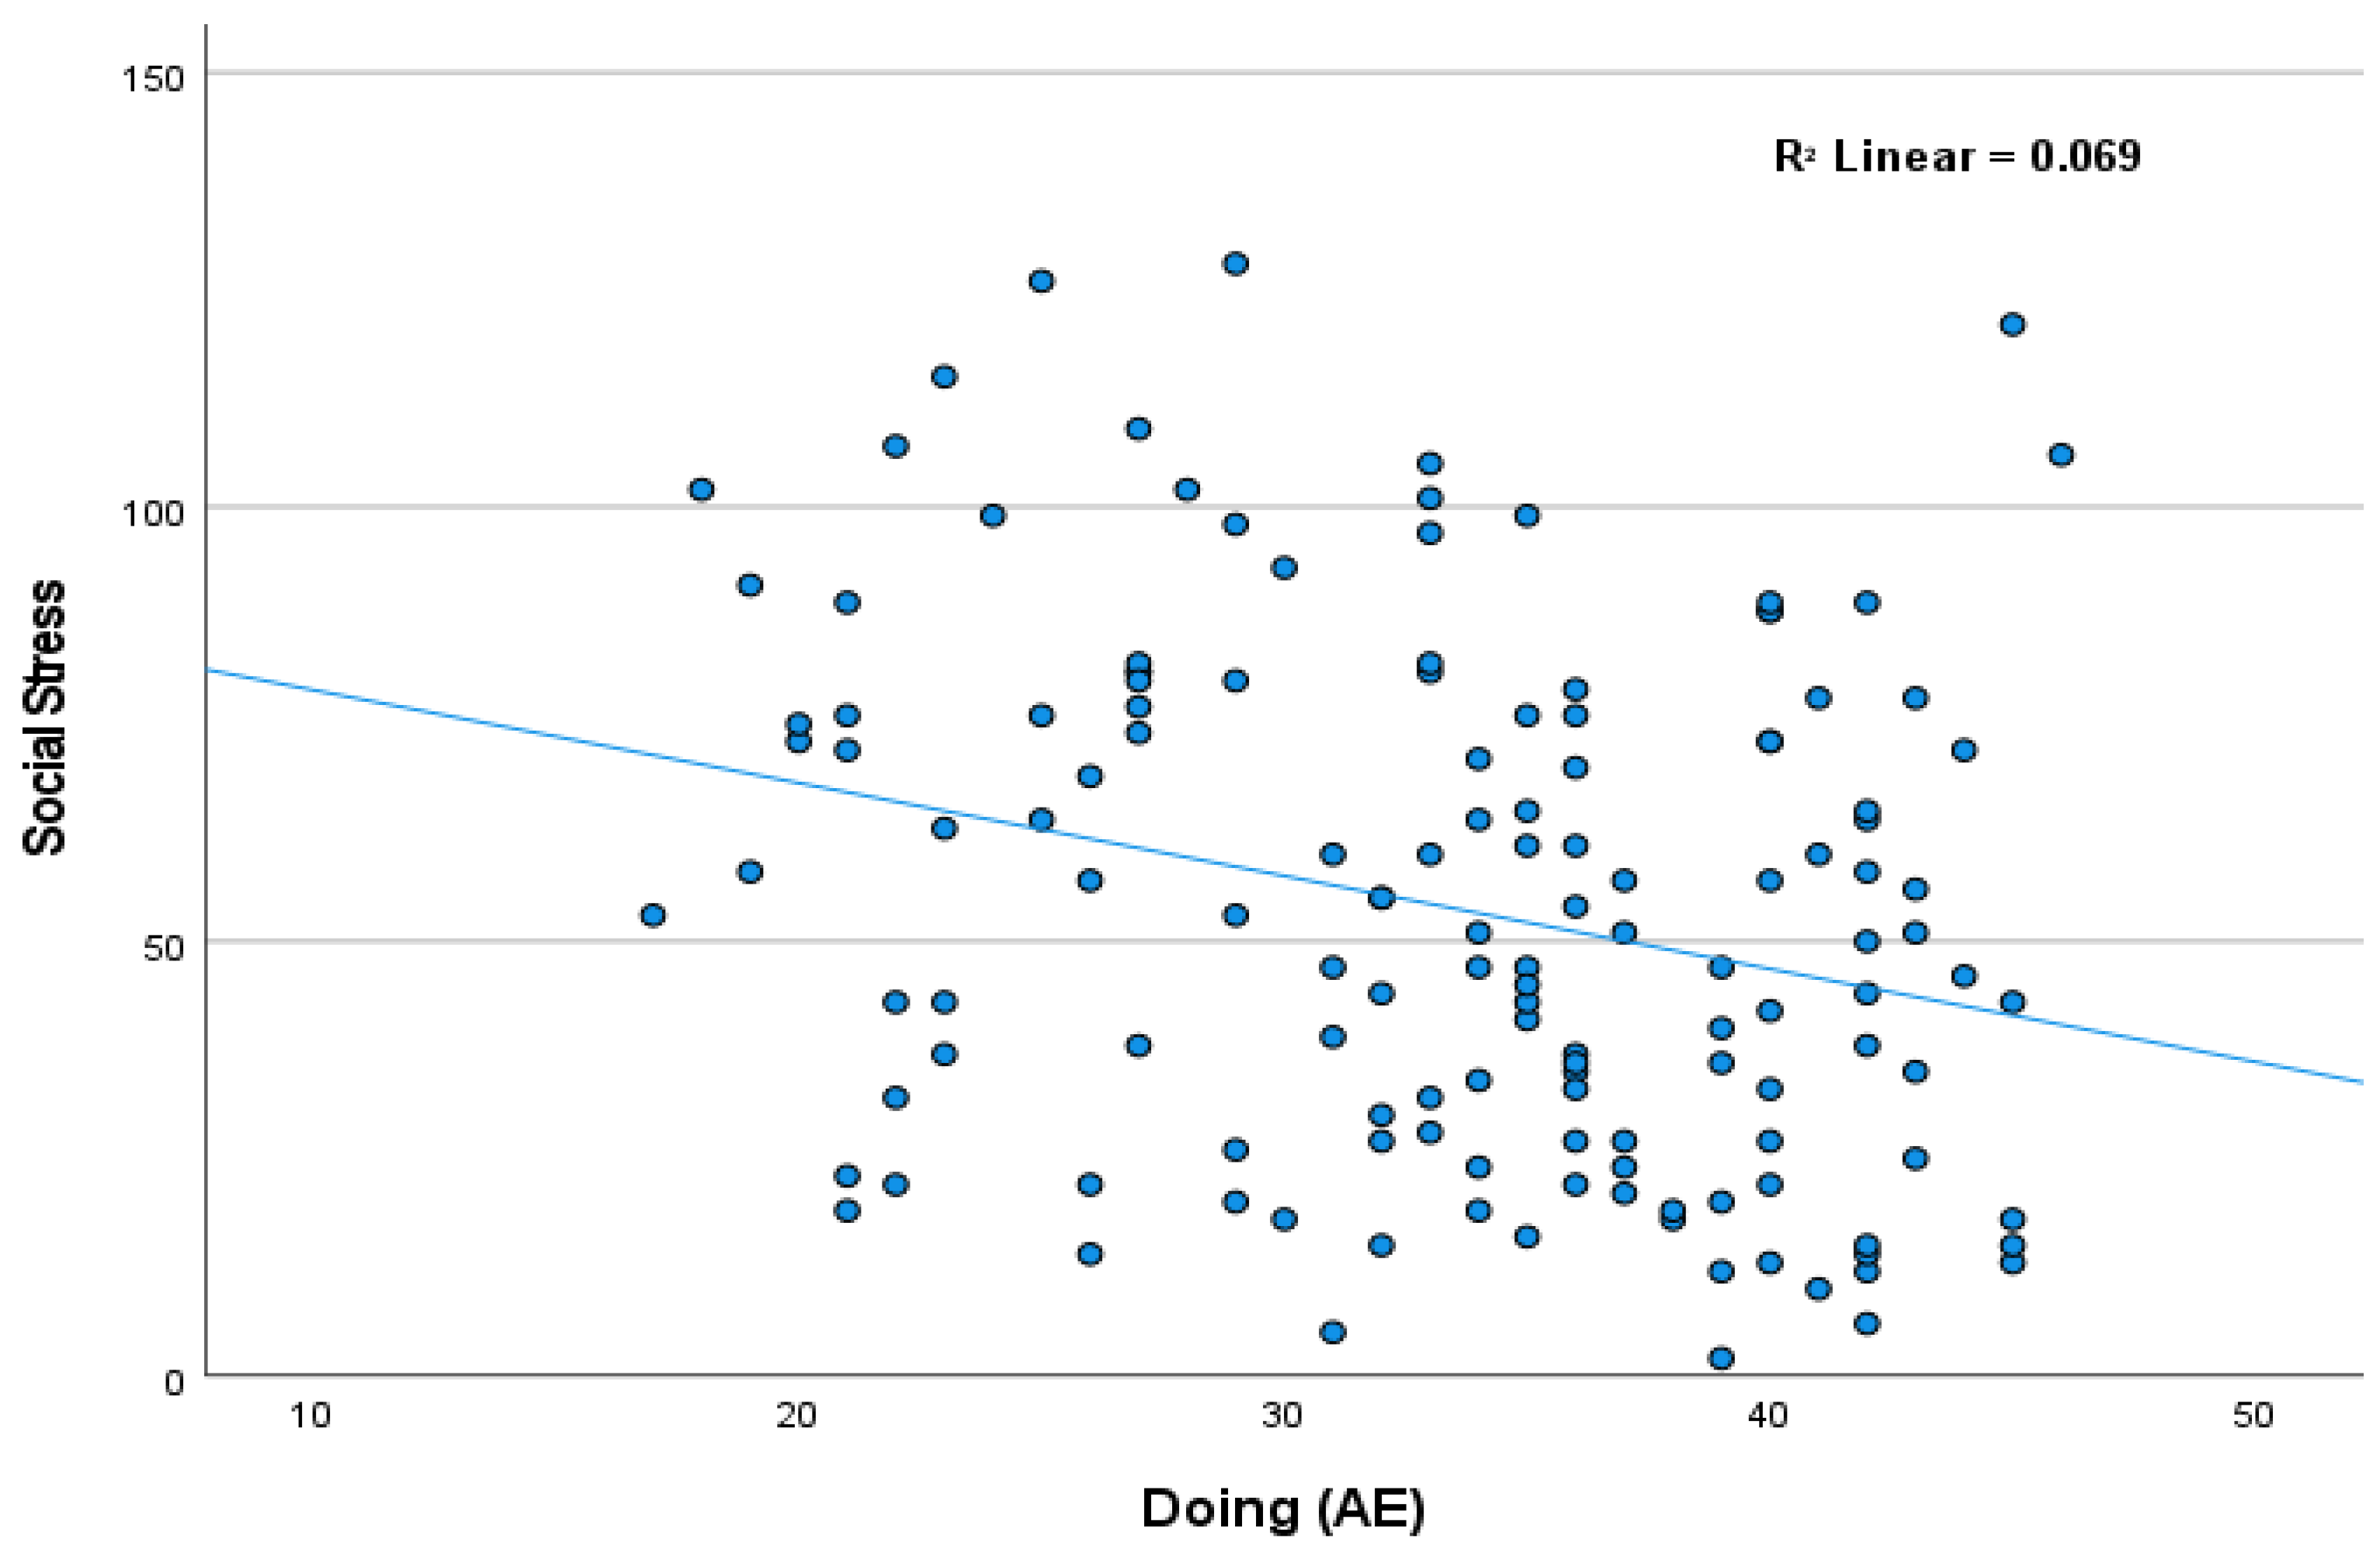
The Learning Styles Inventory (LSI) is a well-known and often-used measure to gauge how we gather new information and transform it into meaningful experience [16]. The LSI (12-item instrument) produces four preferred learning modes: concrete experience, reflective observation, abstract conceptualization, and active experimentation. Concrete experience learners prefer to gather new information through sensory stimulation. Reflective observation is preferred when new information is gathered primarily through abstract analysis. Neither information gathering preference produces learning until it is processed and transformed into meaningful knowledge. The LSI’s two information processing modes are abstract conceptualization and active experimentation. Abstract conceptualization learners prefer to process or transform theoretical principles into meaningful knowledge through intellectual activities (i.e., learning by reflecting). In contrast, active experimentation learners prefer knowledge acquisition through active or experiential processes (i.e., learning by doing).
This study investigated the relationships between students’ social stress, preferred learning style, and demographic variables in domestic and education abroad environments. An increased understanding of these relationships may be useful when developing learning activities that promote inclusiveness for all learners, regardless of the educational setting. The research objectives were to:
  • Determine whether relationships exist between students’ social stress, educational setting, preferred learning styles, and/or selected demographics (sex, race/ethnicity, class).
  • Discover whether students’ preferred learning styles, educational setting, and/or selected demographics contribute to social stress.
In addition to the research objectives, two hypotheses were tested:
H1. 
Social stress, educational setting, preferred learning style, and selected demographics are associated.
H2. 
Social stress can be explained by educational setting, preferred learning style, and selected demographics.

2. Materials and Methods

A multiple correlational design [29,30] was used to examine the relationships between college students’ social stress, educational setting, preferred learning styles, and selected demographic variables. The dependent variable was social stress. Independent variables were educational setting (i.e., on-campus vs. education abroad), preferred learning styles (LSI descriptors), sex (i.e., male vs. female), race/ethnicity (i.e., white vs. non-white) and class (i.e., underclassmen vs. upperclassmen). Dependent and independent variables were ascertained after their natural occurrence.

2.1. Population and Data Collection

The target population (N ≈ 75,000) represented students at a large southern US university. The accessible population (n ≈ 4000) included students enrolled in courses with global or international in the course title or description during spring 2022 and those who had participated in education abroad opportunities from 2020 to 2022. Stratified random samples were determined (after university ethics review board approval; IRB2021-1065M) using Dillman et al.’s [31] methods for deriving probability samples. We calculated a conservative 50/50 split with a 5% sampling error and a 95% confidence level. These parameters produced a sample of ~374, which would represent the accessible population; we rounded the sample to 400. Personalized survey invitations and reminders [31] were sent five times using a secure online platform (Qualtrics), where participants confirmed their informed consent prior to participation. The total responses were 144 (36%), which were reduced to 140 usable responses because of incomplete and/or missing data, resulting in a 35% response rate, which may influence the generalization of the results. Previous research [32] indicates that the average response rates for online surveys in educational settings is 35.1%, 95% CI.

2.2. Instrumentation

The study instrument included three sections plus demographics. First, social stress was measured with statements that could trigger anxious behavior. The respondents rated themselves on the degree to which they believed the statement was characteristic or true for them. A social stress score was derived from the summed scores of two instruments: the Social Phobia Scale (SPS) and Social Interaction Anxiety Scale (SIAS). The SPS is a 20-item instrument with a five-point scale of responses ranging from 0 (not at all characteristic or true of me) to 4 (extremely characteristic or true of me) [13]. The total scores could range from 0 to 80; higher scores indicated an elevated level of social phobia scrutiny fears. Example items for the SPS included: I get nervous that people are staring at me as I walk down the street; I get panicky that others might see me faint or be sick or ill; I am worried people will think my behavior is odd. The SIAS is a 19-item instrument that was deemed valid and reliable for use with college-aged participants [13]. The items were presented with a similar five-point scale (0 = not at all characteristic or true of me to 4 = extremely characteristic or true of me). The total scores could range from 0 to 76 with higher scores indicating elevated levels of social phobia scrutiny fears. SIAS example items included: I have difficulty making eye contact with others; I feel tense if I am alone with just one person; I’m nervous mixing with people that I don’t know well. The summed SPS (M = 25.11, SD = 15.31; range = 68) and SIAS (M = 28.58, SD = 16.16; range = 71) scales exhibited excellent reliability indices (measures of internal consistency, as derived from Cronbach’s alphas) (αs = 0.93 and 0.95, respectively). Social stress, a combination of SPS and SIAS, is a more accurate depiction of participants’ overall social anxieties and fears. The social stress scale (M = 53.69, SD = 29.71; range = 126) had excellent scale reliability (α = 0.97).
Second, students’ preferred learning styles were measured using Kolb’s LSI [28], which is a stable measure of learning style preference [33]. The LSI has 12 open-ended statements with four ending responses. The respondents were asked to recall a recent situation where they had to learn something new, and then rank each of four closing responses from 1 (least like you) to 4 (most like you) to complete the open-ended statement. The summed scores for each LSI learning mode produces scores for abstract conceptualization (AC), concrete experience (CE), active experimentation (AE), and reflective observation (RO). These four learning mode scores are combined to produce two outcome scores for preferences in gathering information (AC–CE) and transforming (AE–RO) it into experience. When AC and CE produce positive scores, abstract learning is preferred, while negative AC and CE scores indicate a preference for concrete learning. AE and RO scores combine to produce active (positive score) or reflective (negative score) learning preferences. AC–CE and AE–RO scores are then used to determine one of four preferred learning styles (Accommodator, Diverger, Converger, or Assimilator). Post hoc reliability tests revealed Cronbach’s coefficient alphas ranged from 0.80 (CE), to 0.82 (AE), and 0.83 (RO and AC), which were deemed reliable for data analyses and interpretation. The Cronbach’s alphas for the AC-CE combined score were 0.61, and 0.60 for AE-RO combined score, which were acceptable for data analyses based on Ursachi et al.’s [34] comment that “…alpha of 0.6–0.7 indicates an acceptable level of reliability” (p. 681). Upon completion of the LSI portion of the study instrument, the respondents were reminded that the LSI only provides a general idea of how we perceive ourselves as learners. Also, the LSI does not measure preferred learning styles with 100% accuracy.
Third, the participants were asked to report selected demographic variables such as sex, year in college, race/ethnicity, and whether they had participated in a university-sponsored education abroad experience. If they responded yes, they were asked to indicate which type of experience (e.g., field trip during spring break, short-term faculty-led program of 10–29 days, semester abroad, or year abroad). The experience type was not used in the results because of minimal variation (i.e., the majority of the responses were short-term faculty-led program of 10–29 days).

2.3. Data Analysis

Descriptive, bivariate, and multivariate analyses were used to interpret and report the data. Multichotomous choices in demographic questions were categorized into dichotomous responses for sex, race/ethnicity, and class. A significance level of 0.05 was set a priori for all inferential statistics. All data analysis was conducted on SPSS Version 28.

3. Results

3.1. Participants

Of the valid responses (N = 140), most respondents characterized themselves as white (64%), females (66%), in on-campus settings (66%), in their senior year (41%). Table 1 shows the frequencies and percentages for respondents’ demographics.

3.2. Social Stress

We measured students’ social stress (Table 2). Overall, students exhibited low social phobia scrutiny scores (M = 25.11, SD = 15.31, range = 68). “I can get tense when I speak in front of other people” was rated highest (M = 2.14, SD = 1.25), indicating the statement represented a moderately true characteristic. Six other SPS statements were rated as moderately true (M = 1.51–2.50), and two were rated as not at all true (M = 0.00–0.50). Low social interaction anxiety scores were found (M = 28.58, SD = 16.15, range = 71). “I find it easy to think of things to talk about” (M = 2.37, SD = 1.41) and “I am at ease meeting people at parties, etc.” (M = 2.28, SD = 1.47) were rated highest, indicating these statements were moderately true characteristic items for the respondents. Eight SIAS statements were rated as moderately true, and the other nine statements were rated as slightly characteristic or true (M = 0.51–1.50) (Table 2, descending means by subscale).

3.3. Preferred Learning Modes and Styles

We measured students’ preferred learning modes and styles using Kolb’s [28] LSI. The four possible learning modes included experiencing (CE), reflecting (RO), thinking (AC), and doing (AE). Participants most preferred learning mode was doing (M = 33.59, SD = 7.31, range = 29) (Table 3). The least preferred was experiencing (M = 24.97, SD = 7.20, range = 34), although all learning modes produced near equal outcomes.
Kolb’s [28] learning modes combine to produce four distinct learning styles (Table 4). Divergent learners use concrete experience and reflective observation (CE + RO) to derive meaningful knowledge from new information or experiences. Convergent learners rely on their preferred learning modes of abstract conceptualization and active experimentation (AC + AE). Assimilative learners rely on abstract conceptualization and reflective observation (RO + AC), while accommodative learners emphasize concrete experience and active experimentation (AE + CE). Table 4 shows frequencies for respondents’ preferred learning styles.

3.4. Associations between Social Stress and Learning Styles

We assessed the relationships between social stress and preferred learning styles. Social stress was positively associated with learning through reflective observation (RO) (r = 0.27, p = 0.001) and negatively associated with learning by active experimentation (AE) (r = −0.26, p = 0.002) (Table 5). H1 was supported by the significant association between social stress and preferred learning style. Regarding the significant probability that RO learners experience more social stress, perhaps it is because they might be more sensitive to being observed by others, thereby increasing their social phobia, fears, anxieties, and social stress. AE learners may be less concerned about being observed during routine activities or group interactions, resulting in less social stress. We presumed that students’ preferred learning modes were formed before their cognizance of social stress. Nevertheless, Pearson’s r is an association, not a causation test; therefore, we cannot infer that preferred learning modes or styles increase or decrease student social stress in educational settings. Social stress was positively associated with the assimilative (RO + AC) learning style (r = 0.24, p = 0.005). Assimilative learners prefer concise, logical approaches and absorb new experiences into larger frameworks of theory, concept, or idea.
Figure 1 illustrates the highly statistically significant positive linear association (r = 0.27, p = 0.001) between RO learners (i.e., reflective observation) and social stress. As the value for one variable increased, it also increased for the other.
Inversely, the highly statistically significant negative linear association (r = −0.26, p = 0.002) between AE learners (i.e., learning by doing) and social stress showed that as students’ preferences for AE learning increased, social stress scores decreased (Figure 2). AE learners might participate more often in unfamiliar social activities because they are less anxious about what others observe or think about them. The axiom, “do it first, ask questions later”, may describe this association.
Figure 3 shows the significant positive linear association (r = 0.24, p = 0.005) between the assimilative learning style and social stress. Assimilative learners rely on reflective observations and abstract conceptualization processes to create meaningful experience and/or knowledge from newly acquired information. Their social stress may be increased because of an increased awareness of being watched by others or developing observations about their own experiences during the learning process.

3.5. Associations between Social Stress, Educational Setting, and Demographics

We evaluated the associations between social stress, educational setting, and selected demographic variables (Table 6). Social stress was significantly negatively associated with education abroad (r = −0.19, p = 0.03) and positively associated with on-campus learning (r = 0.19, p = 0.03). Social stress was negatively correlated with being male (r = −0.32, p = 0.000) and positively associated with being female (r = 0.32, p = 0.000). On-campus students and females experienced more social stress than education abroad students or males. H1 was supported by the significant associations between social stress and educational setting. In terms of demographics, H1 was supported only by the significant association between social stress and sex.

3.6. Regression Analysis

We sought to explain the variance in social stress scores by examining the contributing independent variables. Considering significant associations between social stress, educational settings, learning styles, and selected demographics, we included all variables in the forced entry multiple regression procedure. In the first regression model (Table 7), 10 explanatory variables accounted for 22.2% of the variance in social stress scores, F(7, 132) = 5.38, p < 0.001, while the second model accounted for 18.3% of the explainable variation in the students’ social stress scores. H2 was supported by the significant amount of variance explained in social stress by the independent variables.
The amount of variance explained in the social stress scores was attributed to all statistically significant independent variables in the first regression model (Table 8). All assumptions were met except autocorrelation between residuals (Durbin–Watson value = 0.66). The residuals were positively correlated; however, because all data were collected via questionnaires from independent participants one time only, not as a time-series order to the same participants [29], an assumption of independent errors is not a concern in this regression.
As noted, the second regression model (Table 9) resulted in 18.3% of the variance in social stress scores being accounted for by significant independent variables: accommodative and convergent learning styles (t = −2.89 and −2.32 respectively), being male (t = −4.04), and race/ethnicity (t = −2.14). The variable race/ethnicity was just outside the rejection region in the first regression model; therefore, we included it in the second model, which proved useful in the final analyses (Table 9).

4. Discussion

Social stress is related to some postsecondary students’ preferred learning modes and styles, as found elsewhere [8,12]. According to Marilou [8], a student will have a high psychological cost in their academic performance when experiencing a form of social anxiety. Nikols [12] and Kolb [
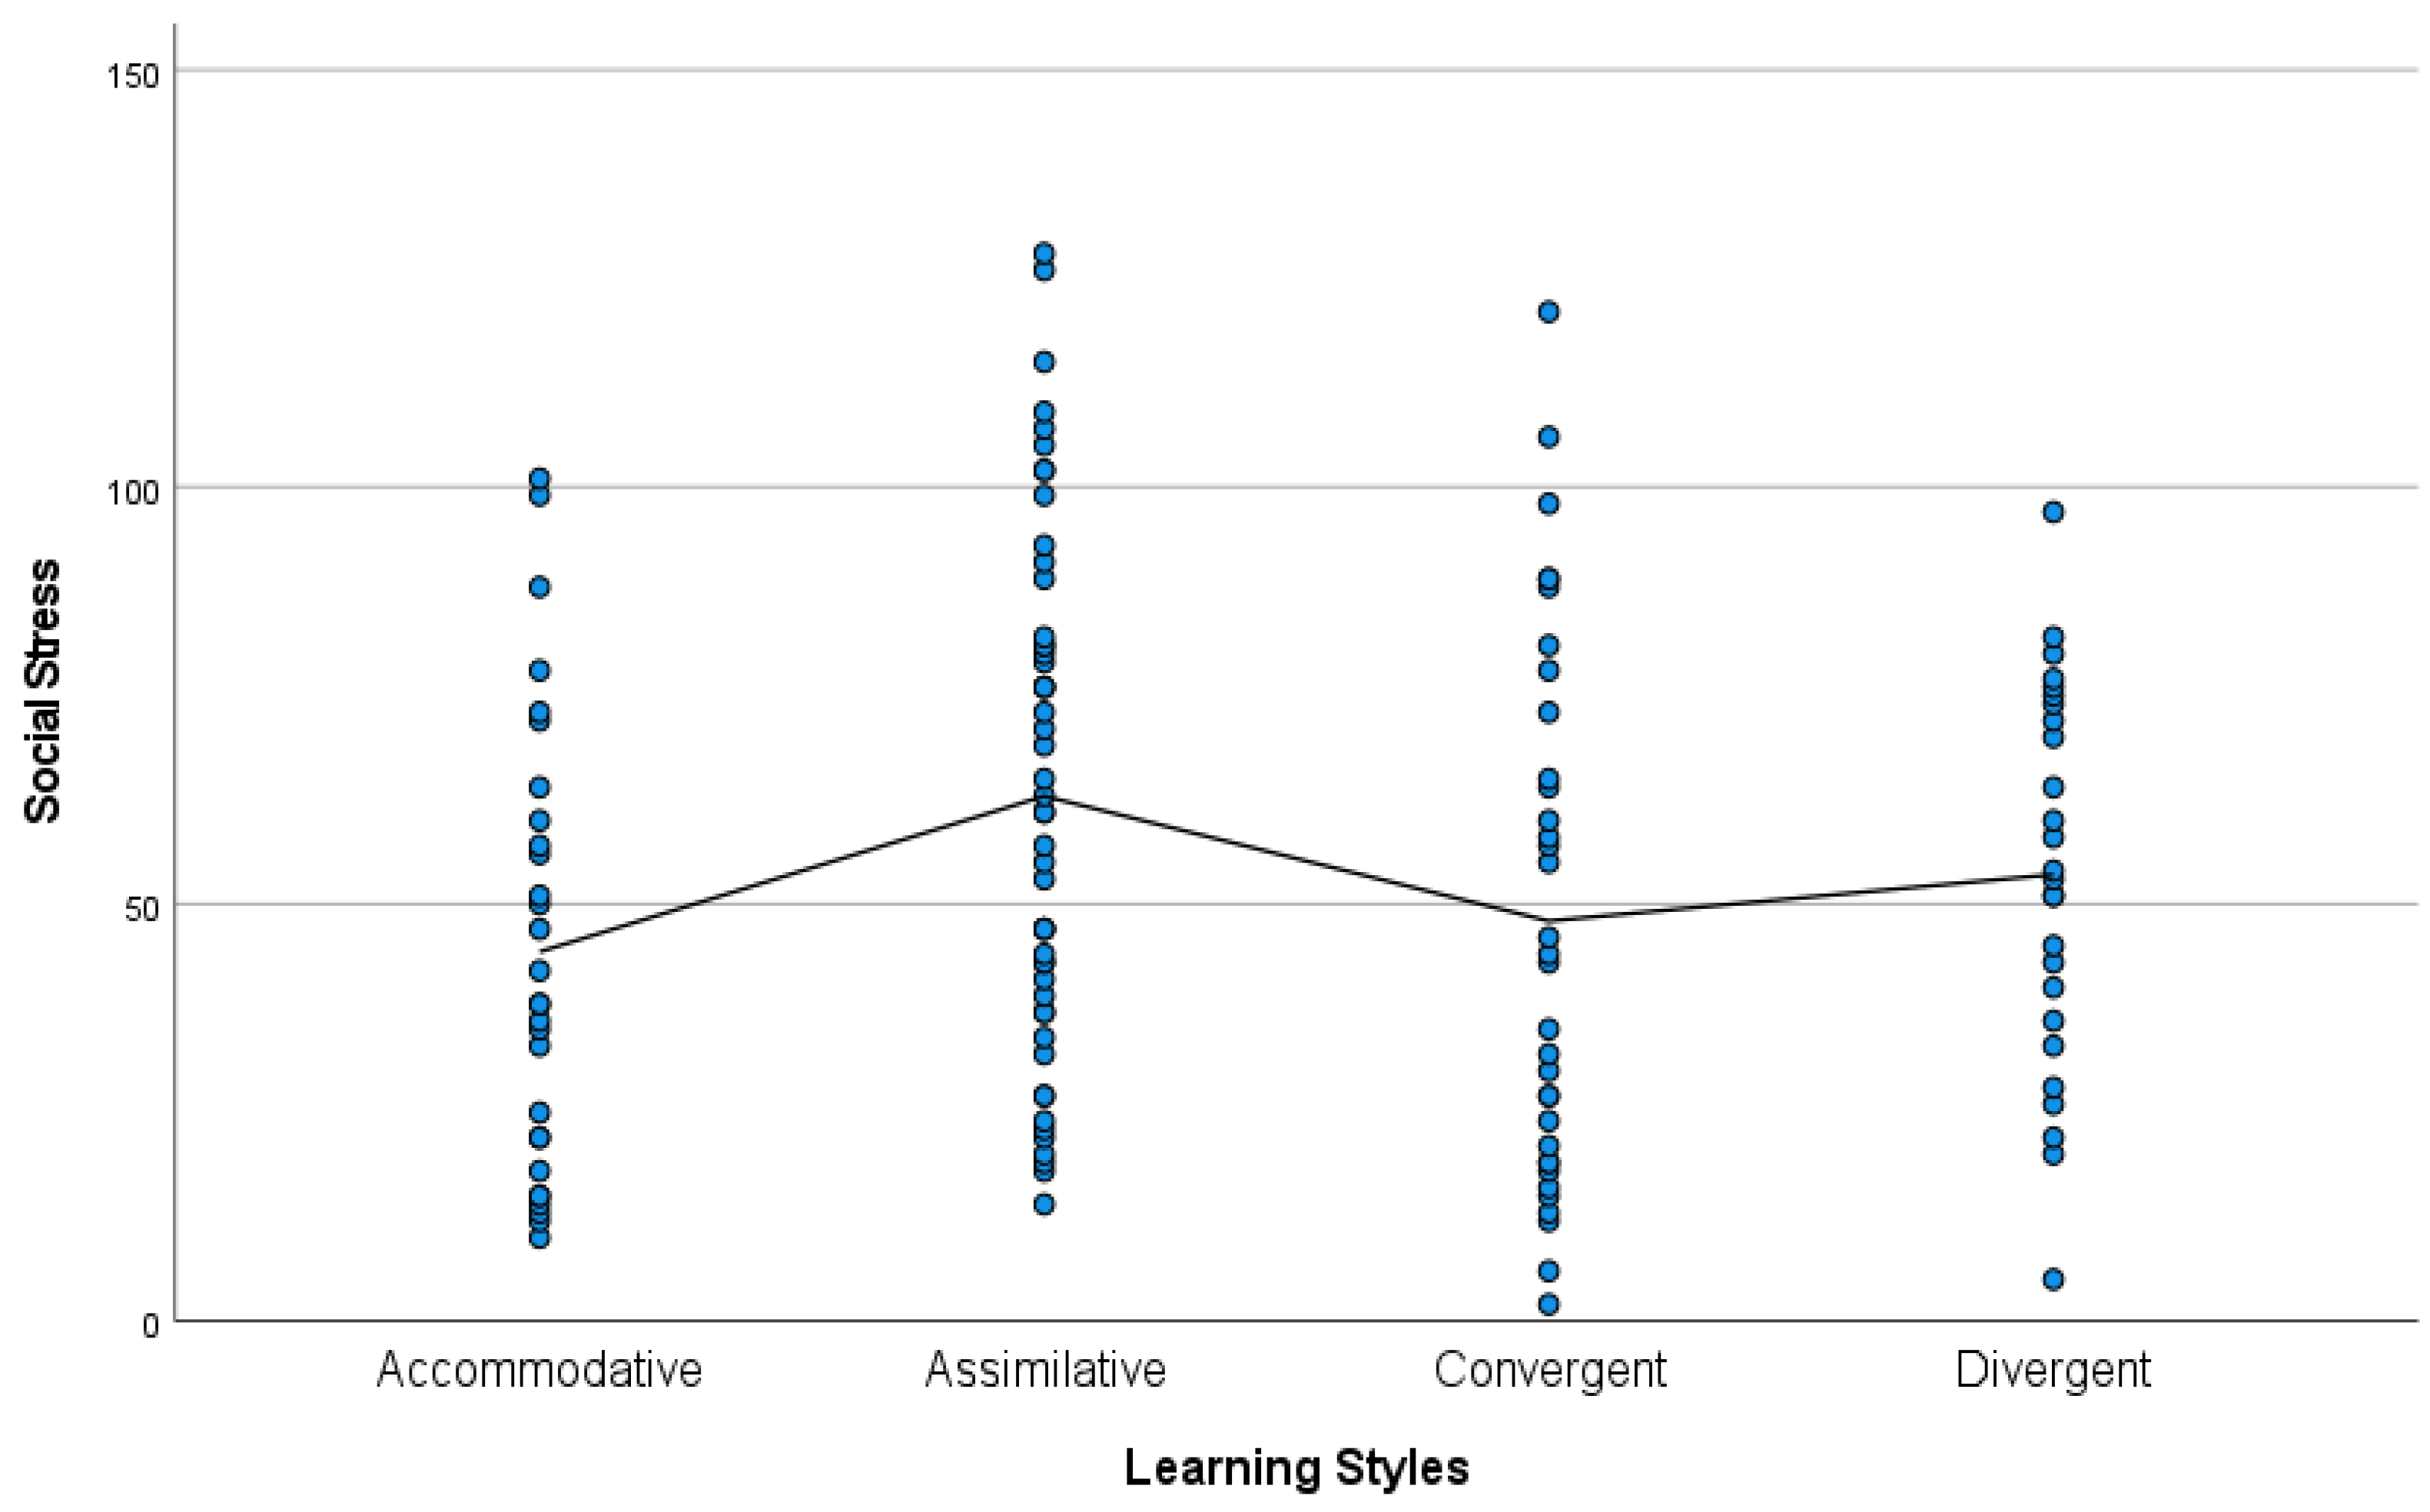
28] discovered that learning was affected when students encountered social stress in their academic studies. Almost 20% of the variance in the social stress scores was accounted for by a significant combination of learning style (accommodative and convergent) and being a white male. Significantly lower social stress scores can be explained by a preferred learning style for “action-oriented” situations. Accommodative and convergent learners’ curiosities are driven by questions such as “what would happen if I did this” or “how does this work?” They prefer independent and applicable learning environments. Perhaps their tendencies for active learning lowers their inhibitions about what others think or perceive of them as learners. The saying, “let’s do it, and ask for permission later,” could explain well those who experience lower social stress. Moreover, those lower stress levels may be amplified by being male and Caucasian. Our results concerning significant associations between elevated social stress, academic achievement, and non-Caucasian populations supports previous studies [21,23,24,35], but requires further investigation. Lower stress scores among white males could be due to the lower social pressure that men face in comparison to the social stress levels faced by women [17]. Less social stress among Caucasians in comparison to social stress levels among people of color could be due to the racial tensions experienced by people of color [23]. Increasing the likelihood of minority students’ success in the classroom, field, and society requires more insights on the factors affecting social stress, avoidance behaviors, disengagement, and lowered fulfillment of the postsecondary educational learning experience.
Student success is a top priority in academia. Our findings confirm previous results that decreasing social stress in classrooms is conducive to maintaining educational environments and promoting student success. Research [36] showed that if students perceived that their institution of higher education supported their own academic goals, those students would experience reduced stress in the university setting. These outcomes align with other research confirming positive [37] and negative relationships between student and university goals for education abroad [38]. Social stressors (i.e., cross-cultural adaptation, language barriers, assignment deadlines) affect academic performance, but educators can alleviate these stressors with purposeful planning both in and out of the classroom.
When designing classroom activities, educators should remember the variety of learning styles and how they can be linked to social stress. When incorporating reflecting activities, educators should take measures to decrease social stress such as encouraging working with students who understand or recognize cross-cultural differences and learning styles. Classroom activities that are focused on experimentation should be less concerned with alleviating social stress. Future research should focus on further identifying the relationship between social stress and learning style.
The negative correlation between education abroad versus the positive correlation of being on campus could be due to entry into a new environment and limited prior interactions with fellow students. The findings that females were more likely to experience social stress than males were consistent across several studies that examined relationships between stress and gender [18,19,20]. Maybe this finding is because of females’ perceptions of social status, presence, and/or equality in comparison to males’ perceptions of the same factors [17]. We believe more research is needed to examine the relationships between perceived social pressure and social stress. In addition, studying the relationships between gender, educational setting, and learning style might further reveal societal expectations of gender norms in campus-based classrooms and education abroad settings.

Author Contributions

Conceptualization, G.W.; methodology, G.W. and A.Z.; software, G.W.; validation, G.W. and A.Z.; formal analysis, G.W.; investigation, G.W.; resources, G.W.; data curation, G.W.; writing—original draft preparation, G.W. and A.Z.; writing—review and editing, G.W. and A.Z.; visualization, G.W.; supervision, G.W.; project administration, G.W. All authors have read and agreed to the published version of the manuscript.

Funding

This research received no external funding.

Institutional Review Board Statement

The study was conducted in accordance with the Declaration of Helsinki and approved by the Institutional Review Board (or Ethics Committee) of Texas A&M University (IRB2021-1065M and 31 August 2021). The HRPP determined on 31 August 2021, that this research meets the criteria for exemption in accordance with 45 CFR 46.104.

Informed Consent Statement

All subjects gave their informed consent for inclusion in the study when they agreed to the online Simple Survey Consent Script, which granted subjects entry to and participation in the study. All participants were informed fully that anonymity was assured, why the research was being conducted, how their data would be used, and whether there were any risks or benefits associated with participating in the study.

Data Availability Statement

The data presented in this study are available in SPSS v28 format only, upon request from the corresponding author. The data are not publicly available at this time.

Conflicts of Interest

The authors declare no conflict of interest.

References

  1. Substance Abuse and Mental Health Services Administration. DSM-5 Changes: Implications for Child Serious Emotional Disturbance [Internet]. Rockville (MD): Substance Abuse and Mental Health Services Administration (US). 2016 Jun. Table 16, DSM-IV to DSM-5 Social Phobia/Social Anxiety Disorder Comparison. Available online: https://www.ncbi.nlm.nih.gov/books/NBK519712/table/ch3.t12/ (accessed on 15 March 2022).
  2. Asher, A.; Asnaani, A.; Aderka, I.A. Gender differences in social anxiety disorder: A review. Clin. Psychol. Rev. 2017, 56, 1–12. [Google Scholar] [CrossRef] [PubMed]
  3. Wittchen, H.U.; Essau, C.A.; von Zerssen, D.; Krieg, J.C.; Zaudig, M. Lifetime and six-month prevalence of mental disorders in the Munich follow-up study. Eur. Arch. Psychi. Clin. Neurosci. 1992, 241, 247–258. [Google Scholar] [CrossRef] [PubMed]
  4. Wittchen, H.U.; Nelson, C.B.; Lachner, G. Prevalence of mental disorders and psychosocial impairments in adolescents and young adults. Psychol. Med. 1998, 28, 109–126. [Google Scholar] [CrossRef] [PubMed]
  5. Yonkers, K.A.; Dyck, I.R.; Keller, M.B. An eight-year longitudinal comparison of clinical course and characteristics of social phobia among men and women. Psychiatr. Serv. 2001, 52, 637–643. [Google Scholar] [CrossRef]
  6. Yonkers, K.A.; Bruce, S.E.; Dyck, I.R.; Keller, M.B. Chronicity, relapse, and illness--course of panic disorder, social phobia, and generalized anxiety disorder: Findings in men and women from 8 years of follow-up. Depress. Anxiety 2003, 17, 173–179. [Google Scholar] [CrossRef] [PubMed]
  7. Muto, T.; Hayes, S.C.; Jeffcoat, T. The effectiveness of acceptance and commitment therapy bibliotherapy for enhancing the psychological health of Japanese college students living abroad. Behav. Ther. 2011, 42, 323–335. [Google Scholar] [CrossRef] [PubMed]
  8. Marilou, I. “Home Sweet Home”: Precluding two sources of academic stress in higher education through distance/e-Learning. Georgian Electron. Sci. J. Edu. Sci. Psychol. 2010, 2, 29–39. Available online: https://eds.p.ebscohost.com/eds/pdfviewer/pdfviewer?vid=1&sid=f07a5256-525e-43a8-a53b-bb19dd65c3e6%40redis (accessed on 2 February 2022).
  9. Hurst, C.S.; Baranik, L.E.; Daniel, F. College student stressors: A review of the qualitative research. Stress Health 2013, 29, 275–285. [Google Scholar] [CrossRef]
  10. Mahmoud, J.S.R.; Staten, R.T.; Hall, L.A.; Lennie, T.A. The relationship among young adult college students’ depression, anxiety, stress, demographics, life satisfaction, and coping styles. Issues Ment. Health Nurs. 2012, 33, 149–156. [Google Scholar] [CrossRef]
  11. Conley, C.S.; Kirsch, A.C.; Dickson, D.A.; Bryant, F.B. Negotiating the transition to college. Emerg. Adulthood 2014, 2, 195–210. [Google Scholar] [CrossRef]
  12. Nickols, S.; Rothenberg, N.; Moshi, L.; Tetloff, M. International service-learning: Students’ personal challenges and intercultural competence. J. High. Educ. Outreach Engagem. 2013, 17, 97–124. Available online: https://openjournals.libs.uga.edu/jheoe/article/view/1070/1069 (accessed on 15 March 2022).
  13. Mattick, R.P.; Clarke, J. Development and validation of measures of social phobia scrutiny fear and social interaction anxiety. Behav. Res. Ther. 1998, 36, 455–470. [Google Scholar] [CrossRef] [PubMed]
  14. Glass, S. The Relationship between Self-Verification and Emotion Regulation. Master’s Thesis, University of North Carolina at Charlotte, Charlotte, NC, USA, 2022. Available online: http://proxy.library.tamu.edu/login?url=https://www.proquest.com/dissertations-theses/relationship-between-self-verification-emotion/docview/2756099987/se-2 (accessed on 17 March 2022).
  15. Jackson, K.K. Social Anxiety Reduction in the Context of Social Modeling Utilizing a Placebo Alcohol Beverage. Master’s Thesis, University of Arkansas, Fayetteville, AR, USA, 2019. Available online: http://proxy.library.tamu.edu/login?url=https://www.proquest.com/dissertations-theses/social-anxiety-reduction-context-modeling/docview/2381604861/se-2 (accessed on 20 March 2022).
  16. Kolb, A.Y.; Kolb, D.A. Kolb Learning Style Inventory Workbook; Version 3.2; HayGroup: Philadelphia, PA, USA, 2013. [Google Scholar]
  17. Ulutürk Akman, S. Gender inequality and social pressure: Analysis on the life satisfaction survey of the Turkish Statistical Institute. EKOIST J. Econom. Stat. 2021, 35, 83–109. [Google Scholar] [CrossRef]
  18. Prowse, R.; Sherratt, F.; Abizaid, A.; Gabrys, R.L.; Hellemans, K.G.C.; Patterson, Z.R.; McQuaid, R.J. Coping with the COVID-19 pandemic: Examining gender differences in stress and mental health among university students. Front. Psychiatry 2021, 12, 650759. [Google Scholar] [CrossRef] [PubMed]
  19. Matud, M.; Díaz, A.; Bethencourt, J.; Ibáñez, I. Stress and psychological distress in emerging adulthood: A gender analysis. J. Clin. Med. 2020, 9, 2859. [Google Scholar] [CrossRef]
  20. Paro, H.B.; Silveira, P.S.; Perotta, B.; Gannam, S.; Enns, S.C.; Giaxa, R.R.; Bonito, R.F.; Martins, M.A.; Tempski, P.Z. Empathy among medical students: Is there a relation with quality of life and burnout? PLoS ONE 2014, 9, e94133. [Google Scholar] [CrossRef] [PubMed]
  21. Rafal, G.; Gatto, A.; DeBate, R. Mental health literacy, stigma, and help-seeking behaviors among male college students. J. Am. Coll. Health 2018, 66, 284–291. [Google Scholar] [CrossRef] [PubMed]
  22. Wyatt, T.; Oswalt, S.B. Comparing mental health issues among undergraduate and graduate students. Am. J. Health Educ. 2013, 44, 96–107. [Google Scholar] [CrossRef]
  23. Byrd, D.R.; McKinney, K.J. Individual, interpersonal, and institutional level factors associated with the mental health of college students. J. Am. Coll. Health 2012, 60, 185–193. [Google Scholar] [CrossRef]
  24. Posselt, J.R.; Lipson, S.K. Competition, anxiety, and depression in the college classroom: Variations by student identity and field of study. J. Coll. Stud. Dev. 2016, 57, 973–989. [Google Scholar] [CrossRef]
  25. Gargallo López, B.; Almerich Cerveró, G.; Suárez Rodríguez, J.M.; García Félix, E.; Garfella Esteban, P.R. Learning styles and approaches to learning in excellent and average first-year university students. Eur. J. Psychol. Educ. 2013, 28, 1361–1379. [Google Scholar] [CrossRef]
  26. Ghazivakili, Z.; Norouzi Nia, R.; Panahi, F.; Karimi, M.; Gholsorkhi, H.; Ahmadi, Z. The role of critical thinking skills and learning styles of university students in their academic performance. J. Adv. Med. Educ. Prof. 2014, 2, 95–102. Available online: https://jamp.sums.ac.ir/article_40898.html (accessed on 5 May 2022).
  27. Yazici, K. The relationship between learning style, test anxiety and academic achievement. Univers. J. Educ. Res. 2017, 5, 61–71. Available online: https://files.eric.ed.gov/fulltext/EJ1124612.pdf (accessed on 7 June 2022). [CrossRef]
  28. Kolb, D.A. Experiential Learning: Experience as the Source of Learning and Development; Prentice-Hall: Englewood Cliffs, NJ, USA, 1984; Volume 1. [Google Scholar]
  29. Field, A.P. Discovering Statistics Using IBM SPSS Statistics, 4th ed.; SAGE: Thousand Oaks, CA, USA, 2015. [Google Scholar]
  30. Fraenkel, J.R.; Wallen, N.E.; Hyun, H. How to Design and Evaluate Research in Education, 10th ed.; McGraw-Hill: Boston, MA, USA, 2019. [Google Scholar]
  31. Dillman, D.A.; Smyth, J.D.; Christian, L.M. Internet, Phone, Mail, and Mix-Mode Surveys: The Tailored Design Method, 4th ed.; John Wiley Sons: Hoboken, NJ, USA, 2014. [Google Scholar]
  32. Wu, M.; Young, J.; Zhao, L.; Clark, K. Examining factors that impact the response rate of electronic surveys: An updated meta-analysis. In Proceedings of the Annual Meeting of American Educational Research Association, Vancouver, BC, Canada, 14 April 2012. [Google Scholar]
  33. Kolb, A.Y.; Kolb, D.A. Learning styles and learning spaces: Enhancing experiential learning in higher education. Acad. Manag. Learn. Educ. 2005, 4, 193–212. [Google Scholar] [CrossRef]
  34. Ursachi, G.; Horodnic, I.A.; Zait, A. How reliable are measurement scales? External factors with indirect influence on reliability estimators. Procedia Econ. Financ. 2015, 20, 679–686. [Google Scholar] [CrossRef]
  35. Assari, S.; Bazargan, M. Unequal associations between educational attainment and occupational stress across racial and ethnic groups. Int. J. Environ. Res. Public Health 2019, 16, 3539. [Google Scholar] [CrossRef] [PubMed]
  36. Bui, H.T.N.; Selvarajah, C.; Vinen, D.G.; Meyer, D. Acculturation: Role of student–university alignment for international student psychological adjustment. J. Stud. Intl. Educ. 2021, 25, 546–564. [Google Scholar] [CrossRef]
  37. Zimmermann, J.; Schubert, K.; Bruder, M.; Hagemeyer, B. Why going the extra mile? A longitudinal study on sojourn goals and their impact on sojourners’ adaptation. Intl. J. Psychol. 2016, 52, 425–435. [Google Scholar] [CrossRef]
  38. Yang, Y.; Zhang, Y.; Sheldon, K.M. Self-determined motivation for studying abroad predicts lower culture shock and greater well-being among international students: The mediating role of basic psychological needs satisfaction. Int. J. Intercult. Relat. 2018, 63, 95–104. [Google Scholar] [CrossRef]
Figure 1. Relationship between social stress and reflecting (i.e., learning by reflecting).
Sustainability 15 12540 g001
Figure 2. Relationship between social stress and doing (i.e., learning by doing).
Sustainability 15 12540 g002
Figure 3. Relationship between social stress and the assimilative learning style.
Sustainability 15 12540 g003
Table 1. Frequencies of respondents’ demographics (N = 140).
VariableCategoriesf%
Groups
On-campus9366.4
Education abroad4733.6
Sex
Female9366.4
Male4733.6
Race/Ethnicity
White9064.3
Hispanic2719.3
Asian117.9
Black75.0
Another race or ethnicity53.6
Class
Senior5841.3
Junior3323.6
Sophomore2517.9
Another class1510.7
Freshman96.4
Table 2. Descriptive statistics for social stress (N = 140).
ScalesItemsMSD
SPS
I can get tense when I speak in front of other people2.141.25
I feel awkward and tense if I know people are watching me1.881.27
I feel self-conscious if I enter a room where others are already seated1.841.33
I can suddenly become aware of my own voice of others listening to me1.811.21
I get nervous that people are staring at me as I walk down the street1.571.20
I am worried people will think my behavior is odd1.551.18
I worry I might do something to attract the attention of other people1.531.22
I become self-conscious when using public toilets1.411.16
I fear I may blush when I am with others1.271.30
I become anxious if I write in front of other people1.191.21
I would get tense if I had to carry a tray across a crowded cafeteria1.141.11
I get panicky that others might see me faint, or be sick or ill1.081.28
When in an elevator, I am tense if people look at me1.081.07
It would make me feel self-conscious to eat in front of a stranger at a restaurant1.051.10
I worry about shaking or trembling when I’m watched by other people1.001.22
I can feel conspicuous standing in a line0.971.06
I would get tense if I had to sit facing other people on a bus or a train0.860.99
I worry I’ll lose control of myself in front of other people0.811.06
I worry my head will shake or nod in front of others0.480.90
I would find it difficult to drink something if in a group of people0.470.75
SIAS
I find it easy to think of things to talk about *2.371.41
I am at ease meeting people at parties, etc. *2.281.47
I become tense if I speak about myself or my feelings2.051.25
I’m nervous mixing with people that I don’t know well1.921.23
I get nervous if I speak with someone in authority (teacher, boss)1.821.16
I find myself worrying that I won’t know what to say in social situations1.751.29
I am unsure whether to greet someone I know only slightly1.711.23
I worry about expressing myself in case I appear awkward1.691.22
When I’m mixing in a group, I find myself worrying I will be ignored1.651.28
I feel I’ll say something embarrassing when talking1.561.30
I have difficulty talking to attractive persons of the opposite [a different] sex1.451.30
I’m tense mixing in a group1.371.18
I have difficulty making eye contact with others1.261.14
When mixing socially, I am uncomfortable1.241.04
I find it difficult to disagree with another’s point of view1.211.22
I have difficulty talking with other people1.111.04
I find it difficult mixing comfortably with the people I work with1.031.08
I tense up if I meet an acquaintance in the street1.031.07
I feel tense if I am alone with just one person1.001.00
SPS = Social Phobia Scale; SIAS = Social Interaction Anxiety Scale. Total N is too small to use the data as a normative outcome. Data are for descriptive purposes. SPS and SIAS instructions: Indicate the degree to which you feel the statement is characteristic or true of you. Scale: 0 = not at all, 1 = slightly, 2 = moderately, 3 = very, and 4 = extremely. * Negatively worded statements were reverse coded before reliability and summed data analyses.
Table 3. Descriptive statistics for preferred learning modes (N = 140).
Subscales aRangeMinMaxMSD
Doing (AE)29174633.597.31
Thinking (AC)32144630.987.18
Reflecting (RO)33154830.557.43
Experiencing (CE)34124624.977.20
a AC = Abstract Conceptualization, AE = Active Experimentation, CE = Concrete Experience, RO = Reflective Observation. Subscale scores could range from 12–48.
Table 4. Frequencies of preferred learning styles (N = 140).
Learning Stylesf%
Assimilative (RO + AC)5136.4
Convergent (AC + AE)3424.3
Accommodative (AE + CE)2920.7
Divergent (CE + RO)2618.6
AC = Abstract Conceptualization, AE = Active Experimentation, CE = Concrete Experience, RO = Reflective Observation.
Table 5. Relationships between social stress and learning modes and styles (N = 140).
Learning Modes aLearning Styles b
Variables23456789
1. Social Stress−0.060.27 **0.04−0.26 **−0.160.24 **−0.110.00
2. CE −0.38 **−0.40 **−0.19 *0.47 **−0.41 **−0.35 **0.41 **
3. RO −0.20 *−0.44 **−0.39 **0.58 **−0.44 **0.18 *
4. AC −0.38 **−0.50 **0.34 **0.38 **−0.32 **
5. AE 0.43 **−0.52 **0.41 **−0.26 **
6. AE + CE −0.39 **−0.29 **−0.24 **
7. RO + AC −0.43 **−0.36 **
8. AC + AE −0.27 **
9. CE + RO
a CE = Concrete Experience, RO = Reflective Observation, AC = Abstract Conceptualization, AE = Active Experimentation. b AE + CE = Accommodative, RO + AC = Assimilative, AC + AE = Convergent, CE + RO = Divergent. ** p < 0.01 (two-tailed), * p < 0.05 (two-tailed).
Table 6. Relationships between social stress, educational setting, and demographics (N = 140).
Variables234567
1. Social stress−0.19 *0.19 *0.32 **−0.32 **−0.13−0.14
2. Education abroad −1.00 **−0.010.010.01−0.06
3. On-campus 0.01−0.01−0.010.06
4. Female −1.00 **−0.01−0.12
5. Male 0.010.12
6. RaceCat a 0.04
7. ClassCat b
a Race/ethnicity was collapsed into two categories (RaceCat = white vs. non-white). b Class was collapsed into two categories (ClassCat = underclassmen vs. upperclassmen). ** p < 0.01 (two-tailed), * p < 0.05 (two-tailed).
Table 7. R Square Comparison.
Models aRR2Adj. R2S.E.Durbin–Watson
Model 1 Summary b0.4710.2220.18126.890.657
Model 2 Summary c0.4280.1830.15927.240.589
a Dependent Variable: Social stress. b Predictors: (Constant), ClassCat, Convergent, RaceCat, On-campus, Male, Divergent, Accommodative. c Predictors: (Constant), RaceCat, Male, Convergent, Accommodative.
Table 8. Summary of regression on the dependent and independent variables: Model 1 a.
SourcesSSdfMSFp
Regression27,226.0873889.445.38 *<0.001
Residual95,453.72132723.13
Total122,679.79139
Variables bBSE BBetatp
(Social Stress)88.2412.33 7.15<0.001
Accommodative−18.906.55−0.26−2.89 *0.005
Convergent−13.865.97−0.20−2.32 *0.022
Divergent−9.226.60−0.12−1.400.165
On-campus8.295.010.131.650.100
Male−19.724.88−0.31−4.04 *<0.001
RaceCat (white vs. non-white)−8.994.85−0.15−1.860.066
ClassCat (under vs. upper)−6.965.37−0.10−1.300.197
a Dependent Variable: Social stress. b Predictors: (Constant), ClassCat, Convergent, RaceCat, On-campus, Male, Divergent, Accommodative. R2 = 0.22, adjusted R2 = 0.18. * p < 0.05.
Table 9. Summary of regression on the dependent and independent variables: Model 2 a.
SourcesSSdfMSFp
Regression22,490.8845622.727.58 *<0.001
Residual100,188.92135742.14
Total122,679.79139
Variables bBSE BBetatp
(Social Stress)81.177.69 10.56<0.001
Accommodative−18.776.02−0.26−3.12 *0.002
Convergent−11.115.61−0.16−1.98 *0.050
Male−20.164.89−0.32−4.12 *<0.001
RaceCat (white vs. non-white)−10.414.87−0.17−2.14 *0.034
a Dependent Variable: Social stress. b Predictors: (Constant), RaceCat, Male, Convergent, Accommodative. R2 = 0.18, adjusted R2 = 0.16. * p < 0.05.
Disclaimer/Publisher’s Note: The statements, opinions and data contained in all publications are solely those of the individual author(s) and contributor(s) and not of MDPI and/or the editor(s). MDPI and/or the editor(s) disclaim responsibility for any injury to people or property resulting from any ideas, methods, instructions or products referred to in the content.

