1. Introduction
The issue of climate change has become one of the most severe tests faced by human society. This test not only threatens the survival and development of human beings but also makes human beings face challenges from the aspect of energy security. The recognition that economic growth cannot serve as a substitute for sustainable social and environmental development has become widely acknowledged. Sustainable development necessitates the integration of economic, social and environmental dimensions. Therefore, it is imperative for both states and enterprises to strive toward achieving the harmonization of economic growth, social equity and environmental protection. In the process of sustainable development, China needs to explore what kind of values should guide business development [
1]. For a long time, China has insisted on prioritizing efficiency over equity. As a result, enterprises often choose profit maximization and shareholder wealth maximization as their development goals. Different values determine the development direction of enterprises. Focusing only on economic value has brought about the externalities of many social problems. Currently, China’s economic development has entered a stable period. Fairness and efficiency are equally important. Focusing on social value has become an unshirkable responsibility of enterprises. The integration of economic value and social responsibility of enterprises is an unavoidable issue in the process of development of Chinese enterprises today and it is a requirement to promote the management of Chinese enterprises to gradually move toward the goal of modern management. This is a revolutionary reversal of the modern enterprise management concept. The ultimate goal of corporate value is for enterprises to truly achieve sustainable development [
2].
While there is some awareness that enterprises provide social value, the concept of social value is vague. Some companies even understand social value as charitable donations. This directly leads to the increasingly prominent problem of lack of CSR [
3]. Therefore, enterprises focusing on social value need to pay attention to the needs of stakeholders, establish the concept of green value and transform from their own culture, management, personnel, systems and mechanisms to increase their attention to corporate social responsibility and to form and consolidate the results of sustainable development of enterprises. The transition to sustainable development requires enterprises to pay relatively high costs [
4]. Although policies can enforce constraints on corporate behavior, as a for-profit organization, if the transformation does not bring added value to the enterprise, the enterprise will lack the endogenous motivation to transform and it will be difficult to embed the concept of green sustainable development into the operation of the enterprise in the long term.
Environment, social and government (ESG) is a business philosophy of sustainable development that is suitable for companies to pursue [
5]. Its essence is a system or mechanism that includes a judgmental decision-making process, corporate structure, human resources and management policies to maintain the relationship between all stakeholders of the company [
6]. The governance concept advocated by ESG is in line with the sustainable development goals pursued by corporate values. It promotes enterprises to pay attention to social responsibility, increase investment in the research and development of emission reduction technology and improve corporate governance mechanisms on environmental, social and governance levels. It also guides people to advocate for the concept of green consumption [
7]. In emerging markets, companies pursuing ESG scores can shape their corporate image and attract investors. Enterprises can currently seize new markets by increasing green investments, innovating green products, developing green technologies and choosing more suitable competitive strategies to open new tracks for enhancing corporate value [
8]. Inevitably, there are opportunities and risks in the process. Moreover, capital is profit-driven. To guide companies to increase their contribution to society, there must be a compensation mechanism to support them. In the current process of carbon peaking, governance optimization and technological innovation to reduce carbon emissions are gradually improving. ESG is not about evaluating the present, but rather about the future of the organization and the measurement of corporate value depends on the future expectations of the organization.
The level of low-carbon development measured by the ESG evaluation system is a constraint and monitoring of profit-seeking behaviors of enterprises by their stakeholders under market economy conditions [
9]. However, there is no unanimous voice in the academic community as to whether its advocacy and implementation help corporate executives to improve corporate value [
10,
11]. And how to effectively implement ESG in China and how to make good use of executives’ intellectual capital to guide the sustainable development of enterprises are being explored by both academics and enterprises. The top management acts on behalf of the company. Its actions are considered to be the actions of the company itself and are an expression of the company’s will [
12]. The top management of an enterprise is the vitality factor of enterprise development and the booster that stimulates the vitality of the enterprise. In the highly competitive contemporary economy, whether a company can occupy a more sustainable position in the market has an important relationship with the management’s strategic deployment and values [
13]. Companies that have a keen perspective and forward-looking executive team and can effectively utilize the initiative of their executives will be able to gain the possibility to drive the business forward. The selection of corporate executives should not only be based on personal experience, educational background, age, values, etc. but also on a changing perspective on the developmental trends of management competencies [
14]. However, the problem of the executive principal–agent in listed companies cannot be avoided. The kind of management team chosen by enterprises and the way of management incentives have become important influencing factors affecting the green transformation of enterprises.
Existing studies primarily focus on validating the relationship between ESG implementation and an enterprise’s economic value enhancement, while also exploring the impact of top management and their team characteristics on ESG implementation. However, limited research has approached ESG implementation as a tactical adjustment to corporate strategic transformation in order to investigate its influence on both social and economic value prioritization. In contrast, this study emphasizes enterprises’ path toward accelerating the transition to sustainable development by enhancing both economic and social value through effective ESG implementation. The study aims to assess the extent to which ESG implementation affects the enhancement of economic and social value during this transition process, while also considering top management’s intellectual contribution as a safeguard for driving enterprise value. Therefore, it is of great theoretical and practical significance to study the relationship between executives, ESG and corporate value, which helps to strike a balance between sustainable development and economic development and to make a good theoretical construction for the promotion of a low-carbon economy.
2. Literature Review and Hypotheses
2.1. Executive Green Incentives and ESG Performance
The market often bestows higher valuations upon enterprises that excel in low-carbon development, as a means of promoting carbon reduction measures. As such, corporate boards frequently contemplate incentivizing management to explore active carbon reduction projects. Historical evidence has made it clear that incentives based on the appropriate strategy can bolster business strength in a myriad of ways [
15]. Many executive incentive plans of companies not only consider the financial performance but also take into account relevant indicators that evaluate the social performance of the company. According to the global ISS Executive Compensation Analytics database, from 2010 to 2021, there has been a yearly increase of over 10% in the number of companies incorporating ESG indicators into their executive performance metrics [
16]. In addition, CEO performance is assessed in terms of both economic and ESG factors [
17]. What incentives, then, can have a greater impact on the ESG performance of enterprises?
2.1.1. Cash Compensation Incentives, Equity Incentives and ESG
Zhu et al. (2021) contend that executive compensation encompasses both cash remuneration and equity incentives [
18]. Given the distinct forms of compensation, numerous scholars have classified and examined the impact of various incentive methods on executives’ implementation of ESG. Liu and Zhang (2022) discovered that as the level of executive equity incentives in listed companies increases, controlling shareholders’ equity pledges exerts a more pronounced positive influence on corporate social responsibility implementation [
19]. This implies that incorporating ESG pay into equity incentives is advantageous for implementing ESG. Furthermore, it has been argued that the corporation’s social responsibility performance improves as the executives’ financial compensation incentive increases [
20]. According to Zou et al. (2019), executive cash remuneration incentives motivate businesses to fulfill their social duty [
21]. Therefore, adding ESG pay to monetary compensation facilitates ESG implementation.
2.1.2. Overpay and ESG
A company’s reputation and corporate value can be greatly enhanced by strong ESG performance, which is a testament to its commitment to sustainability and responsible business practices. However, for businesses that are skeptical about the financial benefits of ESG performance, the temptation of greenwashing may prove too great [
16]. According to Liu et al. (2020), excessive compensation incentives for sole directors may foster managerial overcompensation and encourage rent-seeking behavior [
7]. According to Xing and Cao (2022), exorbitant pay incentives can render management “oblivious to the perils” of businesses with external disparities in positive compensation and it is imperative to adequately regulate maximum remuneration to enhance organizational performance [
22]. Therefore, high remuneration does not facilitate the implementation of ESG.
2.1.3. Factors Influencing the Incorporation of ESG Metrics into Compensation Incentives
The inclusion of ESG metrics in executive incentive plans is influenced by various factors. Firstly, industry and policy influences play a significant role. Generally, companies operating in industries with a high environmental impact, such as manufacturing industries, tend to exhibit higher financial performance. Consequently, stakeholders show greater concern for the ESG performance of these companies. Moreover, governments often introduce supportive policies for promoting green development and facilitating a smooth transition for businesses. As a result, such companies are more inclined to incorporate ESG indicators into their incentive schemes [
15]. Furthermore, the characteristics and ownership structure of a company play a significant role in determining its ESG performance visibility. The larger the company’s size, the greater the likelihood that its ESG performance will garner public attention. These companies are more inclined to incorporate ESG metrics into their executive incentive plans, with state policies driven by environmental pressures guiding the implementation of ESG concepts within organizations. State-owned companies exhibit a higher propensity than private companies to include ESG indicators in their executive incentive plans [
16]. Thirdly, in response to sustainability pressures, many corporations have publicly announced their commitment to reducing carbon emissions. As a measure of environmental variables within ESG, these companies often incorporate ESG metrics into their executive incentive plans to enhance the credibility of their commitments [
17]. Furthermore, the inclusion of ESG metrics in executive incentive plans is more likely when board members exhibit heightened sensitivity to external pressures or possess converging values that align with ESG concepts [
18].
ESG indicators cannot be incorporated into executive incentive programs solely for greenwashing, as such models can constrain executives’ actions. However, considering ESG factors will undoubtedly impact a company’s business decisions and investment strategies, ultimately reducing carbon emissions and improving ESG performance [
23].
Based on the above analysis, this paper puts forward hypothesis H1:
H1: There is a positive correlation between executive green incentives and ESG performance.
2.2. The Relationship between Top Management Team Characteristics and ESG Performance
Corporate social responsibility is a moral concept that urges enterprises to consider the interests of various stakeholders in their operations, including employees, customers, governments and shareholders. Consequently, the values held by decision-makers inevitably impact it. Moreover, the executive team’s purview is limited and their decision-making perspective is constrained. Selective perception may further limit their access to information, which is then filtered through personal cognitive foundations and values [
24]. Thus, the implementation of corporate social responsibility is heavily influenced by the values and cognitive foundation of top management.
The active implementation of ESG by the executive team is intricately linked to their educational background, core values, distinctive personality traits, heightened environmental awareness, prior experience in ESG implementation and the length of the tenure held by the CEO [
25,
26,
27,
28,
29]. An executive consensus on the imperative to safeguard the environment is indispensable for ESG implementation in businesses, but it also necessitates a substantial investment in green technology during the preproduction phase. This will have a profound impact on how businesses evolve in the future. The executives’ experiences and ideals in implementing ESG can significantly influence corporate social responsibility practices. It is widely acknowledged that the level of education a manager possesses correlates positively with their propensity to engage in corporate social responsibility. As executives and their teams accumulate more experience, they are increasingly inclined to consider social responsibility from the perspective of the organization’s long-term interests. Moreover, they become better equipped to navigate the diverse demands of individual stakeholders and address them effectively. The financial stability of the executive team is positively associated with their performance in corporate social responsibility [
30]. Ghardallou (2022) revealed that ethical principles serve as the driving force behind socially and environmentally conscious investment intentions, which are intricately linked to executive personality traits [
31]. Aren and Hamamci (2020) examined the association between the big five personality traits and financial decision-making characteristics among a sample of undergraduate business school students in Malaysia [
32]. Their findings revealed that personality traits exerted a greater influence on financial judgment than demographic variables. As a consequence, a company’s ESG performance is more likely to be affirmative when it boasts of an adept management team. The caliber of a company’s management team has a direct bearing on its level of corporate governance. Hence, it can be posited that robust ESG performance augments corporate value by enhancing productivity.
Based on the above analysis, this paper puts forward hypothesis H2:
H2: There is a positive relationship between top management team characteristics and ESG performance.
2.3. ESG Performance and Corporate Value
Both social and economic value are integral components of corporate value [
33]. When a company excels in ESG factors, stakeholders will bestow their trust and support upon it, thereby facilitating the acquisition of resources and an environment conducive to sustainable development. Essentially, corporate ESG initiatives are accountable and inclusive of stakeholders. By prioritizing sustainability and stability, companies can achieve profitability while also advancing society in a mutually beneficial way that benefits both the business and the environment. This approach represents an alternative to solely focusing on corporate interests but is based on established knowledge within capital markets.
ESG practices and related theoretical analysis are still in their nascent stages in China and the question of whether corporate ESG performance enhances corporate value remains a fiercely debated topic. Some scholars argue that corporate social responsibility not only poses challenges to business operations but also undermines companies’ competitiveness in the market [
34]. Companies can enhance their resource pool by attracting government attention and assistance through their social responsibility initiatives, thereby expanding their capabilities [
35].
2.3.1. ESG and Economic Value
By the principles of cost–benefit analysis, corporations must initially invest in fulfilling their social responsibility obligations and inputs to ultimately reap the benefits thereof. Companies are likely to experience an escalation in costs, whether directly or indirectly, as they invest in more substantial externalities such as environmental and social responsibilities [
36]. Especially industrial enterprises bear the responsibility of reducing carbon emissions and managing waste. They demand more costly, cutting-edge materials, tools and technologies [
37]. Employer-oriented regulations on occupational health and safety necessitate increased corporate spending on safety equipment procurement, training and environmental improvement. Significant direct investment is required for philanthropic donations and community engagement [
38].
In the long term, ESG implementation by enterprises not only adds value to existing businesses but also creates opportunities for prospects and new ventures. For established companies, compliance with ESG standards enhances brand recognition, mitigates risks, increases competitive advantage and adds value to goods and services, ultimately leading to improved performance [
39]. ESG implementation upholds the rights and interests of stakeholders, rendering it more probable for them to engage with organizations that exhibit a high degree of ESG compliance [
40]. Furthermore, ESG implementation can aid businesses in more effectively penetrating new markets [
41]. Additionally, the company’s employees’ creativity and loyalty will be optimized. The implementation of ESG investments may require a meticulous process as they have a significant impact on corporate performance. It cannot be achieved overnight. However, fulfilling ESG obligations can ultimately lead to favorable business outcomes due to increased earnings.
2.3.2. ESG and Social Value
The corporate social value represents an enhanced iteration of the ESG evaluation methodology, which concentrates on scrutinizing the inputs and outputs of social responsibility. As per Park and Jang (2021), ESG initiatives can not only lead to competitive differentiation, cost savings and a boost in the economic value of the organization but also have a positive impact on employee productivity and customer satisfaction [
42]. Some scholars have posited that ESG presents an opportunity for businesses to cultivate sustainable growth beyond the mere fulfillment of customer demand for goods and services. Enterprises ought to leverage ESG as a means of expanding their market share and pursuing enduring prosperity [
43].
Long-term benefits in terms of reputation and branding, political astuteness, heightened employee loyalty and creativity, as well as optimal decision-making for the benefit of stakeholders are all outcomes that organizations can achieve by implementing ESG practices [
44]. However, executive involvement in ESG varies among businesses. Furthermore, it is not uncommon for greenwashing to result from imprudent management in the early stages of development. However, once a business has made sufficient ESG investments and is operating effectively, its value will begin to soar. The decisions made by managers and their teams have a significant impact on the extent to which ESG principles are implemented. The managerial style employed also plays a crucial role in determining how much value can be generated for ESG factors. Therefore, it is through exceptional managerial qualities that the transfer of value begins. The management’s assumption of social responsibility as a long-term strategy ensures a positive correlation between ESG and corporate value. The creation of value is not always organic but also relies on the driving force of value transfer during business activities.
Based on the above analysis, this paper puts forward hypothesis H3:
H3: There is a positive relationship between the fulfillment of corporate ESG responsibilities and corporate value.
2.4. Executive Green Incentives and Corporate Value
The principal–agent theory posits that executives, acting as “economic agents,” prioritize and maximize their interests prior to decision-making, resulting in issues of both underinvestment and overinvestment within corporate investment [
45]. As a consequence, corporations ought to tackle agency predicaments that may arise due to moral hazards to augment their corporate governance processes. Research on the principal-agent theory has demonstrated that executive incentives, as an integral component of a company’s internal governance structure, exert an impact on managers’ psychological traits such as risk appetite and confidence level. Shareholders of a company may adopt incentives to steer managers’ behavior and resolve agency issues. The proficiency of the executive team can influence the direction and efficacy of corporate investment, ultimately impacting corporate value, provided that executive incentives are in place.
A well-crafted executive incentive mechanism within a company can effectively mitigate principal–agent conflicts and motivate executives to invest in ventures that are both risky and advantageous for the organization’s long-term growth, ultimately leading to the achievement of its strategic objectives. Pay disparities serve as a reflection of economic prowess and hierarchical power dynamics within the corporate structure. According to the theory of tournaments, those who initially hold a dominant economic and power position in executive incentive programs adopted by companies are more likely to act conservatively to maintain and sustain the established pattern of benefit distribution. Meanwhile, weaker members are further motivated to actively participate in change and strive to improve the business performance of the company, reflecting their capabilities and earning greater benefits.
Pay differentials and incentives within a company can attract and retain top-tier researchers and developers, while also enhancing the organization’s intellectual capital. A robust incentive structure may enable a business to lure exceptional talent from external sources. The diversity of interests among the executive team is objectively influenced by the level of pay incentives, which ultimately shapes their preference for management practices [
46].
For corporations, the pursuit of low-carbon development is an experimental innovation fraught with protracted and uncertain processes. Executive incentives that lack a green component are more closely associated with short-term business performance. High-paid managers are highly motivated to prioritize short-term results to maintain their performance reviews, which often leads to measurable and proportional advantages through exploratory innovation. Conversely, top management members who receive relatively low levels of compensation may be encouraged to pursue riskier projects involving exploratory innovation after assessing high risks against prospective profits [
47]. Executives are thus more inclined to explore the long-term benefits of low-carbon development to enhance corporate value when appropriate green incentives are implemented.
Based on the above analysis, this paper puts forward hypothesis H4:
H4: There is a positive relationship between executive green incentives and top management team characteristics.
2.5. Top Management Team Characteristics and Corporate Value
The study of enterprises has shifted its focus to the perspective of the “irrational man” with the emergence of the upper echelon theory. Consequently, it has been discovered that CEOs play a significant role in influencing business strategy and tactics. As such, researchers are beginning to consider CEO qualities when determining what impacts corporate value. By leveraging human traits, it is hoped that management decisions can be improved and corporate value increased.
Mojambo demonstrated that the higher the educational level of managers and the more relevant their experience in implementing ESG, the greater the positive impact on stock performance [
48]. Meanwhile, Ghardallou found that corporate performance was significantly influenced by executive team members’ educational backgrounds, work experience and tenure [
49]. According to Gupta, the possession of managerial masculine attributes is conducive to enhancing corporate value [
50]. However, executive overconfidence may lead to excessive investment and ultimately undermine corporate value, as pointed out by Wu [
51]. Of course, other scholars hold different perspectives. According to Khan, the impact of CEO arrogance extends beyond business performance and also affects the price of equity capital [
52]. The psychological aspects, such as values and cognitive preferences, can be indirectly influenced by executives’ job history and functional background. CEOs with varied work experiences and professional backgrounds may exhibit diverse interpersonal patterns and mindsets that ultimately shape their business decisions, which in turn affect corporate value [
50]. Compared to executives lacking ESG experience, those who possess environmental sensitivity and have implemented ESG are more attuned to the sustainability of their company [
53].
Based on the above analysis, this paper puts forward hypothesis H5:
H5: There is a positive relationship between top management team characteristics and corporate value.
2.6. Executive Green Incentives, ESG Performance and Corporate Value
The mindset and values of corporate managers can be influenced by the qualities of the executive team, which in turn will shape corporate behavior and impact the company’s social and economic value. The strategic decisions made by executive teams may be altered by corporate motivation [
27]. However, executive motivation may not always yield the desired results. Research suggests that incorporating corporate social value metrics and reporting can bridge the knowledge gap between managers and stakeholders, leading to a more favorable response from the latter.
ESG performance encompasses a company’s effectiveness in terms of governance, social responsibility and environmental impact. Its ability to achieve sustainable development and cultivate a positive public image are both influenced by this performance. The demand for a company to satisfy external goals is thus synonymous with ESG performance. The management team members acknowledge the pressure of external earnings as a stressor and respond accordingly, cognizant of the adverse effects of failing to meet external targets. Executive team members, despite their diverse backgrounds, exhibit equal fervor in response to external goal demands even if they perceive them differently [
54]. This suggests that limitations in ESG performance alone are inadequate for effectively influencing corporate behavior.
ESG performance acts as a “stick” to regulate corporate behavior, while executive green incentives serve as a “carrot” to steer the company’s direction. When combined, they ignite inspiration in executives and assist the management team in selecting optimal strategies for enhancing corporate value.
Based on the above analysis, this paper puts forward hypothesis H6:
H6: ESG Performance mediates the relationship between executive green incentives and corporate value.
2.7. Top Management Team Characteristics, ESG Performance and Corporate Value
Corporate social responsibility is a moral concept that enjoins companies to consider not only the interests of shareholders but also those of a diverse range of stakeholders, including employees, customers and governments. As such, it naturally reflects the values of decision-makers. Moreover, given the vast scope of firms and their environments, senior management cannot possibly oversee every aspect. The perspective of the decision-maker is inherently limited, as selective cognition filters only a fraction of available information to reach their attention. This selection process is influenced by the individual’s cognitive framework and values, which can also account for this phenomenon [
55]. Therefore, the values and cognitive foundation of senior management have a profound impact on how corporations behave in terms of social responsibility. The degree of corporate management is influenced by socially responsible behavior. A business’s efficiency can be affected by various significant factors such as human capital, managerial skills and technological advancements. Companies can enhance their ESG levels while also possessing superior human capital. The efficiency wages theory posits that by treating employees with greater respect and fostering a more positive work environment, businesses can reduce turnover rates and discourage lackadaisical behavior while simultaneously increasing employee motivation. Furthermore, employees who possess a stronger sense of connection to their employers and exhibit genuine concern for their interests are more likely to exert greater effort as they share common values and objectives with them [
56]. In the competitive job market, companies with a positive social reputation are highly sought after, attracting top-tier candidates and ultimately leading to superior management of businesses with elevated ESG levels [
57].
Corporate governance presents fewer agency issues and provides executives with more potent incentives and restraints, thereby fostering greater responsibility and vigilance [
58]. To achieve a high degree of ESG, companies must effectively balance the interests of multiple stakeholders through sophisticated management philosophies and exceptional leadership skills. Additionally, a firm’s commitment to social responsibility and increased stakeholder engagement may lead to an active role in monitoring stakeholders, which enhances feedback on operational issues and facilitates the development of governance and management procedures. High-performing companies on ESG metrics can also upgrade their technology. ESG mandates that businesses adopt more sophisticated, secure, energy-efficient and environmentally friendly production methods and practices. Moreover, ESG facilitates enterprises in fostering innovative initiatives [
59]. Therefore, it can be concluded that good ESG performance increases corporate value by improving corporate efficiency.
Based on the above analysis, this paper puts forward hypothesis H7:
H7: ESG performance mediates the relationship between top management team incentives and corporate value.
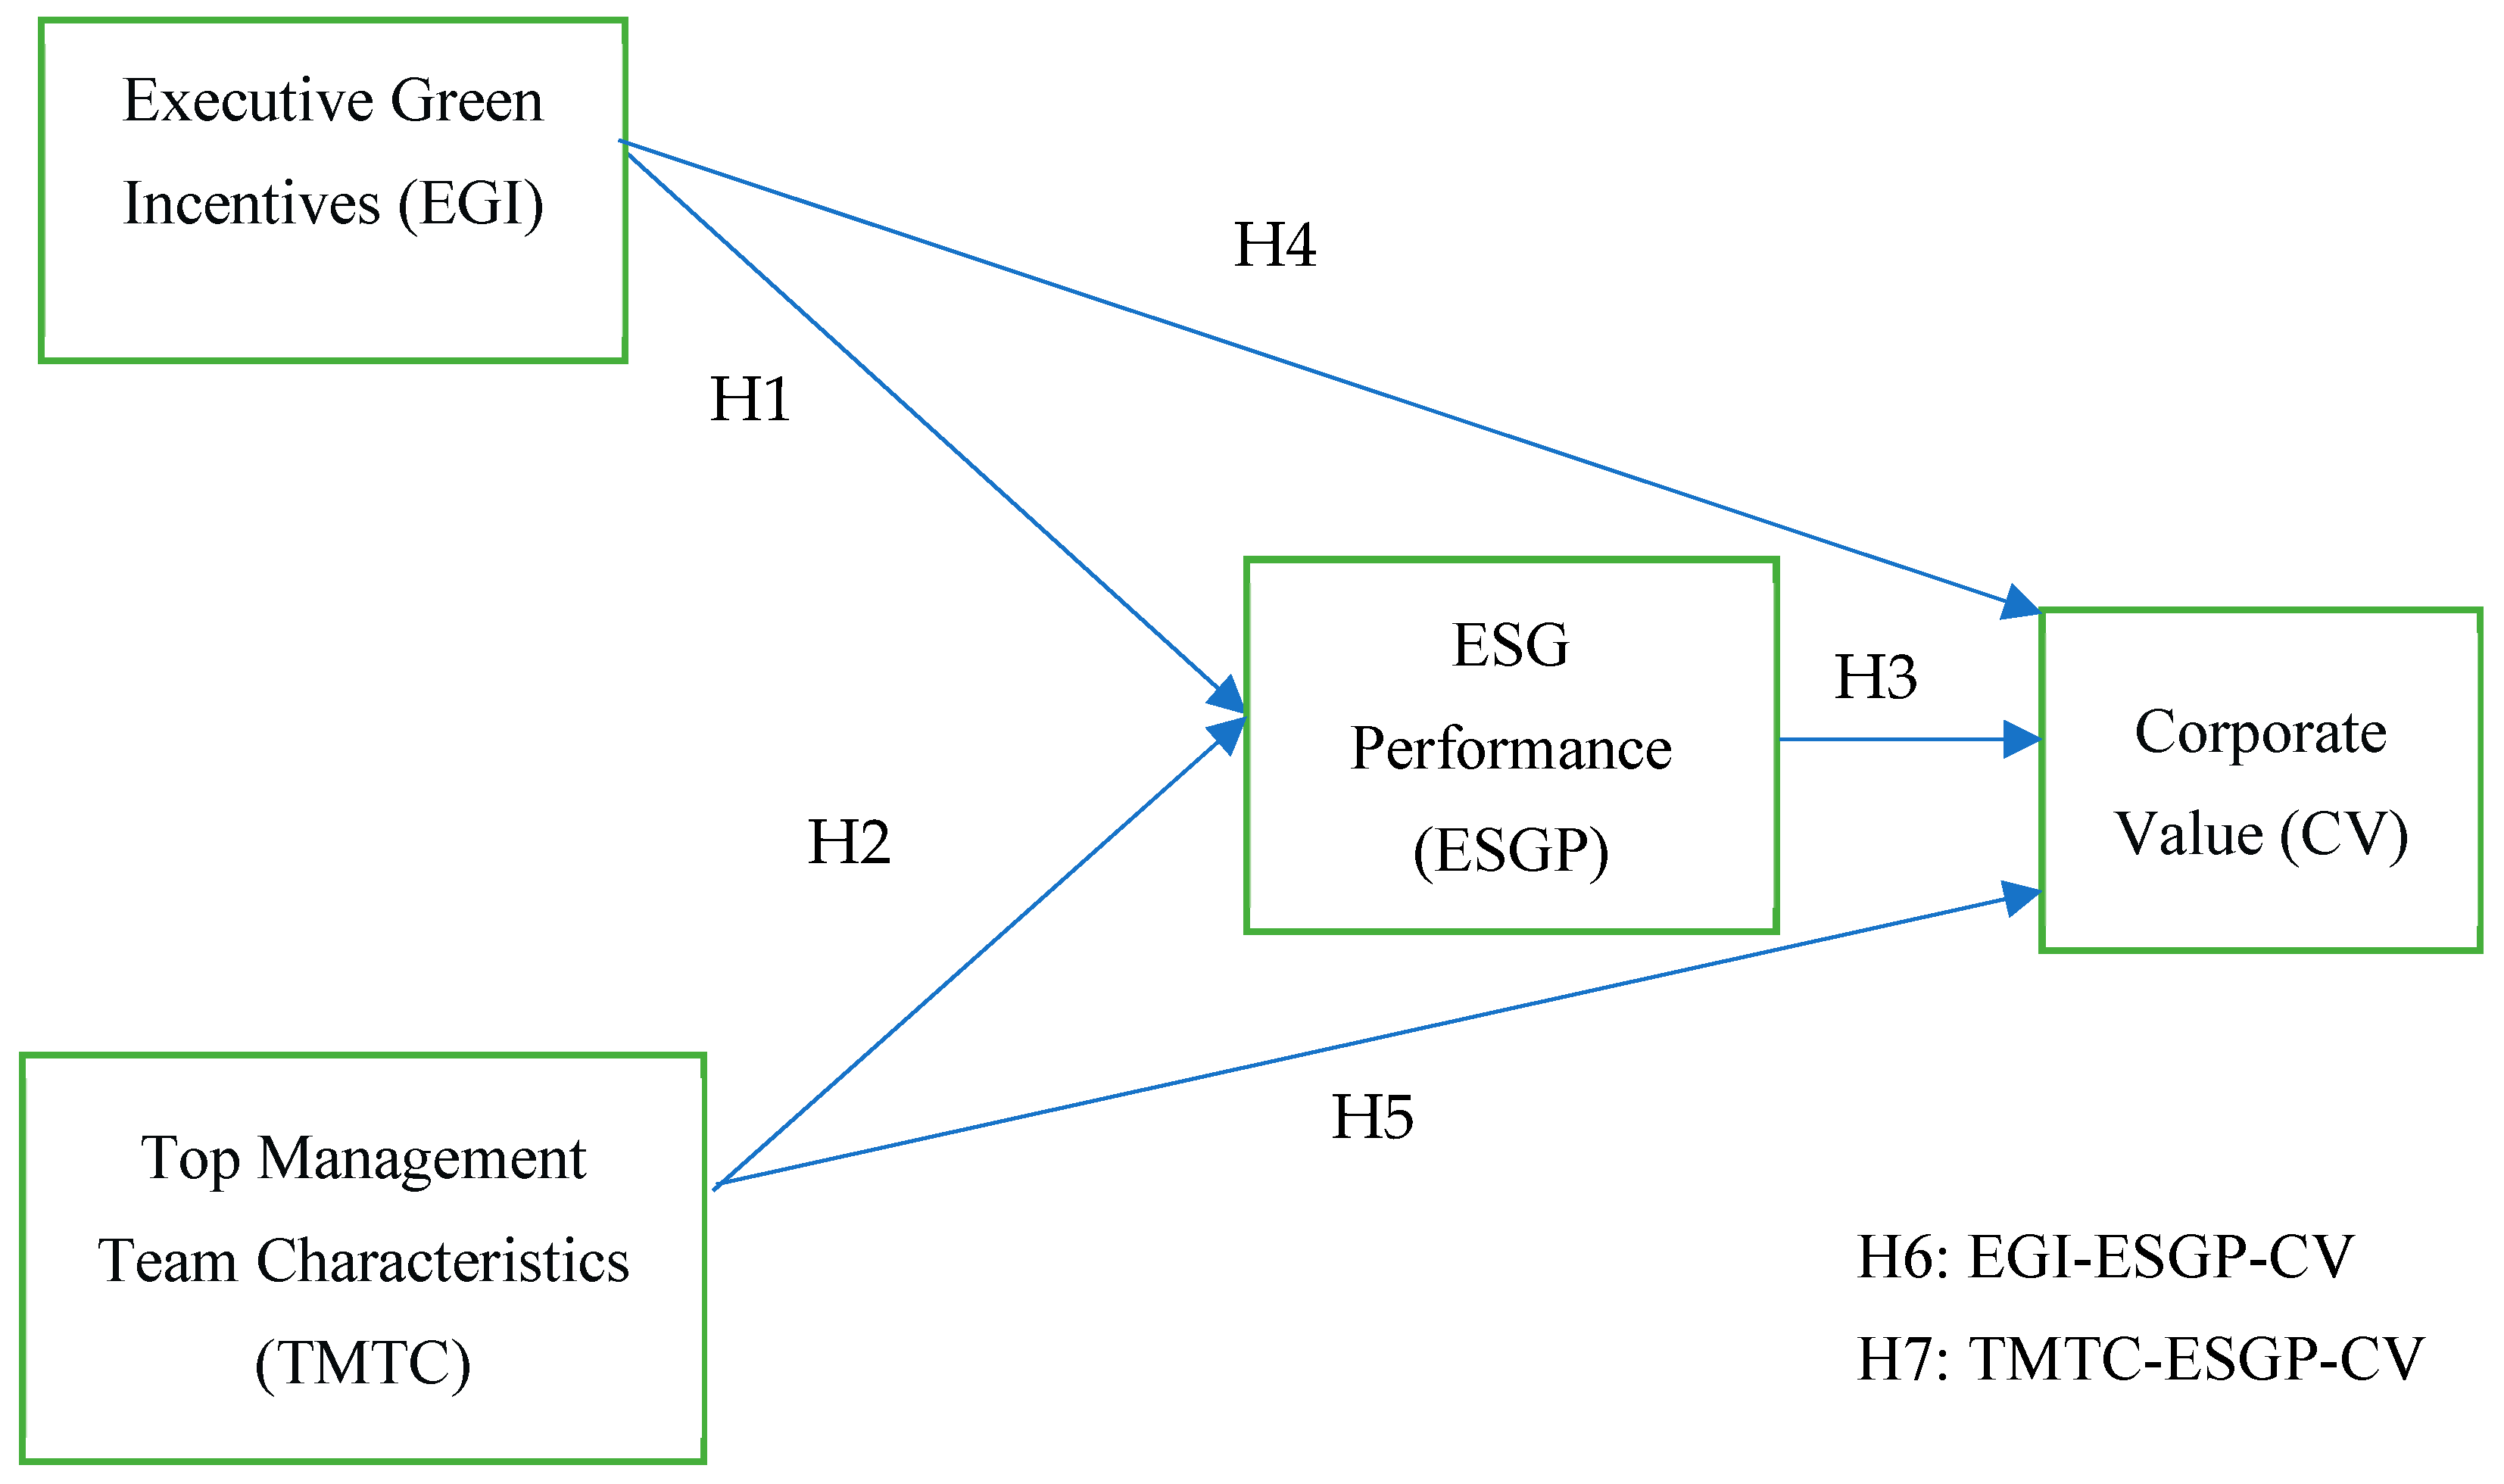
In conclusion, this study delves into the impact of executive green incentives and executive team characteristics on the implementation of ESG in Chinese manufacturing firms, taking a comprehensive approach to ESG performance validation (H1, H2, H4 and H5), drawing from principal–agent theory, upper echelon theory and tournament theory. Furthermore, this study delves into the extent to which companies are compensated for their ESG implementation costs in terms of value enhancement—that is, the augmentation of firm worth (Validation H3)—through a stakeholder theory lens. To establish a competent executive team and an effective incentive strategy that will drive the sustainable growth of the company (as validated by H6 and H7), this study’s third and final section reveals the ESG value creation mechanism through empirical data analysis. The conceptual framework of the particular investigation is depicted in
Figure 1.
3. Methodology and Sample Description
The questionnaire method was employed for data collection in this study, while the stock code simple sampling method was utilized to select the sample. Structural equation modeling (SEM) was employed for model construction and SPSS and AMOS were used for data analysis and hypothesis testing.
3.1. Sample and Data Collection
The manufacturing companies listed on the main board of A-shares in Shanghai and Shenzhen in 2022 have been selected for this study. As per the Report on ESG Questionnaire Survey of A-share businesses (2021) issued by the China Capital Market Research Institute, there are no discernible regional characteristics when it comes to ESG concerns among A-share listed enterprises. Consequently, this study employed a simple yet effective stock code sampling method to ensure a well-balanced representation of businesses across diverse geographic regions. This is because corporate executives possess a superior comprehension of executive teams, executive green incentives, ESG implementation and corporate value enhancement than other employees. Moreover, the outcomes of objective assessments conducted by executives within the same organization frequently align with their viewpoints [
60]. This study employed a random simple sampling technique to select a representative sample of manufacturing companies from the list of listed companies, based on their stock codes. The selected companies were then geographically located according to the sampled stock codes and an executive from each company was randomly chosen and invited to participate in the survey. The decision of participants in this study to remain anonymous and voluntarily reduce the generalizability of the results prevented response bias in the sampling process and added a layer of complexity to the interpretation of findings [
61].
The China Association of Listed Companies released a report showing that as of 26 December 2022, the number of listed companies in the manufacturing industry in China’s A-share market reached 3313, accounting for 65.5% of all A-shares. Therefore, the overall number for this study was 3313 [
62]. Following the research experience, this paper adopted the sample size calculation based on the z-score, the standard of deviation and the confidence interval proposed by Smith. Therefore, we defined the size of the sample firms as 385.
According to the renowned American sociologist Bibi, a return rate of no less than 50% is deemed necessary, while a return rate of at least 60% is considered desirable and a response rate exceeding 70% is truly exceptional [
63]. To achieve such an impressive response rate, we must distribute as many as 550 questionnaires.
Field visits and computerized surveys sent via email were utilized to disseminate the questionnaire, resulting in a 71.82% return rate. After eliminating questionnaires with brief response times, duplicate samples, logical inconsistencies, excessive duplicate alternatives and incomplete data, a total of 361 valid questionnaires were obtained from the surveys collected for this study.
3.2. Questionnaire Design and Measurement
This study required the use of questionnaire research to obtain data in analyzing the relationship between corporate value, ESG performance, executive green incentives and top management team characteristics. The questionnaire questions were closed-ended questions. The design of the questionnaire was based on the conceptual model based on the research questionnaires proposed by previous researchers. Interviews were also used to invite corporate executives to provide guidance on the designed questionnaire.
The questionnaire consisted of two main parts. The first part was the basic information of the respondents. This part was the demographic variables of the respondents, mainly including the age range of the respondents, education level, gender, income level, geographical location of the respondent’s business and form of business ownership. The second part was the scales to measure the variables. The scales included four variables of top management team characteristics, ESG performance, executive green incentives and enterprise resilience. The questionnaire was based on a 7-point Likert scale from “strongly disagree” to “strongly agree” on a scale of 1–7.
Measuring top management team characteristics, we synthesized measurement questions from the executive team process scale [
64], the socially responsible HRM scale [
65] and the character strength inventory (CSI) scale [
66]. The variables measured executive team characteristics using nine questions in three areas: executive team perceptions of social responsibility, executive values and CEO personality traits.
Executive incentives include cash compensation incentives and equity compensation incentives [
67,
68]. And nonmonetary rewards also play an important role in corporate strategy execution [
69]. This paper measures executive green incentives in terms of cash incentives, equity incentives and nonmonetary incentives based on a synthesis of the green human resource management measurement scale proposed by Shah [
70].
ESG performance designs questions from three aspects of the environment, society and corporate governance, respectively. This paper draws on Jin and Kim (2022) who proposed a questionnaire for evaluating ESG activities [
71], as well as references to the ESG evaluation indicators published by Thomson Reuters’ China Capital Markets Research Institute and the 2022 overview of China’s ESG development [
72], to finalize the measurement variables of ESG performance. Corporate value includes social value and economic value. Economic value was measured using the financial indicator EVA [
73,
74]. Social value was measured using nonfinancial indicators.
3.3. Sample Description
In this study, a descriptive analysis of the sample data was conducted, accompanied by a test for normality using SPSS 26.0. Among the 395 samples retrieved, male executives (63.4%) accounted for a significantly higher proportion than their female counterparts (36.6%). As ESG principles gain more traction in the A-share market, gender diversity in management has come under increased scrutiny. Even though Chinese listed businesses have more female executives than male, there remains a significant disparity between the two genders in executive positions. Consequently, the gender distribution of respondents is Imbalanced, with middle-aged individuals aged 46 to 55 comprising the majority at 52.6%. The majority of responses (78.1%) were categorized as pertaining to specialists and undergraduate education, with 67.3% of respondents being employed by private enterprises. The central region was represented by 44.9% of all respondents’ businesses, followed closely by the western region at 43.8%, while the eastern region accounted for a mere 11.4%.
In this study, kurtosis and skewness coefficients were employed to evaluate the regularity of sample data distribution. It can be inferred that the sample does not conform to a normal distribution if the sample size exceeds 300, or if either the absolute value of skewness is greater than 2 or the absolute value of kurtosis is greater than [
75,
76]. As the absolute values of skewness and kurtosis for all data in this study met the criteria, it can be inferred that the sample conformed to a normal distribution.
A mean score of 4.9 to 7 is regarded as having a high level of agreement using the 7-point Likert scale scoring criterion [
77]. The results presented in
Table 1 are the means and standard deviations for all variables and indicate that respondents are more likely to agree with the executive team’s social responsibility orientation characteristics (mean 4.912), the implementation of green executive incentives (mean 5.275), the company’s performance in terms of the environment, social issues and governance (mean 5.012) and value enhancement (mean 4.899). This further shows that the sample chosen for this investigation was adequate.
5. Discussion
This study aims to investigate the role of executives in influencing corporate ESG implementation, thereby promoting its adoption and enhancing corporate value through external incentives and internalized awareness.
The positive correlation between executive green incentives and ESG performance, as proposed by H1, has been validated. Given the presence of principal–agent problems, corporate executives tend to enhance relevant aspects of their companies’ indicators in line with shareholder incentives. If there is a clear correlation between executive compensation and environmental performance, executives will be incentivized to contribute to corporate sustainability by consciously meeting low-carbon development assessment targets [
89]. Corporate ESG performance aligns the interests of shareholders and executives, enhances the social and environmental impact and can ultimately drive a positive cycle of increased executive compensation through recognition of sustainable practices [
90].
The positive correlation posited by H2 between top management team characteristics and ESG performance has been duly confirmed, with the most intrinsic factors within executives exerting a profound influence on their perception and practice of ESG. It is worth noting, however, that the implementation of an effective policy cannot be solely predicated upon the individualism of executives. Companies require a team of executives who collaborate seamlessly, with the CEO’s unifying leadership and vision aligning their perspectives toward societal nourishment and corporate social responsibility. In terms of ESG factors, we scrutinize both personal attributes and executive motivation. Sensitivity to motivation varies among executives based on their distinct life goals. The more environmentally and socially conscious an executive is, the more likely they are to proactively implement ESG initiatives, irrespective of incentives.
The positive correlation between ESG performance and corporate value posited by H3 has been duly affirmed. The findings of this study are particularly pertinent to China’s current stage of development, as an emerging market with ample scope for growth in terms of environmental protection and corporate governance. With the quality of its population on the rise, a growing internationalization of consumption patterns and increasing demand for eco-friendly products, green initiatives are fast becoming a key driver of market success. The introduction of the ESG concept has emerged as a novel growth driver for corporate development, with the velocity of strategic transformation and self-directed research and development capabilities serving as competitive advantages for enterprise survival and expansion. This will significantly augment enterprise value, while competition for talent to enhance corporate research and development capacity has been observed across all regions in China since 2018. The advancement of novel energy technologies has been robustly bolstered by governmental policies. Financial institutions are fortified to furnish inventive resolutions, such as verdant asset-backed (commercial) notes and factoring, to tackle the funding requisites of nascent energy enterprises. This, in turn, corroborates the efficacy of ESG performance in elevating corporate worth.
The positive correlation between executive green incentives and corporate value, as proposed by H4, has been confirmed. These incentives effectively mitigate conflicts between executives and shareholders while aligning the interests of executives with those of the company. As proposed by the renowned American economist Milton Friedman, the maximization of shareholders’ interests has been dominating global economic thinking for over half a century. In China, maximizing shareholder wealth is widely adopted as the ultimate goal of corporate financial management. Consequently, financial indicators are frequently utilized to evaluate corporate performance. However, when companies implement ESG practices, they not only focus on financial performance but also take into account social responsibilities. Many companies worldwide are now reconsidering and beginning to promote the maximization of stakeholder benefits, which has led to a shift in companies’ financial management objectives. To guide executive behavior, attractive ESG-related incentives are necessary for motivating executives to pursue rewards from nonfinancial metrics [
91]. The extent to which executives respond to incentives can directly impact strategic decision-making [
27].
The positive correlation between top management team characteristics and corporate value, as proposed by H5, has been verified. The influence of personality, values and educational background are additional internal factors that determine executive behavior. According to several researchers, CEOs with bigger personalities will perform poorly for their companies. However, according to Gupta, executive masculine features have a favorable effect on corporate value. Optimistic or overconfident executives have the potential to enhance corporate value [
50]. Executives who possess experience in ESG implementation and exhibit environmental consciousness are more inclined toward ensuring corporate sustainability than their counterparts lacking such expertise [
48,
53]. This study has discovered that executives and their teams who exhibit superior teamwork, decisiveness, masculinity, environmental consciousness, ESG experience and educational background in sustainability concepts are significantly and positively correlated with corporate value. These findings align with prior research.
The proposed mediating role of ESG performance, as posited in H6 and H7, has been validated with ESG performance serving as a disciplinary “stick” to regulate corporate behavior while green incentives for executives act as a motivational “carrot” to steer the direction of the company. Together, they work in tandem to govern executive conduct. Through incentivization, companies can alter the strategic choices made by their executive teams [
27]. The optimization of corporate action can be achieved through the disciplinary mechanism of ESG performance. Crucial factors that impact business efficiency include human capital, management capabilities and technology levels. The values upheld by the executive team determine the extent to which stakeholders are prioritized throughout the organization. In turn, stakeholder support reflects both governance standards and talent attractiveness. By enhancing their ESG standards, companies can foster an environment conducive to innovation, attract top-tier talent and conduct cutting-edge technological research and development. A strong team will facilitate the implementation of ESG practices within a company, while the efficacy of such practices will in turn impact the composition of said team. If a company boasts an exceptional management team, employs advanced management philosophies, commands a significant market share in green products and maintains harmonious relationships with its stakeholders, then the value of the said company will be significantly augmented. Thusly, their interdependent relationship forms a mutually reinforcing mechanism for ESG implementation.
6. Conclusions
According to the study, it has been observed that the implementation of ESG practices enhances corporate value and facilitates the conversion of a company’s social value into economic value. Executive green incentives and top management team characteristics have a positive impact on companies’ ESG performance. Notably, the partial mediating effect of driving ESG implementation through executive green incentives is more significant than that of driving ESG implementation through top management team characteristics. The direct and mediated effects are equally influential in driving corporate value. This finding addresses an existing gap in the literature concerning executive selection and motivation for driving ESG implementation, providing pathways and recommendations for sustaining economic development during corporate green transformation while also serving as a theoretical exploration toward maximizing stakeholders’ interests. Moreover, this conclusion offers insights into incentivizing companies to adopt ESG practices.
6.1. Theoretical Implications of the Study
As contemporary organizational management continues to evolve, business managers are increasingly prioritizing the enhancement of performance at both the team and individual levels. Within this context, human effectiveness serves as a metric for evaluating individual and team performance, as well as their alignment with organizational goals. This study addresses the limitations of existing research by examining strategies to promote ESG implementation and augment corporate value from an executive perspective on “human effectiveness”. The present study draws upon principal–agent theory, stakeholder theory, upper echelon theory and tournament incentive theory to examine the viability of selecting top management teams that contribute to the characteristics of corporate transformation toward sustainability in order to address the limited rationality dilemma. Additionally, it explores the influence of executive green incentives on corporate transformation toward sustainability and the enhancement of corporate value. Furthermore, it investigates how demographic characteristics amplify the applicability of green incentives by examining their impact on corporate value. This approach aims to refine perceptions regarding green incentives, ESG performance and corporate value. At the same time, it also instigates philosophical contemplation regarding the necessity to explore which values should guide enterprise development in China.
6.2. Managerial Implications of the Study
As the world strives to achieve Sustainable Development Goals and combat climate change, global investment strategies are gradually shifting toward ESG investments. This shift reflects an evolving investment mindset that places equal importance on both profitability and environmental, social and governance factors. Compared to their European and American counterparts, China’s ESG regulatory policy is relatively nascent with a primary focus on social responsibility and environmental protection. Nevertheless, the country’s overall ESG regulatory framework has continued to evolve and improve over time. The ESG concept aligns perfectly with China’s future development goals, particularly in the era of “carbon peak and carbon neutrality” and the new development concept of “innovation, coordination, green, openness and sharing”. As a result, ESG has garnered increasing attention from government officials, regulators and market investors alike. Achieving carbon neutrality necessitates substantial investment in low-carbon and energy-saving technologies, as well as the green upgrading of the entire industrial chain. Therefore, this study offers insights for governments and enterprises to further explore measures that enhance the efficacy of ESG implementation.
Corporate greenwashing poses significant risks to companies. With the widespread promotion of the ESG concept and hype surrounding it in capital markets, there is an urgent need for government to establish robust institutional constraints that can effectively control corporate misconduct during policy formulation and company governance in regulatory processes. Otherwise, failure to effectively implement ESG practices will not only fail to enhance the company’s brand reputation but also result in squandered investments and jeopardized interests. The term “greenwashing” within the context of ESG refers to the act of promoting, marketing or packaging ESG initiatives through exaggerated or misleading publicity and marketing tactics to create a positive image for ESG while deceiving society, consumers and investors. While ESG has yet to become a mandatory legal norm on a large scale, the act of greenwashing can result in serious legal consequences for the company in question. Therefore, institutional constraints on executives and state penalties for corporate noncompliance must be further enhanced.
6.3. Limitations and Future Research
The thesis explores the interplay between executive green incentives, executive team characteristics, ESG performance and firm value. However, there are certain inadequacies in the theoretical analysis of this study. Specifically, the theoretical analysis pertaining to the impact of factors such as firm location, executives’ educational background and income level is insufficient, which may somewhat diminish the explanatory power of this paper’s findings. There exist multiple pathways through which ESG contributes to the enhancement of corporate value. However, this paper solely focuses on the contribution of executive behavior to ESG without delving into the refined path from ESG to corporate value enhancement. This results in a multitude of mediating effects on firm value. Due to space constraints, we have not explored the underlying mechanisms that enable ESG to enhance firm value, leaving ample room for future research studies.


