Article

The Optimization, Kinetics Model, and Lab-Scale Assessments of Phenol Biodegradation Using Batch and Continuous Culture Systems

1
Botany & Microbiology Department, Faculty of Science, Alexandria University, Alexandria 21500, Egypt
2
Medical Laboratory Technology Department, Faculty of Applied Health Sciences Technology, Pharos University in Alexandria, Alexandria 21500, Egypt
3
Chemistry Department, Faculty of Science, Alexandria University, Alexandria 21500, Egypt
4
Chemical and Petrochemical Department, Faculty of Engineering and Technology, Arab Academy for Science, Technology and Maritime Transport, Alexandria 21913, Egypt
5
Zoology Department, Faculty of Science, Alexandria University, Alexandria 21500, Egypt
*
Author to whom correspondence should be addressed.
Sustainability 2023, 15(16), 12405; https://doi.org/10.3390/su151612405
Submission received: 19 June 2023 / Revised: 29 July 2023 / Accepted: 13 August 2023 / Published: 15 August 2023
(This article belongs to the Special Issue Green Energy and Sustainable Development)

Abstract

:
Phenol was considered a severe hazard to all ecosystems even at low concentrations. The bioremediation process is an eco-friendly process for complete phenol degradation and bioelectricity generation. In the present study, a consortium of native isolates was used for phenol biodegradation and bioenergy generation using nano-graphite electrodes. The optimization of nutritional and environmental parameters using batch culture revealed that the optimum conditions for maximum phenol degradation and energy generation were inoculum concentration, 1%; incubation period, 48 h; phenol, 6 ppm; MgSO4, 70 mg/L; K2HPO4, 175 mg/L; and CaCl2, 1 mg/L. Phenol biodegradation reached 93.34% with a power density of 109.419 mW/cm3. A lab-scale bioreactor was used as a continuous culture with aeration rate, agitation speed, and dissolved oxygen of 0.5 v/v/m, 750 rpm, and 30%, respectively. On using the continuous culture, phenol biodegradation and bioenergy production reached 97.8% and 0.382 W/cm3, respectively. A kinetics study using Haldane’s kinetics model reported the best fit to achieve a significant correlation coefficient (R2) value (0.9865) reaching maximum specific growth rate with initial phenol concentration of approximately 9 mg L−1 where the specific growth rates (μ, h−1) varied with different initial phenol concentrations. In conclusion, the native isolated consortium could be considered as an economical and sustainable approach to phenol biodegradation in industrial wastewater as well as bioelectricity generation.

1. Introduction

Organic pollutants, especially phenolic compounds, are the most widely abundant pollutants in industrial wastewater. In general, petrochemicals, coke oven plants, coal mining, and petroleum oil refineries are the most important industries releasing phenolic pollutants to the ecological environment [1,2]. Phenolic pollutants were reported as biologically unmanageable. Thus, they remain in the industrial wastewater with accumulated concentrations [3]. Due to their carcinogenic effect and acute toxicity, phenolic pollutants cause serious human health hazards and harm the environment [4]. Biodegradation is the most promising and popular approach to remove toxic and hazardous pollutants, owing to its eco-friendliness, economic viability, and practical feasibility [5]. Consequently, the bioremediation strategy has emerged as a potential method for the complete biodegradation of phenolic pollutants.
On the other hand, the technique known as microbial fuel cells (MFC), which produces energy particularly from the oxidation of organic compounds brought about by the metabolic activity of microorganisms, seems to be appealing for the purpose of warranting energy power production. According to Mohan et al. [6], the use of MFC as a renewable energy source to produce electricity is seen as a dependable, clean, and effective process. This approach employs renewable ways as an alternative tool to the most widely used non-sustainable sources, and it does not result in the production of any hazardous by-products. MFCs have been shown to be an effective technology in recent years for the recuperation and on-site conversion of chemical energy into electrical energy. According to Hemashenpagam and Selvajeyanthi [7], the microbial metabolism of wastes utilizing innovative bioremediation technologies such as MFC for energy generation is recognized as the effective and ecologically benign solution. Hejazi et al. [8] reported that the phenol degradation percentage in a conventional MFC was 75% only by changing the bioreactor to a granular-activated carbon (GAC) adsorption/MFC combined system (GAMFC); the phenol degradation percentage reached 95%. Another study built a two-chamber MFC in order to treat phenol and acetone wastewater and simultaneously produce electricity. They used proton exchange poly-sulfonated (ether ketone) membrane and reported an output voltage range between 240 and 250 mV [9]. On the other hand, Moreno et al. [10] reported achieving maximum power density (777.8 mW m−3) upon using continuous flow MFCs with granular graphite electrodes compared to single-rod electrodes (0.8 mW m−3 power density).
Hence, the aim of the present study was to:
evaluate the phenol degradation and bioelectricity generation using a microbial consortium in batch and continuous systems;
assess the potential application of nano-electrodes; and
investigate the kinetic study of the tested consortium.

2. Materials and Methods

2.1. Microorganisms

Microorganisms (15 strains) were previously isolated from static wastewater effluents collected from Alexandria Mineral Oils Co “AMOC” and identified using 16S rDNA sequencing. Six bacterial strains were used in the present study, namely: Bacillus subtilis MW585596, Staphylococcus equorum MW585694, Bacillus benzoevorans MW597321, Bacillus circulans MW597408, Pseudomonas aeruginosa MW598228, and Burkholderia cepacia MW579472 [11].
The McFarland standards were employed as a point of reference for the purpose of calibrating the turbidity of bacterial suspensions derived from cultures that were 16 to 24 h old. This calibration was necessary in order to standardize the bacterial count in either sterile saline or a nutritional broth, resulting in a concentration of 1.5 × 10⁻⁶ colony-forming units per milliliter (CFU/mL). Subsequently, equivalent quantities of the six isolates, each with a numerical label, were combined to create a solution with a final concentration of 10.0% (v/v). The isolates were carefully measured to ensure that their optical density at a wavelength of 600 nm (OD600 nm) fell within a range of 1.00 ± 0.40 [12].

2.2. Nano-Graphite Synthesis, Characterization, and Electrode Plating

2.2.1. Nano-Graphite Synthesis

Nano-graphite was synthesized through the utilization of a mixed microemulsion approach. This involved the combination of two distinct microemulsions, one containing a sucrose solution and the other containing sulfuric acid. The sulfuric acid microemulsion component consisted of 20 μL of sulfuric acid and 1 mL of a surfactant solution with a mass ratio of 1:7:8/2 for cetyltrimethylammonium chloride (CTAC), cyclohexane, and pentanol, respectively. The sucrose microemulsion component was made using 20 μL of aqueous sucrose, along with 1 g of the same surfactant solution in an aliquot. The aqueous sucrose microemulsion and sulfuric acid microemulsion were combined in equal proportions. The product was clear isotropic phase, which was then left for three days in room temperature for nano-graphite synthesis [13].

2.2.2. Nano-Graphite Characterization

The dynamic light scattering (DLS) technique (Malvern Zetasizer, Worcestershire) was the chosen method to assess the particle size (PS), polydispersity index (PDI), and zeta potential of the synthesized nano-graphite. Nano-structured graphite ultra-structure, size, and shape were examined using transmission electron microscopy (TEM, JEOL 2100F FEG-200 kV TEM operating at 80 kV) [14].

2.2.3. Nano-Graphite Electrode Plating

The cathode was prepared by grinding 70% graphite nanoparticles with 10% Super-P(Carbon) and 20% Polyvinylidene fluoride (PVDF) in a high-power ball milling machine at 500 rpm for 24 h in the presence of argon. N-methyl-2-pyrrolidinone (NMP) solvent was used for mixture dispersion with continuous stirring. The slurry was pasted on metal collectors using a minicoater (MC-20, Hohsen) and dried at 80 °C for 2 h [15].

2.3. Phenol Degradation and Bioelectricity Estimation

The phenol concentration was measured spectrophotometrically using the HACH® phenol kit [16], while the bioelectricity biogenerated from a microbial fuel cell (MFC) was estimated using the synthesized nano-graphite as cathode and cupper as anode. To calculate the power density PD (w/cm3), 15 pieces of MFC (connected to each other by a salt bridge) with an external resistance was connected in series and 3 sets of these connected cells were connected in parallel (Figure 1). The power density was calculated using the following equation:
P D = V × I U
where V was the cell voltage (V), I was the current (A), and U was the anodic solution volume.

2.4. Optimization of Nutritional and Environmental Factors

The optimization of the key variables influencing phenol biodegradation and bioelectricity production processes was achieved by employing two statistical designs: firstly the Plackett–Burman design (PBD) and subsequently the central composite design (CCD), as applied by Boudraa et al. [17] and Du et al. [18] using Minitab 19®.

2.4.1. Plackett–Burman Design (PBD)

Twelve factors were investigated by applying the Placket–Burman design to determine the phenol biodegradation and bioelectricity generation effective factors at a 95% confidence level. Bacterial inoculum concentration, culture volume, phenol concentration, pH, and incubation time, plus KH2PO4, K2HPO4, (NH4)2SO4, NaCl, FeCl3·6H2O, MgSO4·7H2O, and CaCl2·2H2O concentrations, were tested for nutritional and environmental factors. The following first-order polynomial model was used for the mathematical modeling (Equation (2)):
Y = β 0 + β i X i
The projected response Y represents the percentage of phenol degradation. The model intercept is denoted as β0, the linear coefficient as βi, and the level of the independent variable as Xi. The current study aimed to examine the model fitting and the impact of all parameters through an analysis of variance (ANOVA) using t-tests and p-values. The researchers examined each independent variable across three levels, denoted as −1, 0, and +1, as shown in Table 1 [19]. Further optimization of both phenol biodegradation and bioelectricity generation responses was conducted by taking into account the essential elements. This was achieved through the use of a central composite design (CCD).

2.4.2. Optimization Using Central Composite Design (CCD)

The optimization of the most effective factors and their interactions, including inoculum size, MgSO4, K2HPO4, CaCl2, phenol concentration, and incubation length, was conducted using response surface methodology (RSM) statistical multifactorial modelling. The parameters were varied at five levels (−2, −1, 0, 1, and 2) as shown in Table 2.
The quadratic relationship between the response value (y) and the independent parameters (x1, x2, x3, x4, x5, and x6) was demonstrated using a second-degree polynomial equation (Equation (3)). The equation included a constant term (b0) and linear coefficients (b1, b2, b3, b4, b5, and b6) for each independent parameter. Additionally, the equation incorporated interaction coefficients (b12, b13, b14, b15, b16, b23, and b24) to account for the combined effects of different parameter combinations. The cross-product coefficients in the model were denoted as b25, b26, b34, b35, b36, b45, b46, and b56. On the other hand, the quadratic coefficients were represented by b11, b22, b33, b44, b55, and b66. A total of 53 iterations were conducted in order to estimate the coefficients of the model through the utilization of multiple linear regressions.
y = b 0 + b 1 x 1 + b 2 x 2 + b 3 x 3 + b 4 x 4 + b 5 x 5 + b 6 x 6 + b 11 x 1 2 + b 22 x 2 2 + b 33 x 3 2 + b 44 x 4 2 +   b 55 x 5 2 + b 66 x 66 2 + b 12 x 1 x 2 + b 13 x 1 x 3 + b 14 x 1 x 4 + b 15 x 1 x 5 + b 16 x 1 x 6 +   b 23 x 2 x 3 + b 24 x 2 x 4 + b 25 x 2 x 5 + b 26 x 2 x 6 + b 34 x 3 x 4 + b 35 x 3 x 5 + b 36 x 3 x 6 +   b 45 x 4 x 5 + b 46 x 4 x 6 + b 56 x 5 x 6

2.5. Lab-Scale Generation of Bioelectricity and Biodegradation of Phenol in a Continuous Stir Tank Bioreactor

A larger scale generation of bioelectricity and biodegradation of phenol was carried out in a 4-L fermenter (BIOCANVAS, Centrion bioreactor). Before inoculation, the optimized condition was set and standardized. Moreover, the optimum aeration rate, agitation speed, and the dissolved oxygen were tested and fixed at 0.5 v/v/m, 750 rpm, and 30%, respectively. During the whole fermentation phase, the feed flow rate was set to be 1 mL/min, while the sample collection was every 2 h for 4 days to measure the phenol degradation percentage. Furthermore, power density and potentiodynamic polarization curves were recorded in the potential region from open circuit potential −50 mV to +500 mV (vs. Ag/AgCl), while the electrochemical behavior was assessed using cyclic voltammetry at a potential range of −500 mV to +500 mV (vs. Ag/AgCl) at a scan rate of 10 mV/s using PARSTAT 226 [20,21].

2.6. Kinetic Model Development of Cells

The specific growth rate of cells (µ) under batch culture was determined through the exponential phase (by applying the optimum conditions obtained from CCD optimization) and it was expressed according to Bera et al. [22]:
μ = ln ( X t / X 0 ) t t 0
The variables Xt and X0 represent the concentration of cells at specified time points t and t0, respectively. The calculation of the parameter µ was derived by analyzing the gradient of a linear graph depicting the natural logarithm of the ratio of the final value (Xt) to the initial value (X0) against the elapsed time (t) during the logarithmic growth phase of the curve.
In contrast, it was observed that phenol, when used as a substrate, exhibited a suppression of cell development when subjected to elevated starting phenol concentrations. The use of Haldane kinetics was employed to represent the cellular growth phenomenon, as elucidated using the subsequent equation:
μ = μ m a x S K s + S + S 2 / K i
In the given context, µ represents the specific growth rate (h−1), µmax denotes the maximum specific growth rate (h−1), Ks signifies the half-saturated constant of substrate (mg L−1), and Ki represents the inhibition constant (mg L−1).
Furthermore, the experimental results about the breakdown of phenol at different combinations of initial phenol concentrations were employed to calculate the yield of cellular development [23] using the subsequent equation:
Y = X X 0 S 0 S
In the context of cellular growth, Y represents the growth yield of cells. X and X0 denote the cell concentration and initial cell concentration, respectively, measured in milligrams per liter (mg L−1). Similarly, S and S0 represent the substrate concentration and initial substrate concentration, respectively, with the substrate being phenol and the units being mg L−1.

3. Results and Discussion

3.1. Nano-Graphite Synthesis and Characterization

After the nanoparticles’ synthesis, the vessel containing suspended nanoparticles was dispersed in deionized water. The nanoparticles were ultra-centrifuged at 20,000 rpm for 30 min. The dynamic light scattering technique revealed that the nano-graphite had good stability and relevant homogeneity (zeta potential −38.2 mV and 0.34 PDI) (Figure 2a). The HR-TEM study showed a spherical shape in the nano-range with diameter 86.9 nm (Figure 2b). Yu et al. [24] synthesized graphite nanoparticles using the microemulsion technique and reported that nano-graphite had good dispersibility and agglutination with zeta size reached 200 nm. Moreover, it was reported that nano-graphite has more space for charge/discharge reactions than the porous graphite rod [25] hence it was used in the plated electrodes to enhance the conductivity.

3.2. Optimization of Nutritional and Environmental Factors

3.2.1. Plackett–Burman Design (PBD)

Phenol biodegradation (response 1) and bioelectricity generation (response 2) was achieved by applying the Plackett–Burman design (PBD) using Minitab 19® (Table 3). Each individual factor was represented in the regression equations while the significance of each factor was determined using analysis of variance (ANOVA) through assessing t-test and p-values (Table 4). Some variables, namely: inoculum size, CaCl2, phenol concentration, and incubation period were the most significant factors for phenol biodegradation with model summary (S = 2.3, R-sq = 92.56%, R-sq(adj) = 81.40% and R-sq(pred) = 44.85%) and regression equation:
Phenol degradation % = 77.472 − 4.242 Inoculum size + 0.113 Culture volume − 1.504 Phenol conc. + 0.246 pH − 1.401 Incubation period − 1.115 KH2PO4 + 0.566 K2HPO4 − 0.287 (NH4)2SO4 − 0.346 NaCl − 0.749 FeCl3 + 1.206 MgSO4 − 1.595 CaCl2
On the other hand, inoculum size, MgSO4, K2HPO4, and CaCl2 were found to be significant for bioelectricity generation with model summary (S = 2.06, R-sq = 89.92%, R-sq(adj) = 74.81% and R-sq(pred) = 21.53%) and regression equation:
Power density = 10.373 − 2.872 Inoculum size − 0.676 Culture volume + 0.050 Phenol conc. + 0.253 pH − 0.933 Incubation period + 0.237 KH2PO4 − 1.110 K2HPO4 − 0.813 (NH4)2SO4 − 0.050 NaCl + 0.123 FeCl3 + 1.576 MgSO4 − 1.076 CaCl2
Furthermore, the production of Pareto charts was undertaken to visually represent the set of factors being tested in relation to their impact on two specific outcomes: phenol biodegradation (response 1) and bioelectricity generation (response 2) (as depicted in Figure 3). Hence, the aforementioned parameters were chosen to undergo further optimization using five coded levels (−2, −1, 0, 1, and 2) in order to conduct a comprehensive study of the entire process through the implementation of a central composite design (CCD).

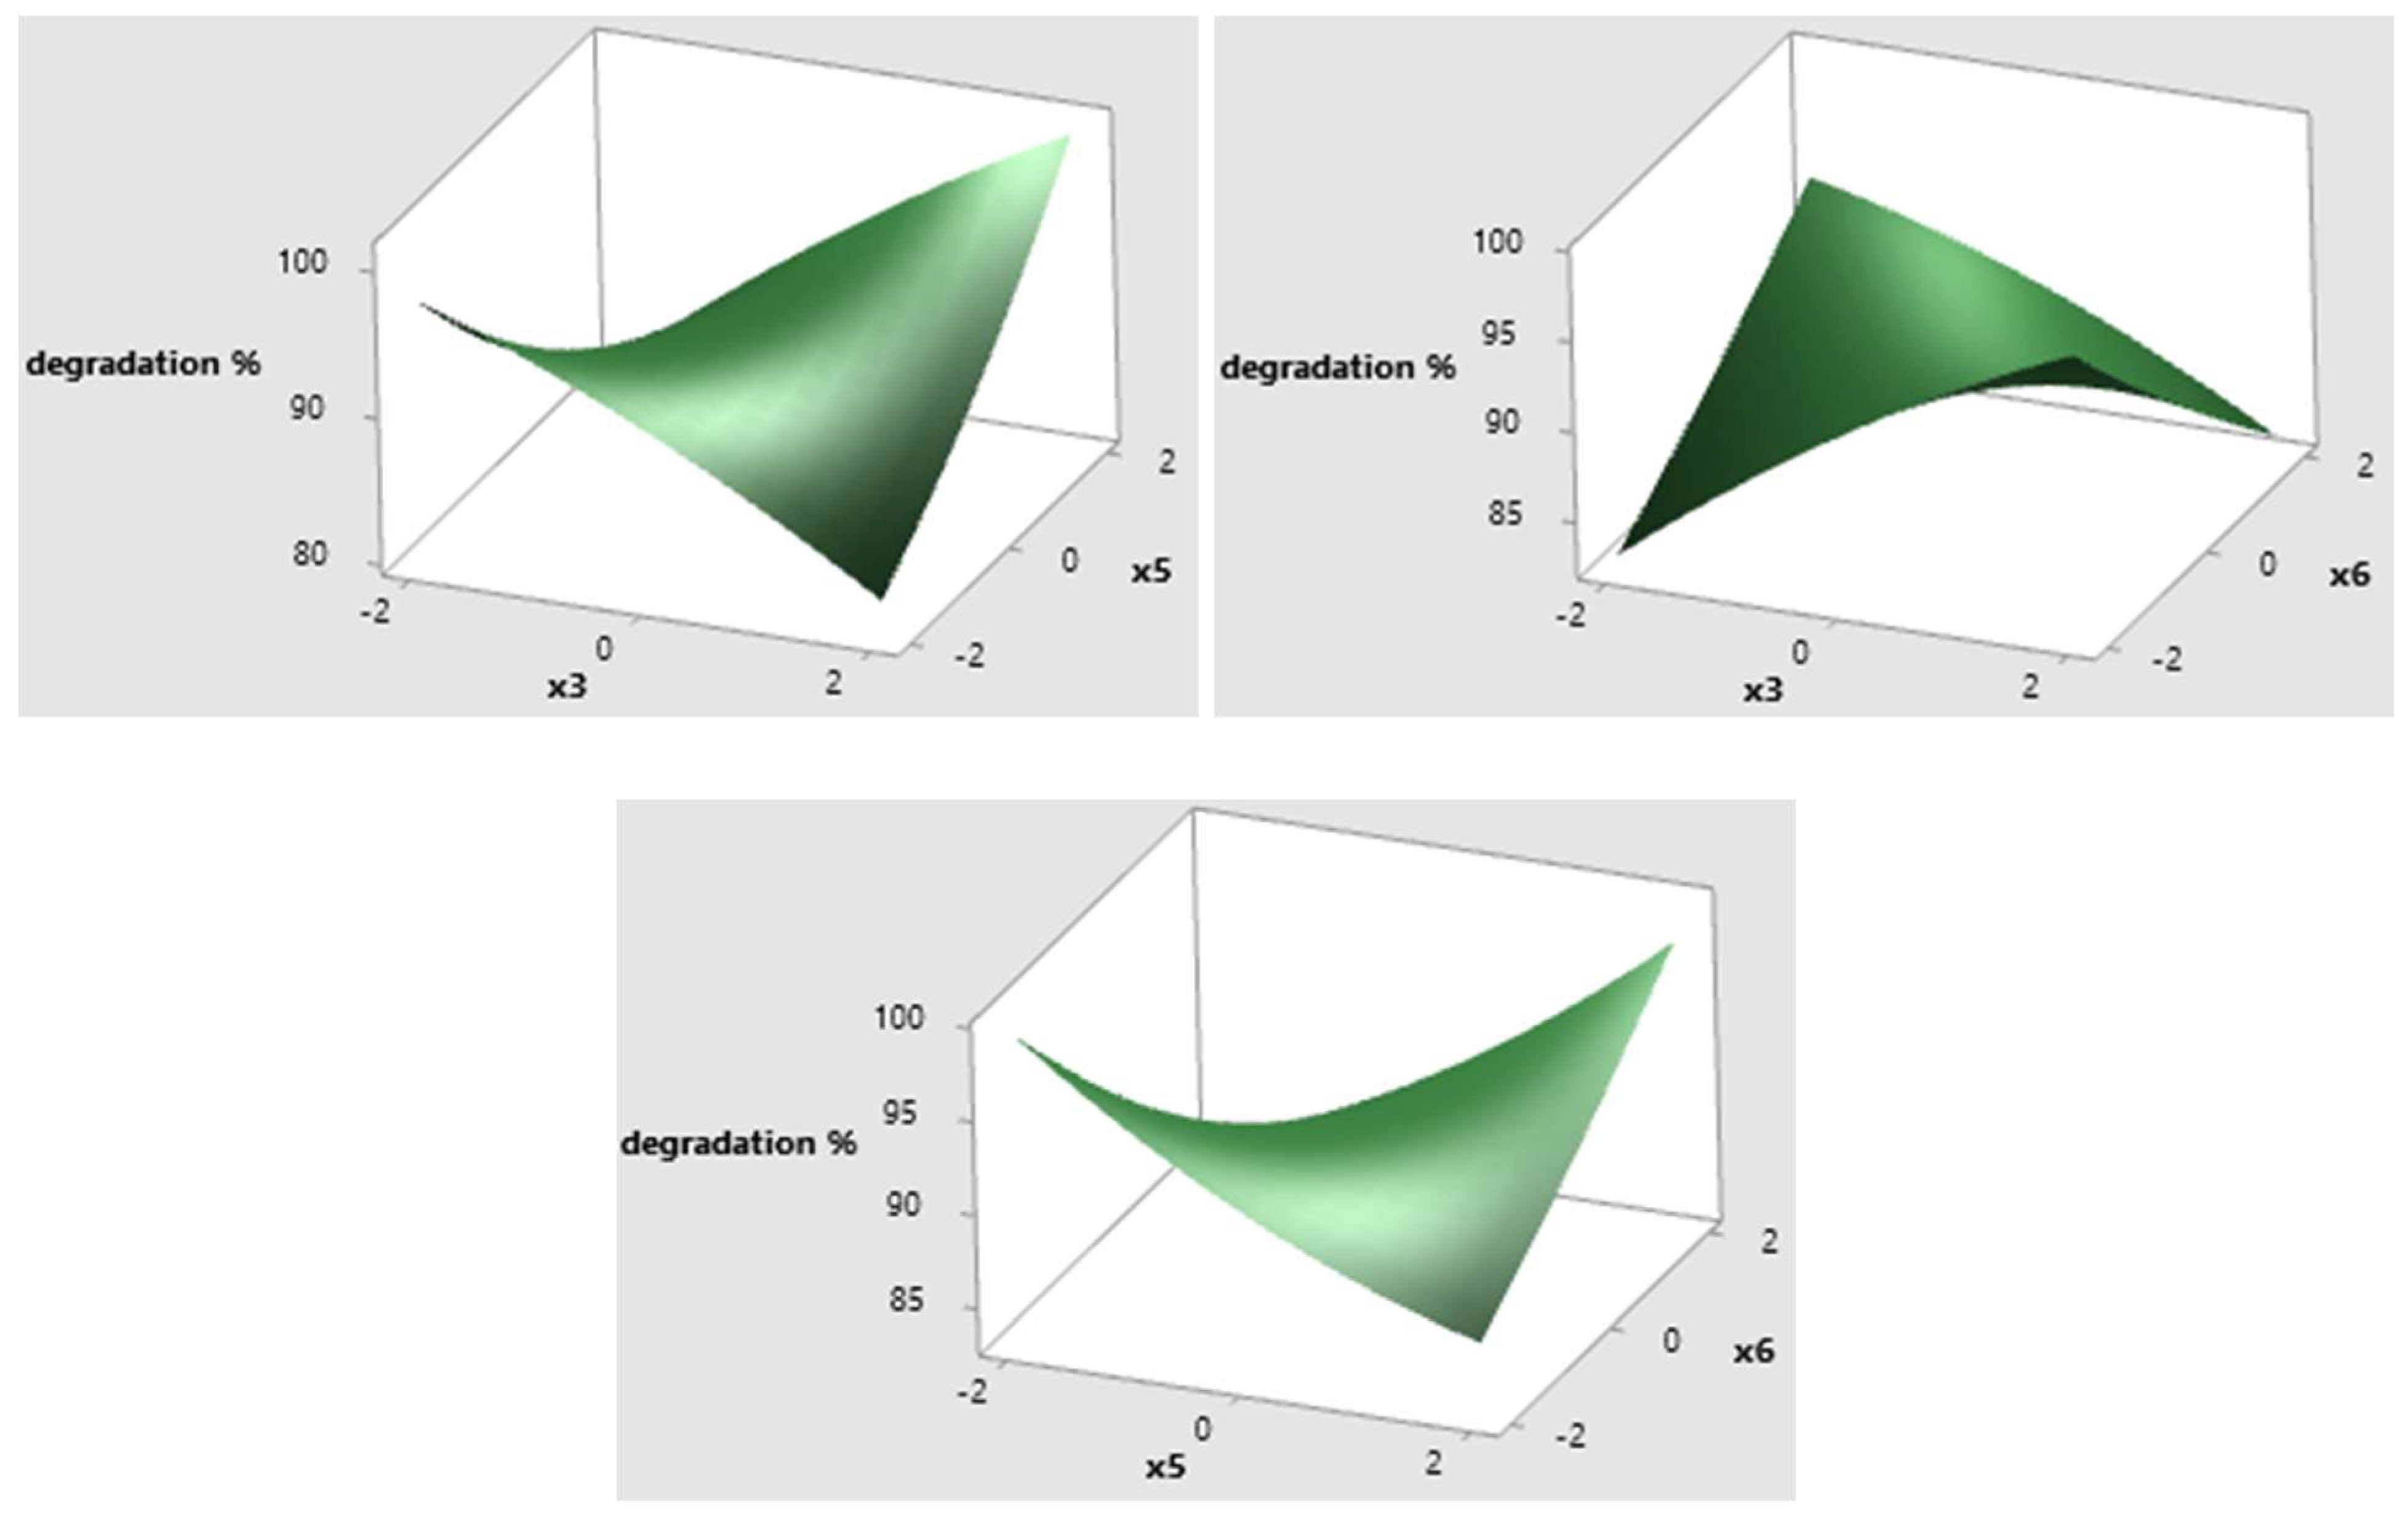
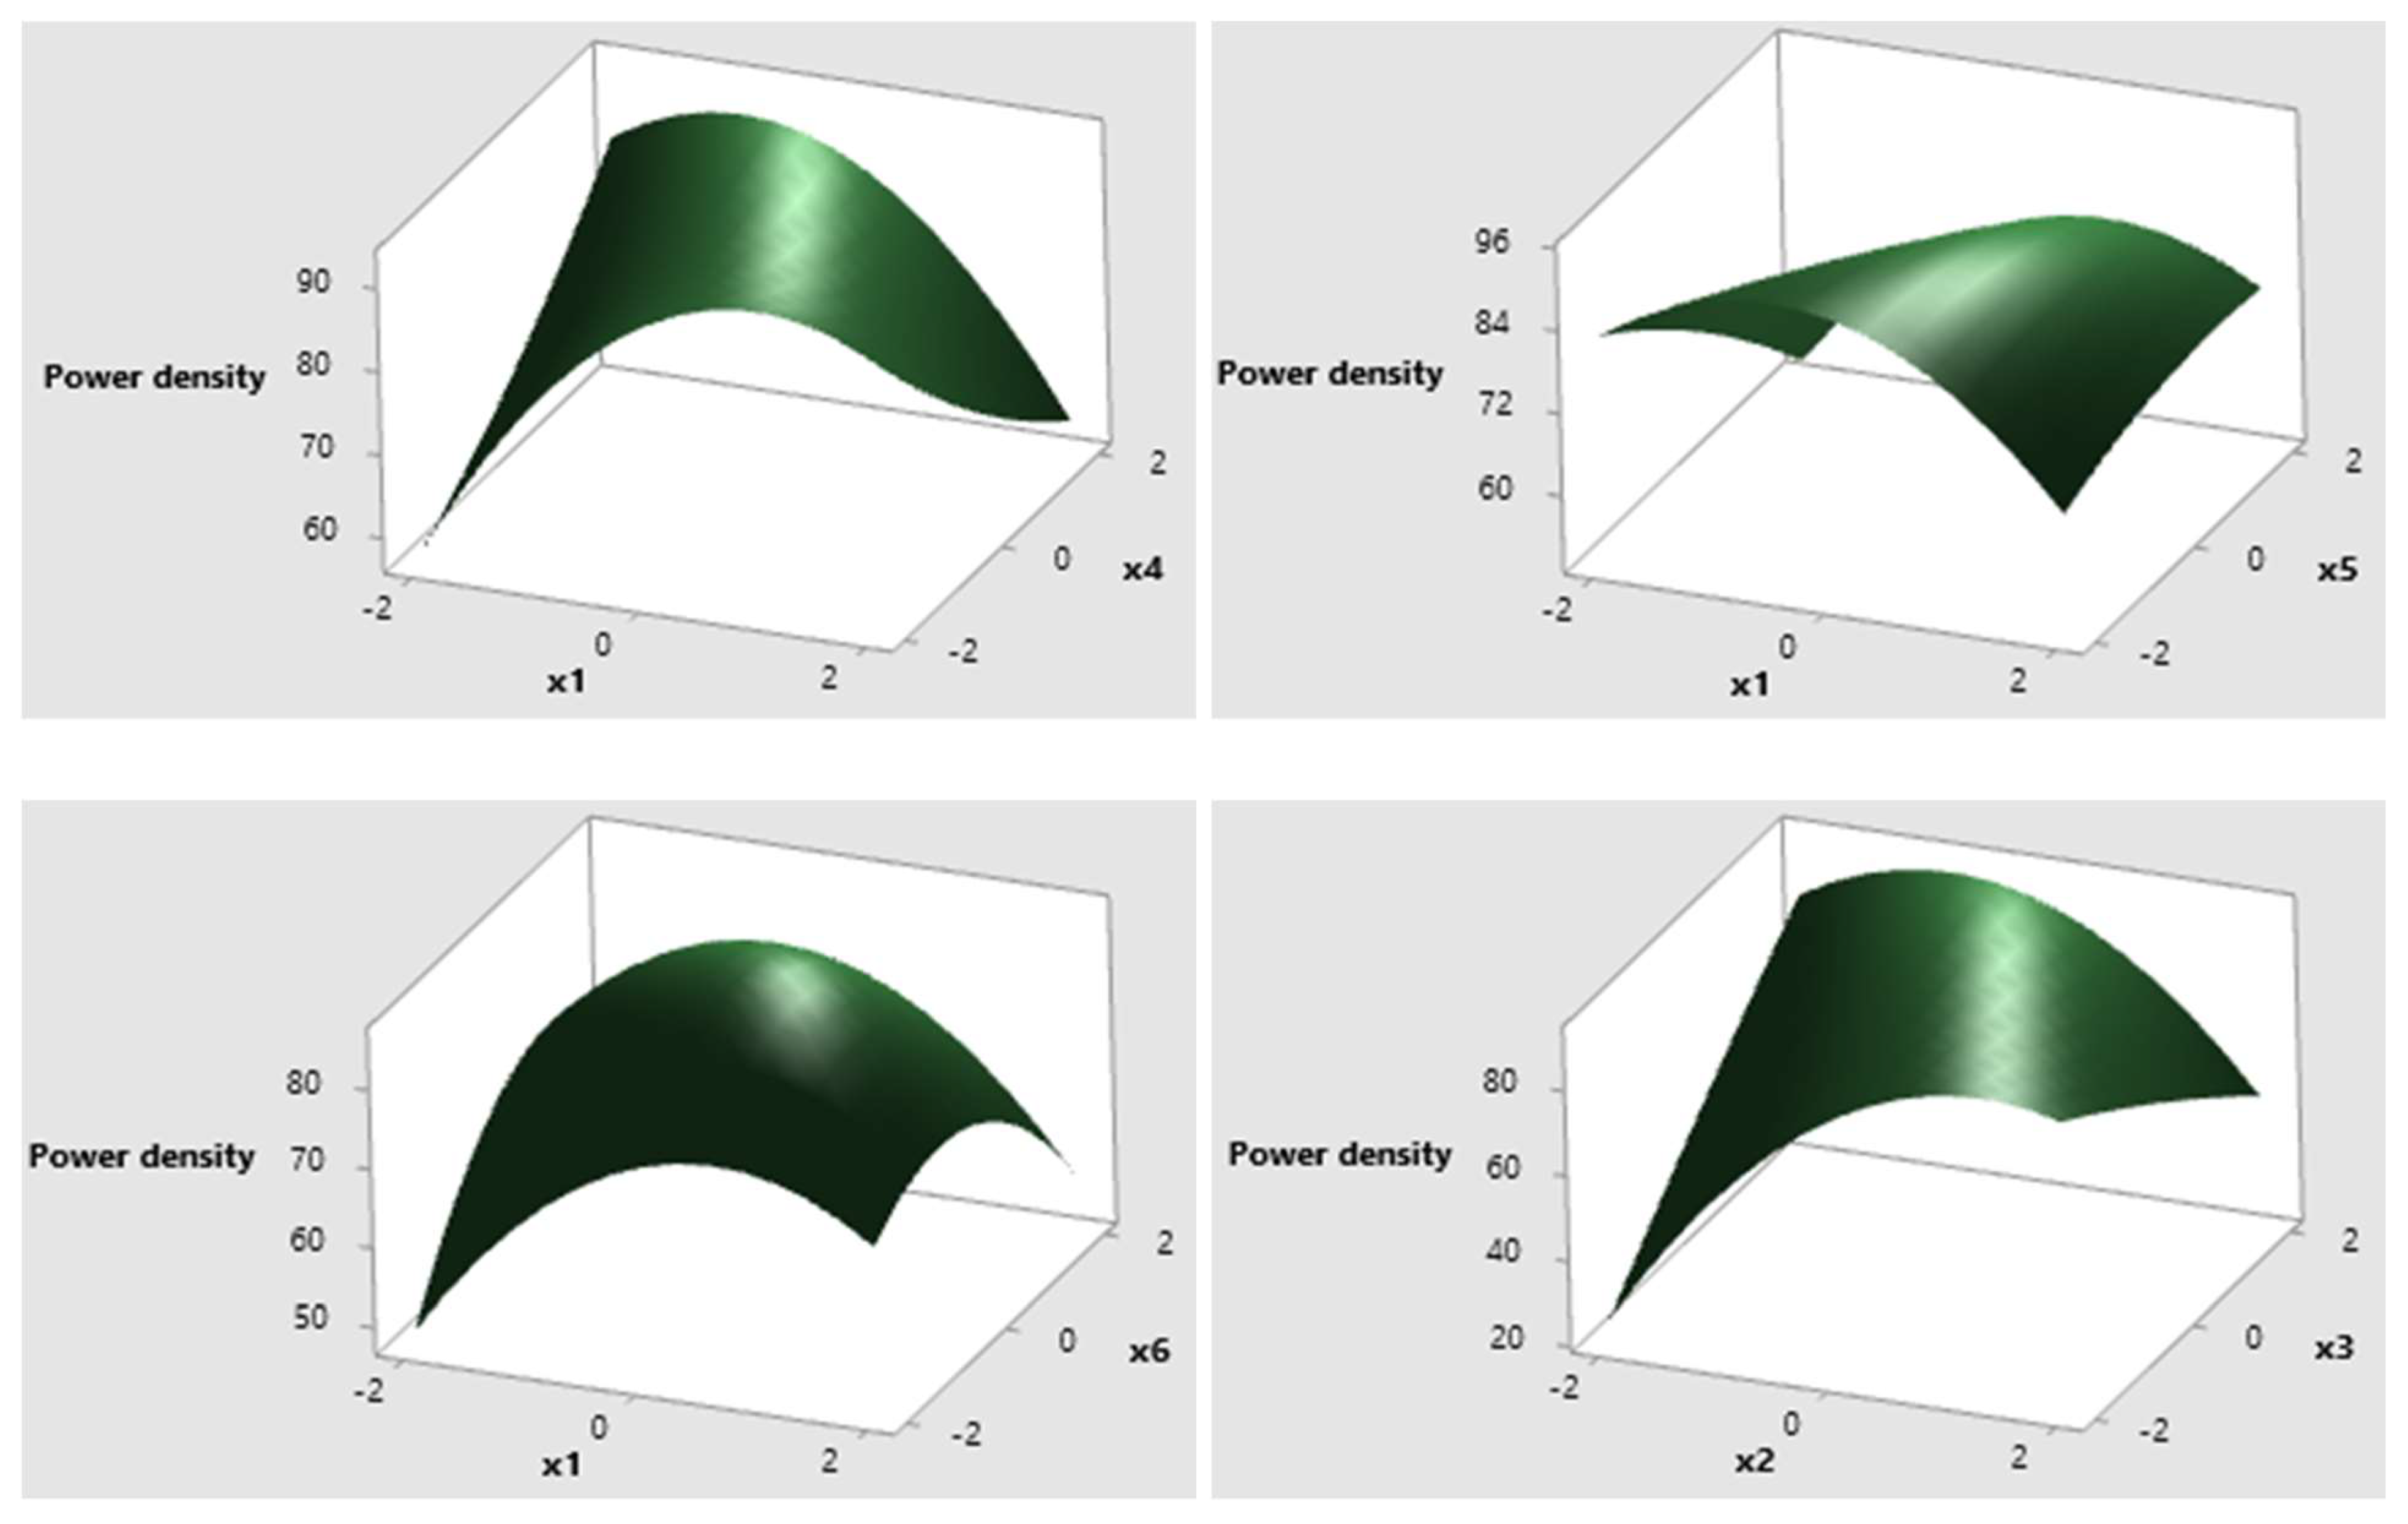
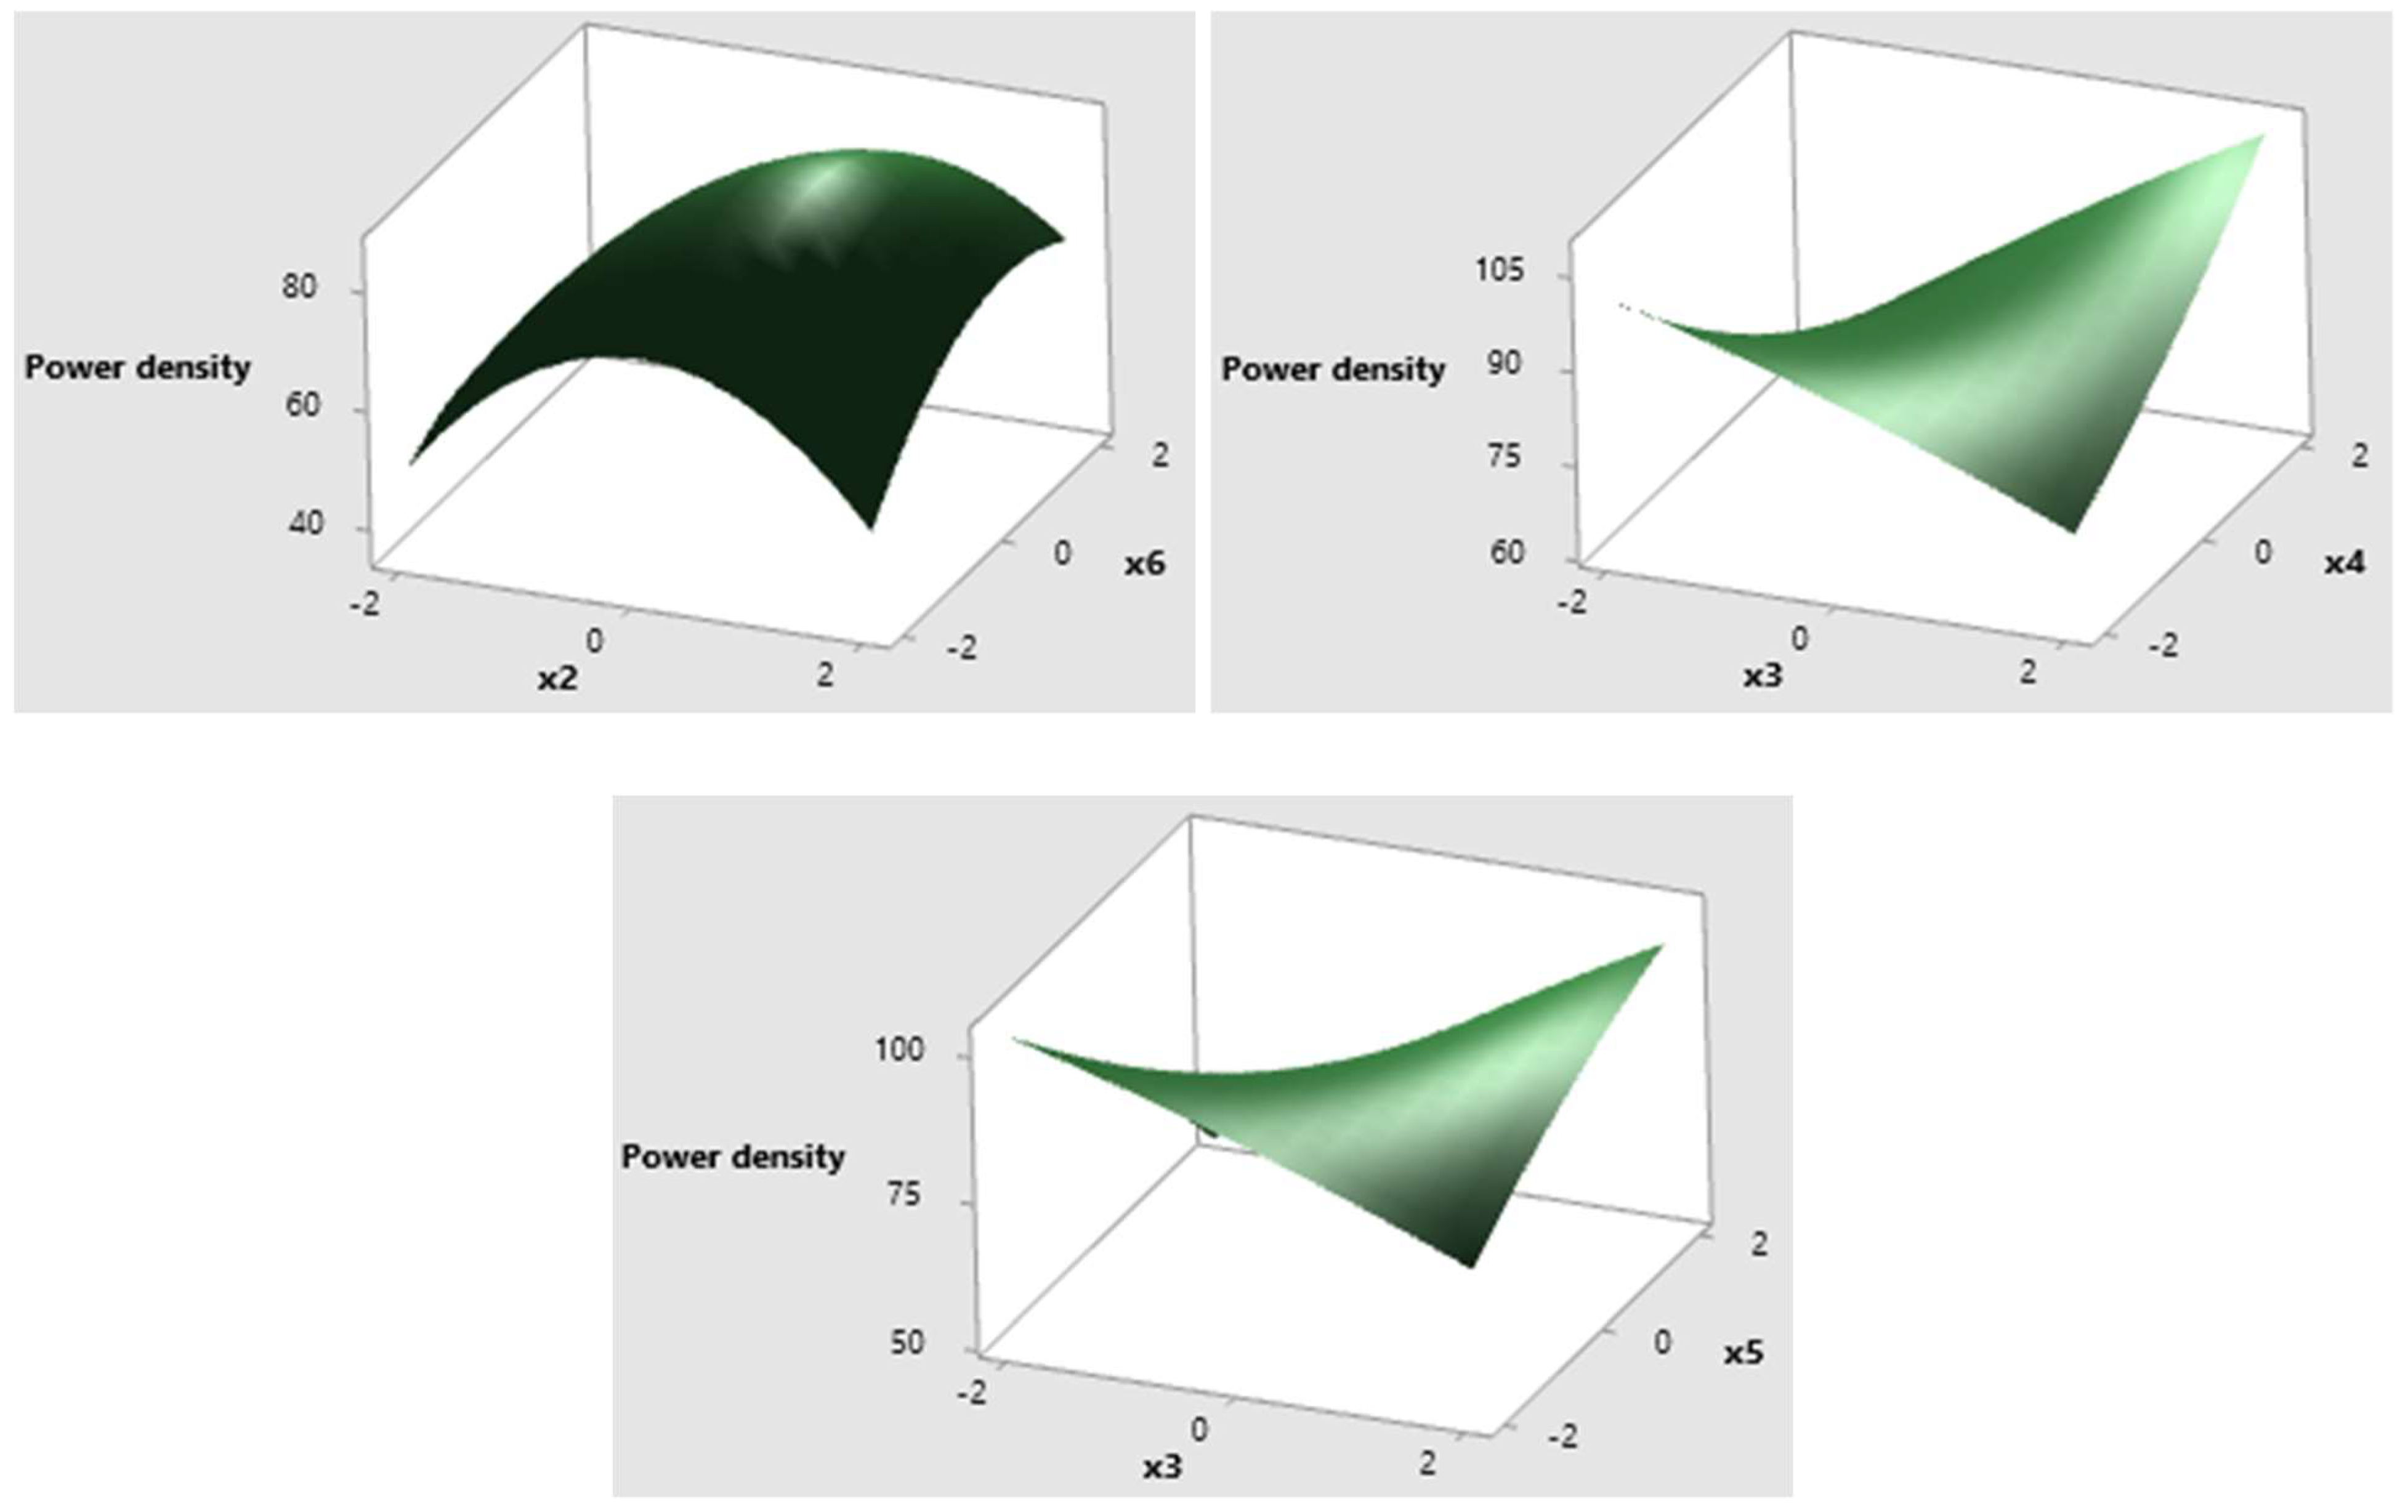
3.2.2. Central Composite Design (CCD)

Parameters, namely: inoculum size (x1), incubation period (x2), phenol concentration (x3), MgSO4 (x4), CaCl2 (x5), and K2HPO4 (x6) were investigated using Minitab 19® with phenol degradation and bioelectricity generation (Table 5) as responses. The results of the second-order response surface model fitting in the form of an analysis of variance (ANOVA) were calculated (Table 6). The phenol degradation model was shown to be significant with (S = 2.0, R-sq = 95.64%, R-sq(adj) = 90.93% and R-sq(pred) = 68.30%) and regression equation:
Phenol degradation % = 89.866 + 0.413 x1 − 0.458 x2 + 0.580 x3 + 0.173 x4 + 0.209 x5 − 0.584 x6 − 0.144 x1x1 − 5.304 x2x2 − 0.293 x3x3 − 1.014 x4x4 + 0.382 x5x5 + 0.112 x6x6 + 1.104 x1x2 − 0.123 x1x3 − 3.839 x1x4 − 0.816 x1x5 + 1.473 x1x6 + 1.663 x2x3 + 0.562 x2x4 − 2.584 x2x5 + 1.159 x2x6 − 0.780 x3x4 + 2.247 x3x5 − 1.589 x3x6 − 0.445 x4x5 − 0.431 x4x6 + 1.694 x5x6
However, the bioelectricity generation model was also shown to be significant with (S = 5.04, R-sq = 91.70%, R-sq(adj) = 82.74% and R-sq(pred) = 56.99%) and regression equation:
Power density = 85.75 + 0.668 x1 + 3.982 x2 + 2.240 x3 − 0.305 x4 − 3.258 x5 + 0.500 x6 − 3.854 x1x1 − 5.926 x2x2 − 0.353 x3x3 + 0.611 x4x4 − 0.591 x5x5 − 2.728 x6x6 − 0.842 x1x2 + 1.618 x1x3 − 3.548 x1x4 + 2.275 x1x5 − 2.098 x1x6 − 5.855 x2x3 + 0.716 x2x4 + 0.926 x2x5 + 1.877 x2x6 + 4.385 x3x4 + 4.561 x3x5 − 0.610 x3x6 + 1.585 x4x5 + 0.354 x4x6 + 2.054 x5x6
Furthermore, the 3D curve interpretation revealed that the phenol biodegradation percentage and bioelectricity power density increased by decreasing the inoculum size and incubation period (Figure 4 and Figure 5). The correlation between the initial phenol concentration (x3) and the incubation period (x5) revealed that, upon increasing both factors, maximum phenol degradation and bioelectricity generation was noticed (almost in a similar pattern) (Figure 4 and Figure 5), while a completely different pattern was noticed when correlating between the initial phenol concentration (x3) and pH (x4) (Figure 4 and Figure 5). This is in accordance with Puig et al. [26], who stated that, by increasing the pH to be higher than the optimal one, anodic bacteria were affected, and power generation ceased. Moreover, it was reported that, when the cultural media pH decreased with growth, the phenol degradation was impeded below pH 5.4 [27].
The optimization study of phenol degradation and bioelectricity generation revealed that the optimum values for each factor that yield the maximum percentage of phenol degradation (93.34%) and power density (109.419 mW/cm3) were: bacterial inoculum concentration, 1.0%; incubation period, 48 h; phenol concentration, 6.0 ppm; MgSO4 concentration, 70.0 mg/L; K2HPO4 concentration, 175 mg/L; and CaCl2 concentration, 1.0 mg/L.
Aisami et al. [28] considered Pseudomonas sp. strain AQ5-04 as a phenol degrader. Upon optimization, a pH value of 6.8 was identified as the best pH for phenol degradation. The bacterium was able to degrade up to 90% out of 5 mg/L phenol. However, the maximum percentage of phenol biodegradation has been shown to be 92.64% with the optimized conditions when compared to unoptimized conditions in the same unit volume [29]. Furthermore, the biodegradation of phenolic compounds in MFC exhibited a power density of 67.2 mW/m2 and phenol degradation of 83.2% [21].

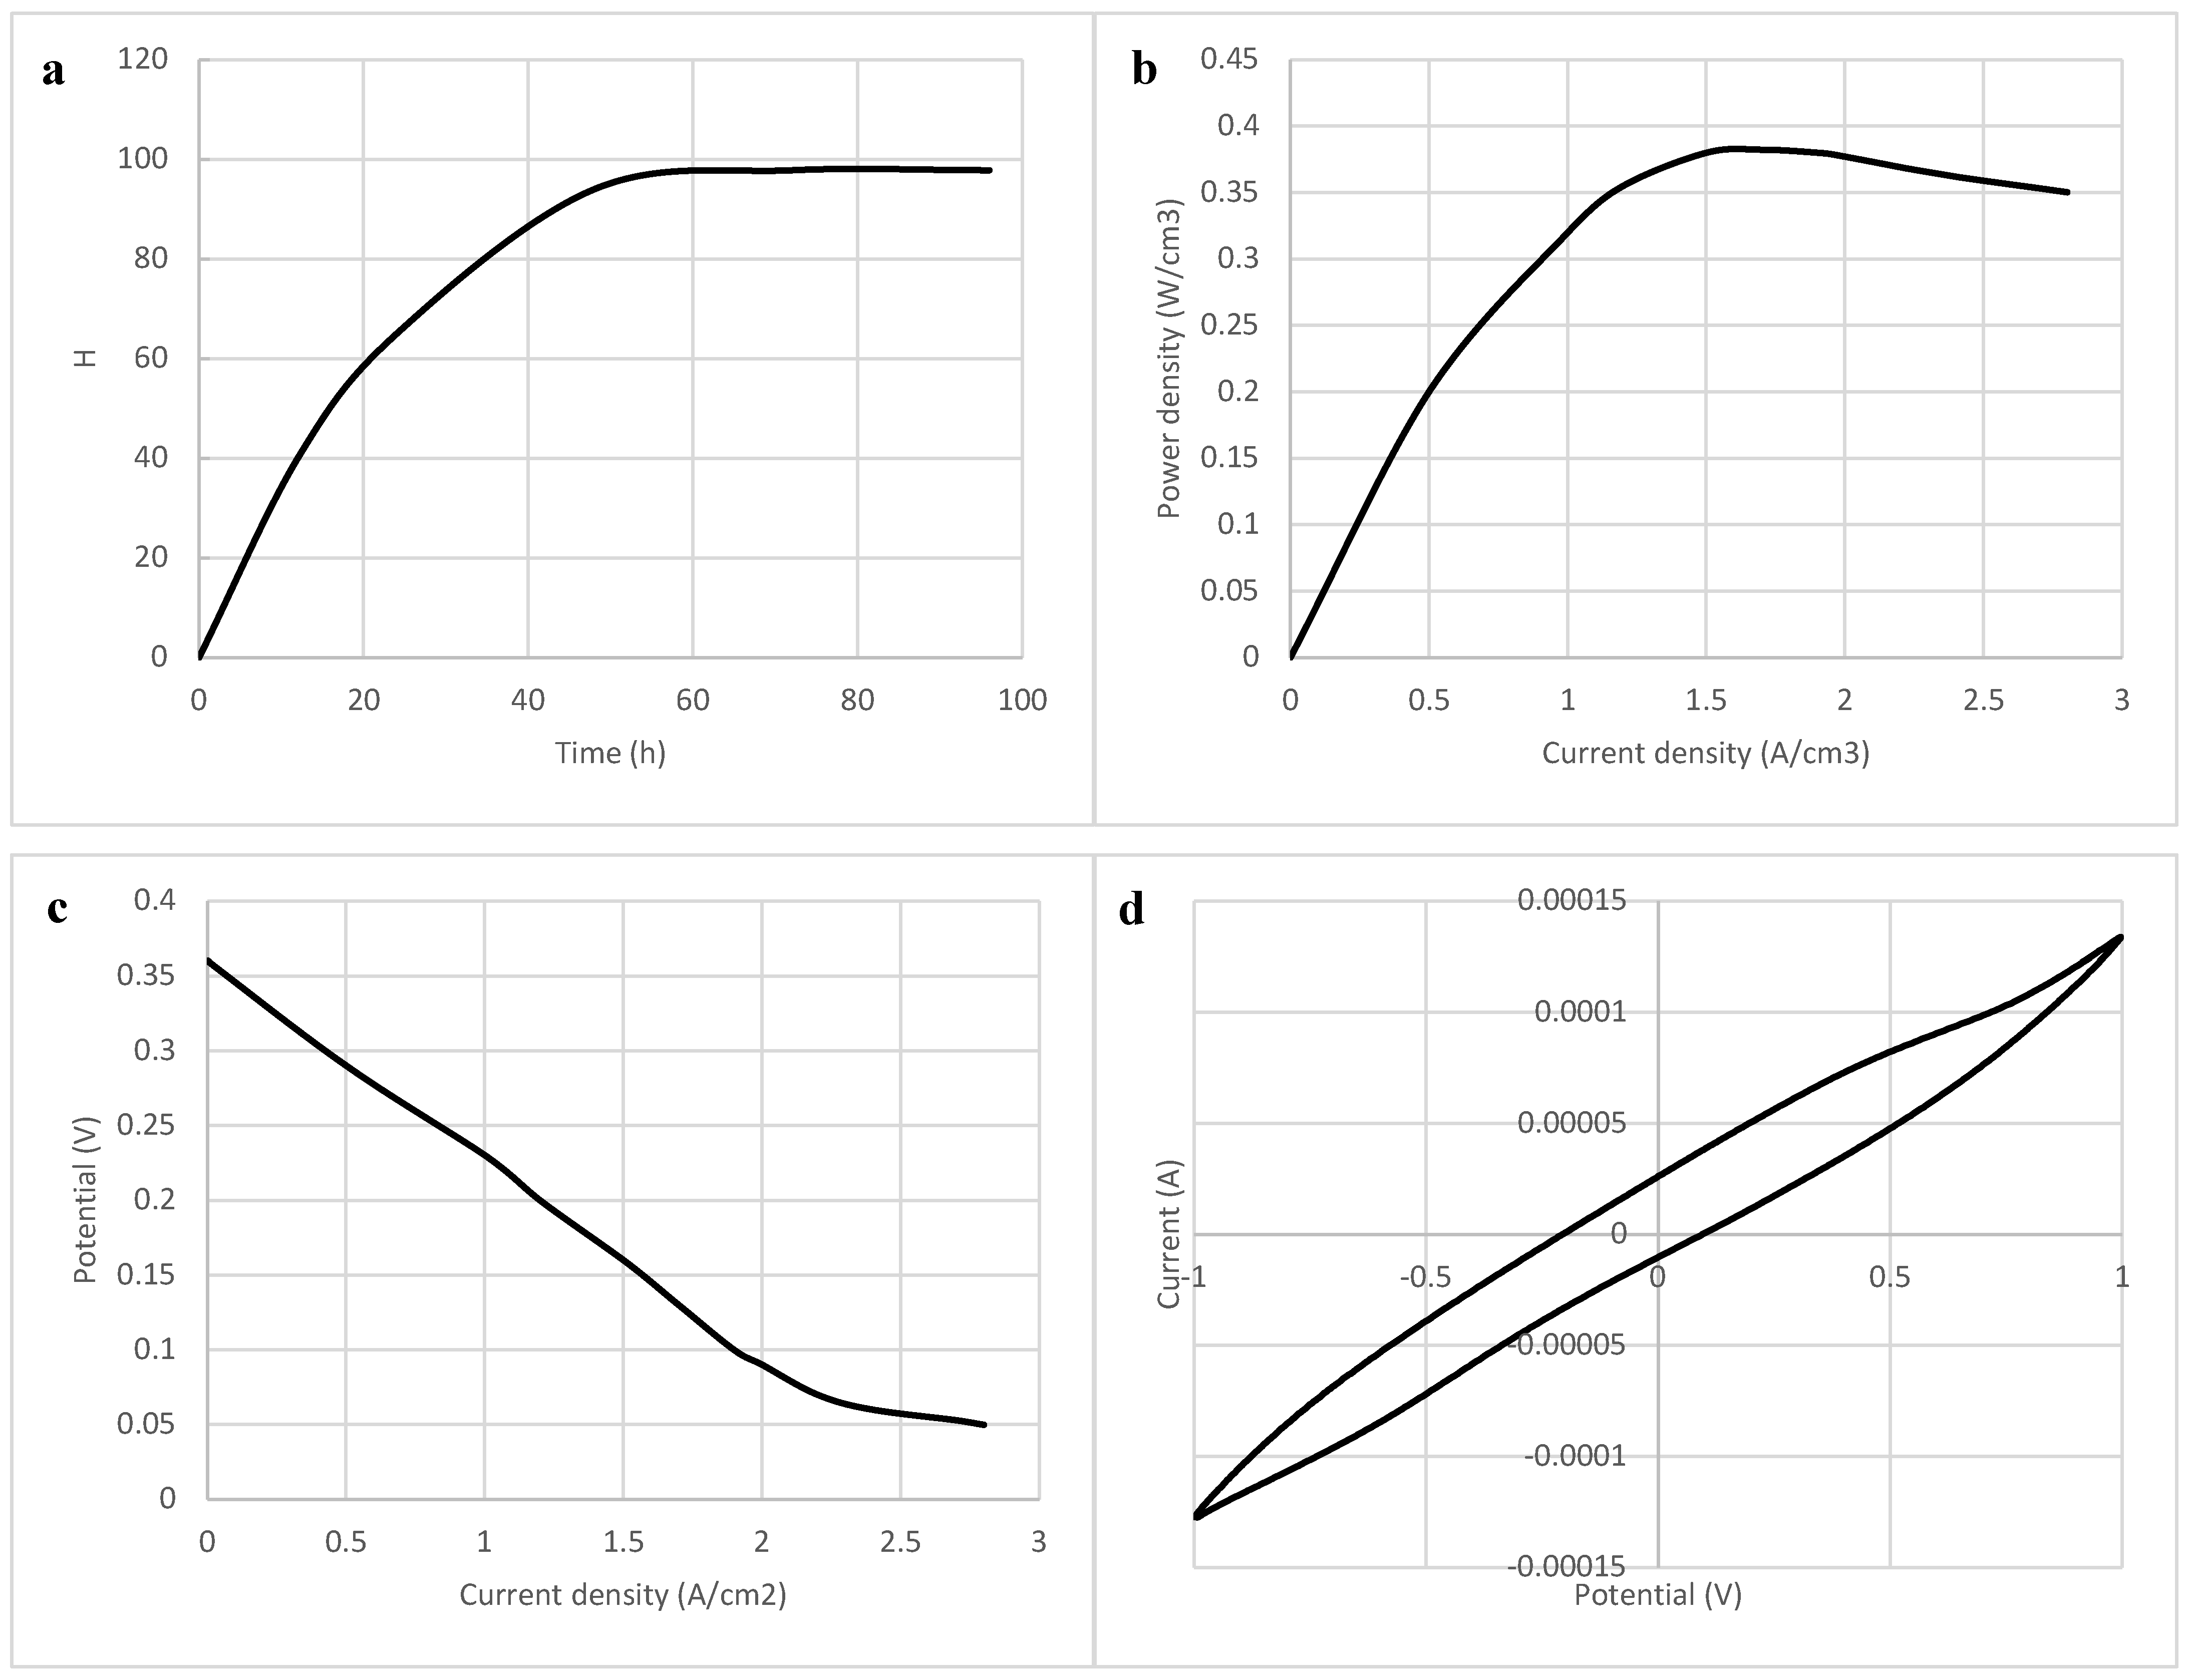
3.3. Bioelectricity Generation and Phenol Biodegradation under Continuous Conditions Using a Stir Tank Bioreactor

The data in Figure 6a show the phenol biodegradation percentage within 96 h, and revealed a sharp reduction in phenol with maximum phenol degradation (97.8%) after 48 h incubation using a 4 L continuous stir tank bioreactor. Moreover, the data in Figure 6b show the bioelectricity generation revealing a significant increase in the power density during the first 24 h and reaching an optimum value (0.382 mW/cm3) after 72 h incubation. However, the Potentiodynamic polarization curve showed a sharp decrease in the generated potential (V) while increasing the current density (Figure 6c). Furthermore, cyclic voltammogram showed a steady state with a peak current at about 0.98 and 0.62 V corresponding to the phenol biodegradation (Figure 6d).
It was reported that, in fed batch MFC, phenol biodegradation achieved 71.8%, while the bioelectricity reached 0.305 mW/m3 [30]. Furthermore, Moreno et al. [10] stated that biodegradation of phenol produces a concomitant generation of energy in the continuous-flow MFCs. The biodegradation of phenol in batch-operated MFCs with single-rod electrodes was 71%. Nevertheless, changing the mode of operation from batch to continuous flow resulted in increased biodegradation rates as well as increased power and current densities. Additionally, the use of nano-graphite electrodes resulted in an enhancement in the performance of MFCs in terms of the electrochemical outputs produced by the device, and this improvement was seen for batch as well as continuous flow modes of operation. This was owing to the fact that graphite nanoparticles had an enlarged surface area, which made it easier for biofilm to grow and for electrons to be transferred.
Ziaedini et al. [30] reported that phenolic oxidation peaks at 120 ± 30 mV is in association with bacterial cell wall, while the peak at about 600 ± 20 mV can be attributed to a soluble active redox component secreted by electrogenic bacteria into the culture medium.

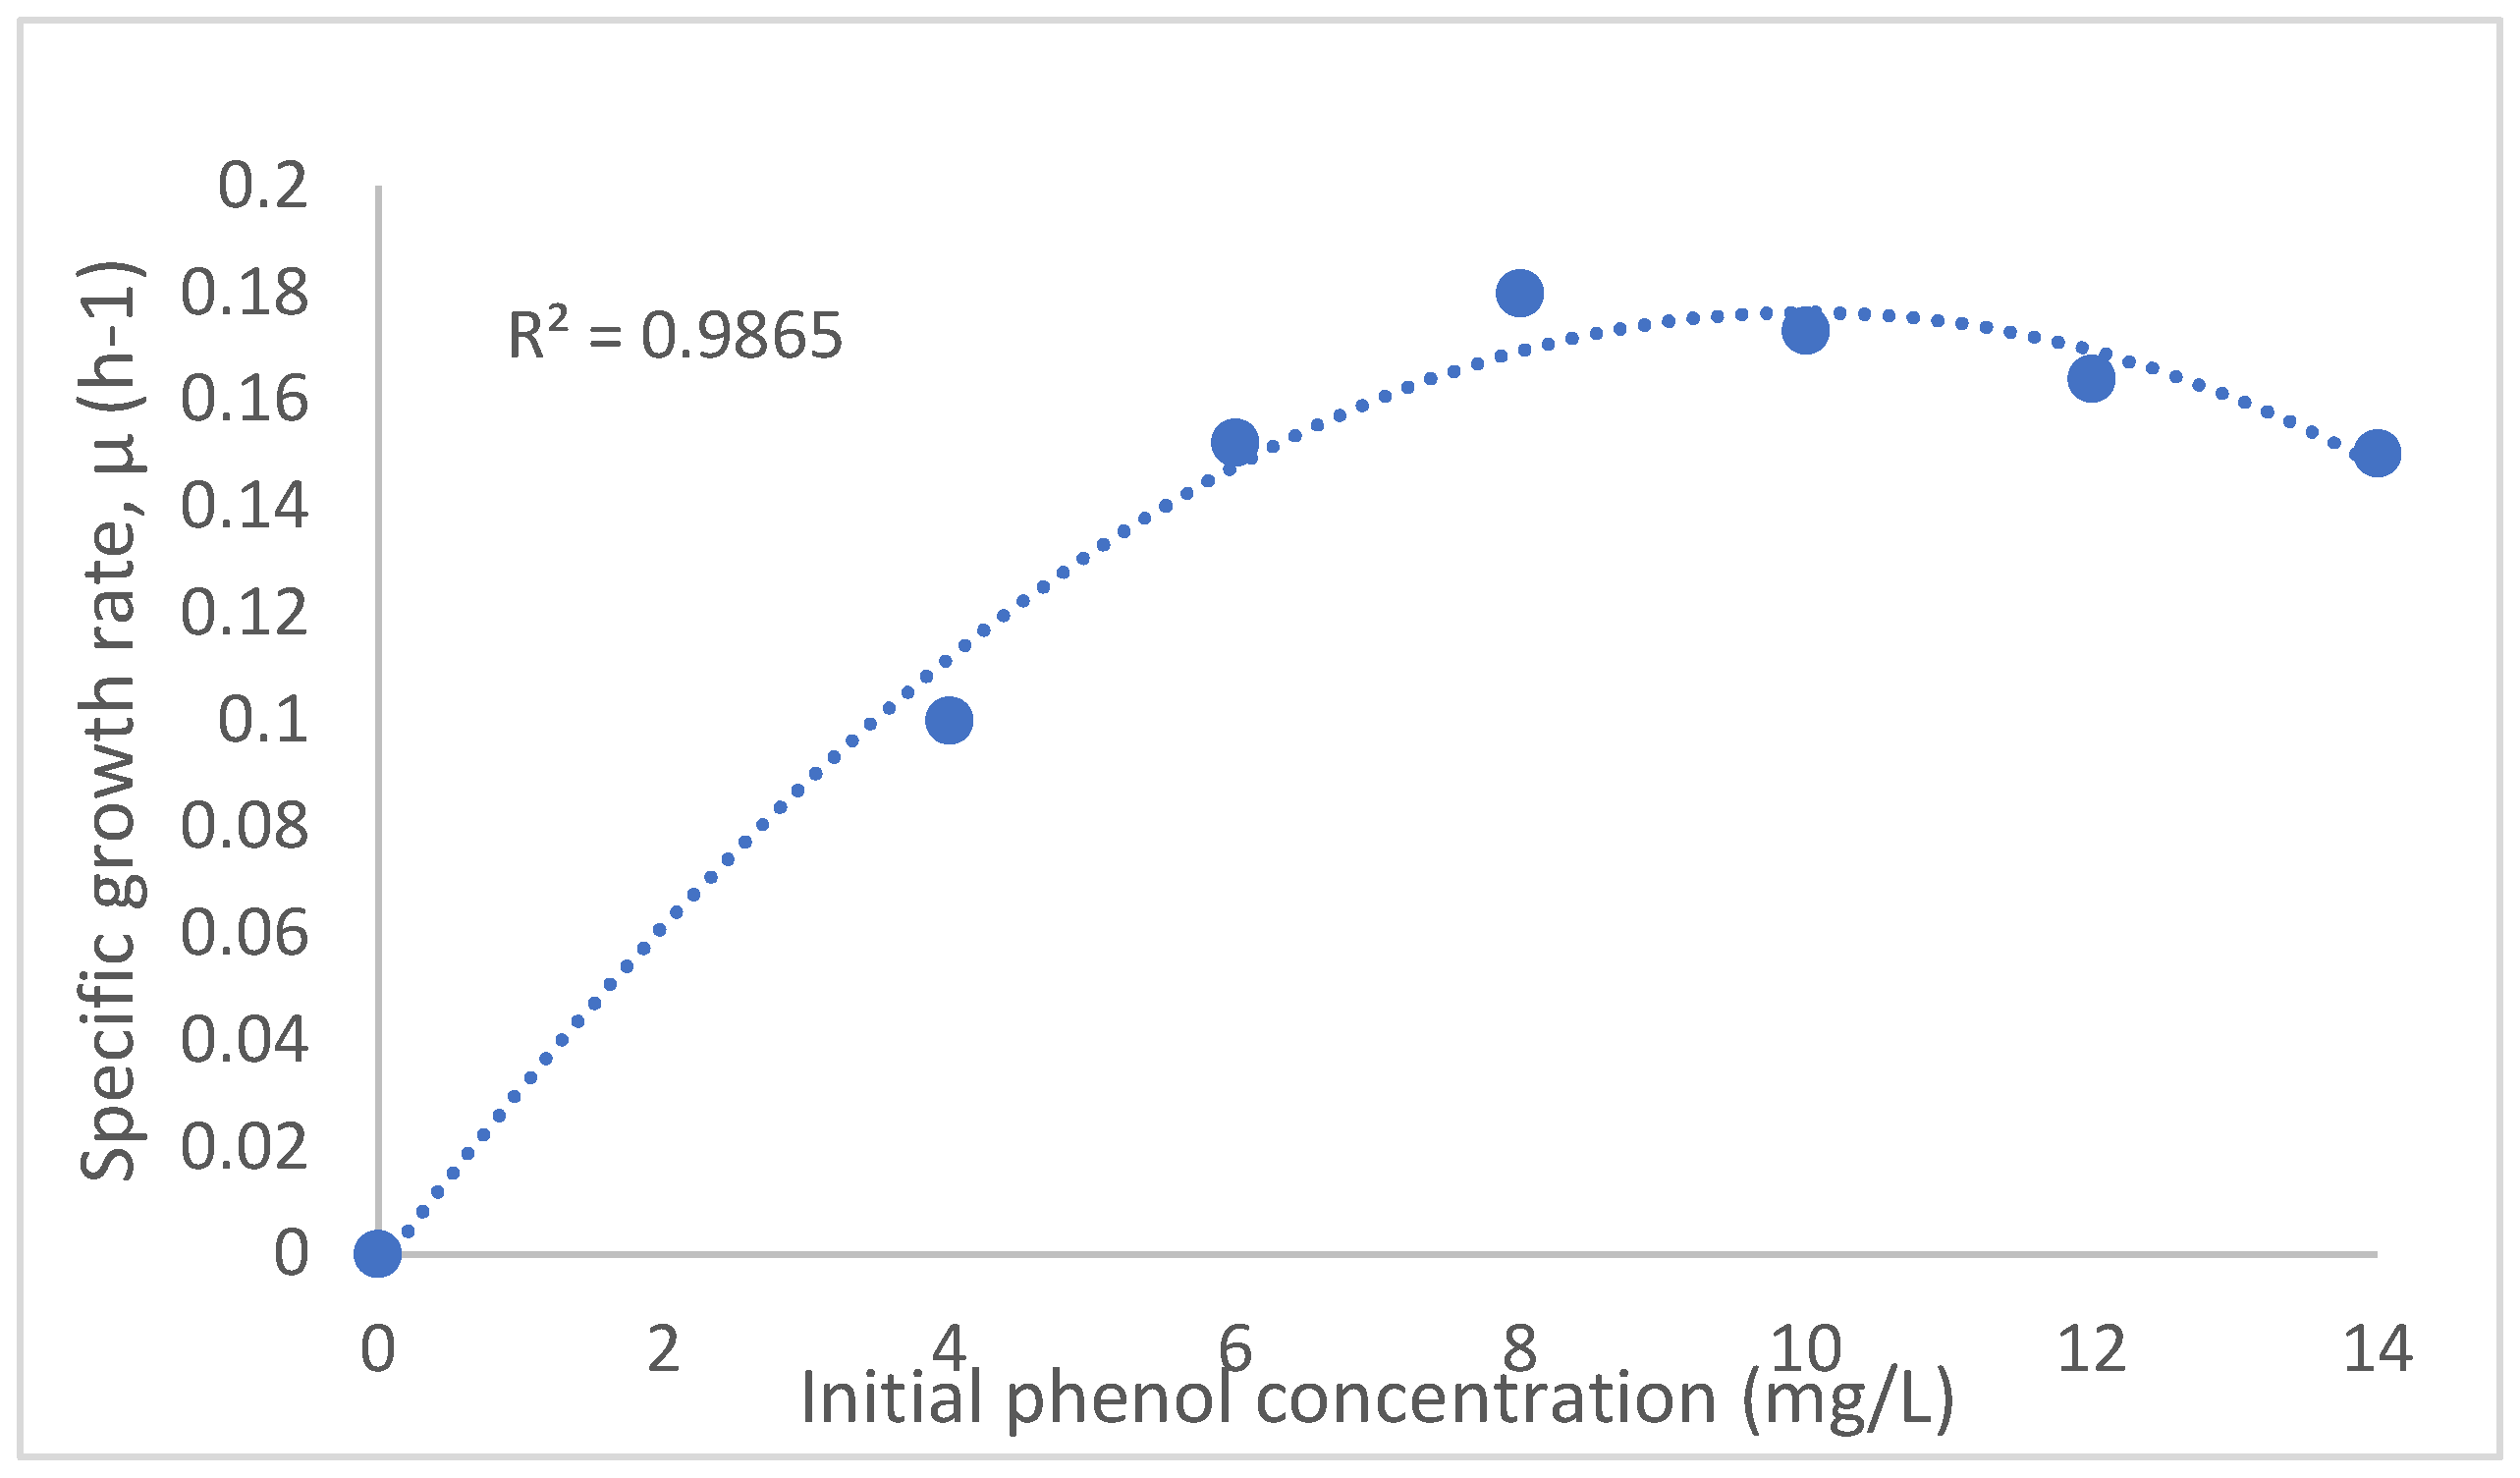
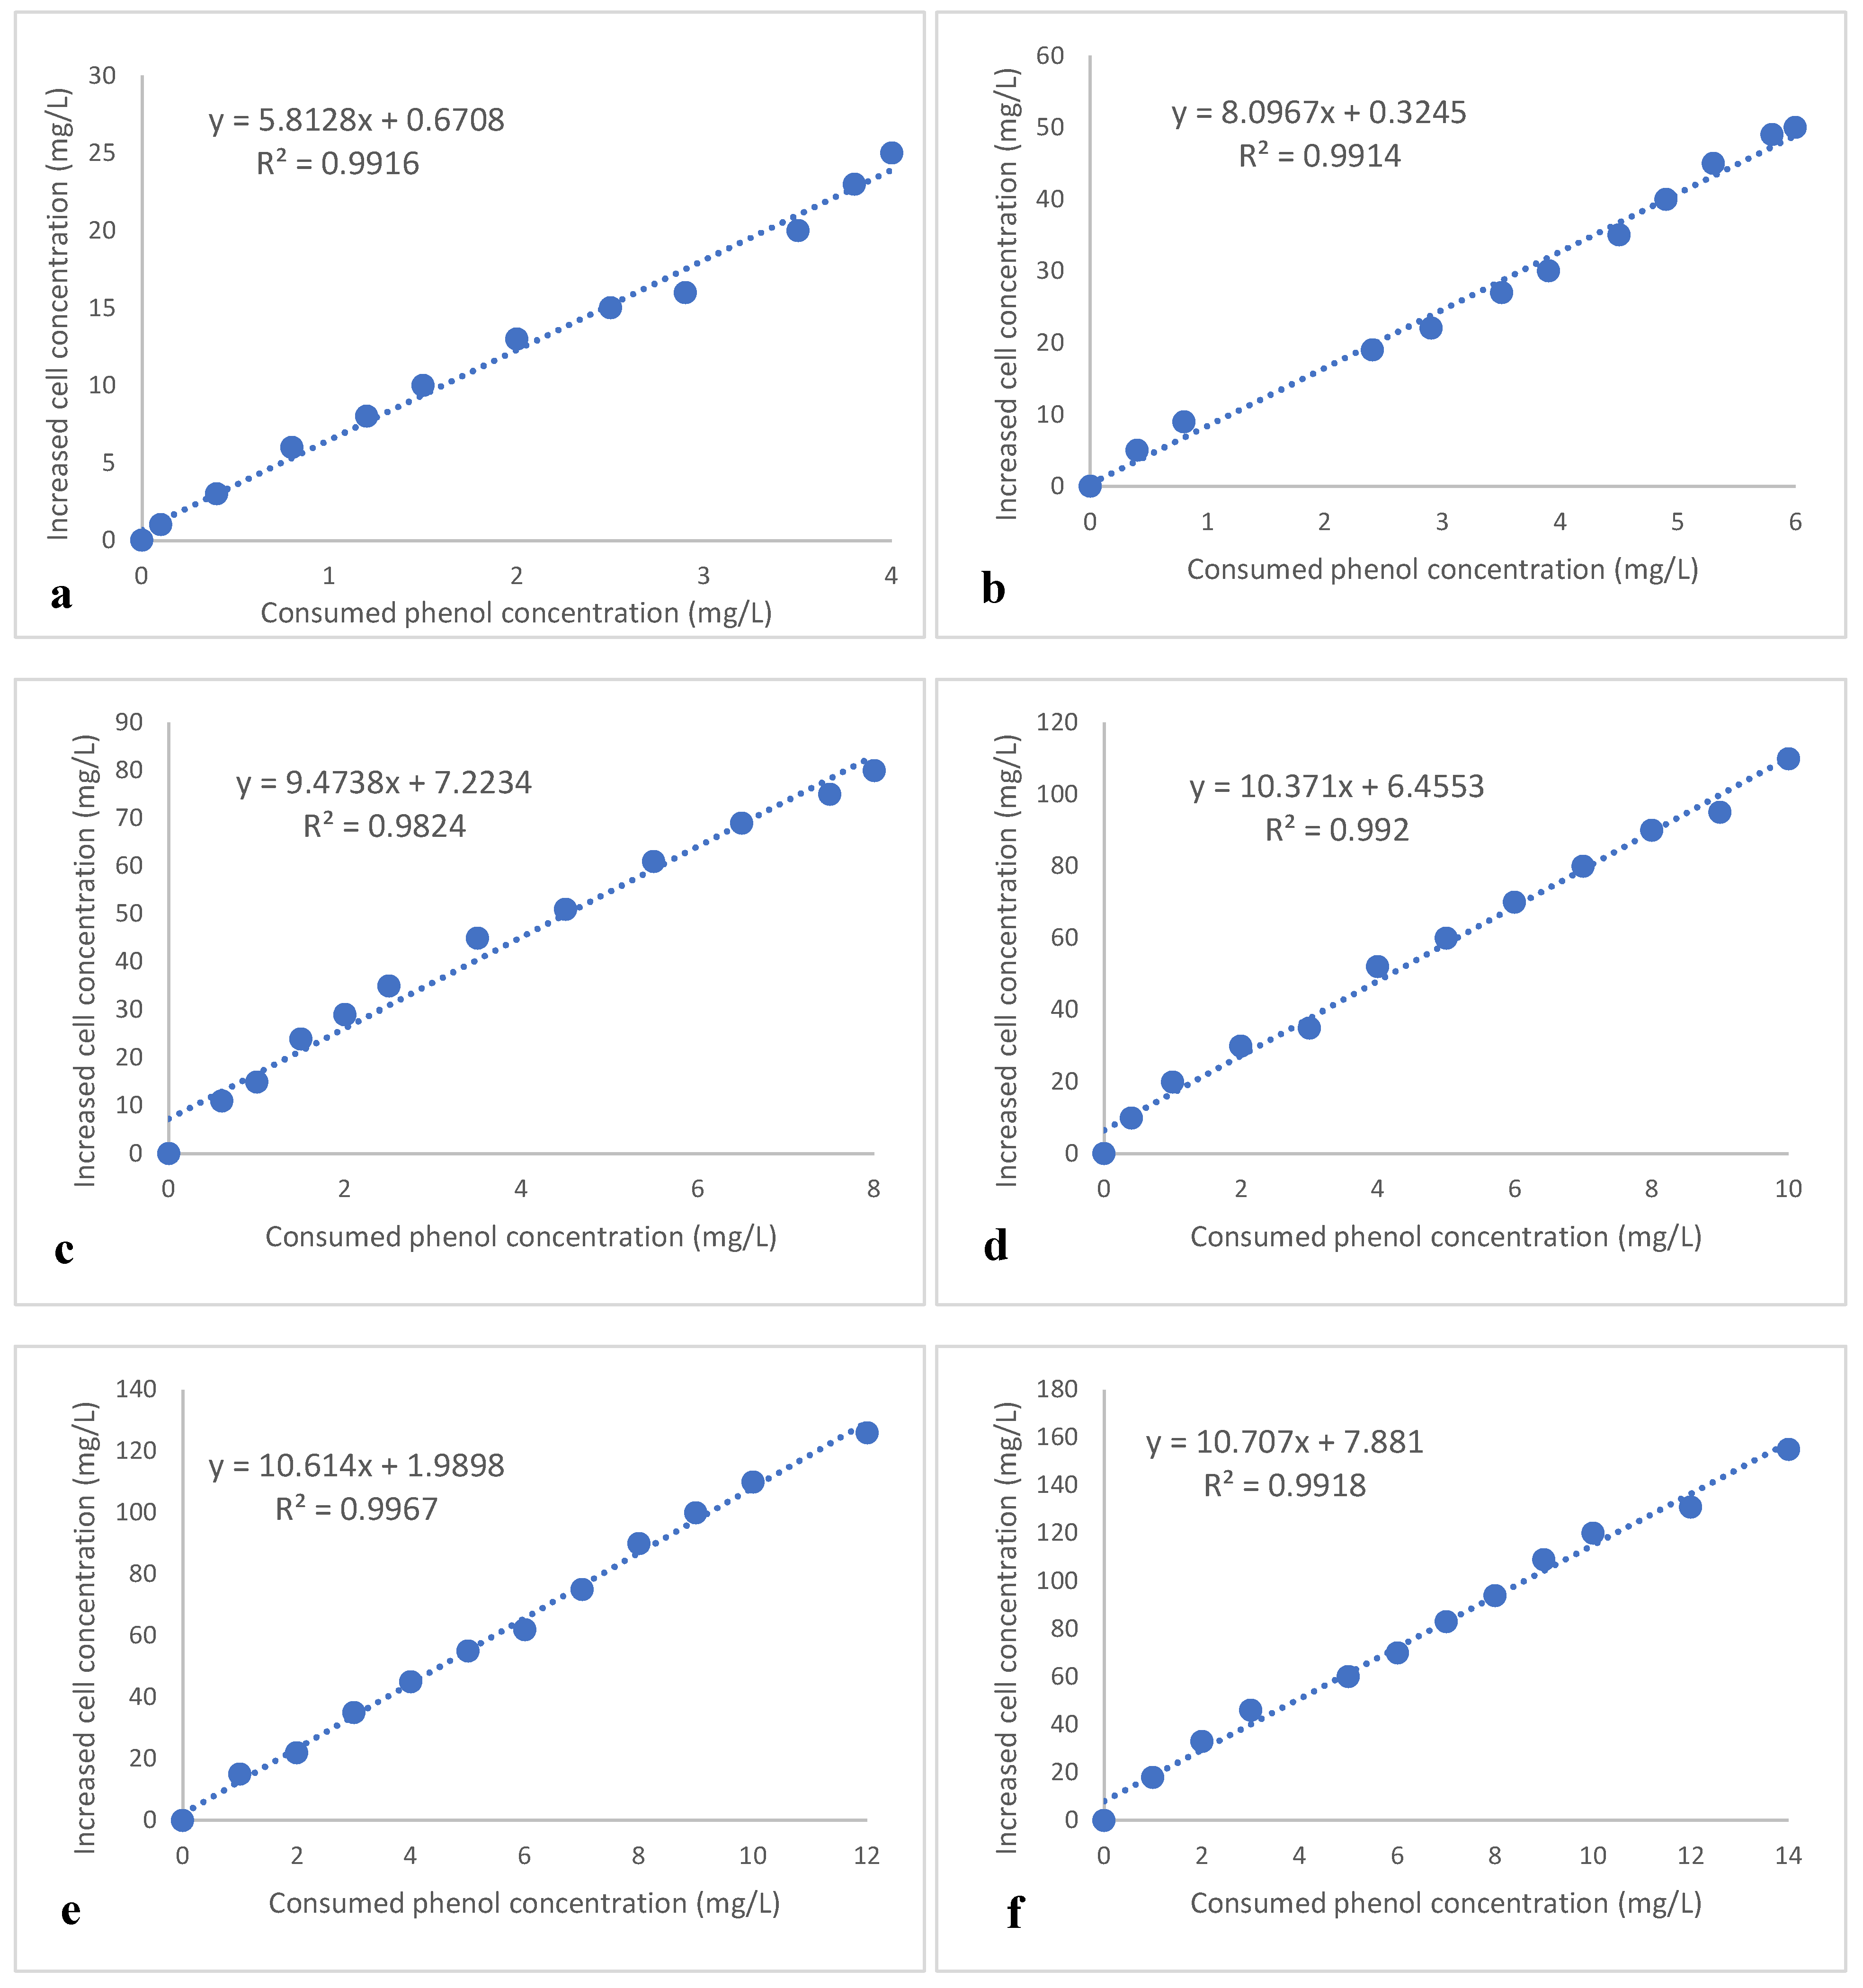
3.4. Kinetics Model for Monitoring the Drastic Effect of Phenol on Bacterial Cells

Using the optimum conditions obtained through the response surface methodology, the data in Figure 7 show the specific growth rate (μ, h−1) variations while using different phenol concentrations. Haldane’s model gave the best fit to achieve a significant correlation coefficient (R2) value (0.9865). It was revealed that the cells reported maximum specific growth rate with an initial phenol concentration of approximately 9 mg L−1. According to Bera et al. [22], a decline in the specific growth rate might be related to the fact that increased concentrations of phenol could inhibit the metabolic activity of bacteria, which would ultimately result in cell death. Based on the results of the current growth kinetic investigation, it was determined that the bacterial cells were capable of efficiently breaking down phenol at concentrations of up to 9 mg L−1. This may be attributed to the fact that the bacterial strains were naturally exposed for extended periods of time to quantities of hazardous petroleum compounds [31]. Hasan et al. [32] reported that Pseudomonas and Bacillus sp. strains transformed phenol into catechol via the ortho-cleavage pathway. It was reported that Burkholderia sp. can use both the catechol and protocatechuate branches of the β-ketoadipate pathway during the early stage of phenol degradation, and only the catechol branch during the late stage [33]. In another study, Burkholderia sp. was reported to use a meta-ring opening cleavage phenol degradation pathway [34]. Hence, the observed high specific growth rate, initial phenol concentration, and high phenol degradation and bioelectricity generation could be attributed to the fact that we are using a bacterial consortium which may use different phenolic degradation pathways.
As plotted in Figure 8, the bacterial growth yield (Y) was estimated using Equation (3). The calculated values of bacterial growth yield while using phenol as a sole carbon source were listed in Table 7. When the initial phenol concentration was between 100 and 600 mg/L, the growth yields ranged from 0.225547 to 0.254036 mg mg−1 with the average growth yield reaching 0.243177 ± 0.011498 mg mg−1. Similar experiments were conducted and higher growth yields were reported while using lower initial phenol concentrations, e.g., Abuhamed et al. [35], who reported a 0.44 mg mg−1 average growth yield upon using 10–200 mg L−1 initial phenol concentrations. Another study by Lin and Gu [31] reported reaching a 0.340 mg mg−1 average growth yield while using 50 to 600 mg L−1 initial phenol concentrations.

4. Conclusions

The data of the present investigation demonstrated that, on using a continuous stir tank bioreactor, phenol degradation and bioelectricity generation reached 97.8% and 0.382 W/cm3, respectively. The optimization analysis for maximum phenol degradation and energy generation showed that the optimal culture conditions were bacterial inoculum concentration, 1.0%; incubation period, 48 h; phenol concentration, 6.0 ppm; MgSO4 concentration, 70.0 mg/L; K2HPO4 concentration, 175 mg/L; and CaCl2 concentration, 1.0 mg/L. Moreover, the aeration rate, agitation speed, and dissolved oxygen were 0.5 v/v/m, 750 rpm, and 30%, respectively, using a CCD and nano-graphite electrodes for power estimation. Haldane’s kinetics model reported the best fit to achieve a significant correlation coefficient (R2) value (0.9865) with maximum specific growth rate with an initial phenol concentration of approximately 9 mg L−1. The degradation kinetics study demonstrated that the specific growth rates (μ, h−1) varied with the initial phenol concentration. Therefore, the present study revealed that the consortium of six strains displayed good phenol degradation performance. The phenol degradation rate of the bacterial strains was highly dependent on the initial phenol concentration and could be considered an economical and sustainable approach to the degradation of phenol within industrial wastewater as well as electricity generation.

Author Contributions

Conceptualization, B.H.E., Z.A.O., E.E.D.A.M. and Y.M.Y.; methodology, R.A.E., N.N.H., M.Z., N.N.H., M.H.E. and S.S.; software, R.A.E.; validation, R.A.E., N.N.H., M.H.E., S.S. and B.H.E.; formal analysis, M.Z.; investigation, R.A.E., N.N.H., M.H.E., S.S. and B.H.E.; resources, Z.A.O.; data curation, R.A.E., N.N.H., M.H.E. and S.S.; writing—original draft preparation, R.A.E., B.H.E., Y.M.Y., E.E.D.A.M. and Z.A.O.; writing—review and editing, B.H.E.; visualization, R.A.E., N.N.H., M.H.E. and S.S.; supervision, B.H.E., M.Z., Y.M.Y. and Z.A.O.; project administration, Y.M.Y., E.E.D.A.M. and Z.A.O.; funding acquisition, Y.M.Y., E.E.D.A.M. and Z.A.O. All authors have read and agreed to the published version of the manuscript.

Funding

The research described in the present paper was part of a project entitled “Microbial degradation of phenol containing petroleum effluents and its application in electricity generation”, which was financially supported by the Science, Technology, and Innovation Funding Authority (STIFA) (grant ID: 41612).

Institutional Review Board Statement

Not applicable.

Informed Consent Statement

Not applicable.

Data Availability Statement

Data and material are available from the corresponding author upon reasonable request.

Conflicts of Interest

The authors declare no conflict of interest. The funder agreed for the study to be submitted for publication.

References

  1. Barik, M.; Das, C.P.; Verma, A.K.; Sahoo, S.; Sahoo, N.K. Metabolic profiling of phenol biodegradation by an indigenous Rhodococcus pyridinivorans strain PDB9T N-1 isolated from paper pulp wastewater. Int. Biodeterior. Biodegrad. 2021, 158, 105168. [Google Scholar] [CrossRef]
  2. Hu, W.; Yang, L.; Shao, P.; Shi, H.; Chang, Z.; Fang, D.; Wei, Y.; Feng, Y.; Huang, Y.; Yu, K.; et al. Proton self-enhanced hydroxyl-enriched cerium oxide for effective arsenic extraction from strongly acidic wastewater. Environ. Sci. Technol. 2022, 56, 10412–10422. [Google Scholar] [CrossRef] [PubMed]
  3. Wei, X.; Gilevska, T.; Wetzig, F.; Dorer, C.; Richnow, H.-H.; Vogt, C. Characterization of phenol and cresol biodegradation by compound-specific stable isotope analysis. Environ. Pollut. 2016, 210, 166–173. [Google Scholar] [CrossRef] [PubMed]
  4. Acosta, C.A.; Pasquali, C.L.; Paniagua, G.; Garcinuño, R.M.; Hernando, P.F. Evaluation of total phenol pollution in water of San Martin Canal from Santiago del Estero, Argentina. Environ. Pollut. 2018, 236, 265–272. [Google Scholar] [CrossRef] [PubMed]
  5. Panigrahy, N.; Barik, M.; Sahoo, R.K.; Sahoo, N.K. Metabolic profile analysis and kinetics of p-cresol biodegradation by an indigenous Pseudomonas citronellolis NS1 isolated from coke oven wastewater. Int. Biodeterior. Biodegrad. 2019, 147, 104837. [Google Scholar] [CrossRef]
  6. Mohan, S.V.; Saravanan, R.; Raghavulu, S.V.; Mohanakrishna, G.; Sarma, P. Bioelectricity production from wastewater treatment in dual chambered microbial fuel cell (MFC) using selectively enriched mixed microflora: Effect of catholyte. Bioresour. Technol. 2008, 99, 596–603. [Google Scholar] [CrossRef]
  7. Hemashenpagam, N.; Selvajeyanthi, S. Removal of Phenolic Compound from Wastewater Using Microbial Fuel Cells. In Microbial Fuel Cells for Environmental Remediation; Springer: Singapore, 2022; pp. 279–297. [Google Scholar] [CrossRef]
  8. Hejazi, F.; Ghoreyshi, A.; Rahimnejad, M. Simultaneous phenol removal and electricity generation using a hybrid granular activated carbon adsorption-biodegradation process in a batch recycled tubular microbial fuel cell. Biomass Bioenergy 2019, 129, 105336. [Google Scholar] [CrossRef]
  9. Wu, H.; Fu, Y.; Guo, C.; Li, Y.; Jiang, N.; Yin, C. Electricity generation and removal performance of a microbial fuel cell using sulfonated poly (ether ether ketone) as proton exchange membrane to treat phenol/acetone wastewater. Bioresour. Technol. 2018, 260, 130–134. [Google Scholar] [CrossRef]
  10. Moreno, L.; Nemati, M.; Predicala, B. Biodegradation of phenol in batch and continuous flow microbial fuel cells with rod and granular graphite electrodes. Environ. Technol. 2018, 39, 144–156. [Google Scholar] [CrossRef]
  11. Shebl, S.; Hussien, N.N.; Elsabrouty, M.H.; Osman, S.M.; Elwakil, B.H.; Ghareeb, D.A.; Ali, S.M.; Ghanem, N.B.E.D.; Youssef, Y.M.; Moussad, E.E.D.A.; et al. Phenol Biodegradation and Bioelectricity Generation by a Native Bacterial Consortium Isolated from Petroleum Refinery Wastewater. Sustainability 2022, 14, 12912. [Google Scholar] [CrossRef]
  12. Poi, G.; Aburto-Medina, A.; Mok, P.C.; Ball, A.S.; Shahsavari, E. Bioremediation of phenol-contaminated industrial wastewater using a bacterial consortium—From laboratory to field. Water Air Soil Pollut. 2017, 228, 89. [Google Scholar] [CrossRef]
  13. Hagarová, I.; Nemček, L. Application of Metallic Nanoparticles and Their Hybrids as Innovative Sorbents for Separation and Pre-concentration of Trace Elements by Dispersive Micro-Solid Phase Extraction: A Minireview. Front. Chem. 2021, 9, 672755. [Google Scholar] [CrossRef] [PubMed]
  14. Hawal, T.T.; Patil, M.S.; Swamy, S.; Kulkarni, R.M. A Review on Synthesis, Functionalization, Processing and Applications of Graphene Based High Performance Polymer Nanocomposites. Curr. Nanosci. 2022, 18, 167–181. [Google Scholar] [CrossRef]
  15. Sheha, E.; Farrag, M.; Fan, S.; Kamar, E.; Sa, N. A simple Cl-free electrolyte based on magnesium nitrate for magnesium–sulfur battery applications. ACS Appl. Energy Mater. 2022, 5, 2260–2269. [Google Scholar] [CrossRef]
  16. Rea, V.S.G.; Bueno, B.E.; Cerqueda-García, D.; Sierra, J.D.M.; Spanjers, H.; van Lier, J.B. Degradation of p-cresol, resorcinol, and phenol in anaerobic membrane bioreactors under saline conditions. Chem. Eng. J. 2022, 430, 132672. [Google Scholar] [CrossRef]
  17. Boudraa, H.; Kadri, N.; Mouni, L.; Madani, K. Microwave-assisted hydrodistillation of essential oil from fennel seeds: Optimization using Plackett–Burman design and response surface methodology. J. Appl. Res. Med. Aromat. Plants 2021, 23, 100307. [Google Scholar] [CrossRef]
  18. Du, Y.; Huang, P.; Jin, W.; Li, C.; Yang, J.; Wan, H.; He, Y. Optimization of Extraction or Purification Process of Multiple Components from Natural Products: Entropy Weight Method Combined with Plackett–Burman Design and Central Composite Design. Molecules 2021, 26, 5572. [Google Scholar] [CrossRef]
  19. Wu, B.; Deng, J.; Niu, H.; Liang, J.; Arslan, M.; El-Din, M.G.; Wang, Q.; Guo, S.; Chen, C. Establishing and Optimizing a Bacterial Consortia for Effective Biodegradation of Petroleum Contaminants: Advancing Classical Microbiology via Experimental and Mathematical Approach. Water 2021, 13, 3311. [Google Scholar] [CrossRef]
  20. Li, Q.; Chai, C.; Du, Y.; Cai, J.; Zhao, L. Recombinant Laccase Production Optimization in Pichia pastoris by Response Surface Methodology and Its Application in the Biodegradation of Octyl Phenol and 4-Tert-Octylphenol. Catal. Lett. 2021, 152, 1086–1099. [Google Scholar] [CrossRef]
  21. Shen, J.; Du, Z.; Li, J.; Cheng, F. Co-metabolism for enhanced phenol degradation and bioelectricity generation in microbial fuel cell. Bioelectrochemistry 2020, 134, 107527. [Google Scholar] [CrossRef]
  22. Bera, S.; Kauser, H.; Mohanty, K. Optimization of p-cresol biodegradation using novel bacterial strains isolated from petroleum hydrocarbon fallout. J. Water Process. Eng. 2019, 31, 100842. [Google Scholar] [CrossRef]
  23. Arya, D.; Kumar, S.; Kumar, S. Biodegradation dynamics and cell maintenance for the treatment of resorcinol and p-cresol by filamentous fungus Gliomastix indicus. J. Hazard. Mater. 2011, 198, 49–56. [Google Scholar] [CrossRef] [PubMed]
  24. Yu, X.; Sun, T.; Wan, J. Preparation for Mn/Nanographite materials and study on electrochemical degradation of phenol by Mn/Nanographite cathodes. J. Nanosci. Nanotechnol. 2014, 14, 6835–6840. [Google Scholar] [CrossRef]
  25. Paul, S.; Kumar, T. Development and characterization of Al–Ni and nanographite electrodes for energy storage. Nanomater. Energy 2019, 8, 64–72. [Google Scholar] [CrossRef]
  26. Puig, S.; Serra, M.; Coma, M.; Cabré, M.; Balaguer, M.D.; Colprim, J. Effect of pH on nutrient dynamics and electricity production using microbial fuel cells. Bioresour. Technol. 2010, 101, 9594–9599. [Google Scholar] [CrossRef]
  27. Tibbles, B.J.; Baecker, A.A.W. Effect of pH and inoculum size on phenol degradation by bacteria isolated from landfill waste. Environ. Pollut. 1989, 59, 227–239. [Google Scholar] [CrossRef] [PubMed]
  28. Aisami, A.; Yasid, N.A.; Abd Shukor, M.Y. Optimization of cultural and physical parameters for phenol biodegradation by newly identified Pseudomonas sp. AQ5-04. J. Trop. Life Sci. 2020, 10, 223–233. [Google Scholar] [CrossRef]
  29. Basak, B.; Bhunia, B.; Mukherjee, S.; Dey, A. Optimization of physicochemical parameters for phenol biodegradation by Candida tropicalis PHB5 using Taguchi methodology. Desalination Water Treat. 2013, 51, 6846–6862. [Google Scholar] [CrossRef]
  30. Ziaedini, A.; Rashedi, H.; Alaie, E.; Zeinali, M. Continuous Bioelectricity Generation from Phenol-Contaminated Water by Mediator-Less Microbial Fuel Cells: A Comparative Study between Air-Cathode and Bio-Cathode Systems. Fuel Cells 2018, 18, 526–534. [Google Scholar] [CrossRef]
  31. Lin, Y.-H.; Gu, Y.-J. Biodegradation kinetic studies of phenol and P-cresol in a batch and continuous stirred-tank bioreactor with Pseudomonas putida ATCC 17484 cells. Processes 2021, 9, 133. [Google Scholar] [CrossRef]
  32. Hasan, S.A.; Jabeen, S. Degradation kinetics and pathway of phenol by Pseudomonas and Bacillus species. Biotechnol. Biotechnol. Equip. 2015, 29, 45–53. [Google Scholar] [CrossRef] [PubMed]
  33. Ma, Y.; Li, L.; Awasthi, M.K.; Tian, H.; Lu, M.; Megharaj, M.; Pan, Y.; He, W. Time-course transcriptome analysis reveals the mechanisms of Burkholderia sp. adaptation to high phenol concentrations. Appl. Microbiol. Biotechnol. 2020, 104, 5873–5887. [Google Scholar] [CrossRef] [PubMed]
  34. Huang, A.; Shao, P.; Wang, Q.; Zhong, R.; Zhong, F.; Chen, W.; Li, X.; Shi, J.; Tang, A.; Luo, X. Enhanced phenol biodegradation by Burkholderia PHL 5 with the assistant of nitrogen. J. Water Process. Eng. 2022, 47, 102771. [Google Scholar] [CrossRef]
  35. Abuhamed, T.; Bayraktar, E.; Mehmetoğlu, T.; Mehmetoğlu, Ü. Kinetics model for growth of Pseudomonas putida F1 during benzene, toluene and phenol biodegradation. Process Biochem. 2004, 39, 983–988. [Google Scholar] [CrossRef]
Figure 1. Scaling up the power density using Stacked MFC.
Sustainability 15 12405 g001
Figure 2. Nano-graphite characterization: zeta potential (a) and HR-TEM (b).
Sustainability 15 12405 g002
Figure 3. Pareto chart showing the contribution percentage and the effects of all parameters on the phenol biodegradation percentage (A) and the bioelectricity power density (B).
Sustainability 15 12405 g003
Figure 4. Three-dimensional surface plots for the effects of the significant tested parameter interactions that led to maximum phenol biodegradation.
Sustainability 15 12405 g004aSustainability 15 12405 g004b
Figure 5. Three-dimensional surface plots for the effects of the tested significant parameter interactions that led to maximum bioelectricity generation.
Sustainability 15 12405 g005aSustainability 15 12405 g005b
Figure 6. Phenol biodegradation percentage during 96 h (a), bioelectricity power density curve (b), Potentiodynamic polarization curve (c), and cyclic voltammetry (d).
Sustainability 15 12405 g006
Figure 7. Bacterial specific growth rate as affected by initial phenol concentration.
Sustainability 15 12405 g007
Figure 8. Bacterial growth yield kinetics under batch conditions. Initial phenol concentrations: 4 (a), 6 (b), 8 (c), 10 (d), 12 (e), and 14 (f).
Sustainability 15 12405 g008
Table 1. Parameters under investigation using a PBD.
No.FactorUnitLevels
−101
1Bacterial inoculum concentration%1.03.05.0
2Culture volumemL75.0100.0125.0
3Concentration of phenolppm6.013.020.0
4pH-6.57.58.5
5Incubation timeh48.072.096.0
6Concentration of KH2PO4mg/L120.0420.0720.0
7Concentration of K2HPO4mg/L175.0375.0675.0
8(NH4)2SO4mg/L144.0244.0344.0
9NaClmg/L5.015.035.0
10FeCl3·6H2Omg/L34.054.074.0
11MgSO4·7H2Omg/L30.050.070.0
12CaCl2·2H2Omg/L5.015.035.0
Table 2. Parameters under investigation using a CCD.
No.FactorUnitLevels
−2−1012
1Bacterial inoculum concentration%0.30.51.01.51.8
2Incubation periodh24.036.048.060.072.0
3Phenol concentrationppm1.03.06.09.012.0
4Concentration of MgSO4mg/L10.040.070.0100.0130.0
5Concentration of K2HPO4mg/L50.0100.0175.0250.0300.0
6Concentration of CaCl2mg/L1.03.05.08.010.0
Table 3. PBD matrix for phenol biodegradation percentage and bioelectricity power density.
RunInoculum SizeCulture VolumePhenol Conc.pHIncubation PeriodKH2PO4K2HPO4(NH4)2SO4NaClFeCl3MgSO4CaCl2Phenol Degradation %Phenol
Removal
Amount per
OD600
(mg/OD600)
Power Density (mW/cm3)
111−1−111−111−1−1−172.577.36.10
2−1−1−11−11−11111−185.248.719.57
31−111−1−1−1−11−11−179.758.911.63
41−1−111−111−1−1−1−176.797.44.17
511−111−1−1−1−11−1173.477.35.56
6−1−1−1−1−1−1−1−1−1−1−1−183.338.716.32
7−1−111−111−1−1−1−1181.228.812.82
8−11−11111−1−111−183.768.012.26
9111−1−111−111−1−171.876.45.72
10−11111−1−111−11177.797.211.18
11−111−1−1−1−11−11−1179.587.79.93
12−111−111−1−1−1−11−182.438.217.82
1300000000000075.417.19.23
14−1−1−1−11−11−1111182.498.613.78
1511−1−1−1−11−11−11177.737.97.90
16−1−11−11−11111−1−180.297.09.85
171−11111−1−111−1162.525.28.58
18−11−11−11111−1−1181.998.19.45
191−11−11111−1−11169.586.75.63
201111−1−111−111−175.637.811.58
211−1−1−1−11−11−111173.367.58.67
Table 4. Analysis of variance of phenol biodegradation percentage and bioelectricity power density.
SourcePhenol Biodegradation PercentageBioelectricity Power Density
DFAdj SSAdj MSF-Valuep-ValueDFAdj SSAdj MSF-Valuep-Value
Model12572.35647.6968.290.00312304.93825.4125.950.009
Linear12572.35647.6968.290.00312304.93825.4125.950.009
Inoculum size1359.891359.89162.570.0001164.910164.91038.610.000
Culture volume10.2550.2550.040.83819.1269.1262.140.182
Phenol conc.145.24045.2407.870.02310.0490.0490.010.917
pH11.2101.2100.210.65911.2751.2750.300.600
Incubation period139.25639.2566.830.031117.42817.4284.080.078
KH2PO4124.86424.8644.320.07111.1191.1190.260.623
K2HPO416.4076.4071.110.322124.62024.6205.760.043
(NH4)2SO411.6471.6470.290.607113.23613.2363.100.116
NaCl12.3942.3940.420.53710.0490.0490.010.917
FeCl3111.22011.2201.950.20010.3050.3050.070.796
MgSO4129.08929.0895.060.055149.64449.64411.620.009
CaCl2150.88050.8808.850.018123.17723.1775.430.048
Error846.0145.752 834.1714.271
Total20618.370 20339.109
Table 5. CCD matrix for phenol biodegradation percentage and bioelectricity power density after significant parameters optimization.
RunInoculum SizeIncubation PeriodPhenol ConcentrationMgSO4CaCl2K2HPO4Phenol Degradation %Phenol
Removal
Amount per
OD600
(mg/OD600)
Power Density (mW/cm3)
1−11−1−11−168.226.372.963
200000089.579.586.203
31−1−111182.487.249.105
4−11−111180.817.181.359
51−1−1−11−186.248.560.666
611−1−11187.129.982.600
7−1−111−1−186.178.781.983
8−1−11−11−189.5910.562.968
9−11−11−1−189.499.481.847
10−1−1−11−1188.469.967.025
1100020085.328.590.000
121111−1−186.148.070.788
1300000−292.6511.473.952
14−1111−1181.128.882.179
150000−2093.3412.4109.419
16111−1−1191.5511.667.593
1700000089.579.086.203
1820000092.2810.370.984
191−11−11192.5911.982.494
2000000089.5710.388.203
2100002090.7810.870.287
22−1−1−111−189.719.645.385
2311−11−1187.809.571.394
24111−11−184.078.775.400
25−1−1111190.8210.084.089
261−1−1−1−1184.098.273.238
27−11111−192.7411.773.920
281−111−1168.586.961.420
2911−1−1−1−184.678.092.136
30−11−1−1−1176.887.593.331
31−111−1−1−183.008.560.240
3200000089.579.686.203
33−111−11180.468.462.299
340−2000069.737.252.296
3500000289.319.878.652
36−1−1−1−1−1−182.758.074.055
3711−111−169.927.363.941
381−1111−181.028.587.955
3900000089.579.787.203
40−20000087.639.972.612
41−1−1−1−11183.278.553.603
4211111182.728.285.810
4300000089.579.486.203
4402000068.907.674.726
4500−200088.708.779.572
4600200090.0210.092.032
471−11−1−1−186.818.585.437
4800000089.579.386.203
49−1−11−1−1167.947.268.347
5000000089.578.886.203
5100000089.578.973.203
521−1−11−1−182.837.065.595
53000−20087.638.089.322
Table 6. Analysis of variance of phenol biodegradation percentage and bioelectricity power density.
SourcePhenol Biodegradation PercentageBioelectricity Power Density
DFAdj SSAdj MSF-Valuep-ValueDFAdj SSAdj MSF-Valuep-Value
Model272380.8788.18020.310.000277035.73260.5810.230.000
 Linear645.267.5431.740.15461291.21215.208.450.000
  x116.816.8061.570.222117.8517.850.700.410
  x218.378.3721.930.1771634.37634.3724.910.001
  x3113.4813.4793.100.0901200.70200.707.880.010
  x411.201.2040.280.60313.733.730.150.705
  x511.761.7560.400.5311424.55424.5516.670.001
  x6:113.6413.6423.140.088110.0110.010.390.536
 Square61012.59168.76438.870.00062163.20360.5314.160.000
  x1 x110.690.6920.160.6931496.37496.3719.490.001
  x2 x21939.94939.937216.490.00111173.381173.3846.070.001
  x3 x312.862.8630.660.42414.174.170.160.689
  x4 x4134.3534.3517.910.009112.4912.490.490.490
  x5 x514.884.8831.120.299111.6511.650.460.505
  x6 x610.420.4210.100.7581248.71248.719.770.004
 2-Way Interaction151323.0388.20220.310.000153581.32238.759.370.000
  x1 x2139.0339.0298.990.006122.6622.660.890.355
  x1 x310.480.4800.110.742183.7483.743.290.082
  x1 x41471.71471.706108.640.0011402.83402.8315.820.001
  x1 x5121.3221.3204.910.0361165.58165.586.500.017
  x1 x6169.4469.44315.990.0011140.85140.855.530.027
  x2 x3188.4588.44520.370.00111097.031097.0343.070.001
  x2 x4110.1010.1032.330.140116.4316.430.640.429
  x2 x51213.62213.62449.200.001127.4227.421.080.309
  x2 x6143.0143.0139.910.0041112.70112.704.420.046
  x3 x4119.4719.4694.480.0441615.19615.1924.150.001
  x3 x51161.55161.55037.210.0011665.64665.6426.130.001
  x3 x6180.7780.77218.600.001111.9211.920.470.500
  x4 x516.346.3371.460.238180.3880.383.160.088
  x4 x615.935.9341.370.25314.014.010.160.695
  x5 x6191.8091.80121.140.0011134.95134.955.300.030
Error25108.554.342 25636.7425.47
 Lack-of-Fit17108.556.385 17473.8527.871.370.336
 Pure Error80.000.000 8162.8920.36
Total522489.42 527672.47
Table 7. Growth yield (Y) evaluation under various initial phenol concentrations.
Run NumberInitial Phenol Concentration (mg/L)Bio-Kinetic Parameter (Y, mg/mg)
145.812
268.096
389.473
41010.370
51210.613
61410.706
Mean9.179
Standard deviation1.918
Disclaimer/Publisher’s Note: The statements, opinions and data contained in all publications are solely those of the individual author(s) and contributor(s) and not of MDPI and/or the editor(s). MDPI and/or the editor(s) disclaim responsibility for any injury to people or property resulting from any ideas, methods, instructions or products referred to in the content.

