
ClimInonda: A Web Application for Climate Data Management: A Case Study of the Bayech Basin (Southwestern Tunisia)

 , , and
Abstract
1. Introduction
2. Materials and Methods
2.1. Study Area
2.2. Methodology
2.2.1. Design and Analysis
Sequence Diagram
2.2.2. Database Diagram
2.3. User Interface
2.3.1. Map
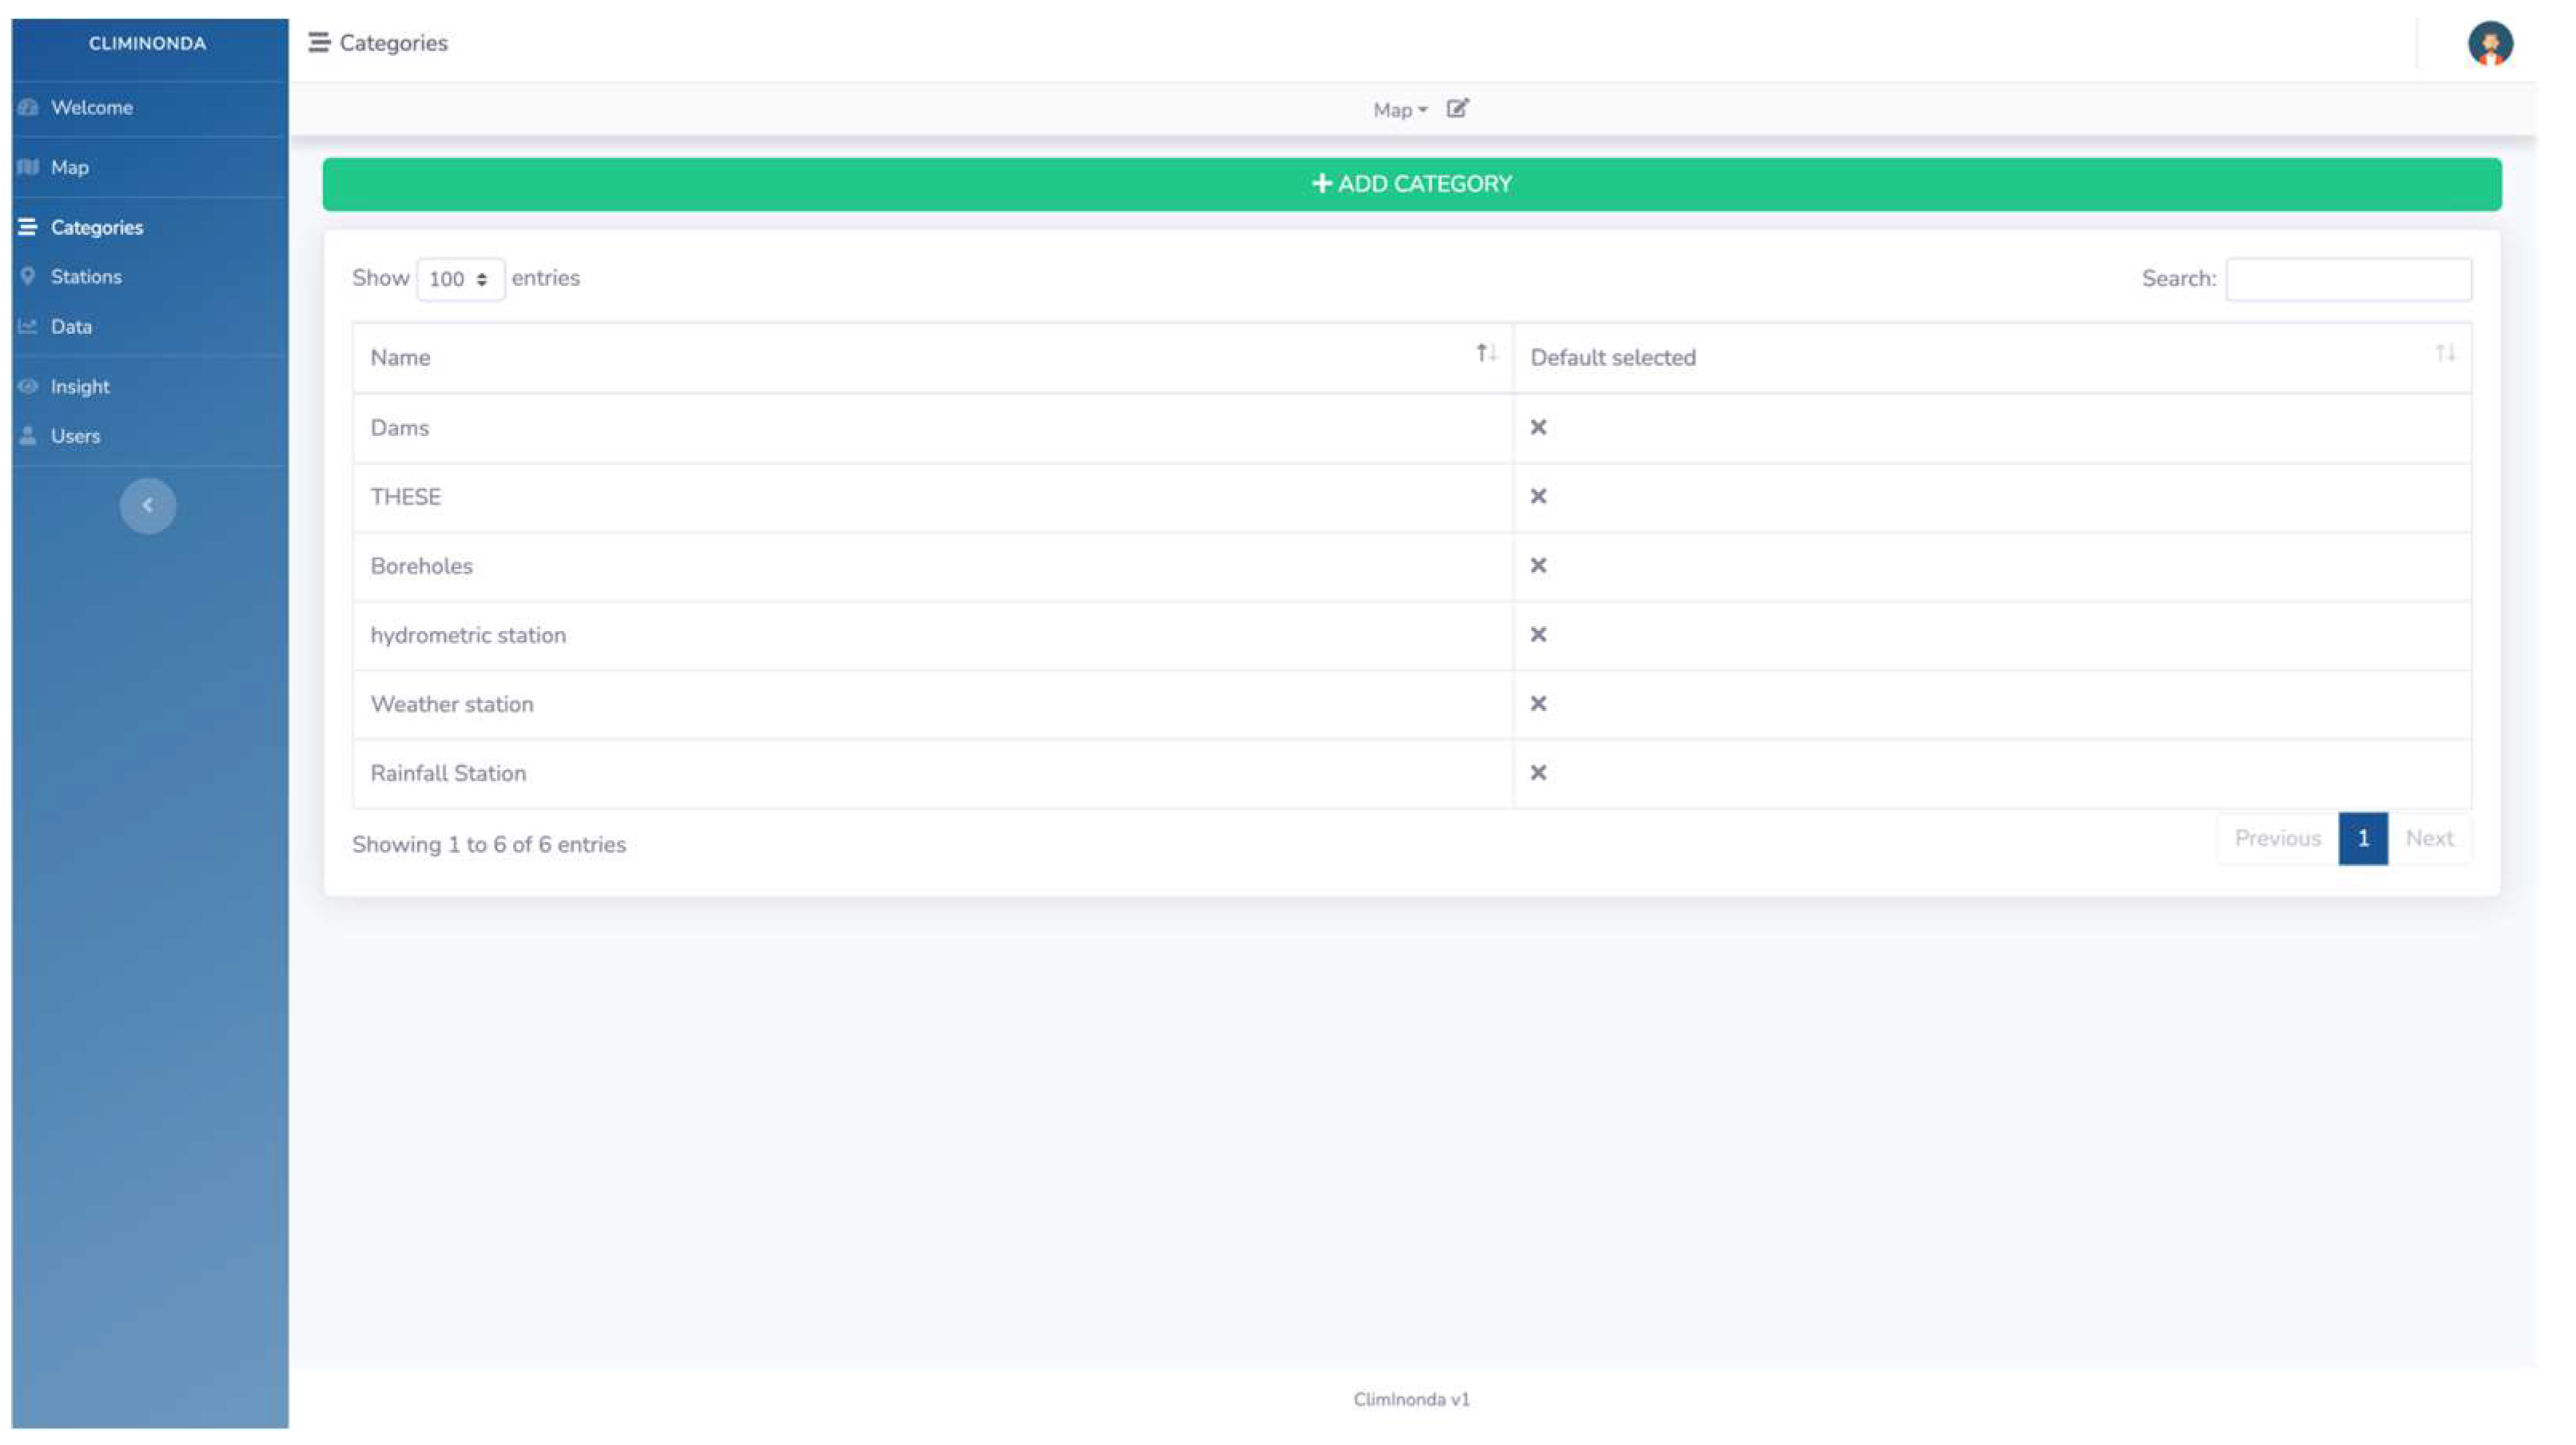
2.3.2. Stations
2.4. Implementation
3. Results
4. Discussion
5. Conclusions
Author Contributions
Funding
Data Availability Statement
Acknowledgments
Conflicts of Interest
References
- Ewing, G.; Demir, I. An ethical decision-making framework with serious gaming: A smart water case study on flooding. J. Hydroinformatics 2021, 23, 466–482. [Google Scholar] [CrossRef]
- Dawson, C.W.; Abrahart, R.J.; See, L.M. HydroTest: A web-based toolbox of evaluation metrics for the standardised assessment of hydrological forecasts. Environ. Model. Softw. 2007, 22, 1034–1052. [Google Scholar] [CrossRef]
- Xu, H.; Demir, I.; Koylu, C.; Muste, M. A web-based geovisual analytics platform for identifying potential contributors to culvert sedimentation. Sci. Total Environ. 2019, 692, 806–817. [Google Scholar] [CrossRef] [PubMed]
- Canay, Ö.; Kocabıçak, Ü. An innovative data collection method to eliminate the preprocessing phase in web usage mining. Eng. Sci. Technol. Int. J. 2023, 40, 101360. [Google Scholar] [CrossRef]
- Brendel, C.E.; Dymond, R.L.; Aguilar, M.F. An interactive web app for retrieval, visualization, and analysis of hydrologic and meteorological time series data. Environ. Model. Softw. 2019, 117, 14–28. [Google Scholar] [CrossRef]
- Cowden, J.R.; Watkins, D.W.; Mihelcic, J.R. Stochastic rainfall modeling in West Africa: Parsimonious approaches for domestic rainwater harvesting assessment. J. Hydrol. 2008, 361, 64–77. [Google Scholar] [CrossRef]
- Kigobe, M.; McIntyre, N.; Wheater, H.; Chandler, R. Multi-site stochastic modelling of daily rainfall in Uganda. Hydrol. Sci. J. 2011, 56, 17–33. [Google Scholar] [CrossRef]
- Horsburgh, J.S.; Tarboton, D.G.; Piasecki, M.; Maidment, D.R.; Zaslavsky, I.; Valentine, D.; Whitenack, T. An integrated system for publishing environmental observations data. Environ. Model. Softw. 2009, 24, 879–888. [Google Scholar] [CrossRef]
- Horsburgh, J.S.; Jones, A.S.; RamÃŁrez, M.; Caraballo, J. Time Series Analyst: Interactive Online Visualization of Standards Based Environmental Time Series Data. Available online: https://scholarsarchive.byu.edu/iemssconference/2016/Stream-A/12/ (accessed on 22 January 2023).
- Smith, J.P.; Hunter, T.S.; Clites, A.H.; Stow, C.A.; Slawecki, T.; Muhr, G.C.; Gronewold, A.D. An expandable web-based platform for visually analyzing basin-scale hydro-climate time series data. Environ. Model. Softw. 2016, 78, 97–105. [Google Scholar] [CrossRef]
- Mason, S.J.K.; Cleveland, S.B.; Llovet, P.; Izurieta, C.; Poole, G.C. A centralized tool for managing, archiving, and serving point-in-time data in ecological research laboratories. Environ. Model. Softw. 2014, 51, 59–69. [Google Scholar] [CrossRef]
- Mitchell, T. Web Mapping Illustrated: Using Open Source GIS Toolkits; O’Reilly Media, Inc.: Newton, MA, USA, 2005. [Google Scholar]
- Fielding, R.T. Architectural Styles and the Design of Network-Based Software Architecture; University of California: Irvine, CA, USA, 2000. [Google Scholar]
- Gkatzoflias, D.; Mellios, G.; Samaras, Z. Development of a web GIS application for emissions inventory spatial allocation based on open source software tools. Comput. Geosci. 2013, 52, 21–33. [Google Scholar] [CrossRef]
- Bürger, C.M.; Kollet, S.; Schumacher, J.; Bösel, D. Introduction of a web service for cloud computing with the integrated hydrologic simulation platform ParFlow. Comput. Geosci. 2012, 48, 334–336. [Google Scholar] [CrossRef]
- Jonoski, A.; Alfonso, L.; Almoradie, A.; Popescu, I.; van Andel, S.J.; Vojinovic, Z. Mobile phone applications in the water domain. Environ. Eng. Manag. J. 2012, 11, 919–930. [Google Scholar] [CrossRef]
- Sivapalan, M.; Blöschl, G. The Growth of Hydrological Understanding: Technologies, Ideas, and Societal Needs Shape the Field: Growth of hydrological understanding. Water Resour. Res. 2017, 53, 8137–8146. [Google Scholar] [CrossRef]
- Haynes, P.; Hehl-Lange, S.; Lange, E. Mobile Augmented Reality for Flood Visualisation. Environ. Model. Softw. 2018, 109, 380–389. [Google Scholar] [CrossRef]
- Piyathamrongchai, K. Web and Mobile Mapping Application for Flood Information Service: A Case Study in Thailand. 2014. Available online: https://www.researchgate.net/publication/270106211_WEB_AND_MOBILE_MAPPING_APPLICATION_FOR_FLOOD_INFORMATION_SERVICE_A_CASE_STUDY_IN_THAILAND (accessed on 22 January 2023).
- Mioc, D.; Nickerson, B.G.; Anton, F.; Fraser, D.; MacGillivray, E.; Morton, A.; Tang, P.; Arp, J.P.; Liang, G. Web-GIS application for flood prediction and monitoring. In Proceedings of the Flood Recovery, Innovation and Response I, Milan, Italy, 29 June–1 July 2022; WIT Press: London, UK, 2008; Volume 118, pp. 145–154. [Google Scholar]
- Alder, J.R.; Hostetler, S.W. Web based visualization of large climate data sets. Environ. Model. Softw. 2015, 68, 175–180. [Google Scholar] [CrossRef]


| Entity | Attribute | Signification | Type | Length |
|---|---|---|---|---|
| Users | Id_user | User ID | N | 10 |
| Firstname | User’s name | A | 30 | |
| Lastname | User’s first name | A | 30 | |
| Username | User’s login | AN | 10 | |
| Password | User’s Password | AN | 30 | |
| User’s email | AN | 35 | ||
| role | User role | A | 10 | |
| Active | Account status | N | 1 | |
| Maps | Id_map | Card ID | N | 10 |
| Name_map | Card Name | A | 30 | |
| Code_map | Password to access a card | AN | 30 | |
| Map_style | Card Style | A | 10 | |
| Active | Card Status | N | 1 | |
| Maps Assign | Edit_map | Permission to make a modification on a card | N | 1 |
| Create_map | Permission to create a map | N | 1 | |
| Edit_station | Permission to make a modification on a station | N | 1 | |
| Delete_station | Permission to make a total deletion of a station | N | 1 | |
| Categories | id_categorie | Category ID | N | 10 |
| name_categorie | Name of a category | A | 30 | |
| Marker_color | Marker Color | N | 5 | |
| Marker_style | Marker style | A | 10 | |
| Marker_icon | Marker Icon | A | 10 | |
| Marker_img | Marker image link | AN | 40 | |
| Stations | Id_station | Station identifier | N | 10 |
| Lat | Latitude coordinates of a station | N | 30 | |
| Lon | Longitude coordinates of a station | N | 30 | |
| Station_name | Station name | A | 30 | |
| Bassin | Station Basin | A | 30 | |
| desc | Station Description | AN | 120 | |
| Station_Data | Id_data | Station data identifier | N | 10 |
| Id_station | Station identifier | N | 10 | |
| Description | Data type description | AN | 120 | |
| datapath | Station data path | AN | 40 |
Disclaimer/Publisher’s Note: The statements, opinions and data contained in all publications are solely those of the individual author(s) and contributor(s) and not of MDPI and/or the editor(s). MDPI and/or the editor(s) disclaim responsibility for any injury to people or property resulting from any ideas, methods, instructions or products referred to in the content. |
© 2023 by the authors. Licensee MDPI, Basel, Switzerland. This article is an open access article distributed under the terms and conditions of the Creative Commons Attribution (CC BY) license (https://creativecommons.org/licenses/by/4.0/).
Share and Cite
Ali, Z.; Saddik, A.; Essifi, B.; Erraha, B.; Labbaci, A.; Ouessar, M. ClimInonda: A Web Application for Climate Data Management: A Case Study of the Bayech Basin (Southwestern Tunisia). Sustainability 2023, 15, 12382. https://doi.org/10.3390/su151612382
Ali Z, Saddik A, Essifi B, Erraha B, Labbaci A, Ouessar M. ClimInonda: A Web Application for Climate Data Management: A Case Study of the Bayech Basin (Southwestern Tunisia). Sustainability. 2023; 15(16):12382. https://doi.org/10.3390/su151612382
Chicago/Turabian StyleAli, Zaineb, Amine Saddik, Bouajila Essifi, Brahim Erraha, Adnane Labbaci, and Mohamed Ouessar. 2023. "ClimInonda: A Web Application for Climate Data Management: A Case Study of the Bayech Basin (Southwestern Tunisia)" Sustainability 15, no. 16: 12382. https://doi.org/10.3390/su151612382
APA StyleAli, Z., Saddik, A., Essifi, B., Erraha, B., Labbaci, A., & Ouessar, M. (2023). ClimInonda: A Web Application for Climate Data Management: A Case Study of the Bayech Basin (Southwestern Tunisia). Sustainability, 15(16), 12382. https://doi.org/10.3390/su151612382