Abstract
During earthworks, monitoring and controlling the actual productivity of construction machines enables insight into the progress of tasks, calculation of expected duration and costs, favorable use and allocation of machines, and the application of appropriate decisions and corrective measures, which is of great interest to contractors. Excavators and tipper trucks are primarily used in earthworks. Manual collection of data from the construction site to assess the actual productivity of machines is today considered an outdated, time-consuming, and subjective method. Therefore, audio–visual and sensing technology devices are replacing manual data collection. The paper aims to propose an innovative protocol for optimal recording/tracking of the work of excavators and tipper trucks using audio–visual (a video camera or smartphone) and location-sensing technology (GPS). The protocol proposal enables a precise statement of the time cycle of excavators and tipper trucks and an estimate of their actual productivity. The application of the protocol proposal on the construction site demonstrated its practicality and functionality.
1. Introduction
The productivity of construction machinery plays an essential role in the progress of earthworks [1]. The actual machine productivity achieved during earthworks performance significantly differs from the expected machine productivity estimated in the planning phase [2]. Tracking and monitoring of earthworks, based on collected quality data from the construction site, is necessary to detect deviations between the planned productivity and the actual productivity of the machines so that appropriate corrective measures can be taken in time and thereby reduce potential damages caused by deviations [3].
Manual (traditional) methods for collecting data from construction sites are subjective and time-consuming and can result in the delayed application of corrective measures and increased costs [4]. In recent years, to measure and evaluate the actual machine productivity on construction sites, researchers have used methods and tools of rapidly growing wireless technologies, more precisely, representatives of sensing technologies [4,5,6,7,8,9] or audio–visual technologies [10,11,12].
One of the representatives of location-sensing technologies is the global positioning system (GPS). Civil engineering researchers use GPS technology because it offers a cost-effective solution for automated data collection [13]. GPS technology is a valuable tool for earthworks [14]. Research in the field of application of GPS technology includes collecting tipper truck driving data to assess the actual productivity of tipper trucks in near real-time [6,7,8,9]. Although in numerous studies GPS technology was used as an independent tool, in most of these studies it was emphasized that GPS technology, as an independent tool, cannot meet all the requirements for solving research problems because the data is limited to time and location [15].
Video recording devices, like video cameras, are widely used on construction sites for better insight into work performance, productivity improvement, and safety monitoring [16,17]. Compared to sensing technologies, audio–visual technologies have the possibility of providing insight into the real activity of machines, thus making it easier to analyze the reasons that lead to low productivity and reducing the generation of incorrect data and conclusions [11]. Audio–visual technologies have significant potential for automated data collection from construction sites to monitor progress and safety, analyze productivity, and visually survey facilities [18].
Resource detection in audio–visual data from construction sites is a frequent research focus because it gives promising results [19]. Despite the efforts of researchers and achievements so far in the application of audio–visual technologies, further research is needed, especially in tracking and monitoring construction [20]. To solve the shortcomings of audio–visual technologies, further research should focus on the application of audio–visual technologies together with other technologies like GPS technology, radio frequency identification (RFID), accelerometers, etc. [12].
The paper aims to propose a protocol for collecting and processing data from the construction site about the operation of excavators and tipper trucks. The protocol proposal represents an innovative way of collecting and processing data using audio–visual (a video camera or smartphone) and location-sensing technology (GPS). The purpose of the protocol proposal is to obtain information about the operation of excavators and tipper trucks in terms of estimating actual productivity, calculating work norms, creating projections of costs and required time, and making appropriate decisions. A protocol proposal should significantly benefit contractors who conduct similar research for their own profit and interest.
2. Literature Review
Earthworks, which include excavation and removal of large amounts of soil or crumbling/broken rock, take place in the early phase of the project, and the activities are carried out by machines, the most important of which are excavators and tipper (or dump) trucks [21]. An excavator is a necessary machine on the construction site due to its versatility, robustness, and efficiency [22]. Tracking and monitoring the excavator’s time cycle is a significant aspect of the excavator’s productivity [23]. During earthworks, in most cases, there are consecutive, repetitive laps of tipper trucks between the construction site (loading place) and the unloading place [24].
2.1. Audio-Visual and Loaction-Sensing Technology in Earthworks
2.1.1. Location-Sensing Technology for Productivity Assessment
Montaser and Moselhi [6] proposed a practical and simple system, called Truck+, for tracking, monitoring, controlling, and estimating the actual productivity of tipper trucks in earthworks in near real-time. In the Truck+ system, the integration of GPS and GIS system technology is used to calculate the duration of the tipper truck time cycle. The authors pointed out that the application of the Truck+ system can be improved by integrating with other sensing or audio–visual technologies, such as video cameras, weight, speed, or movement sensors, RFID technology, etc.
Ibrahim and Moselhi [7] proposed a method for estimating the actual productivity of tipper trucks in near real-time. The method uses the integration of GPS technology with sensors and a microcontroller to collect data on the operation of the tipper truck.
Alshibani and Moselhi [9] proposed a system for estimating the actual productivity of tipper trucks and estimating the required cost and time when performing earthworks (under the influence of tipper trucks) in near real-time. The system integrates GPS and GIS technology, consisting of five modules and four algorithms. For simplicity and efficiency of tracking, only one GPS receiver is placed on a tipper truck that drives on the same route and has the same box volume as other tipper trucks. The authors noted that their system is currently being researched and is limited to work involving tipper trucks. Also, they stated that the system applies only to the open area of operation, so there is no interference in receiving satellite radio signals. They suggest using RFID or other sensing technologies to improve the system.
Salem and Moselhi [15,25] proposed a model for tracking and monitoring the productivity of earthworks (under the influence of tipper trucks). The application of the model is the collection of data on the driving of tipper trucks to calculate the actual productivity of tipper trucks and analyze driver habits and road conditions for timely detection of unwanted driver behavior and/or road disturbances. The authors pointed out that only trial tests of the model were performed and that the model needs to be validated on an actual construction site.
2.1.2. Audio–Visual Technology for Productivity Assessment
Bügler et al. [10] proposed a methodology that combines two different audio–visual technologies, i.e., a combination of photogrammetry and video analysis. Their methodology aims to monitor progress and assess the productivity of earthworks in the case of extensive (deep) excavations of construction pits.
Kim J. and Chi [20] presented a vision-based framework for excavator action recognition that considers sequential pattern analysis for automated cycle time and productivity analysis. They emphasized that the experiments confirm the positive effects and applicability of the proposed framework.
Chen et al. [11] pointed out that the application of audio–visual technologies is primarily based on the automatic detection of work activities of construction machines, with little application for real problems such as tracking and monitoring the productivity of earthworks. Other limitations, which they mentioned, are difficulties in automatically detecting work activities in the case of a long video or a large number of machines on the construction site. To overcome some of the limitations, they proposed a research framework with the possibility of automatically recognizing work activities and analyzing the productivity of a large number of excavators on a construction site.
Kim J. and Chi [12] proposed a methodology for monitoring earthmoving productivity using multiple (non-overlapping) cameras on a construction site. They especially emphasized the fact that their proposed methodology is, to their knowledge, the first attempt to monitor and control the productivity of earthworks with the help of a large number of cameras and that the shortcomings of their methodology (such as overlap and tracking errors) can be solved by integrating with Internet of Things (IoT) technologies, such as GPS, RFID, accelerometers, and the like.
Chen et al. [26] presented a computer vision (CV) method to identify the leading causes of excavator and truck idling in excavator operations. They pointed out that the proposed method aims to control the work efficiency and productivity of construction machines and that the validation results are promising.
Šopić et al. [27] proposed a simple research framework for quick and practical estimates of excavator cycle time and actual productivity using a video camera at the construction site and performing video analysis. Video analysis involves labeling the excavator’s working activities using a label automation algorithm. They highlighted that the simple research framework should be integrated with non-vision-based technologies (such as GPS, RFID, accelerometers, and sensors) in further research.
Xiao et al. [28] described a vision-based method for automatically generating video highlights from construction videos by integrating machine tracking and convolutional neural networks (CNN) feature extraction. They pointed out that useful video footage is beneficial for productivity analysis and safety control. Experiments with the proposed method proved its accuracy and potential advantages.
Cheng et al. [29] introduced a novel, autonomous vision-based framework for excavator action recognition and productivity measurement based on deep learning and average cycle time calculation. They emphasized that the implementation of the proposed framework was successful, feasible, economical, and fast, with the ability to measure the productivity of the excavator in real-time.
Chen et al. [30] described a vision-based method for identifying excavators and loaders activities without pre-training or fine-tuning by adopting zero-shot learning. They pointed out that testing the proposed method for activity recognition and productivity evaluation on videos recorded from real construction sites showed feasibility and high accuracy.
2.1.3. Integration of Audio–Visual and Sensing Technology
Kim H. et al. [31] investigated the feasibility of measuring excavator cycle times using a smartphone-embedded inertial measurement unit (IMU). The IMU included an accelerometer and a gyroscope. The excavator’s operation was videotaped using a GoPro camera. They highlighted that the test results of the proposed research demonstrate its applicability and cost-effectiveness. In future research, they suggested the combined utilization of IMU and GPS for collecting data and monitoring equipment status.
Kavaliauskas et al. [32] compared the workflow of three unmanned aerial vehicle (UAV)-based photogrammetry techniques: real-time kinematic (RTK), post-processing kinematic (PPK), and GPS-based for efficiency, reliability, and geometric accuracy of earthwork quantity estimations.
Šopić [33] proposed an early warning system model for approaching the marginal cost-effectiveness of construction machinery during earthworks. Among other things, audio–visual (smartphone) and location-sensing (GPS) technology were used to collect data from the construction site. The application of the model on the actual construction site of the mega infrastructure project of state road construction and its verification proved the model’s innovativeness, reliability, and practicality.
2.2. Methodologies for Earthworks Productivity Assessment
The deterministic approach to assessing machine productivity is a simple and easy one [34]. Based on the literature review, a significant application of methodologies with a deterministic approach for assessing machine productivity can be observed, of which the methodologies contained in books, such as Peurifoy et al. [35], Nunnally [36], Nichols and Day [37], and manuals of world machine manufacturers, such as Komatsu’s specifications and application handbook [38] and Caterpillar’s performance handbook [39], stand out. Some of the researchers who used the Peurifoy et al. [35] methodology are Montaser et al. [40], Kang and Seo [41], Sarkar and Shah [42], and Singla and Gupta [43]. Furthermore, some of the research that used the Nunnally [36] methodology is at Attoh-Okine [44], Sağlam and Bettemir [45], and Sabillon et al. [46], while some of the research that used the Nicholas and Day [37] methodology is at Lewis et al. [47,48]. Finally, some of the researchers who used Komatsu’s specifications and application handbook [38] or Caterpillar’s performance handbook [39] are Bhurisith and Touran [49], Panas and Pantouvakis [50,51], Rafsanjani [52], and Pantouvakis [53].
For the purpose of estimating the productivity of construction machinery, it would be significant to compare several different methodologies for assessing productivity, thereby preventing unconditional and uncritical acceptance of the results obtained from only one methodology [50]. The theory and associated formulas for machine productivity from books and manuals of world machine manufacturers provide an excellent basis and, together with experience, serve to evaluate the productivity of machines on the construction site [54].
The productivity of earthmoving machines can be measured by the volume of excavated soil and (crumbly or broken) rock per unit of time, which can be obtained based on the number of tipper trucks that transport the excavated material in one day [55]. Therefore, the criterion for the precision of the methodologies for machine productivity can be the number of tipper truck laps from the construction site to the unloading place (with return), tracked by GPS technology. Figure 1 shows a deterministic approach to productivity assessment.
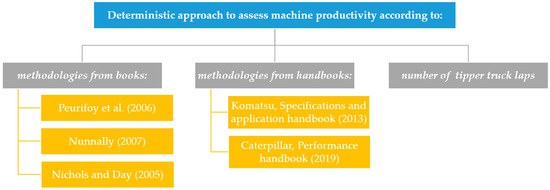
Figure 1.
Deterministic approach to productivity assessment [35,36,37,38,39,55].
3. Protocol Proposal for Data Collection and Processing
The protocol proposal for data collection and processing consists of three steps. The first step consists of collecting data on the construction site using audio–visual (a video camera or smartphone) and location-sensing technology (GPS). The excavator’s work should be recorded with a video camera (or a smartphone), and the driving of the tipper truck should be tracked with GPS technology. The second step consists of processing the collected data from the construction site. The data should be processed in MATLAB and with appropriate GPS data processing software. For statistical data processing, the free add-on for Microsoft Excel, Real Statistics, can be used. The third step consists of applying a comparative analysis of methodologies for assessing the productivity of excavators and tipper trucks. Methodologies for calculating machine productivity from books and manuals of world machine manufacturers should be used and corrected with actual data from the construction site to improve the accuracy of estimating the productivity of excavators and tipper trucks for the observed construction site. The aforementioned productivity estimate based on the application of methodologies from books and manuals of world machine manufacturers, corrected with actual data from the construction site, should be compared with the approximate assessment of the productivity of earthworks based on the number of tipper trucks daily laps to the unloading place (with return). Figure 2 shows the protocol proposal steps.

Figure 2.
Protocol proposal steps (image created by the first author).
3.1. First Step: Data Collection at the Construction Site
With a video camera (or smartphone), it is necessary to record the operation of the excavator when loading the material into the tipper truck. The material must be loaded into tipper trucks up to their useful carrying capacity. The length and resolution of the video can create difficulties when analyzing the video; that is, the computer’s configuration and the software support’s capabilities can limit the implementation of the analysis. More precisely, for long videos (duration of about 1 h) with high resolution (from HD resolution upwards), it is impossible to perform video analysis (without cutting the video and reducing the resolution). For this reason, it is recommended to record short videos, the length of which depends on how long the process of loading the material into the tipper truck will take (the usual duration of loading is from about 5 to 15 min). In addition, it is necessary to reduce the video resolution before performing video analysis. Short videos, therefore, should cover the operation of the excavator from the start of material loading into the tipper truck (first loading from the excavator bucket) until the tipper truck is fully loaded (last loading from the excavator bucket). About 10 to 35 videos should be recorded. The number of recorded videos must correspond to the number of tipper truck laps tracked from the construction site (loading place) to the unloading place (with return).
GPS technology will be used for tracking the driving of tipper trucks. Just before the departure of the loaded tipper truck from the construction site, the GPS receiver must be turned on, and just after the return of the tipper truck to the construction site, the GPS receiver must be turned off. GPS technology will therefore track the tipper truck’s drive from the construction site (loading place) to the unloading place, self-unloading, and driving back to the construction site. Loading recording and driving tracking must be applied to the same tipper truck. Each loading recording, together with driving tracking, will result in one tipper truck time cycle. Collecting 10 to 35 tipper truck laps from the construction site (loading place) to the unloading place (with the return to the construction site) is necessary. The collected number of tipper truck laps must correspond to the number of recorded videos.
The above data collection procedures, using a video camera (or a smartphone) and GPS technology, are for estimating the excavator time cycle and the tipper truck time cycle. Using a video camera (or smartphone) and GPS technology does not interfere with excavator work or tipper truck driving. Also, it does not cause delays during excavation, loading, and removal of materials.
Applying the protocol proposal implies estimating the actual productivity of excavators and tipper trucks in terms of good working conditions and good use of working time. Therefore, it is necessary to collect data under the mentioned operating conditions. Otherwise, it is necessary to reorganize the operation of the machines on the construction site. The previous is vital so that estimating the productivity of excavators and tipper trucks represents the maximum possible (desired) productivity of the machines on the construction site.
Figure 3 shows the flow of activities when collecting data from the construction site using a video camera (or smartphone) and GPS technology. After collecting data from the construction site, it is necessary to move on to the next step, i.e., processing the collected data from the construction site.
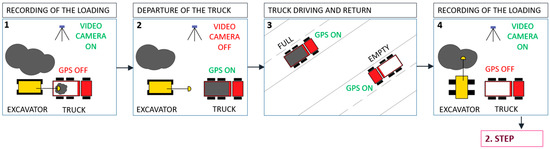
Figure 3.
First step activities in the protocol proposal (image created by the first author).
3.2. Second Step: Data Processing from the Construction Site
Video analysis within the protocol proposal will be carried out in MATLAB version 9.4 (R2018a) software, including the input of appropriate labels for the excavator work operation. Excavator work operations will be referred (labeled) “excavation”, “swingBucketFull”, “loadingTipperTruck”, and “swingBucketEmpty”. After entering labels, extracting a list of the entered labels in time along with the video is possible. A list of entered labels along the video provides a detailed view of the time course of the excavator’s work operations. More precisely, the list of entered labels provides a suitable basis for calculating the excavator time cycle duration. In addition, entered labels can be used to train detectors for automatic loading detection using an aggregate channel features (ACF) machine-learning algorithm. Automatic loading detection could be used as one of the options to estimate the volume of loaded material. Training detectors for automatic loading detection will not be covered in this paper.
Data from the GPS receiver used to track the tipper truck must be downloaded and processed using appropriate software obtained with the purchase of GPS technology. In addition, the free Google Earth Pro version 7.3.6.9345 software will also be used. Data processing using appropriate software obtained with the purchase of GPS technology and Google Earth Pro software will enable an overview of the course of the tipper truck driving from the construction site (loading place) to the unloading place, self-unloading, and driving back to the construction site in terms of driving time, distance, speed, and an overview of the driving on a virtual 3D view of the Earth’s surface.
Video analysis involves creating a large sample (n > 30) of the excavator’s time cycles and a sample from a normal distribution (n = 10–30) or a large sample (n > 30) of loading times (per each lap). The processing of tracking records using GPS technology involves the creation of a sample from a normal distribution (n = 10–30) or a large sample (n > 30) of the time duration of the tipper truck drive from the construction site (loading place) to the unloading place, self-unloading, and driving back to the construction site.
Statistical data processing will be applied to samples created by video analysis and GPS tracking. During the statistical processing of data from the construction site, emphasis was placed on applying the parametric test of the interval estimation of expectations. Expectation interval estimation is suitable for testing a small sample (n ≤ 30) with data that must follow a normal distribution, as well as for testing a large sample (n > 30) when it is not necessary to check whether the data follows a normal distribution. In the case of a small sample, the Shapiro–Wilk test can be used to check whether the data follows a normal distribution.
The formula for interval estimation of expectations for a large sample (n > 30) with unknown variance is [56]:
where is:
—Arithmetic mean,
—Interval width,
—Quantile of the standard normal distribution,
—Standard deviation,
—Sample size,
—Default confidence level.
The formula for interval estimation of expectations for a small sample (n ≤ 30) with a normal distribution of data and unknown variance is [56]:
where is:
—Arithmetic mean,
—Interval width,
—Quantile of Student’s distribution or t-distribution with (n − 1) degrees of freedom (df),
—Standard deviation,
—Sample size,
—Default confidence level.
Figure 4 shows the flow of activities when processing data. After processing data from the construction site, it is necessary to move on to the next step, i.e., applying a comparative analysis of methodologies for assessing the productivity of excavators and tipper trucks.
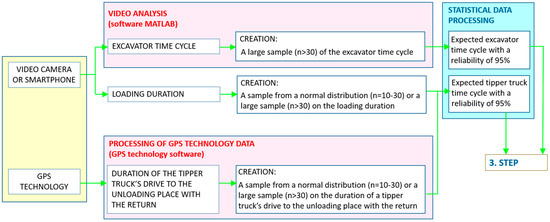
Figure 4.
Second step activities in the protocol proposal (image created by the first author).
3.3. Third Step: Comparative Analysis of Methodologies for Assessing the Productivity of Excavators and Tipper Trucks
Actual data from the construction site will be included in the methodologies of prominent books [35,36,37] and manuals of world machine manufacturers [38,39] for evaluating the productivity of excavators and tipper trucks. The mentioned methodologies offer time-cycle assessments of excavators and tipper trucks. However, in addition to other actual data from the construction site, the main goal is to use the real cycle time of the excavator and tipper truck from the construction site to improve the application of the methodologies for the actual productivity estimate for the observed construction site.
Applying the mentioned methodologies, to a greater or lesser extent, will result in different values for the productivity estimates of excavators and tipper trucks. The values of the evaluations of the productivity of excavators and tipper trucks will be in terms of good working conditions and good use of working time since the recording of the excavator work and tracking of the tipper truck driving should be carried out in the same conditions with efficient excavation, loading, and removal of materials (without long downtimes).
After that, the application of methodologies will be ranked according to the criteria of precision and practicality. The precision in applying the methodologies will represent the accuracy of the actual productivity estimate of excavators and tipper trucks from the observed construction site. Accuracy in estimating the actual productivity of excavators and tipper trucks will be established concerning the compliance of the calculated productivity of excavators and tipper trucks with the realistic (feasible) number of tipper truck daily laps to the unloading place since the daily laps to the unloading place are the only measurable and unambiguous data. Practicality in applying the methodologies will be represented by a subjective assessment of simplicity and certainty when choosing coefficient values for assessing the productivity of excavators and tipper trucks. Figure 5 shows the flow of activities during the comparative analysis of methodologies for assessing the productivity of excavators and tipper trucks.
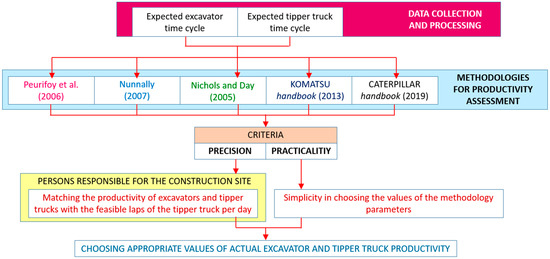
Figure 5.
Third step activities in the protocol proposal (image created by the first author) [35,36,37,38,39].
4. Application of Protocol Proposal for Data Collection and Processing
The construction site where the protocol proposal was applied was the agglomeration (a temporary dump of excavated material from several construction sites) on the island of Krk. Measurements and data processing were done in May 2021. The material was loaded into the tipper trucks by a Caterpillar excavator, model 214B. GPS technology was used to track the driving of a MAN 41.430 TGA 8 × 4 BB tipper truck with four (4) axles and a maximum permissible weight of 40,000 kg (40 t). The material from the excavation was taken away locally. That is, it was used to embank material at another construction site. The road distance between the two construction sites in both directions was about 11 km. A total of three tipper trucks were used to transport the material. All three tipper trucks had the same characteristics. One of the three tipper trucks was recorded during the loading of materials at the construction site and was tracked by GPS technology during the drive to the unloading place, self-unloading, and driving back to the construction site. The tracked tipper truck’s measurement and data processing results were also valid for the other three trucks. The material was loaded into tipper trucks and leveled to the top of the box. The type of material that was loaded was a mixture of crushed rock and earth. Recording of the excavator and tracking the tipper truck took place on days with favorable weather conditions. The machinist and driver had previous experience operating an excavator, i.e., driving a tipper truck. During the recording and tracking, no unjustified or lengthy stoppages were observed in the excavator’s operation or the tipper truck’s driving. Figure 6 gives a view of the observed construction site. In Figure 6, it is possible to see the excavator and the tipper truck that were the subject of recording/tracking.
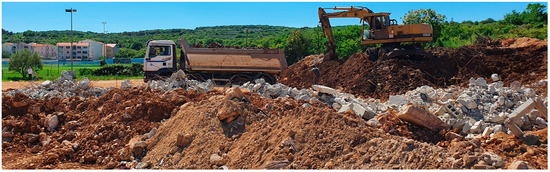
Figure 6.
View of the observed construction site (private album of the first author).
4.1. First Step: Data Collection at the Construction Site (Agglomeration, Island of Krk)
Data was collected on the construction site by integrating audio-visual and location-sensing technology devices. To be more precise, a Samsung Galaxy S10 smartphone was used to record the loading, and a Qstarz BL-1000GT Standard GPS receiver was used to track the drive and store data. Videos from the observed construction site, with recorded content of material loading into a tipper truck, last up to 11 min. The tipper truck was tracked using GPS technology (using a GPS receiver that can store data) during the drive to the unloading place (another construction site), self-unloading, and driving back to the construction site. Just before the tipper truck departed from the construction site, the tipper truck driver would turn on the GPS receiver, and just after the tipper truck returned to the construction site, the tipper truck driver would turn off the GPS receiver.
Data were collected at the construction site for three days, from May 25 to 27, 2021, during the construction site’s working hours from 7 a.m. to 5 p.m. By eliminating unusable videos (obscured view of material loading by the appearance of other machines on the construction site in front of the smartphone) and useless GPS tracking data from the GPS receiver (going with a tipper truck to get fuel or for lunch after unloading materials, accidental inattention of the tipper truck driver to turn on/off the GPS receiver, etc.), there were 20 representative videos left aligned with 20 representative GPS tracking data, ready for processing. Based on the processing of the representative’s data from videos and a GPS receiver, small samples (n = 20) were formed when it was necessary to check whether the data followed a normal distribution, and a large sample (n > 30) when it was not required to check whether the data followed a normal distribution. Since all small samples had data following a normal distribution (shown in the next chapter), it was decided that additional data collection at the site (for May) would not be necessary.
4.2. Second Step: Data Processing from the Construction Site (Agglomeration, Island of Krk)
Data were processed on an HP ProDesk 400 G7 MT desktop computer, 11M73EA computer code, with an Intel Core i5-10500 processor, 16 GB of working memory (RAM), 512 GB of hard disk (SSD), and the Windows 10 operating system. Video analysis was performed in MATLAB version 9.4 (R2018a) software [57]. Processing of GPS tracking data was performed in QStarz QRacing version 3.99.810 software [58] and free Google Earth Pro version 7.3.6.9345 software [59]. Statistical data processing was performed in Microsoft Excel 2013 (15.0.5553.1000) spreadsheet software and the Microsoft Excel add-in, Real Statistics [60].
Figure 7 gives examples of inserted labels for excavator working operations during the first video from the observed construction site. Figure 8 represents the excavator’s working operations (based on label input) during the first video from the observed construction site. In Figure 8, 18-time cycles of the excavator can be seen. On 4 videos (out of 20), labels of excavator working operations have been inputted, forming a large sample of 63-time cycles. In addition to representing the excavator’s working operations, from the MATLAB software, it is possible (and more importantly) to download detailed time lists of the excavator’s working operations throughout the video. Time lists of the excavator’s working operations throughout the video are used to calculate the excavator’s time cycles.
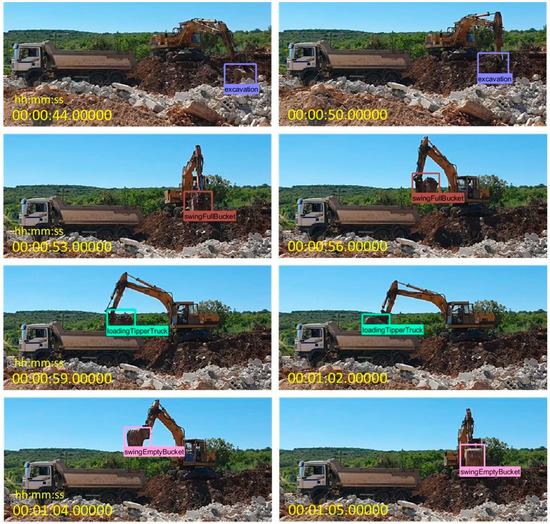
Figure 7.
Examples of inserted labels for excavator working operations from the first video of loading (image created using MATLAB by the first author).
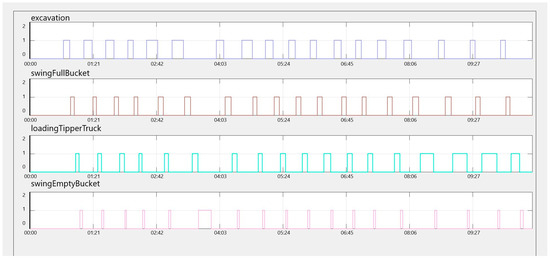
Figure 8.
Excavator working operations (based on label input) from the observed construction site for the first video of loading (image created using MATLAB by the first author).
Figure 9 provides the first tipper truck lap from the construction site to the unloading place (with return) in Google Earth Pro software with the copied data from Qstarz BL-1000GT Standard GPS receiver software. For the first tipper truck lap, the distance between the construction site and the unloading place in both directions was 10.58 km, and the duration of the tipper truck’s drive from the construction site to the unloading place, self-unloading, and driving back to the construction site was 18 min and 16 s (1096 s).
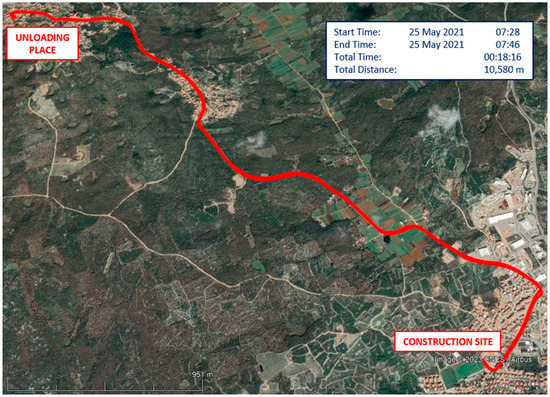
Figure 9.
First tipper truck lap from the construction site to the unloading place (with return) in Google Earth Pro software (image created by the first author, map data: Google, ©2023 CNES/Airbus, Maxar Technologies).
After completing the video analysis in MATLAB software and processing the tipper truck GPS tracking data in Qstarz QRacing and Google Earth Pro software, the numerical data was copied into Microsoft Excel software for further processing. In Microsoft Excel software, statistical data processing was applied. More precisely, the parametric test of the interval estimation of expectations with a confidence level of 95% was applied. It was previously pointed out that interval estimation of expectations is suitable for testing a small sample (n ≤ 30) with data that must follow a normal distribution (n ≤ 30), as well as for testing a large sample (n > 30) when it is not necessary to check whether the data follows a normal distribution. Therefore, in the case of a small sample, the Shapiro–Wilk test was used to check whether the data followed a normal distribution.
Table 1 shows large-sample data on excavator time cycles with statistical data processing. The data in Table 1 were obtained based on a video analysis of the excavator’s work operation at the observed construction site. Using a 95% confidence interval, we can conclude that the expected cycle time of the excavator on the construction site is between 29.95 and 33.16 s.

Table 1.
Excavator time cycles with statistical data processing.
Table 2 shows small-sample data on loading duration with statistical data processing. The data in Table 2 were obtained based on the recording of loading at the observed construction site. The application of the Shapiro–Wilk test, at a significance level of 5%, showed that the data on the loading duration are normally distributed (normal: yes). Using a 95% confidence interval, we can conclude that the expected loading duration at the construction site is between 552.18 and 612.32 s or between 9.20 and 10.21 min.
Table 2.
Loading durations with statistical data processing.
Table 3 shows small-sample data on the duration of tipper truck drives from the construction site to the unloading place, self-unloading, and driving back to the construction site with statistical data processing. The data in Table 3 were obtained based on the tracking of tipper trucks using GPS technology. The application of the Shapiro–Wilk test, at a significance level of 5%, showed that the data (expressed in seconds) on the duration of tipper truck drives from the construction site to the unloading place, self-unloading, and driving back to the construction site are normally distributed (normal: yes). Constructing a 95% confidence interval, we can conclude that the expected duration of driving from the construction site to the unloading place, self-unloading, and driving back to the construction site is between 1051.52 and 1163.98 s, or between 17.53 and 19.40 min.
Table 3.
Durations of tipper trucks driving from the construction site to the unloading place, self-unloading, and driving back to the construction site (tracking with GPS technology) with statistical data processing.
The tipper truck time cycle consists of the time it takes to load materials, drive from the construction site to the unloading place, unload the materials, and drive back to the construction site. Table 4 shows small-sample data on tipper truck time cycles with statistical data processing. The data from Table 4 were obtained by adding the duration of material loading with the duration of driving from the construction site to the unloading place, self-unloading, and driving back to the construction site. Applying the Shapiro–Wilk test at a significance level of 5% showed that the data about the tipper truck time cycle is distributed normally (normal: yes). Constructing a 95% confidence interval, we can conclude that the expected time cycle of the tipper truck is between 1618.62 and 1761.38 s, or between 26.98 and 29.36 min.
Table 4.
Tipper truck time cycles with statistical data processing.
4.3. Third Step: Comparative Analysis of Methodologies for Assessing the Productivity of Excavators and Tipper Trucks (Agglomeration, Island of Krk)
Table 5 presents an estimate of excavator actual productivity using the methodologies of prominent books [35,36,37] and manuals of world machine manufacturers [38,39], while Table 6 presents an estimate of tipper truck actual productivity. The time cycle calculation of excavators and tipper trucks from the mentioned methodologies has been replaced by real data from the construction site obtained through video analysis and GPS technology. Analyzing Table 5 and Table 6, the most significant difference between methodologies for assessing productivity is the swell factor of material being loaded and the bucket fill factor. The bucket fill factor depends on the material being loaded.
Table 5.
Excavator actual productivity estimates using real data and methodologies from prominent books and handbooks. Each methodology is highlighted in a different color.
Table 6.
Tipper truck actual productivity estimates using real data and methodologies from prominent books and handbooks. Each methodology is highlighted in a different color.
On the observed construction site, three (3) tipper trucks were transporting the material to the unloading place. The overall productivity of tipper trucks was a bit higher than the possible productivity of the excavator. Therefore, the excavator determined the performance of the work. Tipper trucks had delays in the queue waiting for loading or unloading. Table 7 shows the coordinated (adjustable) productivity of excavators and tipper trucks at the observed construction site.
Table 7.
Coordinated (adjustable) productivity of excavator and tipper trucks. Each methodology is highlighted in a different color.
The productivity values of excavators and tipper trucks based on applying the methodologies of prominent books and manuals of world machine manufacturers were compared with the assessment of the productivity of excavators and tipper trucks based on the optimal daily number of tipper truck laps to the unloading place. For the observed construction site, the (optimal) feasible laps of the tipper truck (from the construction site to the unloading place with return) in one day include 14 laps. An approximate actual productivity assessment of a tipper truck can be obtained by multiplying the feasible daily laps by the volume of loaded material and the swell factor. Table 8 shows the calculation of the approximate actual productivity of the excavator and tipper truck based on feasible daily laps of the tipper truck. An approximate actual productivity assessment of the excavator and tipper trucks served as a control when choosing a relevant, practical, and precise methodology for the observed construction site.
Table 8.
Productivity assessment based on tipper truck laps per day compared with adjustable productivity of excavators and tipper trucks. Each methodology is highlighted in a different color.
Table 8 also provides a comparative view of calculated productivity based on methodologies from university textbooks and manuals of world machine manufacturers and approximate productivity based on feasible daily laps of the tipper truck. The methodology of Peurifoy et al. [35] was chosen as the proper methodology for the observed construction site since it is only 0.52% higher than the approximate productivity assessment based on the tipper truck’s daily laps. We can conclude that when loading a mixture of crushed rock and earth, it is best to use the methodology of Peurifoy et al. [35]. Therefore, for the observed construction site, due to good working conditions and excellent organization of working time, a value of 633.24 BCM/day (70.36 BCM/h) is considered optimal for excavator productivity, while a value of 211.08 BCM/day (23.453 BCM/h) is considered optimal for tipper truck productivity. Obtained productivity estimates should help contractors make further calculations and correct decisions related to the operation of machines on the observed construction site.
5. Discussion
The paper shows the use of an audio–visual device (i.e., a video camera or smartphone) and a location-sensing device (i.e., a GPS) for optimal recording/tracking of excavator and tipper truck operations. Excavators and tipper trucks are commonly and frequently used machines for earthworks. Using GPS technology, tracking an excavator’s operations (excavation and loading) on a construction site is impractical. On the other side, a video camera is not a suitable device for recording the drive of a tipper truck from the construction site to the unloading place. Therefore, video cameras compensate for the shortcomings of GPS technology, and vice versa. Analyzing videos and GPS tracking data makes it possible to determine the time cycles of excavators and tipper trucks extremely precisely. The time cycle of operation is essential to estimating the actual productivity of excavators and tipper trucks.
The advantages of using a video camera (or smartphone) are manifested in the visual reproduction of real circumstances and environments within which “heavy” construction machines were performing earthworks at the time of filming. When using a video camera, construction machinery can be recorded from a great distance. Also, using a video camera does not disturb the regular operation of construction machines and does not require the installation of accessories on the construction machines, which are the subject of filming. With a visual insight into the real circumstances at the construction site, the possibility of misinterpretation of the collected data from the site is reduced. However, it is necessary to find a recording position that allows a clear view of the machines and a visible representation of the performance of earthworks operations.
The appearance of “overlapping” machines in the video can cause incorrect data to be generated when analyzing the video. Even the short-term appearance of other machines in front of the video camera can make it impossible to perform video analysis because they obscure the view of the excavator and tipper truck. Adverse weather conditions, such as rain, fog, snow, or strong wind, as well as conditions with low natural or artificial lighting, result in videos with reduced sharpness or blurry content. Using smartphones on hot days when daily temperatures are higher than or equal to 30 °C can cause smartphone overheating. Recorded videos should be of appropriate quality and length since computer configuration and video processing software may limit or condition video analysis capabilities. Therefore, it should be cautious when choosing the subject and the situation to be filmed.
GPS technology is an advanced satellite radio-navigation system for detecting the position and/or tracking the movement of objects or individuals. High buildings, bad weather, terrain configuration, satellite maintenance, maps with missing, prohibited, or incorrect content, as well as GPS receivers with weaker characteristics, can reduce the accuracy of locating. However, numerous studies have shown that GPS receivers have satisfactory accuracy and are suitable for collecting travel time and driving data. GPS technology has started a revolution in navigation and has become an unavoidable role model.
In the proposed protocol for data collection and processing, GPS technology is used to track the driving of tipper trucks. It is necessary to use a GPS receiver with a track storage feature. Since tipper truck drivers must keep notes of the daily laps to the unloading place, using a GPS receiver with a tracking storage feature provides a reliable record of the actual trips made that day. The disadvantage of such an application of GPS technology is that it requires turning on and off the GPS receiver before and after one round of driving. By turning on or off the GPS receiver, each round of driving can be displayed separately. Otherwise, the rounds of driving would be displayed next to each other, making it difficult to process the tracking records.
Excavator cycle time estimation for the research model depends on video data. However, since the time cycles of the excavator are usually a few seconds, recording the operation of the excavator can very quickly collect enough data to form a large sample of the time cycles of the excavator (n > 30). On the other hand, the estimation of the time cycle of the tipper truck, in addition to the data from the video (loading duration), depends on the GPS tracking data. More precisely, the duration of the time cycle of the tipper truck depends to a significant extent on the distance of the unloading places and the schedule for removing materials from the construction site. In cases where the unloading place is far away, only a few material removals can be carried out in one day. Therefore, the collected number of videos from the construction site and tracked laps, in terms of creating a sample from a normal distribution (n = 10–30) or a large sample (n > 30), needs to be adjusted to the situation during the work performance (distance of the unloading place, the amount of material for excavation and removal, the schedule), and the urgency of getting an answer about the duration of the time cycle. In other words, collecting data on the driving of tipper trucks can be a demanding task.
Comparative analysis of an estimate of actual excavator and tipper truck productivity using the methodologies of prominent books and manuals of world machine manufacturers enables deep insight and critical review into the impact of factors (coefficient values) determining productivity. At the same time, using real data from the construction site about the time cycle of excavators and tipper trucks increases the accuracy of actual productivity estimates. Compliance of the actual productivity estimates with the realistic (feasible) number of tipper truck daily laps to the unloading place provides a decisive factor for choosing the appropriate and reliable values of machine productivity for the observed construction site.
The main limitations in applying the protocol proposal for collecting and processing data about the operation of excavators and tipper trucks are situations when the loaded material is taken to several different unloading places, when tipper trucks with different box volumes are used, and when there is a frequent change of machines with different characteristics on the construction site. In addition, tracking tipper trucks from the construction site to the unloading place and performing video analysis for the excavator’s work activities can be time-consuming.
The directions for further research are to solve the situations mentioned above. Also, it is necessary to investigate the application of other audio–visual and/or sensing technologies (for example, lasers) when estimating the volume of the loaded material since the body of the tipper truck partially or entirely hides the view of the loaded material.
6. Conclusions
Earthworks are characterized by a large scope of work, the operation of construction machinery at extremely high prices, and an uncertain environment. In the planning phase of earthworks, it is quite a challenging task to accurately predict and evaluate the categories of rock and soil material in the excavation area, meteorological influence, construction machinery productivity, costs, required time, etc. In addition, each construction site presents a unique, dynamic, and complex environment with continuously present risks for the possible occurrence of unpredictable circumstances and/or dangers that, if they materialize, may have an unfavorable impact on the performance of works. Therefore, at the beginning of earthworks, it is very confident that certain deviations will occur within the previously prepared plan. More precisely, the actual productivity of the machines, achieved during the performance of earthworks, can differ significantly from the expected productivity of the machines, estimated at the planning stage.
By looking into the actual productivity of construction machines on the construction site, it is possible to detect deviations between planned and actual productivity, monitor the dynamics of earthworks, and timely detect risky, unfavorable, or unacceptable performances. The aforementioned is of crucial importance for the timely adoption of correct, appropriate, or corrective measures.
Manual data collection from the construction site to assess the actual productivity of machines is today considered an outdated, time-consuming, and subjective method. Therefore, audio–visual and location-sensing technology devices are replacing manual data collection. Audio–visual technology devices, such as video cameras (or smartphones), can faithfully reproduce construction site activities, which reduces the possibility of inaccurate data generation. GPS technology is classified as a location-sensing technology and is an advanced tool for position detection and movement tracking. By applying GPS technology, the data is mainly limited to time, location, route, and speed. The integration of audio–visual technology devices (such as video cameras or smartphones) and location-sensing technologies (such as GPS) could improve the application of both technologies.
In this paper, an innovative protocol is proposed for optimal recording/tracking of excavators and tipper trucks using a video camera and GPS technology. The proposed protocol enables the simultaneous collection of data on the operation of excavators and tipper trucks, a precise statement of the time cycle, and a reliable estimate of the actual productivity. It also serves to monitor and control the productivity achieved by excavators and tipper trucks.
The practicality and functionality of the proposed protocol have been proven by its application on a real construction site. The proposed protocol is more significant for construction sites with a larger scope of earthworks. With the timely detection of low machine productivity and unprofitable use, it is possible to make the right decisions and effectively reorganize the work of machines on the construction site.
Author Contributions
Conceptualization, M.Š., M.V. and D.C.-P.; methodology, M.Š., M.V. and D.C.-P.; software, M.Š.; validation, M.Š., M.V. and D.C.-P.; formal analysis, M.Š.; investigation, M.Š.; resources, M.Š.; data curation, M.Š.; writing—original draft preparation, M.Š.; writing—review and editing, M.Š., M.V. and D.C.-P.; visualization, M.Š.; supervision, M.V. and D.C.-P. All authors have read and agreed to the published version of the manuscript.
Funding
This research has been fully supported by the University of Rijeka (UNIRI projects for experienced scientists and artists) under project number uniri-tehnic-18-125. The project leader is Diana Car-Pušić.
Institutional Review Board Statement
Not applicable.
Informed Consent Statement
Informed consent was obtained from all subjects involved in the study.
Data Availability Statement
Data are available upon request to the corresponding author.
Acknowledgments
The authors are very grateful to everyone who participated in collecting data from the observed construction site.
Conflicts of Interest
The authors declare no conflict of interest.
References
- Salem, A.; Salah, A.; Ibrahim, M.; Moselhi, O. Study of factors influencing productivity of hauling equipment in earthmoving projects using fuzzy set theory. Int. J. Innov. Manag. Technol. 2017, 8, 151–154. [Google Scholar] [CrossRef]
- Hola, B.; Schabowicz, K. Estimation of earthworks execution time cost by means of artificial neural networks. Autom. Constr. 2010, 19, 570–579. [Google Scholar] [CrossRef]
- Navon, R.; Shpatnitsky, Y. Field experiments in automated monitoring of road construction. J. Constr. Eng. Manag. 2005, 131, 487–493. [Google Scholar] [CrossRef]
- Montaser, A.; Moselhi, O. Tracking hauling trucks for cut-fill earthmoving operations. In Proceedings of the International Symposium on Automation and Robotics in Construction (ISARC), Montreal, QC, Canada, 11 August 2013; IAARC Publications: Edinburgh, UK, 2013; Volume 30. [Google Scholar] [CrossRef]
- Montaser, A.; Moselhi, O. RFID+ for tracking earthmoving operations. In Proceedings of the Construction Research Congress 2012: Construction Challenges in a Flat World, West Lafayette, Indiana, 21–23 May 2012; American Society of Civil Engineering (ASCE) Publication: Reston, Virginia, 2012; pp. 1011–1020. [Google Scholar] [CrossRef]
- Montaser, A.; Moselhi, O. Truck+ for earthmoving operations. J. Inf. Technol. Constr. 2014, 19, 412–433. [Google Scholar]
- Ibrahim, M.; Moselhi, O. Automated productivity assessment of earthmoving operations. J. Inf. Technol. Constr. 2014, 19, 169–184. [Google Scholar]
- Alshibani, A.; Moselhi, O. Automated System for Productivity Assessement of Earthmoving Operations. In Proceedings of the International Symposium on Automation and Robotics in Construction (ISARC), Bratislava, Slovakia, 25–27 June 2010; IAARC Publications: Edinburgh, UK, 2010; Volume 27. [Google Scholar] [CrossRef]
- Alshibani, A.; Moselhi, O. Productivity based method for forecasting cost & time of earthmoving operations using sampling GPS data. J. Inf. Technol. Constr. 2016, 21, 39–56. [Google Scholar]
- Bügler, M.; Borrmann, A.; Ogunmakin, G.; Vela, P.A.; Teizer, J. Fusion of photogrammetry and video analysis for productivity assessment of earthwork processes. Comput. Aided Civ. Infrastruct. Eng. 2017, 32, 107–123. [Google Scholar] [CrossRef]
- Chen, C.; Zhu, Z.; Hammad, A. Automated excavators activity recognition and productivity analysis from construction site surveillance videos. Autom. Constr. 2020, 110, 10304. [Google Scholar] [CrossRef]
- Kim, J.; Chi, S. Multi-camera vision-based productivity monitoring of earthmoving operations. Autom. Constr. 2020, 112, 103121. [Google Scholar] [CrossRef]
- Lu, M.; Chen, W.; Shen, X.; Lam, H.C.; Liu, J. Positioning and tracking construction vehicles in highly dense urban areas and building construction sites. Autom. Constr. 2007, 16, 647–656. [Google Scholar] [CrossRef]
- Morley, D.; Lu, M.; AbouRizk, S. Identification of invariant average weighted haul distance to simplify earthmoving simulation modeling in planning site grading operation. J. Constr. Eng. Manag. 2014, 140, 04014057. [Google Scholar] [CrossRef]
- Salem, A.; Moselhi, O. AI-based cloud computing application for smart earthmoving operations. Can. J. Civ. Eng. 2021, 48, 312–327. [Google Scholar] [CrossRef]
- Chi, S.; Caldas, C.H. Automated object identification using optical video cameras on construction sites. Comput. Aided Civ. Infrastruct. Eng. 2011, 26, 368–380. [Google Scholar] [CrossRef]
- Kim, J.; Ham, Y.; Chung, Y.; Chi, S. Systematic camera placement framework for operation-level visual monitoring on construction jobsites. J. Constr. Eng. Manag. 2019, 145, 04019019. [Google Scholar] [CrossRef]
- Kim, H.; Ham, Y.; Kim, W.; Park, S.; Kim, H. Vision-based nonintrusive context documentation for earthmoving productivity simulation. Autom. Constr. 2019, 102, 135–147. [Google Scholar] [CrossRef]
- Roberts, D.; Golparvar-Fard, M. End-to-end vision-based detection, tracking and activity analysis of earthmoving equipment filmed at ground level. Autom. Constr. 2019, 105, 102811. [Google Scholar] [CrossRef]
- Kim, J.; Chi, S. Action recognition of earthmoving excavators based on sequential pattern analysis of visual features and operation cycles. Autom. Constr. 2019, 104, 255–264. [Google Scholar] [CrossRef]
- Fu, J.; Jenelius, E.; Koutsopoulos, H.N. Identification of workstations in earthwork operations from vehicle GPS data. Autom. Constr. 2017, 83, 237–246. [Google Scholar] [CrossRef]
- Kim, J.; Lee, D.E.; Seo, J. Task planning strategy and path similarity analysis for an autonomous excavator. Autom. Constr. 2020, 112, 103108. [Google Scholar] [CrossRef]
- Wu, Y.; Wang, M.; Liu, X.; Wang, Z.; Ma, T.; Lu, Z.; Liu, D.; Xie, Y.; Li, X.; Wang, X. Monitoring the Work Cycles of Earthmoving Excavators in Earthmoving Projects Using UAV Remote Sensing. Remote Sens. 2021, 13, 3853. [Google Scholar] [CrossRef]
- Mustaffa, N.K. Alternative Configuration in Earthmoving Operations for Minimizing Unit Emissions and Unit Cost. Int. J. Integr. Eng. 2020, 12, 297–303. [Google Scholar]
- Salem, A.; Moselhi, O. Automated monitoring and assessment of productivity in earthmoving projects. Can. J. Civ. Eng. 2018, 45, 958–972. [Google Scholar] [CrossRef]
- Chen, C.; Zhu, Z.; Hammad, A.; Akbarzadeh, M. Automatic identification of idling reasons in excavation operations based on excavator–truck relationships. J. Comput. Civ. Eng. 2021, 35, 04021015. [Google Scholar] [CrossRef]
- Šopić, M.; Vukomanović, M.; Car Pusić, D.; Završki, I. Estimation of the excavator actual productivity at the construction site using video analysis. Organ. Technol. Manag. Constr. Int. J. 2021, 13, 2341–2352. [Google Scholar] [CrossRef]
- Xiao, B.; Yin, X.; Kang, S.C. Vision-based method of automatically detecting construction video highlights by integrating machine tracking and CNN feature extraction. Autom. Constr. 2021, 129, 103817. [Google Scholar] [CrossRef]
- Cheng, M.Y.; Cao, M.T.; Nuralim, C.K. Computer vision-based deep learning for supervising excavator operations and measuring real-time earthwork productivity. J. Supercomput. 2023, 79, 4468–4492. [Google Scholar] [CrossRef]
- Chen, C.; Xiao, B.; Zhang, Y.; Zhu, Z. Automatic vision-based calculation of excavator earthmoving productivity using zero-shot learning activity recognition. Autom. Constr. 2023, 146, 104702. [Google Scholar] [CrossRef]
- Kim, H.; Ahn, C.R.; Engelhaupt, D.; Lee, S. Application of dynamic time warping to the recognition of mixed equipment activities in cycle time measurement. Autom. Constr. 2018, 87, 225–234. [Google Scholar] [CrossRef]
- Kavaliauskas, P.; Židanavičius, D.; Jurelionis, A. Geometric Accuracy of 3D Reality Mesh Utilization for BIM-Based Earthwork Quantity Estimation Workflows. ISPRS Int. J. Geo-Inf. 2021, 10, 399. [Google Scholar] [CrossRef]
- Šopić, M. Early Warning System of Approaching the Marginal Cost-Effectiveness of Construction Machinery during Earthworks. Ph.D. Thesis, University of Zagreb, Faculty of Civil Engineering, Zagreb, Croatia, 2022. [Google Scholar]
- Han, S.; Lee, S. Quantified comparison and analysis of different productivity measurements. J. Asian Archit. Build. Eng. 2008, 7, 309–316. [Google Scholar] [CrossRef]
- Peurifoy, R.; Schexnayder, C.; Schmitt, R.; Shapira, A. Construction Planning, Equipment, and Methods; McGraw-Hill Education: New York, NY, USA, 2006. [Google Scholar]
- Nunnally, S.W. (Ed.) Construction Methods and Management; Prentice-Hall: Hoboken, NJ, USA, 2007. [Google Scholar]
- Nichols, H.L., Jr.; Day, D. Moving the Earth: The Workbook of Excavation; McGraw-Hill Education: New York, NY, USA, 2005. [Google Scholar]
- Komatsu. Specifications and Application Handbook, 31st ed.; Komatsu: Tokyo, Japan, 2013. [Google Scholar]
- Caterpillar. Performance Handbook, 49th ed.; Cat® Publication by Caterpillar Inc.: Peoria, IL, USA, 2019. [Google Scholar]
- Montaser, A.; Bakry, I.; Alshibani, A.; Moselhi, O. Estimating productivity of earthmoving operations using spatial technologies. Can. J. Civ. Eng. 2012, 39, 1072–1082. [Google Scholar] [CrossRef]
- Kang, S.; Seo, J. GIS method for haul road layout planning in large earthmoving projects: Framework and analysis. J. Constr. Eng. Manag. 2013, 139, 236–246. [Google Scholar] [CrossRef]
- Sarkar, D.; Shah, D. A Framework for Application of Genetic Algorithm in Productivity Optimization of Highway Equipment Using Evolver Software. Eur. Int. J. Sci. Technol. 2013, 2, 151–163. [Google Scholar]
- Singla, A.; Gupta, P.K. Cost and Productivity Analysis of Equipments for Flexible Pavement-A Case Study. Int. Res. J. Eng. Technol. 2016, 3, 965–969. [Google Scholar]
- Attoh-Okine, N.O. Rule induction in productivity analysis: A rough set approach. Eng. Constr. Archit. Manag. 2003, 10, 413–417. [Google Scholar] [CrossRef]
- Sağlam, B.; Bettemir, Ö.H. Estimation of duration of earthwork with backhoe excavator by Monte Carlo Simulation. J. Constr. Eng. 2018, 1, 85–94. [Google Scholar] [CrossRef]
- Sabillon, C.; Rashidi, A.; Samanta, B.; Davenport, M.A.; Anderson, D.V. Audio-based bayesian model for productivity estimation of cyclic construction activities. J. Comput. Civ. Eng. 2020, 34, 04019048. [Google Scholar] [CrossRef]
- Lewis, P.; Leming, M.; Rasdorf, W. Impact of engine idling on fuel use and CO 2 emissions of nonroad diesel construction equipment. J. Manag. Eng. 2012, 28, 31–38. [Google Scholar] [CrossRef]
- Lewis, P.; Rasdorf, W.; Frey, H.C.; Leming, M. Effects of engine idling on national ambient air quality standards criteria pollutant emissions from nonroad diesel construction equipment. Transp. Res. Rec. 2012, 2270, 67–75. [Google Scholar] [CrossRef]
- Bhurisith, I.; Touran, A. Case study of obsolescence and equipment productivity. J. Constr. Eng. Manag. 2002, 128, 357–361. [Google Scholar] [CrossRef]
- Panas, A.; Pantouvakis, J.P. Comparative analysis of operational coefficients’ impact on excavation operations. Eng. Constr. Archit. Manag. 2010, 17, 461–475. [Google Scholar] [CrossRef]
- Panas, A.; Pantouvakis, J.P. Efficiency multipliers for construction productivity: A Comparative Evaluation. Organ. Technol. Manag. Constr. Int. J. 2015, 7, 1186–1196. [Google Scholar] [CrossRef]
- Rafsanjani, H.N. Comparison between Nominal and Actual Hourly Production of Crawler-Type Dozer: A Case Study. Comput. Civ. Eng. 2015, 2015, 17–24. [Google Scholar] [CrossRef]
- Pantouvakis, J.P. Data Analysis and Design of Construction Productivity Efficiency Multipliers. In International Conference on Engineering, Project, and Product Management; Springer: Cham, Switzerland, 2017; pp. 119–128. [Google Scholar] [CrossRef]
- Pantouvakis, J.P.; Maravas, A. Composite Criticality in Machinery Fleet Management of Construction Projects. MATEC Web Conf. EDP Sci. 2020, 312, 02003. [Google Scholar] [CrossRef]
- Belayutham, S.; González, V.A.; Yiu, T.W. Lean-based clean earthworks operation. J. Clean. Prod. 2017, 142, 2195–2208. [Google Scholar] [CrossRef]
- Wackerly, D.D.; Mendenhall, W.; Scheaffer, R.L. Mathematical Statistics with Application; Thomson Learning. Inc.: Belmont, CA, USA, 2008. [Google Scholar]
- MathWorks. Available online: https://www.mathworks.com/products/matlab.html (accessed on 23 April 2023).
- Qstarz International Co. Available online: http://racing.qstarz.com/Products/Qracing.html (accessed on 23 April 2023).
- Google Earth Pro Software. Available online: https://earth.google.com/web/ (accessed on 23 April 2023).
- Real Statistics. Available online: https://real-statistics.com/ (accessed on 23 April 2023).
Disclaimer/Publisher’s Note: The statements, opinions and data contained in all publications are solely those of the individual author(s) and contributor(s) and not of MDPI and/or the editor(s). MDPI and/or the editor(s) disclaim responsibility for any injury to people or property resulting from any ideas, methods, instructions or products referred to in the content. |
© 2023 by the authors. Licensee MDPI, Basel, Switzerland. This article is an open access article distributed under the terms and conditions of the Creative Commons Attribution (CC BY) license (https://creativecommons.org/licenses/by/4.0/).