Article

Odour Perception Using a Sniffing Team at a Municipal Solid Waste Treatment Plant: A Case Study

1
Physical Aspects of Ecoenergy Department, Institute of Fluid Flow Machinery, Polish Academy of Sciences, Fiszera Street 14, 80-231 Gdansk, Poland
2
Department of Chemistry, Technology and Biotechnology of Food, Gdansk University of Technology, Gabriela Narutowicza Street 11/12, 80-233 Gdansk, Poland
*
Author to whom correspondence should be addressed.
Sustainability 2023, 15(16), 12203; https://doi.org/10.3390/su151612203
Submission received: 6 June 2023 / Revised: 25 July 2023 / Accepted: 7 August 2023 / Published: 9 August 2023

Abstract

:
The monitoring of odour intensity, generated by a landfill area, is a difficult activity since it is a multi-source problem with discontinuous odour emissions. A modified sniffing team method is described here and applied to determine the main odour sources in a landfill located in Pomerania, Poland. Four consecutive test sessions were performed during the following months: August, December, April, and June. It was found that the main odour sources are as follows: a closed-chamber composting facility for leach storage; the site wherein technological operations associated with compost turn-over during open-air aeration processes are performed; and the landfill site. The results of the sniffing team method present the indicative values of sensory testing. The application of the presented method was limited by disturbances due to changing atmospheric conditions. The calculated odour intensities and concentrations correspond with real sensitive perceptions of the tested environment.

1. Introduction

Poor air quality is a global problem that mainly affects urban areas. Its negative impact on health and quality of life has become an important issue in the field of sustainable social development [1]. Poor air quality in developed urban areas is caused not only by nitrogen, sulphur, carbon, and dust oxides, but also by ammonia and volatile organic compounds. These compounds not only affect human health, but they also lead to climate change [1,2].
One of the important problems encountered in municipal waste treatment plants is related to odour emissions [3,4,5,6]. Landfills and wastewater treatment plants are the best-known emitters of odours [7]. Municipal landfills emit methane and various unpleasant effluents [8]. Moreover, as a result of urbanization, distances between landfills and areas of residence have gradually been reduced. Therefore, the spread of odours has an increasingly negative impact on society and the quality of life for people living in areas adjacent to such odour-emitting sources; annoying odours may also create potential health hazards for those in surrounding communities. This spread of odours has led to a rise in complaints, and local people have a negative attitude towards the operators of these plants [3,9,10,11,12,13,14]. These kinds of plants must be socially and environmentally sustainable; therefore, listening to people’s concerns, opinions, and attitudes regarding waste treatment and disposal sites is an essential first step in the siting phase of new waste facilities [15].
Emissions from landfills and therefore perceptible odours can cause various symptoms such as nausea and headaches, and people with respiratory diseases may be particularly sensitive to them. In recent years, an increasing amount of attention has been paid to legal regulations regarding emissions from waste disposal facilities, precisely because of people’s health, the quality of air, and people’s quality of life [16,17]. Among the existing types of industrial installations that can cause odour nuisances, landfills are the most common sources of emissions and odour complaints; therefore, society actively reacts to such problems [16,18,19,20].
By explaining the possible environmental effects related to the operation of landfills, it is possible to make optimal decisions related to odour nuisances during social debates at the spatial planning stage [21,22].
Odours from landfill sites originate from the atmospheric release of chemical compounds that are formed during the biological and chemical processes that occur during waste degradation [7,23]. Depending on the source, conditions, and place of odour formation, emissions can be classified as coming from a point or surface source [10,12,24].
Landfill gases are generated as a result of anaerobic degradation, and they contain reduced sulphur compounds and a number of volatile organic compounds. [13,25,26]. Trace amounts of compounds such as hydrogen sulphide, ammonia, as well as alkylbenzenes, esters, and mercaptans, some of which are identified as highly unpleasant, cause odour problems [8,12,13,19,27,28,29,30].
The use of analytical methods enables the qualitative and quantitative determination of the composition of gaseous mixtures [31,32,33,34]. However, it is difficult to link chemical composition with odorant intensity and other properties perceived by humans [35,36]. This is mainly due to synergistic or masking effects which may occur between a mixture’s components. It is also difficult to relate the chemical composition of an odorous mixture with its olfactory properties, which is another disadvantage [31]. Therefore, it is worth considering the use of a team of individuals who will act as a measuring sensor, as such a procedure can provide valuable sources of information on odour nuisance, and at the same time become the basis for various remedial actions to be taken in view of residents’ complaints [37].
Odour nuisance can be characterized using complex physical and chemical analyses and sensorial methods [6,35,38,39,40]. The characteristic measurable indicators of odorants are as follows: concentration, intensity, character, and scale [35,41]. Of these indicators, concentration is among one of the most commonly used analytical methods, whereas sensory methods use threshold concentration. The threshold concentration is the lowest concentration that can be still detected by the sniffing team [42]. Another physicochemical method, the “electronic nose”, consists of chemical sensors [29,31]. Electronic noses are widely used in monitoring networks for odour emissions and air-quality assessments [29,31,43].
The olfactory method allows for the characterization of odours using sensorial analysis based on the human sense of smell [35]. The human nose (and to a greater extent, the animal nose) is the most sensitive detector, and it often detects odorous compounds present in concentrations below the detection limits of analytical equipment [25,34,44,45].
The most common method is dynamic olfactometry, based on the standard EN 13725: 2003. The method allows for the determination of the concentration of odour (Cod), which is expressed in European odour units (ouE∙m−3). It represents the number of dilutions with neutral air required to achieve a concentration of odours above the detection threshold. The evaluation of the odour concentration is conducted under laboratory conditions by a panel using samples of polluted (odorous) air [46]. Olfactory measurements can also be performed in the field using field olfactometers. The field tests allow for the elimination of problems related to the transport and degradation of the sample [4,11,39,40,47,48,49,50,51,52,53]. Field olfactometers are appropriate for real-time analysis [54]. The impact of the tested object on the quality of air can be studied using mathematical modelling in order to assess the impact of investments on air quality. The most commonly used model is the CALPUFF dispersion model [16,26,55,56,57,58]. Conversely, Sówka et al. [47] and Szałata [22] used Operat FB software.
Sówka et al. [47] determined the odour impact range of an agricultural processing plant, along with an assessment of the share of individual odour emission sources in the total odour mix, using a field olfactometer. Conversely, Pawnuk et al. [59] used a field olfactometer at a mechanical biological municipal waste treatment plant.
A possible solution for field measurements is a method based on sniffing team observations; this involves employing a group of experienced people to evaluate the maximum distance (from a source) at which an odour can be perceived. This technique has been successfully used by specialists from the University of Gent at various locations in Flanders and other parts of Europe [5,60]. The method is based on the detection of odours in the field by a group of panellists. Such measurements allow for the calculation of the typical odour emission rate using a dispersion model. The results of a field survey are expressed in sniffing units per cubic meter (su/m3 or se/m3), where 1 su/m3 represents the minimum amount of the odorant, present in 1 m3 of air, with can be detected by a panel member under field conditions [5,60,61,62,63,64].
The main advantage of the sniffing team observation method is that it involves field measurements for evaluating the impact of the source (including waste treatment and transportation). Furthermore, the method reflects the actual perceptibility of the odour in the environment. However, this method also has some disadvantages. It is useful only if both the meteorological situation and the odour emissions do not vary too much during the measurement. Over a period of time (above 1 h), both the meteorological conditions and the emission rates can vary significantly [60,61,64].
This paper presents results of field measurement of odours by a sniffing team using masks with a filter to prevent olfactory adaptation. An on-site observation method was applied to determine the points of odour emissions at a municipal waste management plant. The tests were carried out at designated measurement points located throughout the technological parts of the landfill in order to determine the source of the odour emissions. The results may be beneficial in that they will provide a reference for controlling emissions from landfills and solving the problem of their negative impact on surrounding areas; they will also inform the management and control of landfills in the context of city development. The assessment of air quality and the impact of waste management plants on the environment in terms of odour nuisance is an important topic from the point of view of the further development of economic, environmental and social resources. The intensity of odours can cause people marked psychological discomfort. Odours are not usually a direct cause of disease, but long-term exposure can negatively affect human well-being [22,65]. Therefore, the treatment of gaseous emissions is an important measure to protect both public health and the environment [3]. Issues related to odour emissions are an important matter from the point of view of potential environmental impact. Sustainability is a vital aspect of healthy human development [66].

2. Materials and Methods

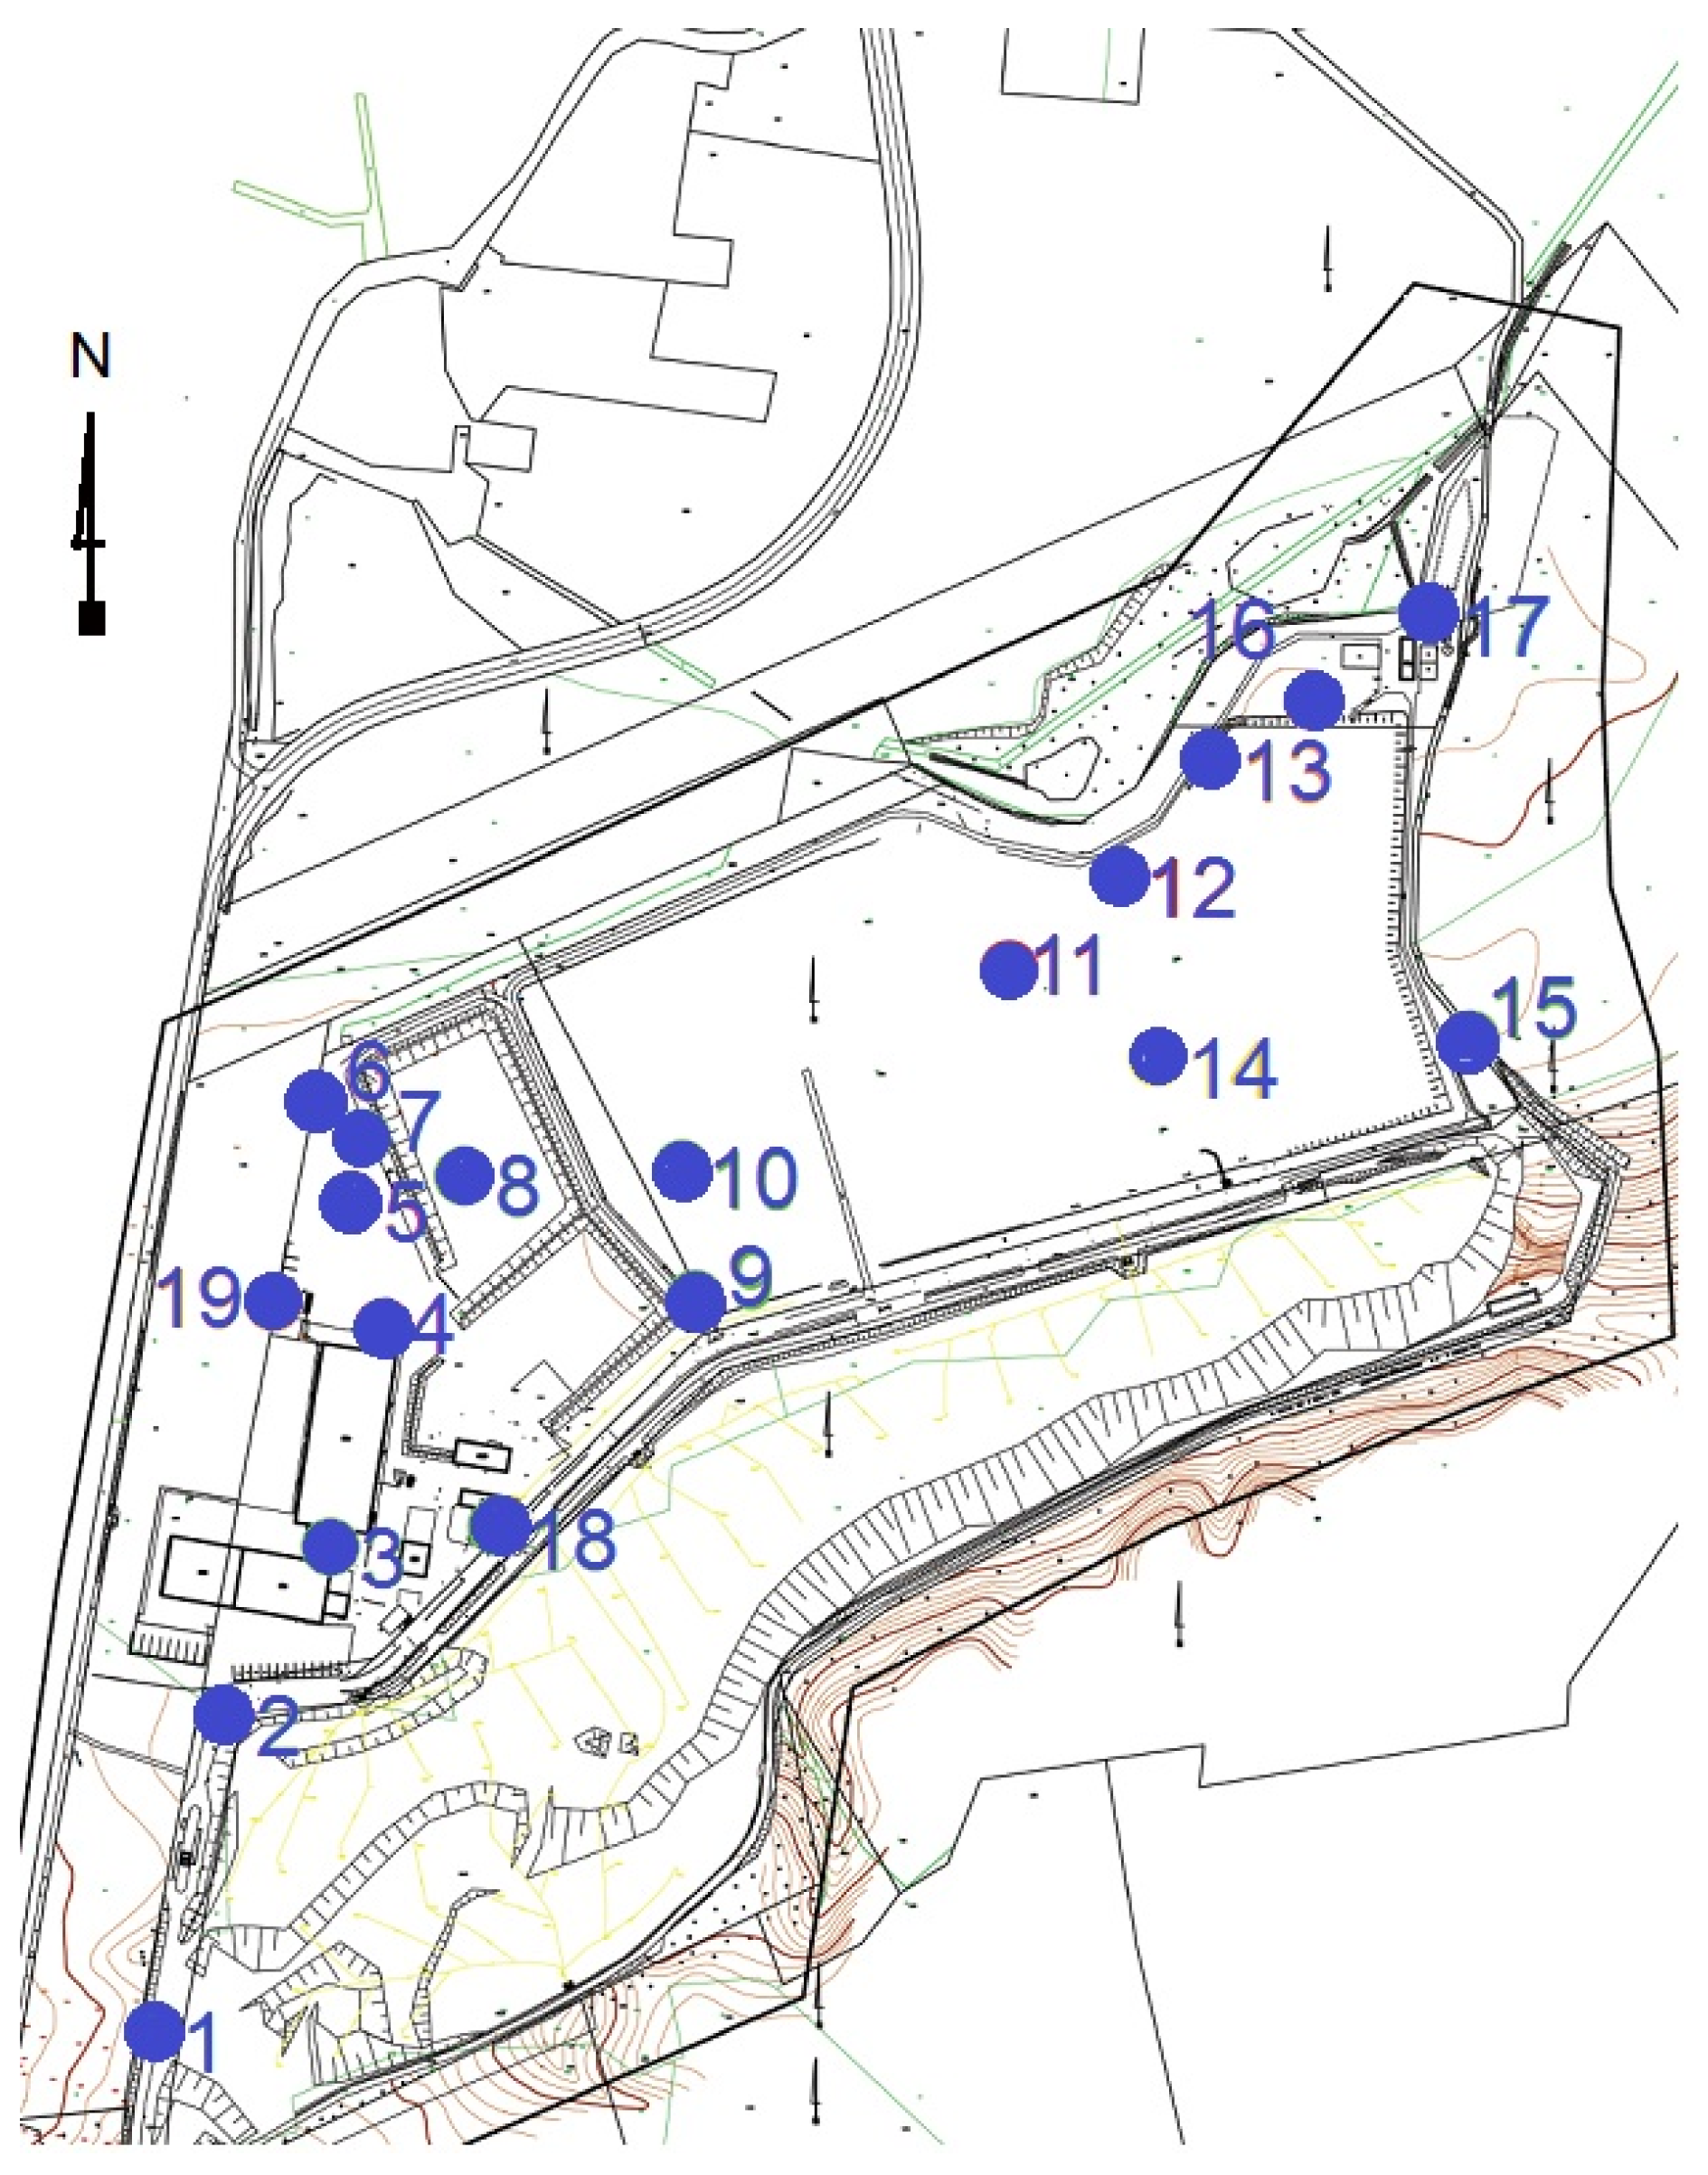
2.1. Site Description

Odours were detected at designated test points of a waste management plant located in northern Poland, about 10 km from a city (with about 250,000 inhabitants). The plant manages municipal solid wastes; it comprises sorting and closed-chamber composting facilities, a leachate treatment unit, and a waste disposal (landfill) site B2 under exploitation and a landfill site B1 (closed in 2011 with landfill gas acquired for cogeneration). The plant processes up to 150,000 tonnes of waste per year.

2.2. Methodology and Areas

The method used here is based on one developed at the Laboratory of Air Fragrance Quality at West Pomeranian University of Technology, Szczecin [43,67]. Odour intensities are determined during onsite tests, using a five-point verbal-point scale, using Weber–Fechner’s law. During the tests described here, the team members (panellists) used masks with an active carbon filter to prevent adaptation to fragrance intensity.
The olfactory performance of sniffers was checked against n-butanol, considered as a standard odorant reference, as in the case of dynamic olfactometry [64].
The field studies were carried out in 19 control areas (see Figure 1), each measuring approximately 10 m × 10 m. These areas are located at technological points throughout the landfill (e.g., the composting plant), where there is a high probability of odour problems.
The investigated control areas (and area numbers) at the municipal waste treatment plant are listed in Table 1.
During measurement, four members of the panel occupied the space (10 m × 10 m) in the corners of the studied area. Assessment of odour intensity started at the same time, and panellists did not communicated with each other. The panellist (evaluators) determined and noted the intensity of the odours on scorecards (Figure 2a)) using a five-point scale (0—denotes imperceptible smell, 1—perceptible, 2—weak, 3—average, 4—clear, 5—strong) every 15 s (four times a minute), and observations were carried out for 5-min periods.
After completing the measurement (5 min) in a given symbol area, the panellist put on the mask. In order to counteract the phenomenon of adaptation, the panellists rested for at least 10 minutes before the next measurement.
The summary scorecard (Figure 2b)) collates 80 individual ratings of odour intensities (four evaluators, five minutes, four tests per minute) for each odour point and test day. Each column summarize the ratings of all evaluators by checking the number of boxes equal to odour intensities (sum of four ratings) measured during each 15 s sniffing period.
For each of the measuring points, the average intensity and the maximum temporary intensity (Ip/5max) for the five-minute period (I5) were determined. The average intensity relative to the 5-min control period was calculated as the arithmetic mean for the set of all 80 individual assessments (one control area, four evaluators, 5 min of measurement, four tests per minute) (Equation (1)):
I 5 = a × 1 + b × 2 + c × 3 + d × 4 + e × 5 p × n e × t
where a is the number of ratings for smell intensity “1”, b is the number of ratings for smell intensity “2”, c is the number of ratings for smell intensity “3”, d is the number of ratings for smell intensity “4”, e is the number of ratings for smell intensity “5”, p is the length of the control period (in minutes), ne is the number of evaluators, and t is the number of tests per minute.
Ip/5max is the maximal intensity of odour registered in a 5 min period of control, where Ip is the temporary value related to the shortest perception of odour (2–3 breaths, approx. 5 s).
Finally, the odour concentrations can be calculated from odour intensities determined by the sniffing team using the extrapolation method of Weber–Fechner [25,68]:
I = k × l o g   ( C o d )
where I is the intensity determined by sniffing team, Cod is the odour concentration [ou/m3], and k is the Weber–Fechner coefficient. From Equation (2), after simple calculations, the value of the odour concentration can be determined:
C o d = 10 I k  
where k can be assumed to equal 1.14 [43]. The Weber–Fechner coefficient (k) is determined experimentally as an angular coefficient of the S = f(logZ) straight line:
        S z = S k W F log Z
where S is the odour intensity of a sample of strong or at least significant odour, including the same pollutants as the ambient air, Sz is the odour intensity of samples diluted with odour-free air, and Z is the dilution factor [43].

2.3. Operating Conditions

There are no other odour sources in the surrounding area. During the measurement, the following parameters were recorded: number and position of control areas, the time of test execution, meteorological conditions, and the source of an odour. The field measurements were performed four times (in August, December, April, and June). Test sessions were between 09:00 and 13:00 h.

3. Results and Discussion

Due to the large number of individual scorecards (304, taking into account four evaluators, 19 control areas, and four test days) and summarized scorecards (76, i.e., 19 control areas and four test days) only the average intensity for the five-minute period (I5) and the maximum temporary intensity (Ip/5max) for each control area and test day are presented in Table 1. The method of I5 and Ip/5max calculations are described in Section 2.2 above.
All of the results of measurements and calculations obtained for the 19 control areas are presented at Table 1 and Figure 3, respectively.
The calculated intensity values for the five-minute period (I5) and the maximum temporary intensity (Ip/5max) for all investigated areas measured in August, December, April, and June are presented in Figure 3, and the meteorological conditions and values of the calculated odour concentrations are presented in Table 1. The highest temperatures were recorded in June (between 21 °C and 23 °C), then in August (from 16.2 °C to 18.2 °C); temperatures were average in April (from 12 °C to 15 °C), and the coldest month was December (from −4.6 °C to −5.2 °C). The measured temperatures reflect seasonality, which has also been observed by others [59].

3.1. Odour Intensity

3.1.1. Road Approaching the Sorting Facility, Areas 1 and 2

There were significant differences in I5 (the average intensity for a 5-min control period) and Ip/5max (the maximum temporary intensity) in area 1. Odours in area 1 were undetectable during the December and April test sessions. This was due to a wind blowing in the opposite direction, compared to the tests performed in August. In June, varying wind conditions resulted in an apparently low registered odour intensity (1.00). In addition, more frequent waste transport was observed on this test day, which contributed to the occurrence of temporary odour intensities at a level of 1.00 during measurement.
In area 2, a similar situation to that in area 1 was observed. The temporary intensity was almost three times higher compared to the average intensity; this was due to varying wind conditions (Table 1). Moreover, an increased transport intensity observed during the June test (similar to area 1) contributed to an increased temporary odour intensity.

3.1.2. Location between Sorting and the CCCF Facility for Mixed Municipal Solid Waste, Area 3

In area 3, there was a significant difference between the general odour intensities and the maximum temporary odour intensities. The main reason for these differences was of a technological nature. Each opening of the gates to CCCF resulted in a significant increase in odour intensities.

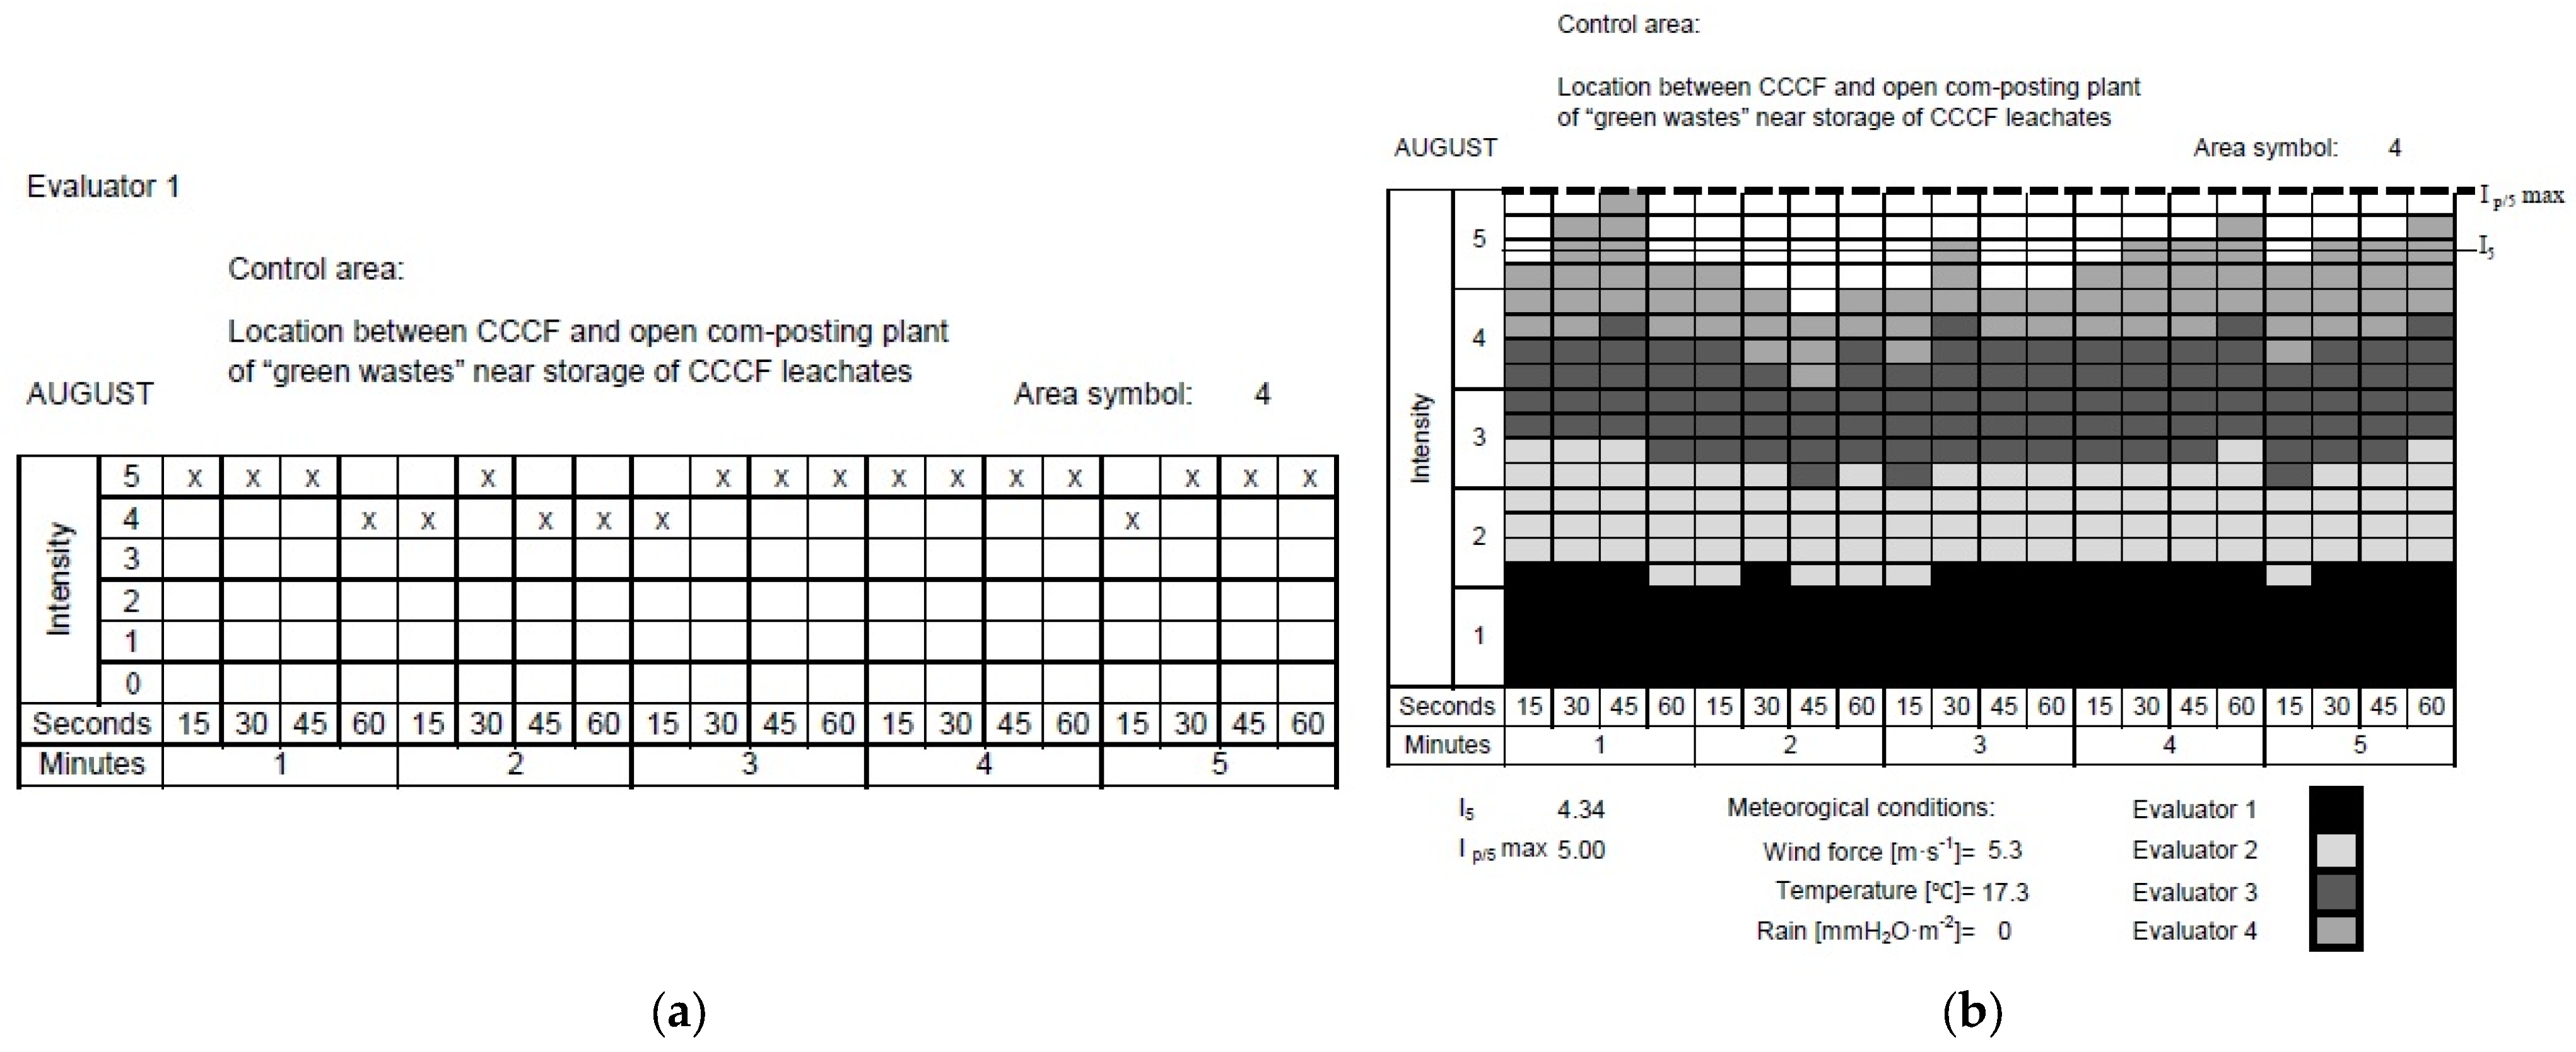
3.1.3. Place between CCCF and the Open Composting Facility for “Green Wastes” near the Storage of CCCF Leachates, Area 4

Comparing the December, April, and June tests with those performed in August, a downward trend of I5 and Ip/5max was observed, from 1.00 to 1.5 units and from 0.25 to 1.75 units, respectively. However, the area is still strongly odorous, and it was found to be one of the important sources of odorants in all the landfill area (December, April), especially during the flipping of compost in the aeration process; this compost had already left the CCCF, and was stored in area 4.

3.1.4. Open Composting Plant for “Green Wastes”, Areas 5, 6 and 7

The intensity of odour in these areas depends on the season. During summer and autumn (June and August), a high level of perceptible odour was registered. However, this odour decreased during spring (April) due to lack of supply of green waste and a slowing down of the fermentation process caused by lower temperature. It was found that these areas emitted specific objectioinable or offensive odorants.
There was significant seasonable variation in I5 in area 7 (December, April). The area is located close to the rainwater reservoir and leachate from CCCF, which was the main source of odorant emission. During tests in April and June, the tank was opened. Besides, the odour emissions were intensified during the flipping of compost during the aeration process. A drop in temperature meant that fermentation processes were slowed down, and emission of odorants reduced (April, Table 1). The maximum temporary intensities were high; this is probably due to the close proximity of compost heaps after the aeration process.

3.1.5. Homogenous Waste Dumping Region, Area 8

Comparing all the measurements (August, December, April, June), there were no significant differences in I5 and Ip/5max. Low odour intensities indicate that this area is not the main source of odorants.

3.1.6. Landfill Site B1, Areas 9 and 10

Landfill site B1 is in use, and accepts up to 150,000 Mg (tonnes) of waste per year. There was significant seasonal variation in I5 and Ip/5max values in these areas. Odours here were imperceptible in December and June. The reason for the increased intensity registered during the test in April was wind from the opposite direction, compared to those in December and June. In April, the wind blew odours from area 4, in which intensive aeration works were being performed.

3.1.7. Landfill Site B2, Areas 11, 12, 13 and 14

Landfill site B2 is closed, and it is being degasified; a high concentration of H2S (above 3000 mg/m3) was found in the landfill gas. High odour intensities registered in these areas clearly indicate that landfill site B1 is the main source of the odorants (with larger odorant fluxes than for area 4, due to the larger surface), regardless of the climatic conditions. In area 11, some variations in I5 and Ip/5max values were observed. This might result from a locally slowed fermentation or gas permeation process through the dumping site. In areas 12 and 13, a decrease in I5 and Ip/5max was not observed.
The smell of the landfill gas was the strongest. It is this type of smell that is the main source of complaints from local residents. Generally, uncontrolled emissions are actually caused by insufficiently sealed production wells or uncovered landfill. The smells that the sniffing team sensed were associated mainly with “rotten eggs” (H2S); Nikolas et al. [64] described these smells similarly.
The significant variation in I5 and Ip/5max values registered for area 14 (on the road leading to landfill site B1) was caused by varying wind conditions (Table 1) and technological operations carried out during the measurements (December, April). It must be emphasised that the landfill site was largely uncovered (leading to increased odour emissions).

3.1.8. The Road around Landfill Site B2, Areas 15 and 16

The measurements performed in area 15 showed that this is an area free of odour emissions (December, April). The average intensity observed in April (I5 = 2.08 and Ip/5max = 2.75) was due to technological works leading to the complete uncovering of the landfill site.
Significant odour intensities I5 and Ip/5max registered in area 16 (December, June) were caused by an adverse wind direction transporting odour directly from the landfill site B1. Additionally, additional technical works contributed to the increased odour intensities, especially during the April and June test sessions.

3.1.9. Pumping Plant for Wastewater and Landfill Leachates, Area 17

The performed field tests showed that this area is also one of the main sources of odorants, especially during technological operations (e.g., the pumping of wastewater or leachates). The odorants that occur in this area are characterized by high nuisance. For the August, April, and June field tests, the I5 values ranged from 2.16 to 3.29, while the Ip/5max values were between 2.50 and 3.75. Only during the December measurements were odour intensities significantly lower (I5 = 0.56 and Ip/5max = 1.50), which could be due to different weather conditions.

3.1.10. Landfill–Gas Power Station, Area 18

The landfill–gas cogeneration plant is not a direct source of odorants; the observed variations in odour intensity (for I5 from 0.01 to 2.01 and Ip/5 from 0.25 to 2.25) were caused by variable climatic conditions, mainly the transfer of odorants by wind from landfill sites B1 and B2 or area 4 (a location between CCCF and the open composting facility for “green wastes”, near the storage of CCCF leachates) (December, April).

3.1.11. CCCF Biological Filter, Area 19

The evaluators (panellists) registered the presence of a specific odorant (described as a smell of “wet bark”) during the tests in area 19. The five-minute period intensities (I5) ranged from 2.10 to 3.30 (December, April), while the maximum temporary intensities (Ip/5max) ranged from 2.75 to 3.75. This odorant is not specific to municipal landfills. The evaluators described it as inoffensive. Similar odour characteristics were described by Bian et al. [69].

3.2. Odour Concentrations

The calculated values of Cod for average intensities and maximum temporary intensities are presented in Table 2.
The odour concentrations of the first two measuring points, located at the entrance road to sorting plant, range from 1 ou/m3 up to 304 ou/m3. The highest value was 304 ou/m3, measured during August. In December, these values for given points amounted to 1 ou/m3. In the other months, they did not exceed 4 ou/m3.
The odour concentration at area 3 (located between sorting and CCCF of mixed municipal solid waste) ranged from 12 ou/m3 up to 980 ou/m3, except for December, at which time this value was 1 ou/m3.
At the location between CCCF and the open composting plant of “green wastes” near the storage of CCCF leachates (area 4), a high concentration of odours was recorded, which ranged from 310 ou/m3 to 6412 ou/m3. The lowest value, unlike most measurement points, was 310 ou/m3, noted for April, and 1041 ou/m3, for December. The highest value was recorded for the warmest month.
For measurement points 5, 6, and 7, located in the area of the open composting plant of “green wastes” (see Figure 1), the highest values were recorded in December and in August (1468 ou/m3) for point 5. The highest values recorded for point 5 in April range from 7 ou/m3 to 2198 ou/m3. For area 6, odour concentrations ranged from 4 ou/m3 to 169 ou/m3. The highest value was recorded for the warmest month. For area 7, the concentration ranged from 2 ou/m3 (December) to 336 ou/m3 (June).
Area 8, the homogenous waste dump, was characterized by measurements at a comparable level; these were 3 ou/m3 for December and June, and 4 ou/m3 for August and April. These values are relatively low. This is the area wherein the average of the four measurements is the lowest, and does not exceed 1 ou/m3.
For points 9 and 10, located in the waste deposition area (place A), the lowest odour concentration values were recorded in December and June (an average of 1 ou/m3), while the highest, for both points, were in August (100 ou/m3 and 524 ou/m3). In April, for area 9 and 10, these values were 25 ou/m3 and 211 ou/m3, respectively.
Odour concentration measurements were then made at the waste decomposition point (place B), which includes areas 11–14. For all the mentioned area numbers, odour concentrations ranged from 28 ou/m3 to 3428 ou/m3, depending on the month. The area wherein the highest average odour concentration was recorded was area 11, with the highest concentration in August (3428 ou/m3). The second point with a high average concentration was area 14, with the highest concentration also falling in the month of August (1725 ou/m3). For the remaining areas (12 and 13), the highest odour concentrations were found in December and June, amounting to 724 ou/m3 and 616 ou/m3, respectively.
For both areas 15 and 16, the highest odour concentrations were found in April, amounting to 67 ou/m3 and 229 ou/m3, respectively. Minimal values between 1 ou/m3 and 2 ou/m3 were found for area 15 (August, December and June). The average concentration of odours for area 16 in measurements throughout the year was about 100 ou/m3, and the lowest concentration was recorded in August, at 3 ou/m3.
In area 17 (the pumping plant for wastewater and landfill leachates), odour concentration values ranged from 3 ou/m3 to 769 ou/m3, where the lowest value was found in December, and the highest in June.
For the biogas power station (area 18), the highest concentration was found in August (58 ou/m3) and April (17 ou/m3), the lowest values were 1 ou/m3 and 2 ou/m3, respectively, for December and June.
The last area is the CCCF biological filter (19), for which odour concentration values ranged from 70 ou/m3 to 785 ou/m3; the lowest value was found in June, and the highest in August.
The Cod values were rather stable for most control areas. Significant variations in Cod values during different seasons were observed for area 4, 5, 11 and 14, which include the place between CCCF and the open composting plant for “green wastes” near storage of CCCF leachates, the open composting plant for “green wastes”, and the waste deposition point, place B.
The largest values of Cod were observed mainly in August, ranging from 57 ou/m3 to 3428 ou/m3, excluding points 8, 15 and 16, for which values in a given month ranged from 2 ou/m3 to 4 ou/m3; which can be explained by higher temperatures, the progress of the fermentation process, and technical works. The high Cod values in different seasons, e.g., for area 4 and 11, may have resulted from increased Cod levels in the neighbourhood of these areas (area 3, 5, 10 and 12). The increase in Cod values may also have been caused by varying wind conditions. A relationship was observed between odour intensity and odour concentration, which is also confirmed by Wiśniewska et al. [70]. In the case of many odour sources, higher odour intensity was accompanied by higher odour concentration. This is in accordance with Weber–Fechner’s law, according to which there is a relationship between the intensity of olfactory perception and the concentration of smell, which is the theoretical basis for the perception of olfactory sensations by the human sense of smell [70].
Limited literature is available regarding studies of odour concentration determination via the sniffing team method.
Bian et al. [69] conducted research near a landfill with human panel called “Odour Patrol” within the Odour Monitoring Program, due to a large number of complaints. The described results found by the Odour Patrol show that the method is capable of determining odours from a specific odour source, without mistaking them for odours from the surrounding background.
Operating conditions are one of the factors that can affect the emission of odours, therefore affecting the measured odour concentrations, technological operations, and the type of processed waste [70,71]. There is a significant relationship between odour concentration and air temperature. The higher the air temperature, the higher the odour concentration [71].
Pawnuk et al. [59] used a portable olfactometer in their research at a biological municipal waste treatment plant; the highest concentration was 78.45 ou/m3, found in August, for a green waste storage area and a place near the aerobic stabilization chambers. The values obtained by the authors are much lower due to the use of a portable olfactometer with the possibility of dilutions.
Wiśniewska et al. also conducted research using a portable olfactometer, but of a different type, which can determine higher concentration values. Research was conducted at a biological waste treatment plant. The Cod ranged from 22 ou/m3 up to 6390 ou/m3 [72]. In other research by Wiśniewska et al. [73] at a municipal waste biogas plant with mixed waste storage points, the highest Cod value was 108 ou/m3.
The available literature shows a high variability in odour concentrations, despite some similarities. Thus, we ask the question: is it possible to obtain very similar results for different MBT plants? Pawnuk et al. [59] refute this possibility.
The composition of waste is variable, and depends on the demographic of communities, cities or regions. Therefore, the waste that is processed in a given facility may differ from that found at another. It is also important that despite technological similarities, individual MBT facilities may differ in certain processes, which may also cause differences in odour emissions and affect odour concentrations [59].
Based on conducted field measurements, it was concluded that the main points of the odour emissions are as follows:
  • Landfill site B1 (areas 11, 12, and 13);
  • The place between the closed-chamber composting facility (CCCF) and the open composting plant for “green wastes” near the storage of CCCF leachates (area 4); this was caused mainly by leachates from the CCCF, and the technological operations associated with the flipping of compost during aeration process;
  • The open composting plant of “green wastes” (areas 5, 6 and 7), especially during the flipping of compost in the process of aeration during the summer–autumn period;
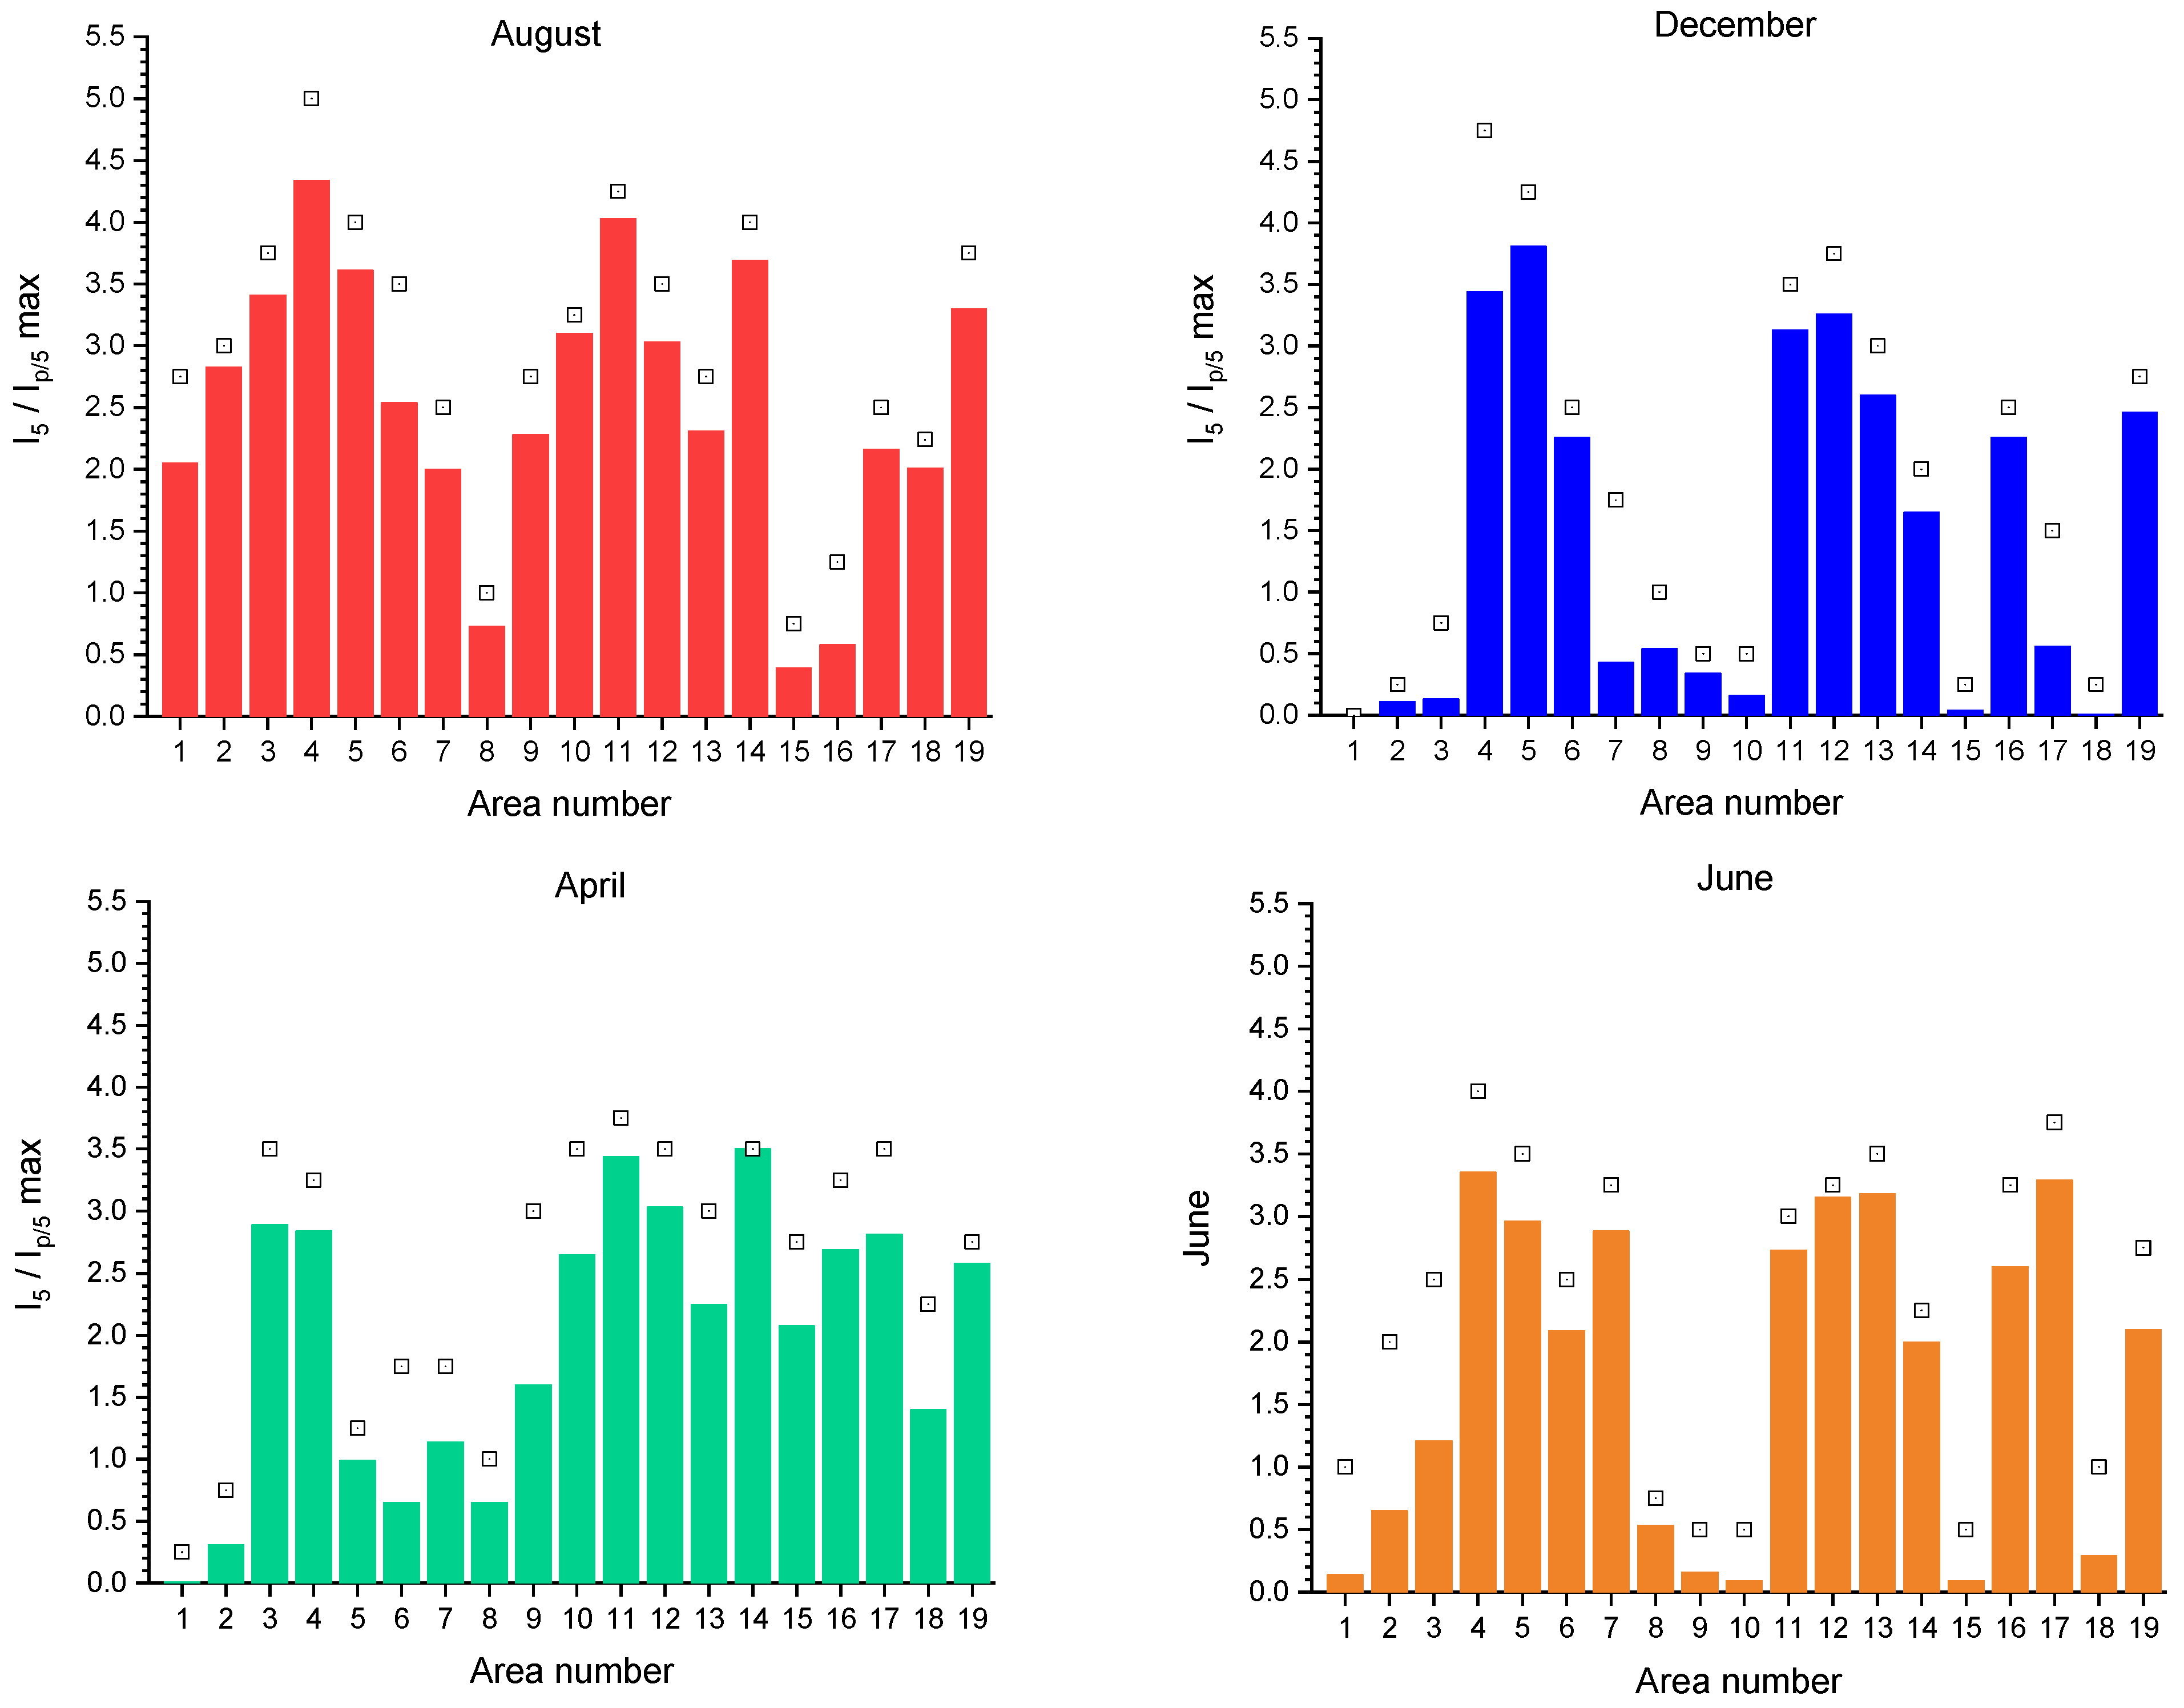
  • In these locations, the average intensities (I5) and Ip/5max reached a value above 4, which is equivalent to strong intensity. Field tests conducted during August, December, April, and June under different climatic conditions confirm the major sources of odorants. The average intensities for the five-minute period (I5) and the maximum temporary intensity (Ip/5max) achieved in these areas showed the highest values, irrespective of temperature and wind direction;
  • A significant increase in the averaged I5 and the maximum temporary intensity (Ip/5max) took place during technological operations, especially those conducted in Area 4 (the flipping of compost during the aeration process). The landfill site B1 was subject to modernization during the performance of the measurements. Uncertainty remains as to how modernization (e.g., the drilling new degasification wells along the landfill edges) will affect the situation in the middle of the deposition point, area 11. The answer could be found through repetition of the tests sometime after landfill modernization. The application of the presented method is limited by changing atmospheric conditions.
The sniffing team method can be used to assess odours generated during transport, technical works, and unforeseen circumstances, and when other methods are not available. The most important advantage of this method is that the olfactory sensations evaluators are from the population living around municipal waste treatment plants and other odour nuisance activities. The calculated odour intensities and concentrations correspond to real sensitive perceptions of the tested environment. Special attention should be paid, during the performance of the tests, to the wind and its direction, i.e., whether it transfers odours from locations other than the one being tested.

4. Conclusions

With regard to the discussed issues, it is possible to define “odour” sources not only at the planning stage of a given investment, but also to verify them during operation, all in terms of sustainable development (impact on the environment, property, or social values). By taking into account the conditions of sustainable development, social approval and acceptance of projects related to odorous facilities can be obtained.
The method proposed here may be useful for determining the sources of odours, but also for searching for solutions or strategies to reduce odours. This will help to reduce the negative impact operating landfills.
The conducted investigations enabled the formulation of several recommendations for the site’s administration to improve the air conditions:
  • action should be taken to degasify landfill site B1, especially near its edges;
  • the frequency of compost flipping operations (i.e., intensification of the aeration process) of “green wastes” in open composting plants should be increased in order to avoid rotting.
Leachate from the CCCF should be properly treated, e.g., through fermentation, to avoid strong odours.
The sniffing team method can be successfully used to assess the smell generated during technological works, and to assess the functioning of the plant. The determined intensities and concentrations of odours reflect actual perceptions; however, this method is vulnerable to changing meteorological conditions.

Author Contributions

Conceptualization, I.K.; methodology, R.T.; validation, I.K. and R.T.; formal analysis, I.K.; investigation, R.T.; resources, I.K. and R.T.; data curation, I.K. and R.T.; writing—original draft preparation, I.K., R.T. and S.M.; writing—review and editing, I.K. and A.C.; visualization, I.K.; supervision, A.C.; project administration, A.C.; funding acquisition, A.C. All authors have read and agreed to the published version of the manuscript.

Funding

This research received no external funding.

Institutional Review Board Statement

Not applicable.

Informed Consent Statement

Not applicable.

Data Availability Statement

The data presented in this study are available on request from the corresponding author.

Conflicts of Interest

The authors declare no conflict of interest.

References

  1. Chukwu, T.M.; Morse, S.; Murphy, R. Poor Air Quality in Urban Settings: A Comparison of Perceptual Indicators, Causes and Management in Two Cities. Sustainability 2022, 14, 1438. [Google Scholar] [CrossRef]
  2. Perera, F.P. Commentary Multiple Threats to Child Health from Fossil Fuel Combustion: Impacts of Air Pollution and Climate Change. Environ. Health Perspect. 2017, 125, 141–148. [Google Scholar] [CrossRef] [Green Version]
  3. Schlegelmilch, M.; Streese, J.; Stegmann, R. Odour Management and Treatment Technologies: An Overview. Waste Manag. 2005, 25, 928–939. [Google Scholar] [CrossRef]
  4. Brattoli, M.; de Gennaro, G.; de Pinto, V.; Loiotile, A.D.; Lovascio, S.; Penza, M. Odour Detection Methods: Olfactometry and Chemical Sensors. Sensors 2011, 11, 5290. [Google Scholar] [CrossRef] [PubMed] [Green Version]
  5. Brancher, M.; Grif, K.D.; Franco, D.; de Melo, H. A Review of Odour Impact Criteria in Selected Countries around the World. Chemosphere 2017, 168, 1531–1570. [Google Scholar] [CrossRef]
  6. Mielcarek, P.; Rzeźnik, W. Odor Emission Factors from Livestock Production. Pol. J. Environ. Stud. 2015, 24, 27–35. [Google Scholar] [CrossRef]
  7. El-Fadel, M.; Findikakis, A.N.; Leckie, J.O. Environmental Impacts of Solid Waste Landfilling. J. Environ. Manag. 1997, 50, 1–25. [Google Scholar] [CrossRef]
  8. Scaglia, B.; Orzi, V.; Artola, A.; Font, X.; Davoli, E.; Sanchez, A.; Adani, F. Odours and Volatile Organic Compounds Emitted from Municipal Solid Waste at Different Stage of Decomposition and Relationship with Biological Stability. Bioresour. Technol. 2011, 102, 4638–4645. [Google Scholar] [CrossRef] [Green Version]
  9. Downey, L.; Van Willigen, M. Environmental Stressors: The Mental Health Impacts of Living near Industrial Activity. J. Health Soc. Behav. 2005, 46, 289–305. [Google Scholar] [CrossRef] [PubMed] [Green Version]
  10. Fang, J.-J.; Yang, N.; Cen, D.-Y.; Shao, L.-M.; He, P.-J. Odor Compounds from Different Sources of Landfill: Characterization and Source Identification. Waste Manag. 2012, 32, 1401–1410. [Google Scholar] [CrossRef]
  11. Laor, Y.; Orenstein, P.; Ravid, U.; Baybikov, R.; Hanan, A.; Saadi, I.; Abbou, Y. A Screening Tool for Selection of Field Odor Assessors. J. Air Waste Manag. Assoc. 2011, 61, 1353–1360. [Google Scholar] [CrossRef] [PubMed] [Green Version]
  12. Moreno, A.I.; Arnáiz, N.; Font, R.; Carratalá, A. Chemical Characterization of Emissions from a Municipal Solid Waste Treatment Plant. Waste Manag. 2014, 34, 2393–2399. [Google Scholar] [CrossRef] [PubMed] [Green Version]
  13. Lim, J.H.; Cha, J.S.; Kong, B.J.; Baek, S.H. Characterization of Odorous Gases at Landfill Site and in Surrounding Areas. J. Environ. Manag. 2018, 206, 291–303. [Google Scholar] [CrossRef]
  14. Wang, Y.; Li, L.; Qiu, Z.; Yang, K.; Han, Y.; Chai, F.; Li, P.; Wang, Y. Trace Volatile Compounds in the Air of Domestic Waste Landfill Site: Identification, Olfactory Effect and Cancer Risk. Chemosphere 2021, 272, 129582. [Google Scholar] [CrossRef]
  15. Roy, S.; Basak, D.; Bose, A.; Chowdhury, I.R. Citizens’ Perception towards Landfill Exposure and Its Associated Health Effects: A PLS-SEM Based Modeling Approach. Environ. Monit. Assess. 2023, 195, 134. [Google Scholar] [CrossRef]
  16. Szałata, Ł.; Zwoździak, J.; Majrernik, M.; Cierniak-Emerych, A.; Jarossová, M.; Dziuba, S.; Knošková, L.; Drábik, P. Assessment of the Odour Quality of the Air Surrounding a Landfill Site: A Case Study. Sustainability 2021, 13, 1713. [Google Scholar] [CrossRef]
  17. Belpomme, D.; Irigaray, P.; Hardell, L.; Clapp, R.; Montagnier, L. The Multitude and Diversity of Environmental Carcinogens. Environ. Res. 2007, 105, 414–429. [Google Scholar] [CrossRef]
  18. Del, R.; Sironi, S.; Capelli, L.; Ce, P.; Il, M. Odour Emission Factors for the Prediction of Odour Emissions from Plants for the Mechanical and Biological Treatment of MSW. Atmos. Environ. 2006, 40, 7632–7643. [Google Scholar] [CrossRef]
  19. Sironi, S.; Capelli, L.; Céntola, P.; Del Rosso, R.; Il Grande, M. Odour Emission Factors for Assessment and Prediction of Italian MSW Landfills Odour Impact. Atmos. Environ. 2005, 39, 5387–5394. [Google Scholar] [CrossRef]
  20. Wiśniewska, M.; Kulig, A.; Lelicińska-Serafin, K. The Impact of Technological Processes on Odorant Emissions at Municipal Waste Biogas Plants. Sustainability 2020, 12, 5457. [Google Scholar] [CrossRef]
  21. Szynkowska, I.; Zwoździak, J. Współczesna Problematyka Odorów; Wydawnictwo Naulowo-Techniczne: Warsaw, Poland, 2010. [Google Scholar]
  22. Szałata, Ł. Impact of Implementing a Deodorization System on the Functioning of a Waste Management Plant. Sustainability 2020, 13, 5983. [Google Scholar] [CrossRef]
  23. Pierucci, P.; Porazzi, E.; Martinez, M.P.; Adani, F.; Carati, C.; Rubino, F.M.; Colombi, A.; Calcaterra, E.; Benfenati, E. Volatile Organic Compounds Produced during the Aerobic Biological Processing of Municipal Solid Waste in a Pilot Plant. Chemosphere 2005, 59, 423–430. [Google Scholar] [CrossRef]
  24. Palmiotto, M.; Fattore, E.; Paiano, V.; Celeste, G.; Colombo, A.; Davoli, E. Influence of a Municipal Solid Waste Landfill in the Surrounding Environment: Toxicological Risk and Odor Nuisance Effects. Environ. Int. 2014, 68, 16–24. [Google Scholar] [CrossRef]
  25. Gao, S.; Zhao, P.; Li, Y.; Hu, J.; Zhou, S.; Zhang, H.; Wu, J.; Jiao, Z.; Wang, S.; Fu, Q.; et al. Characterization and Influence of Odorous Gases on the Working Surface of a Typical Landfill Site: A Case Study in a Chinese Megacity. Atmos. Environ. 2021, 262, 118628. [Google Scholar] [CrossRef]
  26. Duan, Z.; Scheutz, C.; Kjeldsen, P. Trace Gas Emissions from Municipal Solid Waste Landfills: A Review. Waste Manag. 2021, 119, 39–62. [Google Scholar] [CrossRef] [PubMed]
  27. Pagans, E.; Font, X.; Sánchez, A. Emission of Volatile Organic Compounds from Composting of Different Solid Wastes: Abatement by Biofiltration. J. Hazard. Mater. 2006, 131, 179–186. [Google Scholar] [CrossRef] [Green Version]
  28. Young, P.; Parker, A. The Identification and Possible Environmental Impact of Trace Gases and Vapours in Landfill Gas. Waste Manag. Res. 1983, 1, 213–226. [Google Scholar] [CrossRef]
  29. Romain, A.-C.; Delva, J.; Nicolas, J. Complementary Approaches to Measure Environmental Odours Emitted by Landfill Areas. Sens. Actuators B Chem. 2008, 131, 18–23. [Google Scholar] [CrossRef]
  30. Duan, Z.; Kjeldsen, P.; Scheutz, C. Trace Gas Composition in Landfill Gas at Danish Landfills Receiving Low-Organic Waste. Waste Manag. 2021, 122, 113–123. [Google Scholar] [CrossRef] [PubMed]
  31. Capelli, L.; Sironi, S.; Del Rosso, R.; Céntola, P.; Il Grande, M. A Comparative and Critical Evaluation of Odour Assessment Methods on a Landfill Site. Atmos. Environ. 2008, 42, 7050–7058. [Google Scholar] [CrossRef]
  32. Davoli, E.; Gangai, M.L.; Morselli, L.; Tonelli, D. Characterisation of Odorants Emissions from Landfills by SPME and GC/MS. Chemosphere 2003, 51, 357–368. [Google Scholar] [CrossRef] [PubMed]
  33. Dincer, F.; Odabasi, M.; Muezzinoglu, A. Chemical Characterization of Odorous Gases at a Landfill Site by Gas Chromatography-Mass Spectrometry. J. Chromatogr. A 2006, 1122, 222–229. [Google Scholar] [CrossRef]
  34. Senante, E.; Galtier, L.; Békaert, C.; Lambolez-Michael, L.; Budka, A. Odour Management at MSW Landfill Sites: Odours Sources, Odorous Compounds and Control Measures. In Proceedings of the 9th International Waste Management & Landfill Symposium, Pula, Italy, 9–13 October 2003; pp. 1623–1633. [Google Scholar]
  35. Gostelow, P.; Parsons, S.A.; Stuetz, R.M. Odour Measurements for Sewage Treatment Works. Water Res. 2001, 35, 579–597. [Google Scholar] [CrossRef] [PubMed]
  36. Stuetz, R.M.; Fenner, R.A.; Engin, G. Assessment of Odours from Sewage Treatment Works by an Electronic Nose, H2S Analysis and Olfactometry. Water Res. 1999, 33, 453–461. [Google Scholar] [CrossRef]
  37. Turek, P. Recruiting, Training and Managing a Sensory Panel in Odor Nuisance Testing. PLoS ONE 2021, 16, e0258057. [Google Scholar] [CrossRef] [PubMed]
  38. Capelli, L.; Sironi, S.; Del Rosso, R.; Guillot, J.M. Measuring Odours in the Environment vs. Dispersion Modelling: A Review. Atmos. Environ. 2013, 79, 731–743. [Google Scholar] [CrossRef]
  39. Hayes, J.E.; Stevenson, R.J.; Stuetz, R.M. The Impact of Malodour on Communities: A Review of Assessment Techniques. Sci. Total Environ. 2014, 500–501, 395–407. [Google Scholar] [CrossRef]
  40. Muñoz, R.; Sivret, E.C.; Parcsi, G.; Lebrero, R.; Wang, X.; Suffet, I.H.M.; Stuetz, R.M. Monitoring Techniques for Odour Abatement Assessment. Water Res. 2010, 44, 5129–5149. [Google Scholar] [CrossRef]
  41. Kim, K.H.; Park, S.Y. A Comparative Analysis of Malodor Samples between Direct (Olfactometry) and Indirect (Instrumental) Methods. Atmos. Environ. 2008, 42, 5061–5070. [Google Scholar] [CrossRef]
  42. Dravnieks, A.; Jarke, F. Odor Threshold Measurement by Dynamic Olfactometry: Significant Operational Variables. J. Air Pollut. Control Assoc. 1980, 30, 1284–1289. [Google Scholar] [CrossRef] [Green Version]
  43. Kośmider, J.; Krajewska, B. Determining Temporary Odour Concentration under Field Conditions—Comparison of Methods. Pol. J. Environ. Stud. 2007, 16, 215–225. [Google Scholar]
  44. Jacobson, L.D.; Hetchler, B.P.; Schmidt, D.R.; Nicolai, R.E.; Heber, A.J.; Ni, J.-Q.; Hoff, S.J.; Koziel, J.A.; Zhang, Y.; Beasley, D.B.; et al. Quality Assured Measurements of Animal Building Emissions: Odor Concentrations. J. Air Waste Manag. Assoc. 2008, 58, 806–811. [Google Scholar] [CrossRef] [PubMed] [Green Version]
  45. Tansel, B.; Inanloo, B. Odor Impact Zones around Landfills: Delineation Based on Atmospheric Conditions and Land Use Characteristics. Waste Manag. 2019, 88, 39–47. [Google Scholar] [CrossRef] [PubMed]
  46. EN 13725:2003; Air Quality. Determination of Odour Concentration by Dynamic Olfactometry. Slovenski Inštitut za Standardizacijo: Ljubljana, Slovenia, 2003.
  47. Izabela, S.; Pawnuk, M.; Miller, U.; Grzelka, A.; Wroniszewska, A.; Bezyk, Y. Assessment of the Odour Impact Range of a Selected Agricultural Processing Plant. Sustainability 2020, 12, 7289. [Google Scholar] [CrossRef]
  48. Bliss, P.J.; Schultz, T.J.; Senger, T.; Kaye, R.B. Odour Measurement—Factors Affecting Olfactometry Panel Performance. Water Sci. Technol. 1996, 34, 549–556. [Google Scholar] [CrossRef]
  49. Henry, C.G.; Schulte, D.D.; Hoff, S.J.; Jacobson, L.D.; Parkhurst, A.M. Comparison of Ambient Odor Assessment. Techniques in a Controlled Environment. Trans. ASABE 2011, 54, 1866–1872. [Google Scholar] [CrossRef]
  50. McGinley, M.; McGinley, C. Comparison of Field Olfactometers in a Controlled Chamber Using Hydrogen Sulfide as the Test Odorant. Water Sci. Technol. 2004, 50, 75–82. [Google Scholar] [CrossRef] [Green Version]
  51. Rappert, S.; Müller, R. Odor Compounds in Waste Gas Emissions from Agricultural Operations and Food Industries. Waste Manag. 2005, 25, 887–907. [Google Scholar] [CrossRef]
  52. Szyłak-Szydłowski, M. Odour Samples Degradation During Detention in Tedlar® Bags. Water Air Soil Pollut. 2015, 226, 227. [Google Scholar] [CrossRef] [Green Version]
  53. Szyłak-Szydłowski, M. Comparison of Two Types of Field Olfactometers for Assessing Odours in Laboratory and Field Tests. Chem. Eng. Trans. 2014, 40, 67–72. [Google Scholar] [CrossRef]
  54. Trabue, S.; Scogging, K.; McConnell, L.; Maghirang, R.; Razote, E.; Hatfield, J. Identifying and Tracking Key Odorants from Cattle Feedlots. Atmos. Environ. 2011, 45, 4243–4251. [Google Scholar] [CrossRef]
  55. Zhang, Y.; Ning, X.; Li, Y.; Wang, J.; Cui, H.; Meng, J.; Teng, C.; Wang, G.; Shang, X. Impact Assessment of Odor Nuisance, Health Risk and Variation Originating from the Landfill Surface. Waste Manag. 2021, 126, 771–780. [Google Scholar] [CrossRef]
  56. Lucernoni, F.; Capelli, L.; Sironi, S. Comparison of Different Approaches for the Estimation of Odour Emissions from Landfill Surfaces. Waste Manag. 2016, 63, 345–353. [Google Scholar] [CrossRef] [Green Version]
  57. Zhang, Y.; Yang, W.; Schauberger, G.; Wang, J.; Geng, J.; Wang, G.; Meng, J. Determination of Dose-Response Relationship to Derive Odor Impact Criteria for a Wastewater Treatment Plant. Atmosphere 2021, 12, 371. [Google Scholar] [CrossRef]
  58. Tagliaferri, F.; Invernizzi, M.; Sironi, S.; Capelli, L. Influence of Modelling Choices on the Results of Landfill Odour Dispersion. Detritus 2020, 12, 92–99. [Google Scholar] [CrossRef]
  59. Pawnuk, M.; Sówka, I.; Naddeo, V. The Use of Field Olfactometry in the Odor Assessment of a Selected Mechanical–Biological Municipal Waste Treatment Plant within the Boundaries of the Selected Facility—A Case Study. Sustainability 2023, 15, 7163. [Google Scholar] [CrossRef]
  60. Eyckmans, J.; De Jaeger, S.; Rousseau, S. Hedonic Valuation of Odor Nuisance Using Field Measurements: A Case Study of an Animal Waste Processing Facility in Flanders. Econ. Manag. 2011, 19, 53–75. [Google Scholar] [CrossRef]
  61. Van Langenhove, H.; Van Broeck, G. Applicability of Sniffing Team Observations: Experience of Field Measurements. Water Sci. Technol. 2001, 44, 65–70. [Google Scholar] [CrossRef]
  62. Van Elst, T.; Delva, J. The European Standard Pren 16841-2 (Determination of Odour in Ambient Air by Using Field Inspection: Plume Method): A Review of 20 Years Experience with the Method in Belgium. Chem. Eng. Trans. 2016, 54, 175–180. [Google Scholar] [CrossRef]
  63. Sówka, I. Metody Identyfikacji Odorotwórczych Gazów Emitowanych z Obiektów Przemysłowych. In Prace Naukowe Instytutu Inżynierii Ochrony Środowiska Politechniki Wrocławskiej; Oficyna Wydawnicza Politechniki Wrocławskiej: Wroclaw, Poland, 2011; pp. 1–90. [Google Scholar]
  64. Nicolas, J.; Craffe, F.; Romain, A.C. Estimation of Odor Emission Rate from Landfill Areas Using the Sniffing Team Method. Waste Manag. 2006, 26, 1259–1269. [Google Scholar] [CrossRef] [Green Version]
  65. Lebrero, R.; Bouchy, L.; Stuetz, R.; Munoz, R. Odor Assessment and Management in Wastewater Treatment Plants: A Review. Crit. Rev. Environ. Sci. Technol. 2011, 41, 915–950. [Google Scholar] [CrossRef]
  66. Mazhitov, D.; Ermilova, M.; Altukhova, E.; Maksimova, T.; Zhdanova, O. Development of Technologies and Processes in Environmental Management. E3S Web Conf. 2019, 135, 1–7. [Google Scholar] [CrossRef] [Green Version]
  67. Kośmider, J.; Krajewska, B. Odor Air Quality Standards and Precision of Odor Intensity Assessments. Pol. J. Environ. Stud. 2004, 13, 87. [Google Scholar]
  68. Hansen, M.J.; Jonassen, K.E.N.; Marie, M.; Peter, A.; Adamsen, S.; Feilberg, A. Multivariate Prediction of Odor from Pig Production Based on In-Situ Measurement of Odorants. Atmos. Environ. 2016, 135, 50–58. [Google Scholar] [CrossRef]
  69. Bian, Y.; Gong, H.; Suffet, I.H. The Use of the Odor Profile Method with an “Odor Patrol” Panel to Evaluate an Odor Impacted Site near a Landfill. Atmosphere 2021, 12, 472. [Google Scholar] [CrossRef]
  70. Wiśniewska, M.; Kulig, A.; Lelicińska-Serafin, K. Olfactometric Testing as a Method for Assessing Odour Nuisance of Biogas Plants Processing Municipal Waste. Arch. Environ. Prot. 2020, 46, 60–68. [Google Scholar] [CrossRef]
  71. Wiśniewska, M.; Kulig, A.; Lelicińska-Serafin, K. Odour Emissions of Municipal Waste Biogas Plants-Impact of Technological Factors, Air Temperature and Humidity. Appl. Sci. 2020, 10, 1093. [Google Scholar] [CrossRef] [Green Version]
  72. Wiśniewska, M.; Szyłak-Szydłowski, M. The Air and Sewage Pollutants from Biological Waste Treatment. Processes 2021, 9, 250. [Google Scholar] [CrossRef]
  73. Wiśniewska, M.; Kulig, A.; Lelicińska-Serafin, K. The Use of Chemical Sensors to Monitor Odour Emissions at Municipal Waste Biogas Plants. Appl. Sci. 2021, 11, 3916. [Google Scholar] [CrossRef]
Figure 1. Localization of measurement areas during field measurements at a landfill site.
Sustainability 15 12203 g001
Figure 2. Individual scorecard for the assessment of the odour intensity (evaluator 1, area 4, August) (a); summary scorecard for measurement, performed in August, of odour intensity for control area number 4 (four evaluators, five minutes, four tests per minute) (b).
Sustainability 15 12203 g002
Figure 3. Average values of odour intensity during 5-min tests (I5), and maximum temporary intensity (Ip/5max) measured in August, December, April and June.
Sustainability 15 12203 g003
Table 1. The investigated control areas and meteorological conditions during field measurements.
Control AreaArea NumberMonthMeteorological Conditions
Wind Speed [m/s]Temperature [°C]
Road approaching the sorting facility1August6.716.5
December2.7−5.2
April3.810
June4.721
2August5.916.8
December3.5−5.2
April3.911
June3.421
Location between sorting and the CCCF of mixed municipal solid waste3August6.316.7
December3.2−5.1
April3.910
June421
Location between CCCF and the open composting plant for “green wastes” near the storage of CCCF leachates4August5.317.3
December3.3−5.0
April3.710
June4.021
Open composting plant for “green wastes”5August7.216.7
December3.2−4.9
April3.611
June8.922
6August6.916.9
December2.6−4.9
April3.611
June7.722
7August6.316.7
December2.4−5.0
April3.612
June4.522
Homogenous waste dumping region8August5.516.6
December2.2−4.8
April3.712
June4.222
Landfill site B29August6.616.4
December2.4−4.9
April3.712
June1.123
10August6.516.6
December1.4−4.8
April3.613
June4.622
Landfill site B111August4.516.8
December2.1−4.9
April3.713
June6.222
12August5.216.8
December1.9−4.8
April3.614
June7.423
13August6.416.8
December1.9−4.7
April3.514
June3.823
14August5.517.1
December1.7−4.7
April3.615
June3.823
Road leading to waste deposition, Location B215August5.517.5
December1.6−4.8
April3.615
June5.924
16August4.917.8
December1.4−4.8
April3.715
June5.123
Pumping plant for wastewater and landfill leachates17August4.717.7
December1.2−4.8
April3.515
June4.523
Landfill-gas power station18August4.618.2
December0.8−4.8
April3.715
June8.523
CCCF biological filter19August6.717.5
December0.4−4.6
April3.712
June8.922
Table 2. Odour concentrations calculated for average intensity and maximum temporary intensity in all areas for August, December, April, and June.
Control AreaArea NumberAugustDecemberAprilJune
Odour Concentration (Cod) [ou/m3]
Cod 5Cod p/5 maxCod 5Cod p/5 maxCod 5Cod p/5 maxCod 5Cod p/5 max
Road approaching sorting facility163258111218
23044281225457
Location between sorting and the CCCF of mixed municipal solid waste3980194715343117512156
Location between CCCF and the open composting plant for “green wastes” near the storage of CCCF leachates4641224,320104114,6783107098683227
Open composting plant for “green wastes”514683227219853477123951175
616911759615643468156
7571562341034336709
Homogenous waste dumpin region848384835
Landfill site B19100258232542813
1052470913211117513
Landfill site B21134285347557117510411947248428
12455117572419474551175580709
13106258191428944286161175
14172532272857117511755794
Road around landfill site B21525126725813
1631296156229709191709
Pumping plant for wastewater and landfill leachates177815632129211757691947
Landfill-gas power station18589212179428
CCCF biological filter19785194714425818325870258
Disclaimer/Publisher’s Note: The statements, opinions and data contained in all publications are solely those of the individual author(s) and contributor(s) and not of MDPI and/or the editor(s). MDPI and/or the editor(s) disclaim responsibility for any injury to people or property resulting from any ideas, methods, instructions or products referred to in the content.

