Article

Environmental and Socio-Economic Assessment of Biomass Pellets Biofuel in Hazara Division, Pakistan

1
Department of Forestry and Wildlife Management, University of Haripur, Hattar Road, Haripur City 22620, Pakistan
2
Department for Innovation in Biological, Agri-Food and Forestry Systems (DIBAF), University of Tuscia, 01100 Viterbo, Italy
3
Department of Land, Environment, Agriculture and Forestry, University of Padova, 35020 Legnaro, Italy
4
Department of Chemistry, GPGC for Women, University of Haripur, Hattar Road, Haripur City 22620, Pakistan
5
Department of Biochemistry, Bahria University Medical and Dental College, Karachi 74400, Pakistan
6
Department of Economics, COMSATS University Islamabad (CUI), Lahore Campus, Lahore 54000, Pakistan
7
College of Engineering, IT and Environment, Charles Darwin University, Ellengowan Drive, Casuarina, NT 0810, Australia
*
Author to whom correspondence should be addressed.
Sustainability 2023, 15(15), 12089; https://doi.org/10.3390/su151512089
Submission received: 27 March 2023 / Revised: 22 July 2023 / Accepted: 31 July 2023 / Published: 7 August 2023

Abstract

:
A thorough life cycle assessment (LCA) was conducted to determine whether wood pellets were a viable substitute for non-renewable fuels like oil and gas, especially for heating. To evaluate the properties of wood pellets and their effects on the environment, the study was conducted in the Hazara division of Khyber Pakhtunkhwa, Pakistan. A few factors were investigated, including the carbon and water footprints and the identification of potential growth opportunities in the production of wood pellets. One kilogram of wood pellets served as the analysis reference unit. Raw materials were obtained from sawmills and furniture stores to make the wood pellets. Sawdust, a bio binder, and lubricating oil were used in the production process along with the pelletizer machine. SimaPro 9.2 software was used in the environmental footprint assessment to evaluate several environmental effects, including eutrophication, ozone depletion, abiotic depletion, rusting, human toxicity, and aquatic ecotoxicity. The highest contribution was shown by the wood pellets produced from the softwood sawdust as 149.8558 in marine aquatic ecotoxicity. The study’s findings showed that using lubricating oil during the production of wood pellets significantly affected the overall environmental results. The characterization of wood pellets showed that the Higher heating Values (HHV) resulted from burning wood pellets made from sawdust of Melia azedarach as 24.79 MJ/kg. Softwood mixed species recorded the highest water footprint and damage assessment impact and the highest carbon footprint of 0.186 CO2 e. With a 3.84 × 10⁻⁷ DALY (disability-adjusted life years) measurement, softwood mixed species showed the highest contribution to human health damage among the damage categories. In terms of cost, producing one kilogram of wood pellets from softwood mixed species was priced at 22 PKR, the lowest among the assessed species. The highest cost of 26 PKR was associated with producing wood pellets from Parthenium hysterophorus and Diospyros lotus.

1. Introduction

The feedstock used for wood pellets usually includes low-quality virgin wood, small diameter logs of irregular wood structure, logging, and processing residues. The valorization of such underutilized waste biomass material is gaining interest for various applications. It would be beneficial to search for alternative low-cost raw materials that have not been extensively utilized so far to meet the increasing raw material requirements of the pellet industry, especially given the concurrent high demands of the paper industry and particleboard/fiberboard/pulping industry for the same raw [1]. Energy demand is continually increasing as a result of industrial development and global population growth. Existing power requirements are largely fulfilled by fossil fuels (petroleum, coal, and natural gas), and their prolonged usage, as well as their steadily declining value, constitute a serious threat to environmental sustainability and energy security [2]. Using fossil fuels as a primary energy source in most countries has various adverse environmental impacts, including global warming and air pollution. Air pollution causes several well-being issues and significant social and economic consequences [3]. The most significant human cause of global greenhouse gas emissions is the burning of different fossil fuels, which emit more than 30 billion tons of carbon dioxide (CO2) into the environment each year according to IPCC 2014) [4]. Greenhouse gas emissions are expected to reach 43 billion metric tons by 2040 [5]. According to recent information, a 2 °C rise in worldwide temperature will result in the deaths of 100 million people and the loss of millions of animal and plant species [6]. Eighty % of air pollutants are produced by coal combustion, oil, gasoline, and diesel fuel, which are used primarily for electricity generation, transport, heat, and industry [7]. Reducing the use of fossil fuels is a key challenge in the modern world. This is also important because it is estimated that by 2050, only about fourteen (14%) of proven oil reserves, seventy-two (72%) of proven coal reserves, and eighteen (18%) of proven gas reserves will remain [8]. The shortage of energy sources leads to price increases, a source of economic concerns, particularly in developing countries [9]. The world’s population continues to proliferate, with today’s population twice as large as in 1960 [10]. Solid biomass must be used for energy to achieve a low-carbon future while sustaining economic growth [11]. As a result, several research groups and institutes worldwide have focused heavily on producing renewable and alternative energy resources in recent years [12]. Reducing the use of fossil fuels is consequently a primary objective for climate policy [13].
Solid biomass must be used for energy to achieve a low-carbon future while sustaining economic growth [11]. Three types of green energy are derived from biomass, such as biofuel, biodiesels, and indurate wood pellets made from renewable lignocellulosic raw material derived from Agro-forest biomass [14]. Biomass is a renewable energy resource that, when combined with other renewable energy sources, can eventually help us achieve our goal of being a carbon-neutral society by replacing fossil fuels [15]. Resources of biomass from agricultural, Forestry, and municipal waste are comprised of various components, including woods, agricultural leftovers, sawdust, straw, manure, paper trash, household wastes, and wastewater [16]. Biomass currently contributes roughly 15% of the world’s energy supply as heat, power, and transportation fuels, and it is anticipated that by 2050, biomass could meet up to 33–50% of the world’s current significant energy usage [17]. According to the latest estimates, biomass was reported for 64% of all of the renewable energy use in the EU in 2012. According to the findings of [1], the ash content of wood was 0.24%, while the corresponding value of bark was 5.21%. Furthermore, the mixtures of bark and wood materials exhibited corresponding ash content values, as expected. Bark content and ash content seem to be strongly correlated. Densification temperature seems to be the most critical factor influencing mechanical durability. Densification temperatures up to 100 °C resulted in the lowest radial compression strength values among the tested variables without statistically significant differences between 80 °C and 100 °C. An increase in temperature to 100 °C induced improved bonding, which was evident by the increased radial compression strength of the produced pellets. Nevertheless, further increases at 140 °C and 160 °C did not correspond to an additional increase in radial strength. Most biomass was used in the heating and cooling industry 73%, with 15% and 12% going to transportation and electricity, respectively [18]. One of the most promising opportunities is to use various types of biomasses as a heat source in the form of pellets [19]. Wood pellets are a highly refined type of biofuel [20]. Wood pellets are among the most traded and valuable solid biomass products on the international market [21]. Wood pellets offer many advantages, including high density, calorific value, and low moisture content and being relatively easy to transport and store [22]. The moisture content of biomass pellets ranges between 7–12%, high density of 1100–1500 kg m3, and an energy content of 4.7–5.0 kWh kg−1 [23]. Wood pellets are cheaper than fossil fuels like oil, LPG, and power electric systems, mainly because woody biomass pellets contain more energy than oil [24]. The best production process, which follows the sequence drying-torrefaction-grinding-pelletization, can reduce primary energy consumption and carbon footprint by about 30% compared to conventional pellets. Over the life cycle, transportation contributes the most GHG emissions (>50%), while electricity use, including sawmilling and pellet production, represents the most significant energy consumption (~50%). Life cycle analysis reveals that GHG emissions from the supply chain offset at most 15% of the savings from using BC torrefied wood pellets to replace coal. GHG reductions are most significant when the pellets are used in overseas markets, especially the Asia Pacific region and the EU, rather than domestic Canadian markets. The current carbon taxation level cannot cover the abatement cost of BC pellets; other mechanisms are still needed to support the industry’s sustainable development [25].
Globally, the demand for wood pellets has increased, and Canada has responded by selling enormous amounts of wood pellets to other countries [26]. Pellets have recently become an essential fuel in producing heat and energy across Europe. Pellets are regarded as a competitive fuel [27]. In many countries like Japan, China, Germany, the United Kingdom, and the Netherlands, wood pellets are used for bioenergy power generation. The market price for wood pellets in the United States is around $5 per bag (18 kg or 40 lb.) or 250 dollars per ton. Wood pellets are burned in automatically fed pellet stoves for space heating. Such a stove’s energy efficiency ranges from 70% to 83% [19]. The Life cycle assessment was used to ensure the environmental impacts of wood pellets. LCA has several distinguishing features that allow it to respond to issues that no other assessment tool can. (1) considers the life cycle, (2) addresses a wide range of environmental challenges, (3) is quantitative, and (4) is based on science [28]. Social and economic assessment is one of the significant assessments for biofuel. New job opportunities emerge in biomass cultivation and harvesting, transportation and handling, and plant operation. Bioenergy can also help to secure local and national energy, which may be required to establish new businesses. Bioenergy contributes to all national/regional economic development by increasing corporate income and jobs [29]. Biofuel development could boost the local economy by creating more jobs and improving people’s income [30]. This research study provides a practical solution for managing the overgrowth of Parthenium hysterophorus, a problematic weed in many regions. The research contributes to weed control efforts. The study opens possibilities for developing new industries and job creation related to the cultivation, harvesting, and processing of Parthenium hysterophorus biomass for wood pellet production. This can contribute to local and regional economic growth. Further studies could help overcome the research gap by comparing different types of biomass fuel or renewable energy sources to evaluate their relative advantages and disadvantages. Identifying the specific opportunities and challenges is possible by investigating regional variation in life cycle assessment and socio-economic impacts of wood pellets. Understanding the social impacts of wood pellet production beyond economic aspects is essential. Research gaps exist in exploring issues such as employment opportunities, local community development, land use conflicts, and the cultural implications of large-scale wood pellet production. Examining the social dimensions of wood pellet production can contribute to a more comprehensive assessment of its sustainability. Therefore, the aims and objectives of the current study were to evaluate the environmental and socio-economic impact assessment of wood pellets and to conduct its characterization.

2. Materials and Methods

2.1. Description of Study Area

The current study was carried out in the Hazara division, consisting of Seven districts, Haripur, Abbottabad, Mansehra, Battagram, Torghar, Kolai Palas, and Kohistan, as shown in Figure 1. The Northern Areas, Chilas, Gilgit Baltistan, and Azad Kashmir border the Hazara division in the north and east, respectively. The Islamabad Capital Territory (ICT) and the province of Punjab are to the south, while the rest of KP is to the west. The river Indus runs across the division in a north-south line. The total area of the Hazara division is 18,013 km3. Abbottabad is one the most famous district of the Hazara division in KP province, Pakistan. Abbottabad district falls in the Chir Pine Forests and Moist temperate forests of Pakistan. Some areas also fall in the sub-alpine zone of forest types in Pakistan [28]. The name of district Mansehra is named after Mani Singh, a renowned general under the Mughal Emperor the Great Akbar. The district is famous as a tourist destination because of the Dudipatsar National Park, Saiful Malook national park and the Kaghan and Narran Valley area, and the CPEC route Karakoram Highway going through it. Mansehra is one of the richest districts of Pakistan’s forest and wildlife (flora and fauna) wealth [31]. Tur Ghar is the district in the Hazara division of KP province, Pakistan. It is a rugged topography, high mountainous regions of about 800 km3. It was converted to a district level on 28 January 2011 and named Tur Ghar because, in the past, it was part of the district Mansehra [32]. The lower Kohistan Valley in the north-bounds Battagram district. Siren Valley in the east, the Kunsh and Agrorr Valleys in the south, and the Blackish Mountains and river of Indus in the west [33].

2.2. Climate of the Study Area

Hazara Division is the region that falls under the receivers of maximum rainfall [34]. Annual rainfall in Abbottabad averages around 1200 mm but has reached as high as 1800 mm, while in sections of Mansehra district, such as Balakot, it can reach 1750 mm. The average annual rainfall in Haripur is as low as 845 mm. Battagram, Torghar, Kohistan, and Kolai Palas districts receive average yearly rainfall of 954 mm to 1138 mm, respectively. October to December are the driest months of the Hazara division. During the summer, the maximum temperature in Abbottabad can reach 32 °C, and some areas of district Mansehra reach too. Winter temperatures are extremely low, with January lows of around −20 °C, and some areas of district Mansehra reached −15 °C, much lower in the high highlands (mountains) of Narran [35].

2.3. Design of the Research

The current research was carried out on producing biofuel pellets from forest residues using indigenously developed technology. In favor of this, biomass samples were collected by visiting different study area sites in the Hazara division, such as furniture shops and sawmills. This material will be carried to the University of Haripur laboratory for biomass pellets production. For the sampling, we select eight different trees species and one weed specie, sawdust: Parthenium hysterophorus, Pinus roxburghii, Pinus wallichiana, Black amlok, Albizia lebbeck, Melia azedarach, Quercus dilatata, and Abies pindrow.

2.4. Pelletizer Machine Description

The pelletizer built in this study consisted of a machine case in which all of the machines were fixed. An electronic motor is attached to run the machine consuming electricity at the back side of the pelletizer. The middle of the case pulley is fixed, which is used to give motion to the roller. The motor and pulley relate to a belt, and when the motor is started, the pulley connected to the motor, with the help of the belt, runs the roller, making biomass pellets. The upper part of the pelletizer roller and plate is fixed in a case. When the pelletizer runs, the roller applies force on the raw materials, and the raw material gets compacted, and as a result, biomass pellets come out of the pelletizer.

2.5. Laboratory Work

Different activities were carried out in the laboratory. For pellets production, biomass samples were passed through different laboratory stages such as material crushing, sieving, drying, pelletizing, cooling, packing, etc. In the laboratory, to manufacture biomass pellets biofuel from forest residues using indigenously developed technology to demonstrate that biomass pellets are the best biofuel compared to other fossil fuels like coal, CNG, etc.

2.6. Production Process of Biomass Pellets

2.6.1. Sample Collection

In the current study, biomass pellets were manufactured by using indigenously developed technology. For this, biomass samples were collected by visiting different sites of the study area in the Hazara division, such as furniture shops and sawmills. This material will be carried to the University of Haripur laboratory for biomass pellets production. For the sampling, we select nine different trees and weed species of sawdust. The key stages of biomass pellet manufacture are comprised of the following stages.
The superiority of selected biomass pellets was given based on the most available raw material, as these are used widely throughout the country in sawmills, furniture shops, and home constructions. The investigation was conducted to determine whether it would be feasible to use Parthenium hysterophorus, a common weed, as the source of biomass for making wood pellets.

2.6.2. Grinding

When the raw materials are ready, the first step is to decrease the size of the dry raw materials. The dried raw materials were put into a hammer mill for the grinding process, which will grind them into smaller grids. The well-crushed and uniform material is necessary to produce high-quality pellets.

2.6.3. Screening

The raw materials were sieved after creating chips or sawdust to remove contaminants like stone and metal particles from the dried biomass chips. These contaminants can cause the pellet-forming machine to fail mechanically. Therefore, if the raw material in your pellet factory has the potential to be contaminated by these solid particles, sieving the raw materials before feeding them into the pellet-forming machine is required. The initial sieving machine is typically a de-stoner or magnetic separator.

2.6.4. Additives

Sporadically a binding agent bio binder, lubricating oil, and water were mixed with the samples to develop the quality of pellets. Herein situation, Bark was used as a bio-binder agent.

2.6.5. Pelleting

The usual biomass pellet production process consists of six (6) steps, drying, pretreatment, comminution, pelletization, cooling, and storing. Before the mixture of materials is put into the pelletizer machine, pretreatment is first performed to remove and sift soil, sandstones, and different metals from the raw material, containing raw material downsizing in the case of wood trunk or branch. Second, drying raw material such as collected sawdust in a rotary drum drier machine decreases the moisture content from 30–40% to 10%. Third, the raw material (sawdust, binder, water, etc.) is pulverized in a hammer mill machine, and wood flour is separated in a cyclone. Fourth, the pelletization, a density operation, is carried out with a rolling press of the pelletizer machine and a die block. Fifth, cooling of freshly developed pellets is necessary because it boosts the strength of wood pellets and reduces dust production during transportation and handling. A flow cooler lowers the temperature before the pellets are placed into bags. The biomass raw materials will attain the requisite size and moisture content for biomass pellet biofuel manufacturing after grinding. As a result, the raw materials were pelletized into biomass pellets in this step. Pelletizer is the name of the machine that converts raw materials into biomass pellets. Before going to the dies, raw materials must be processed with water and other additives in a mixing chamber to sort the soft and hot materials. Pelletizers are divided into two main types: ring die Pelletizers and flat die Pelletizers. Ring die pelletizers have a capacity of more than one (1) ton per hour and are used in big pellet plants, while flat die pelletizers have a potential of around 500 kg per hour and are used in micro pellet plants.

2.6.6. Cooling

After pelletization, place the biomass pellets in a climate-controlled chamber with a humidity of 65% and a temperature of 22.2 °C for further quality assessments [36]. Cooling not only transports moisture formed by heated pellets during the densification stage, but it also improves these biomass pellets’ endurance and storage stability. The most generally used cooling equipment is based on the use of countercurrent airflow in the pellet flow. After the pellets are shaped, the temperature can reach some time 150 °C, which cannot be used, depending on the conditions, whether dehydrated and conditioned raw materials are employed. The temperature is usually maintained between 60 and 90 °C.

2.7. Samples Characterization

2.7.1. Determination of Moisture Percentage

The moisture % was calculated using a laboratory electric oven and precision balance on a standard of (ASTM.D1762) [37]. A moisture tester is also used to determine the moisture content. For pellets production, the percentage of the sample is (<15%).
The percentage of moisture content was determined by using a formula.
Moisture % = [(A − B)/A] × 100
where, A = Air dried sample, B = Oven dried. Sample at 105 °C ± 1.

2.7.2. Calculation of Pellets Dimension

The pellets’ dimensions were determined using instruments; vernier caliper and scale. Randomly 15 pellets were selected from each sample to determine the average length and diameter. Each pellet has an equal diameter but a different length, and all the pellets are cylindrical in shape.

2.7.3. Calculation of Pellets Ash Content

The first step is to crush some biomass pellets using the machine Willy mill, and 20 g samples are received. Preparing 20 g samples with a Willy mill machine time taken to 5 min for each sample. These samples are oven dried at 105 °C ± 1 for 45 min, and the oven-dried weight of each sample is noted. Afterward noted oven-dried weight, we found the gram of residues. The samples were placed in the muffle furnace through the porcelain crucible for a period of 25 min at the temperature of 450 ± 5 °C to the standard of (TAPPI T211 om-85) [38]. After 50 min, the samples are extracted from the muffle furnace, and these samples are cooled for 45 min. Then weighted, the samples residues and obtained weights of residues are put to the given formula
Ash% = (D/Wᴏ) × 100
where, D = oven-dried weight of sample, wᴏ = Grams of residues

2.7.4. Bulk Density

The oven-dry weight of the sample was divided by the volume of the sample to determine bulk density.
The volume was calculated using the formula
V = L × πr²
where L = average length of sample, π = 22/7, r (radius) = d/2, d = average diameter of samples.
The diameter and length of biomass pellets were measured by scale and vernier caliper.
ρ = w
where, ρ = bulk density (g/cm3) wᴏ = oven dray weight and v = volume of pellets.

2.7.5. Calorific Value

High Calorific values (HCV) and (HHV) were obtained by using a calorimeter or through different formulas (Such as Vandralek and Dulong’s formulas), While Low Calorific value (LCV) was obtained through (Direct formula) given below.
Biomass pellets’ calorific value is determined by using two different formulas.

2.7.6. Delong’s Formula

HHV = 4.18 × (78.4 × C + 241.3 × H +22.1 × S).
C represents carbon percent, H represents hydrogen percent, and S represents Sulfur percent.

2.7.7. Vendralek Formula

HHV = 4.18 × [85 × C + 270 × H + 26 × (S − O)]
where C represents carbon percent, H represents hydrogen percent, and S represents Sulfur percent.
Low heating value (LHV) can be obtained through the given formula.
LHV = HHV − 2.447 {H percentage/100}9.001
And another direct formula is used for measuring low heating value, i.e.,
LHV = 4.18 × (94.14 × C − 0.5501 − 52.14 × H)

2.7.8. Elemental Analysis

Major elements are investigated in biomass pellets through elemental analysis. The values of major elements like C, H, O, and S are found carried out in samples through SEM (scanning electron microscope, JSM-IT100) at the National Centre of Excellence in Geology, Peshawar University.

2.8. Socio-Economic Analysis of Biomass Pellets Biofuel

The Socioeconomic analysis of biomass pellets was considered through a questionnaire-based survey from the local communities, households, bakery-making factories, tandoori oven shops, furniture shops, wood sellers and sawmills, etc., in the study area. The data were collected from 100 respondents in the selected districts. Different questions were asked during the survey from the respondents, including items such as a source of biofuel, quantity of biofuel consumption, they know pellets and their use, pellets burn easily and their burning duration, the heating values of pellets, the pellets release smoke or smokeless during the burning, how much ash produced by pellets after burning and any health cause during the burning process of pellets, etc. While the sawdust, lubricating oil, bio binder, electricity, and transportation were all addressed in the economic analysis for 1 kg of biomass pellets produced.

2.9. Life Cycle Assessment (LCA)

A comprehensive Life cycle assessment (LCA) study investigates the prospective environmental implications of a product or system throughout its life cycle from the cradle to the grave, from raw materials procurement to manufacture, usage, and discarding [39]. The LCA typically includes the following steps (1) aim and scope definition, (2) life cycle inventory (LCI), (3) life cycle impact assessment (LCIA), and the last (4) results interpretation [40].

2.10. System Boundary

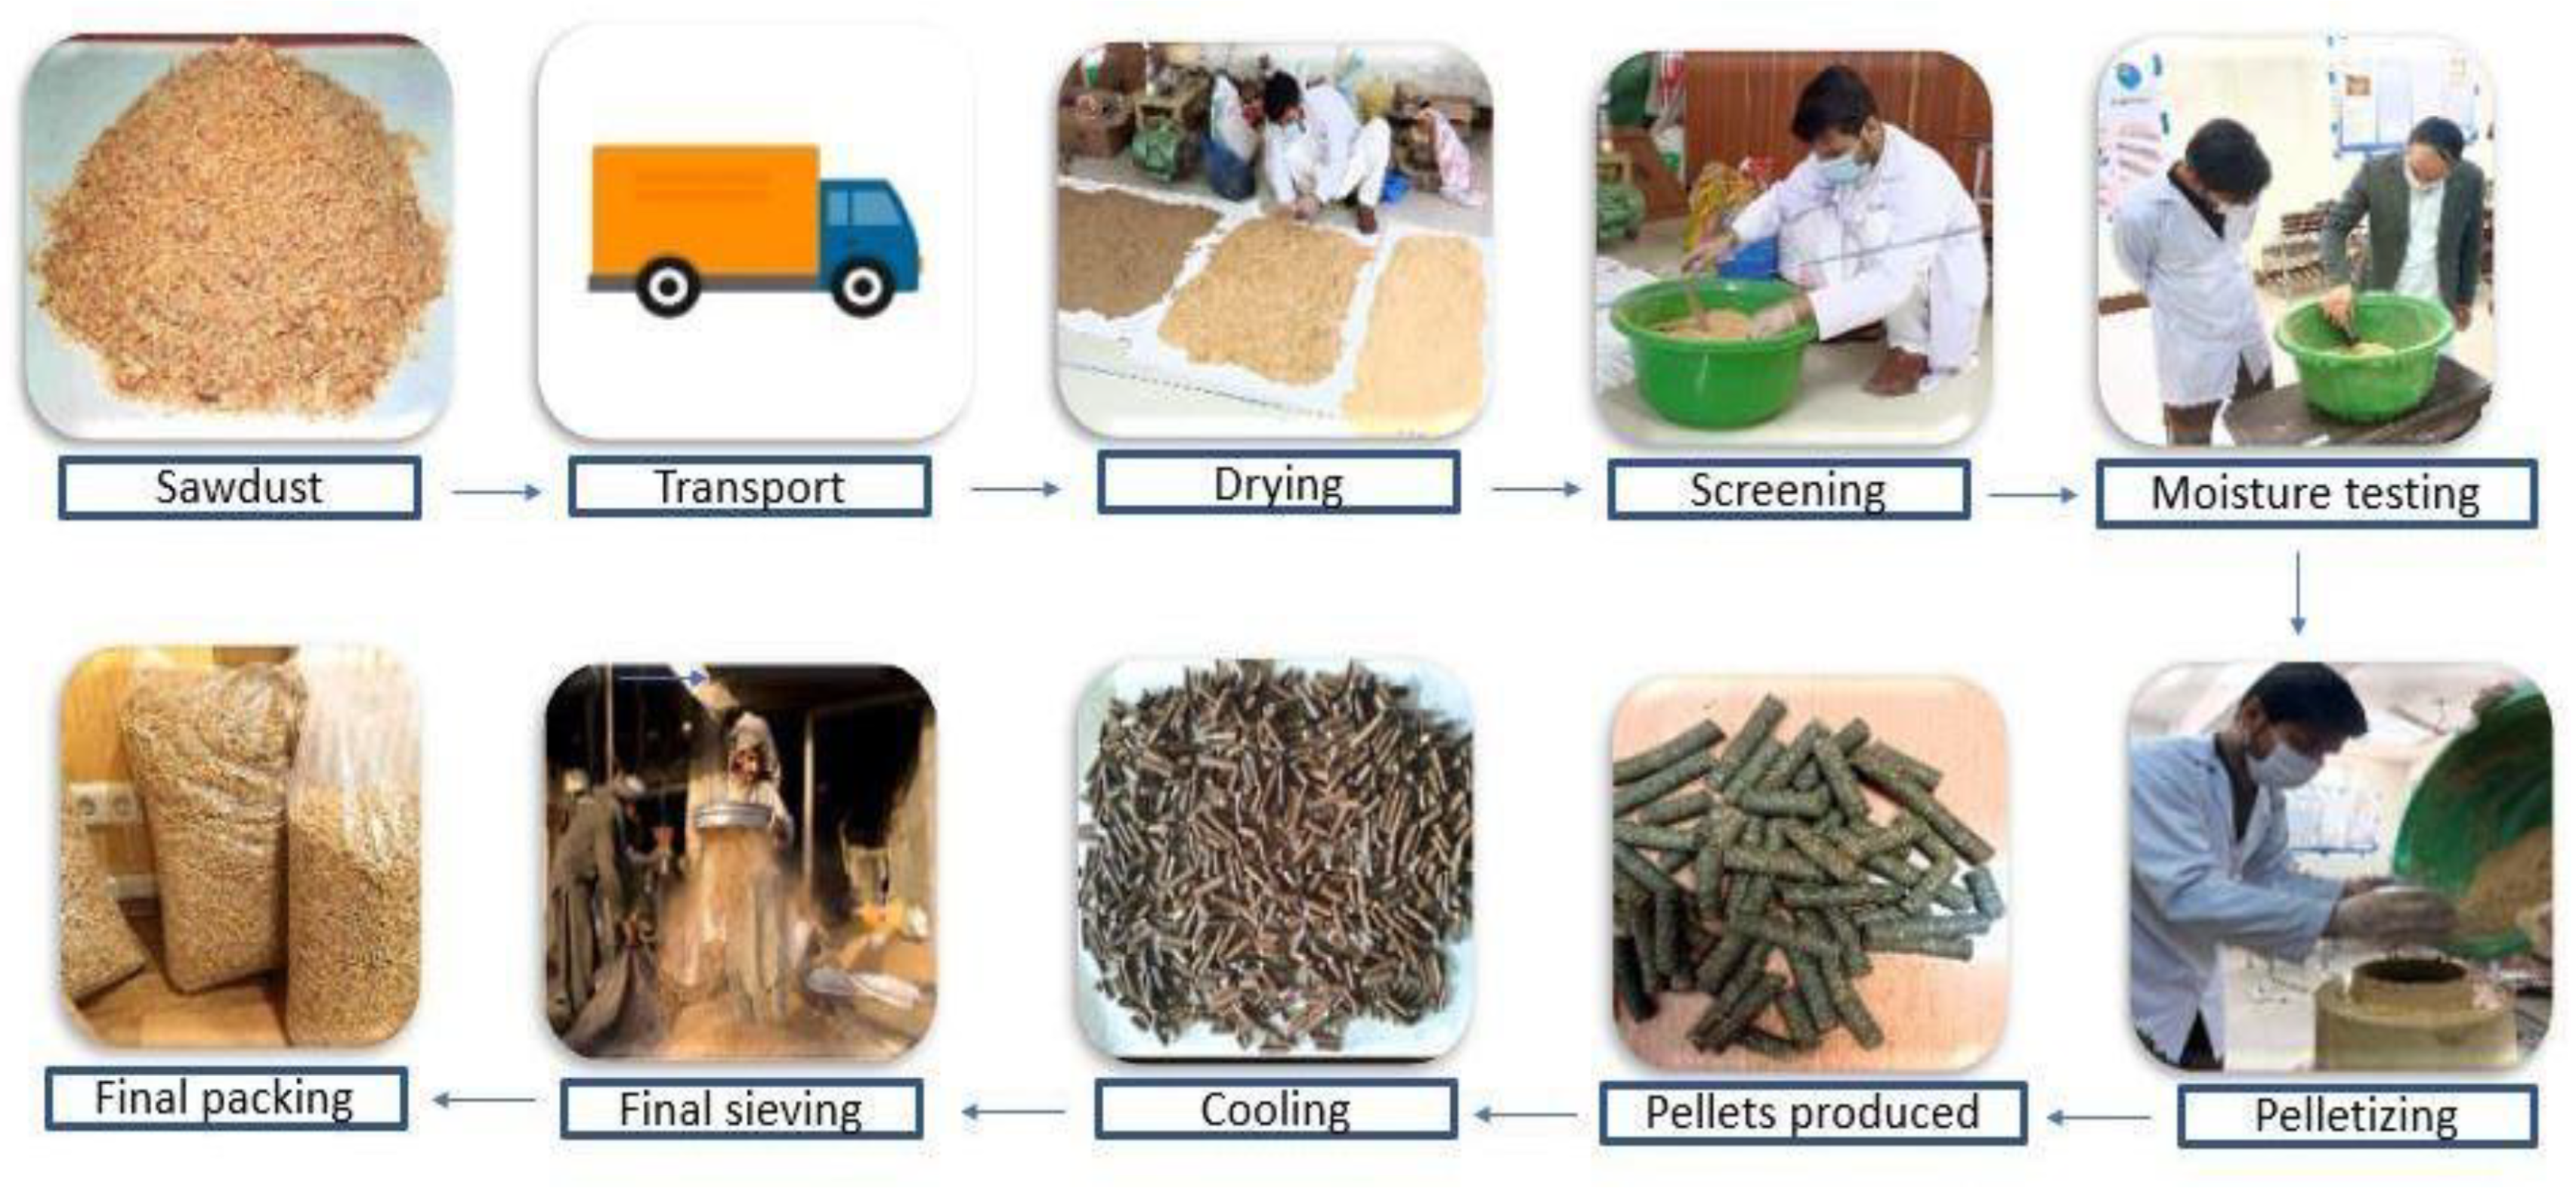
The processes included in the research were determined through the system boundary (ISO, I., 2006) [41]. Therefore, a current review, the system boundaries of all case studies include the pellet manufacturing stage, which typically consists of the following steps: feedstock transportation, chipping, screening, grinding, drying, pelleting, cooling, and packaging, and pellet distribution to final consumers [42]. The system boundary is described in Figure 2.

3. Results and Discussion

3.1. Life Cycle Inventory (Lci) of Biomass Pellets

Background information of various inputs consumed in one kg of biomass pellets produced from different selected species, i.e., Abies pindrow, Pinus roxburghii, Pinus wallichiana, Quercus dilatata, Melia azedarach, Diospyros Lotus, Albizia lebbeck, Parthenium hysterophorus and softwood (mixed) in Hazara division of KP during 2021–2022 are presented in Table 1.

3.2. Wood Pellets Diameter and Length

Due to the ring die of the pelletizer machine, the diameter (10.3 mm) of biomass pellets was the same for all nine species. Because all of the holes in the ring of the pelletizer had the same diameter, the diameter of all biomass pellets was uniform. The length was determined for nine different biomass pellets obtained from other species. The length of biomass pellets was different, where is highest length was (43.9 mm) obtained for Pinus roxburghii specie and (4.3 mm) for Diospyros lotus species, while the shortest length was determined (27.6 mm) for softwood mix species as mentioned in Table 2. The diameter of the wood pellets was considered the same for all the specie at 10.3 because of the same size of holes in the pelletizer, while the length of the wood pellets was obtained by selecting the random pellets and measuring through the vernier caliper.

3.3. Moisture Content, Ash Content, and Bulk Density

The moisture level of the biomass pellets was within the limit specified in the literature and in different research papers, which was twelve (12) percent, but in various studies, it was cited to be around 15 percent. The moisture content of all species ranges between 12 and 15%. Water was also included in sawdust during the manufacturing of wood pellets. After pellet manufacture, the moisture content was evaluated by weighing the biomass pellets and heating them in an oven as specified in ASTMD1762-84 [37]. After the heating, we weighed the biomass pellets again to determine the final moisture content of biomass pellets from various species, which was 5.14% for Parthenium hysterophorus and Pinus wallichiana, 5.29% for Quercus dilatata, 9.97% for Pinus roxburghii, 7.94% for Abies pindrow, 8.76% for Melia azedarach, 9.01% for Diospyros Lotus, 7.36 for Albizia lebbeck and 7.22 for softwood mix species. Ash content was determined for nine different biomass pellets obtained from other species, in which the highest ash content was recorded at 7% in Pinus wallichiana, lagged by Quercus dilatata with 4.99%, and the lowest ash content was recorded at 0.36% for Pinus roxburghii and 0.98% for Albizia lebbeck. The bulk density of biomass pellets was 650, 680, 810, 500, 930, 710, 640, 720, and 700 kg/m3 for Parthenium hysterophorus, Pinus wallichiana, Quercus dilatata, Pinus roxburghii, Abies pindrow, Melia azedarach, Diospyros Lotus, Albizia lebbeck and Softwood mix respectively. The Italian standard recommended bulk density was (620–720 kg/m3). The bulk density of 930 kg/m3 for Abies pindrow pellets, followed by Quercus dilatata pellets at 810 kg/m3, was higher than the Italian recommended bulk density range. In contrast, the bulk density for Pinus roxburghii pellets was 500 kg/m3, which was lower than the Italian recommended bulk density range, as mentioned in Table 3. The formula Ash% = (D/Wᴏ) × 100 was used to get the results for ash content given in the table below.

3.4. High Heating Value and Low Heating Values

The highest heating value among all nine species was for Melia azedarach wood pellets (24.79 MJ/kg), followed by Softwood mix and Pinus wallichiana biomass pellets with 23.84 and 23.39 MJ/kg, respectively. The HHV suggested by the Italian standard CTI˗R04/05 is ≥16.91 MJ/kg [37]. The low heating values among all eight species were recorded lowest (20.24 MJ/kg) in Abies pindrow, followed by Parthenium hysterophorus and Albizia lebbeck with values of 20.26 and 20.80 MJ/kg as documented in Table 4. The HHV and LHV were obtained by using Delong’s formula: HHV = 4.18 × (78.4 × C + 241.3 × H +22.1 × S) for HHV and direct formula: LHV = 4.18 × (94.14 × C − 0.5501 − 52.14 × H) for LHV.

3.5. Nitrogen and Sulfur Content

Wood pellets made from sawdust from eight different species had high nitrogen content, 1.20% in Pinus wallichiana, followed by Parthenium hysterophorus 1.03, and the lowest percentage of nitrogen was recorded at 0.49 in Pinus roxburghii. The Sulfur content was detected in only two species, 0.05% in Albizia lebbeck and 0.03% in Parthenium hysterophorus, while in seven pellets species, the Sulfur was not detected, as shown in Table 5. The results of this table were obtained by using the electron microscope.

3.6. Environmental Impact Assessment of Biomass Pellets from Different Species

Environmental impact assessment results were obtained using the methodology of CML 2 Baseline 2000 V2.05. Among the environmental impact categories, marine aquatic ecotoxicity was the major contributor to the environment, followed by human toxicity, freshwater aquatic ecotoxicity, and abiotic depletion, respectively. The highest contribution to the above-mentioned environmental impact categories was from Softwood mixed species, while the lowest was from Quercus dilatata pellets, as shown in Table 6.

3.7. Cumulative Energy Demand (CED) of Biomass Pellets from Different Selected Species

Methodology installed by default in the software Cumulative Energy Demand V1.11 provided the results of CED. The results showed that the highest contribution of non-renewable fossils in the making of biomass pellets is (5.1648 MJ) in softwood mix species. In comparison, the lowest contribution is (4.9711 MJ) in Quercus dilatata, the highest role of non-renewable biomass in the production of wood pellets is (0.0018 MJ) in softwood mix specie, (0.0071 MJ) was recorded in two species Pinus roxburghii and Abies pindrow. In comparison, the lowest value (0.0016 MJ) was recorded in the other six species (Albizia lebbeck, Diospyros lotus, Melia azedarach, Parthenium, Pinus wallichiana, and Quercus dilatata). In comparison, the highest contribution of renewable biomass fossil in the production of wood pellets was (24.1862 MJ) in softwood mix specie. In comparison, the lowest contribution was (20.9852 MJ) in Quercus dilatata, and the highest contribution of renewable water in the production of wood pellets was (0.0035 MJ) in Parthenium specie. In comparison, the lowest contribution was (0.0005 MJ) in Quercus dilatata and Abies pindrow, as shown in Table 7.

3.8. Carbon Footprint of Biomass Pellets from Different Species

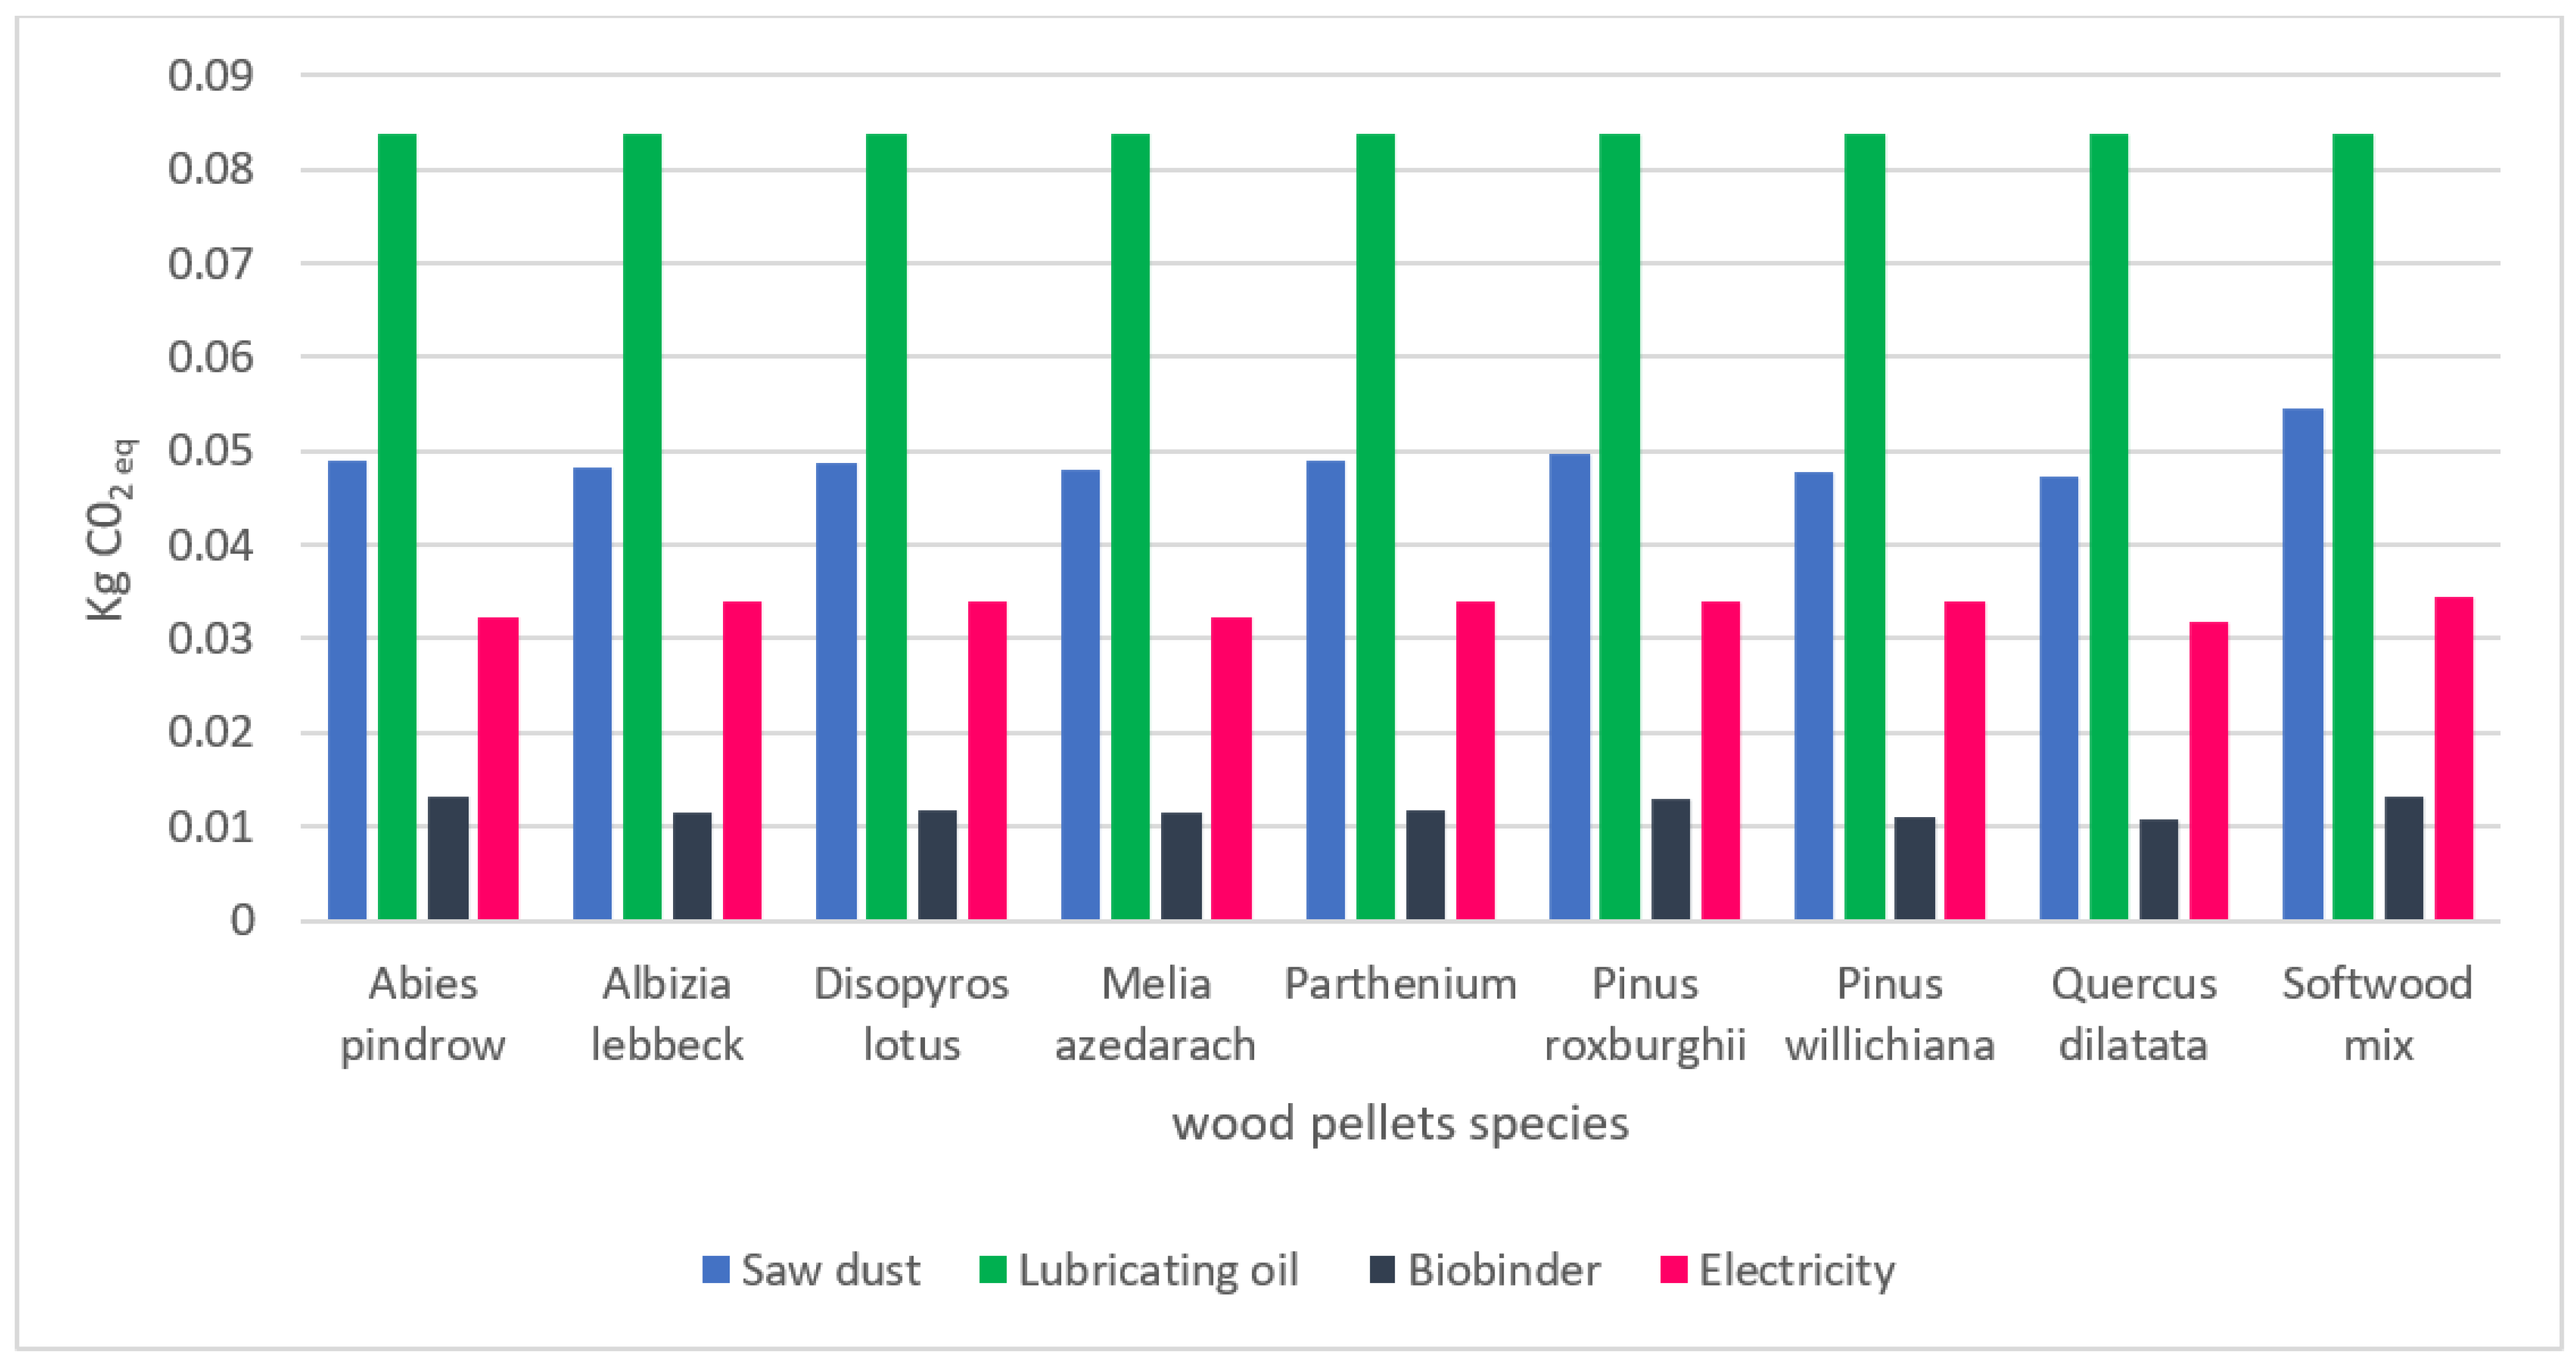
The present study indicates the highest carbon footprint (0.186 CO2 e) for Softwood mixed species, while the lowest carbon footprint was recorded (0.173 CO2 e) for Quercus dilatata. The results showed that the highest contribution of sawdust in the carbon footprint during the production of one kg wood pellets was (0.0546 kg CO2 eq) in softwood mix species, while the lowest was (0.0473 kg CO2 eq) in Quercus dilatata. The contribution of the lubricating oil in the carbon footprint is almost similar (0.0839 kg CO2 eq) in all species. The contribution of bio binder in carbon footprint was higher in (0.01307 kg CO2 eq) softwood mix and Abies pindrow species. In contrast, the lowest contribution was (0.0107 kg CO2 eq) in Quercus dilatata, as mentioned in Figure 3.

3.9. Water Footprint of Biomass Pellets from Different Selected Species

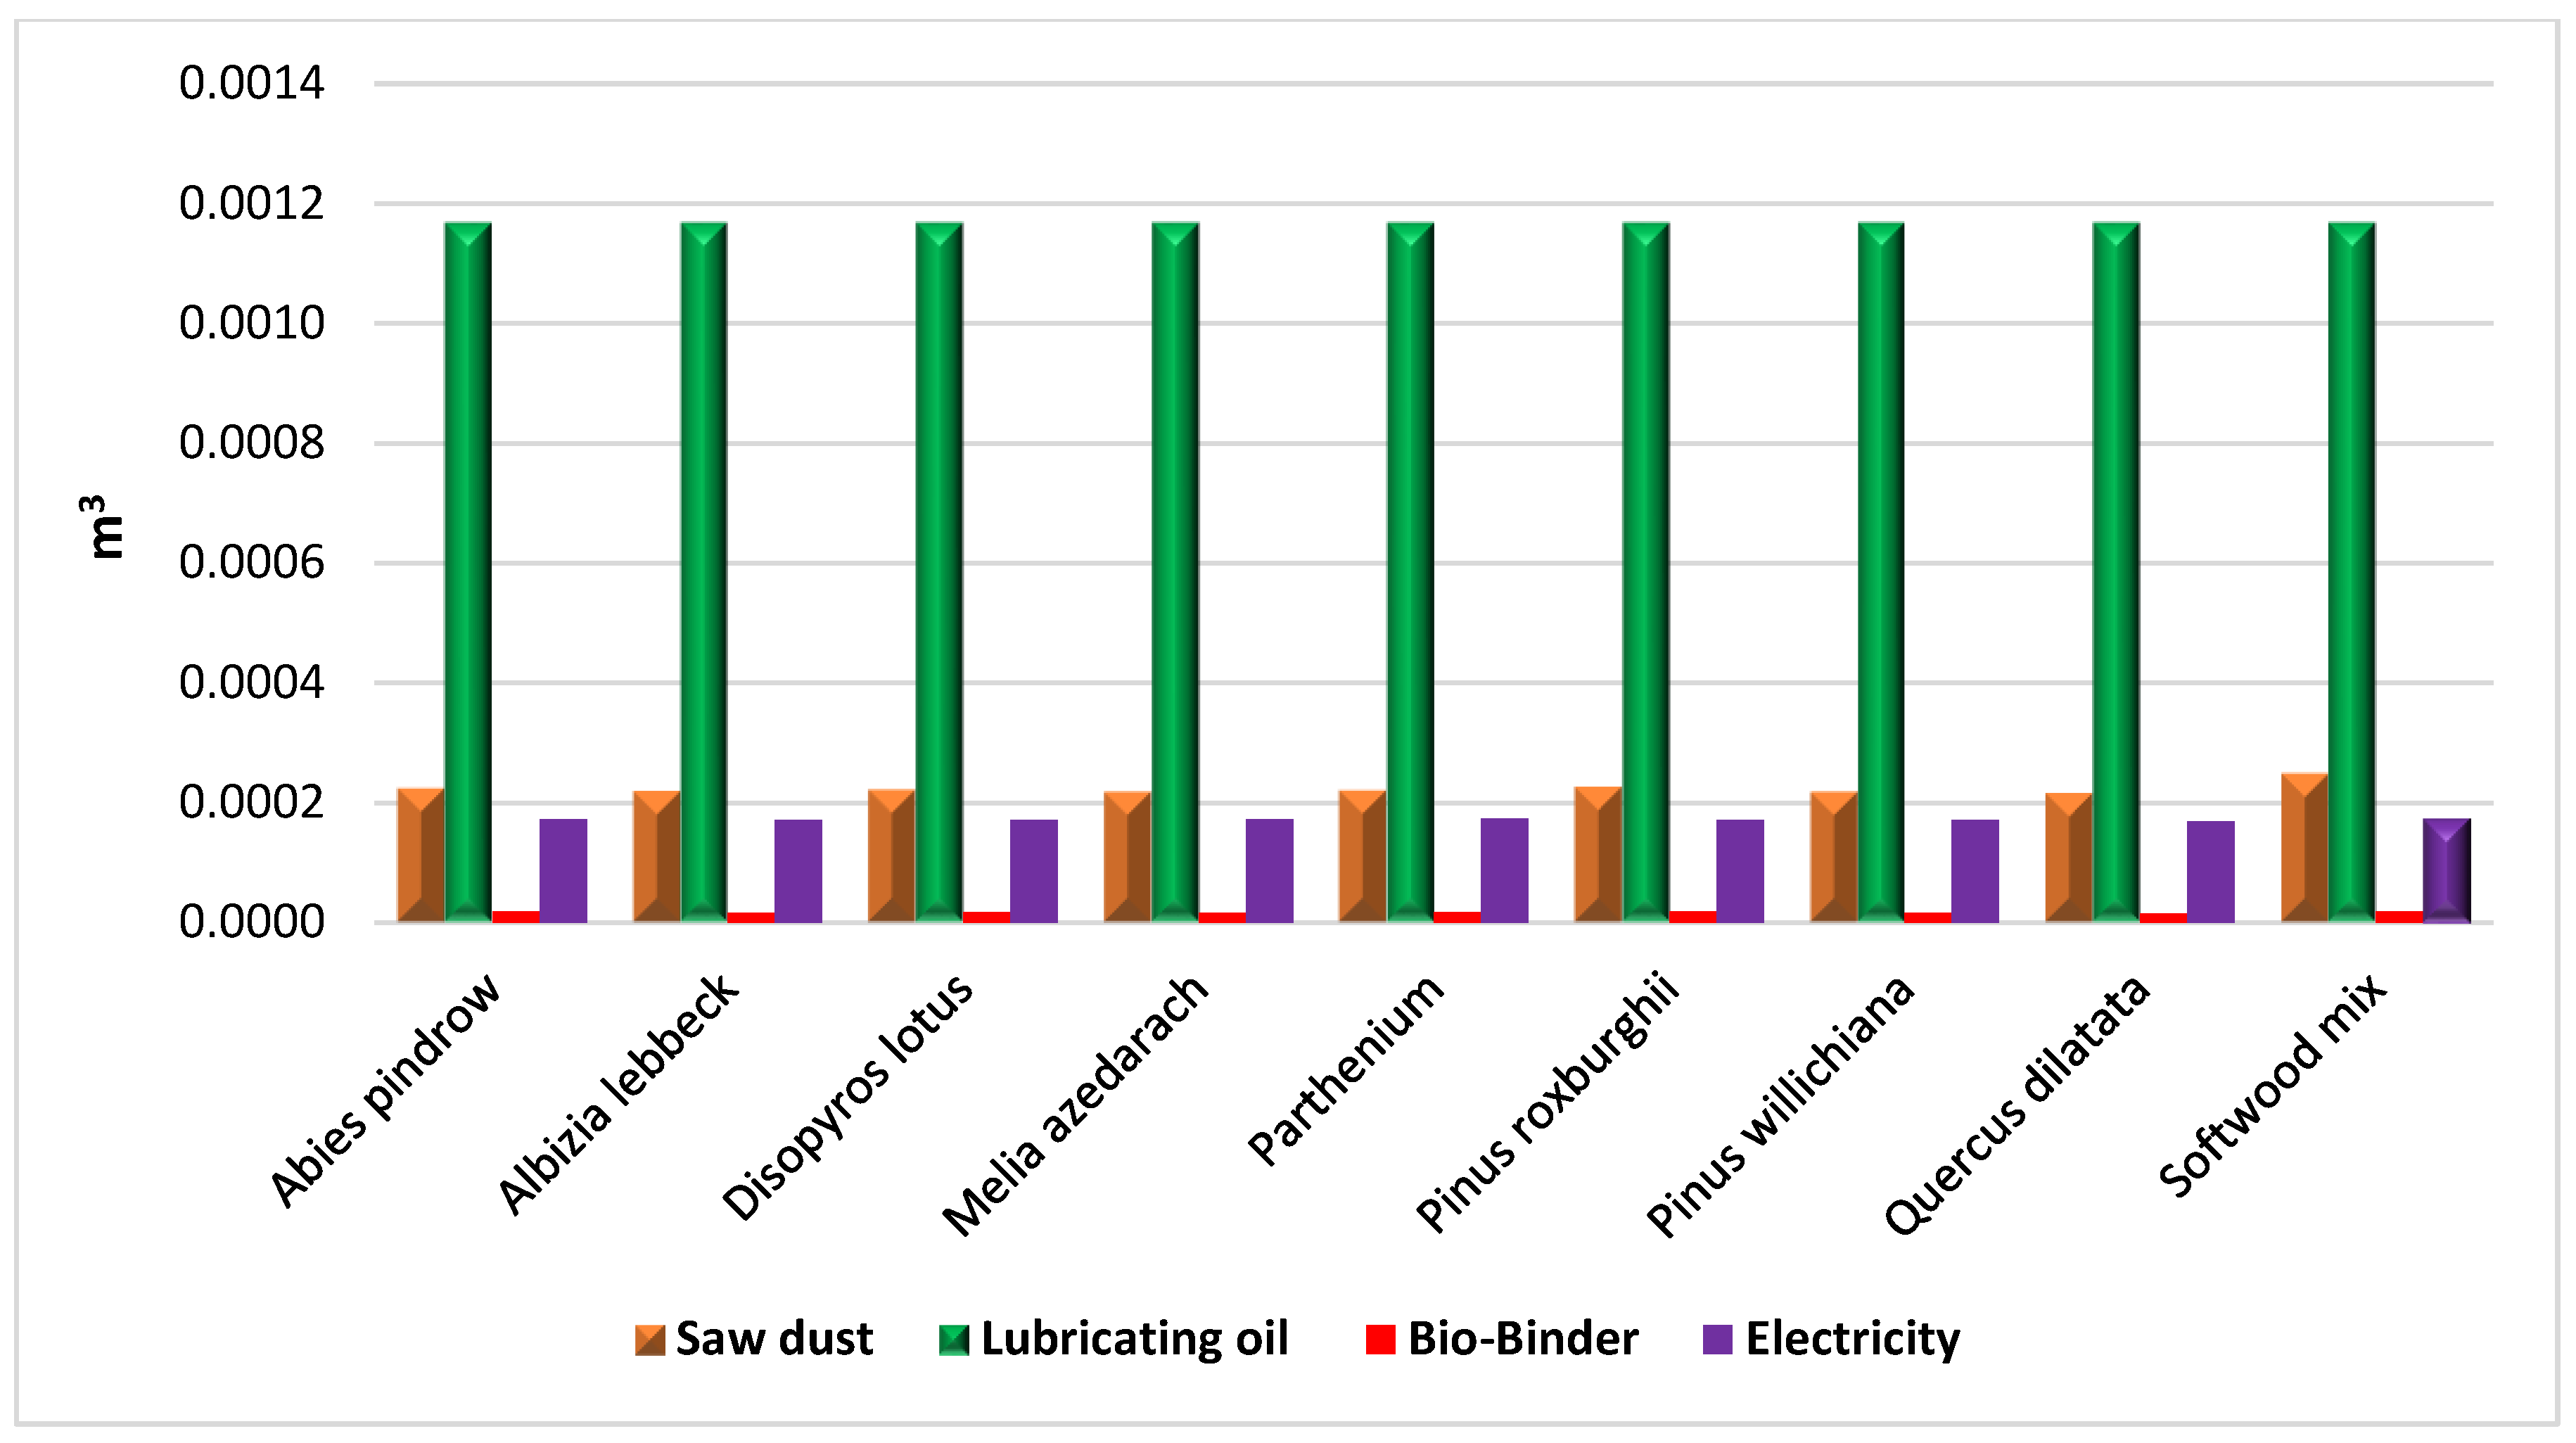
The highest water footprint was recorded for Softwood mixed species. In comparison, the lowest water footprint was recorded (0.001566 m3) for Quercus dilatata and Albizia lebbeck (0.001573 m3). The contribution of sawdust in water footprint was recorded highest (0.000248 m3) in Softwood mixed, while Quercus dilatata has the least contribution in water footprint (0.000215 m3) followed by Pinus wallichiana (0.000217 m3). The contribution of lubricating oil was 0.00116 for all the species (Abies pindrow, Albizia lebbeck, Diospyros lotus, Melia azedarach, Parthenium, Pinus roxburghii, Pinus wallichiana, Quercus dilatata, and Softwood mix). Bio binder of softwood mix and Abies pindrow showed the highest contribution of (1.89 × 10⁻⁵ m3), While Quercus dilatata showed the lowest contribution as 1.56 × 10⁻⁵. Softwood mix and Parthenium consumed the highest amount of electricity (0.000174), while the least electricity was consumed by Quercus dilatata (0.000169 m3), as detected in Figure 4.

3.10. Ecological Footprint of Biomass Pellets from Different Species

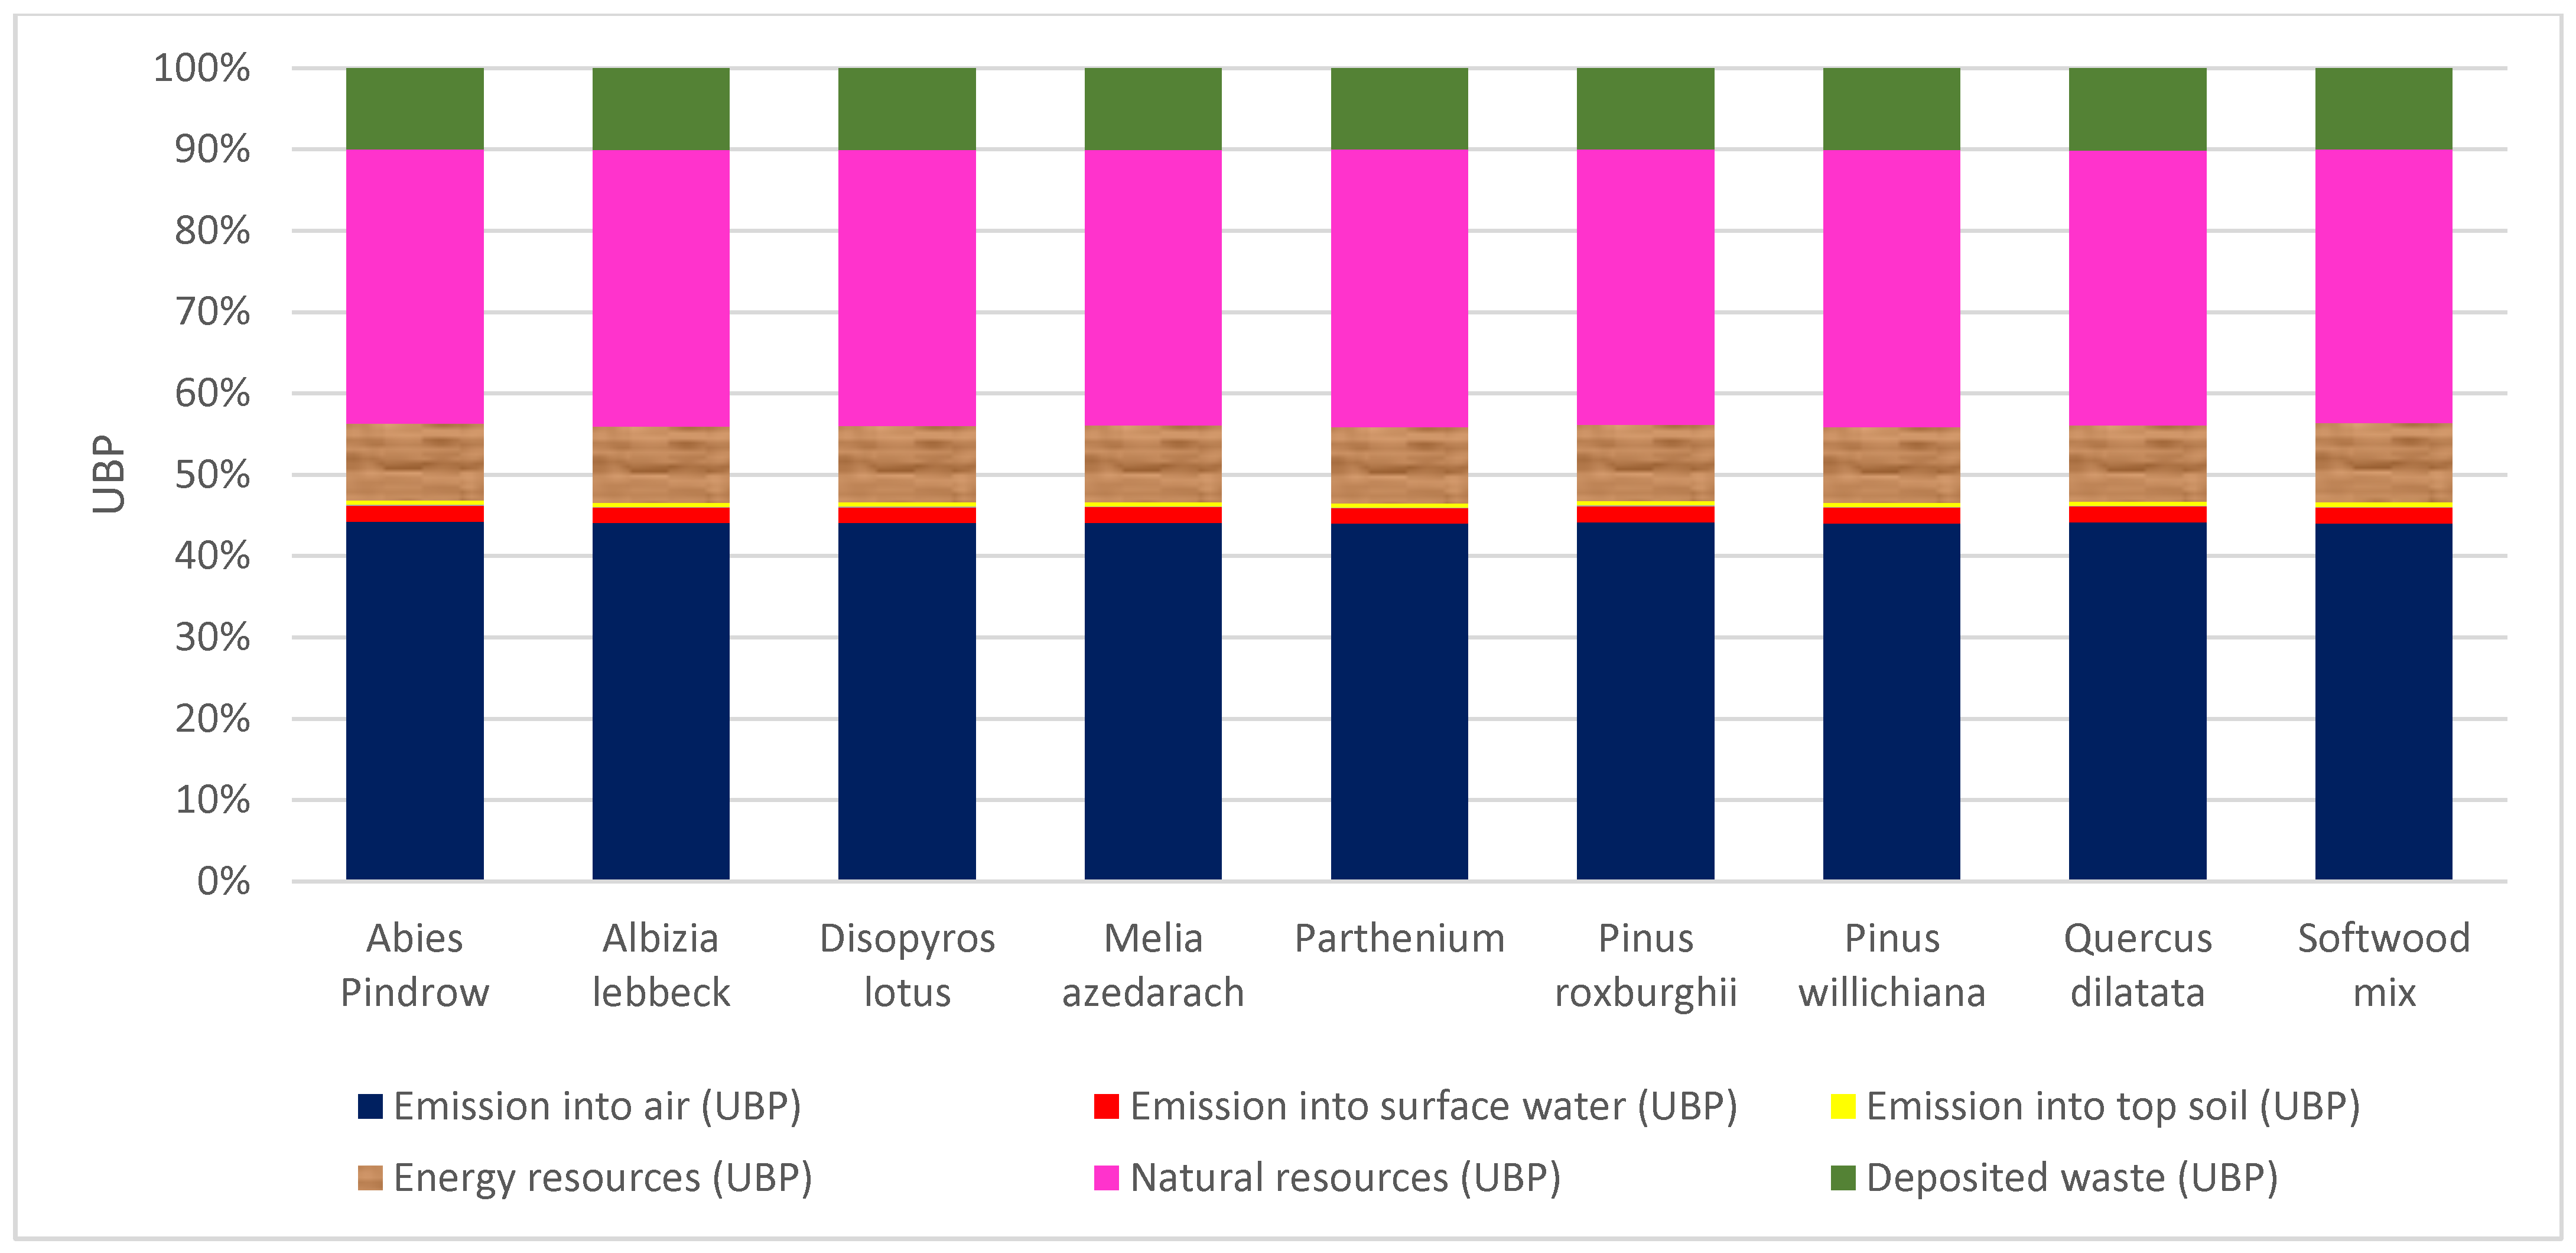
The emission into air impact category was higher (196.3403 UBP) in softwood mix species, while the lowest contributor was Quercus dilatata (185.5338 UBP), and it was the highest impact category in all seven categories, the contribution of softwood mix species was higher (8.6314 UBP) in emission into surface water impact category, while the lowest contributor was Pinus wallichiana (8.1773 UBP). The highest contribution of emission into the groundwater impact category in the production of one kg wood pellets was (0.4377 UBP) in the softwood mix specie. In contrast, the lowest contribution was (0.3861 UBP) in Quercus dilatata. It was the lowest impact category in all categories and likely to be negligible, while in the emission into soil impact category, the highest contribution was (2.3597 UBP) in softwood mix species. In contrast, the contribution was (2.1487 UBP) in Quercus dilatata. In the energy resources impact category, the highest contribution was (43.5781 UBP) in the softwood mix, while the lowest impact was (39.4625 UBP) in Quercus dilatata. Natural resources were the second maximum contributor in all seven impact categories, in which the highest contribution was (150.0489 UBP) in the softwood mix. In contrast, the lowest contribution was (142.1543 UBP) in Quercus dilatata. The third highest contributor in all impacts categories was the deposited waste category, in which the highest contribution was (44.3390 UBP) in softwood mix, while the lowest was recorded (42.3688 UBP) in Quercus dilatata, as shown in Figure 5.

3.11. Various Environmental Impacts Determined through Eco-Indicator (Ei) of Biomass Pellets from Different Species

Among the various environmental impact categories determined through Eco-indicator, All the impact categories Carcinogens, Respiratory Organics, Respiratory inorganics, Climate change, Radiation, Ozone layer, Ecotoxicity, Acidification, Land use, Minerals, and Fossil fuels were recorded higher in Softwood mixed species followed by Pinus roxburghii. In contrast, the lowest contribution was recorded in Quercus dilatata, followed by Melia azedarach, as shown in Table 8. The methodology of Eco-indicator 99 (E) V2.10/Europe EI 99 E/A was used to get the results in the table below.

3.12. Damage Assessment of Biomass Pellets from Different Species

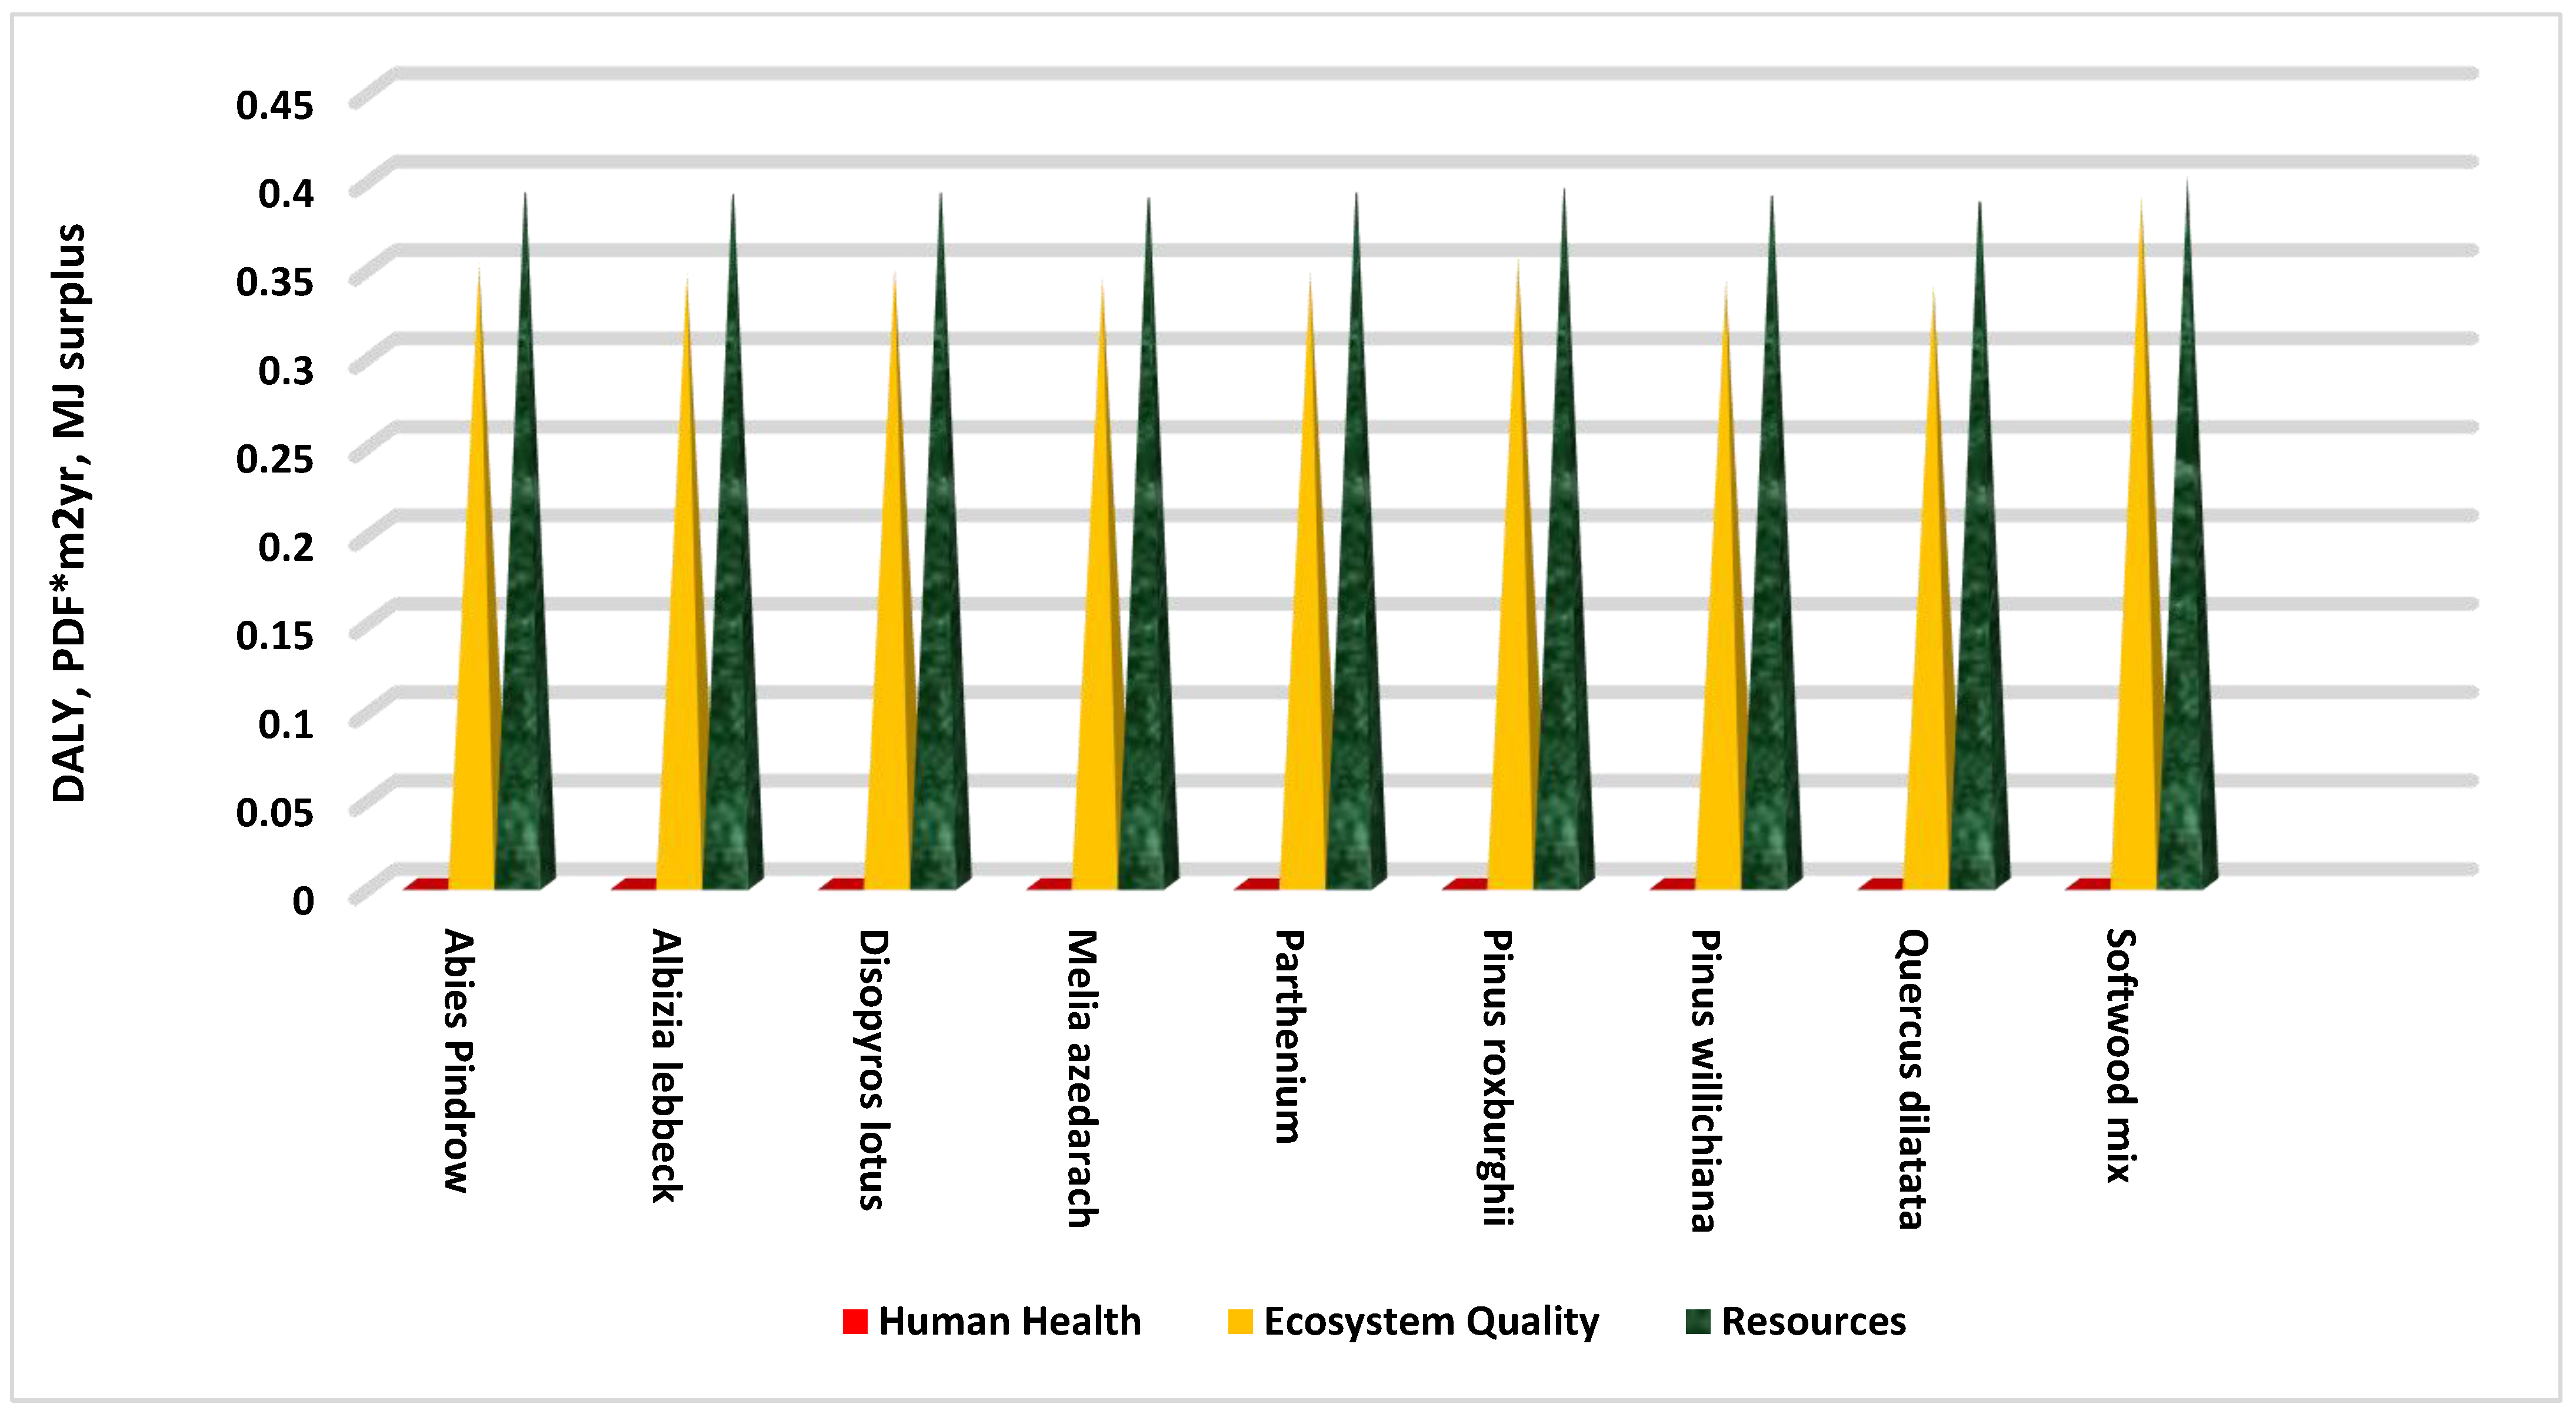
All of the pellets produced from the nine different species posed essentially no risk to human health. The highest contribution of damage to human health was recorded (3.84 × 10⁻⁷ DALY) in Softwood mix, while the lowest was recorded (3.59 × 10⁻⁷ DALY) in Quercus dilatata. Damage to ecosystem quality was highest (0.3894 PDF*m2yr) in Softwood mix species, while the lowest was recorded (0.3386 PDF*m2yr) in Quercus dilatata. The damage to resources was maximum (0.4005 MJ surplus) in pellets from softwood mix species sawdust and Pinus roxburghii (0.3935 MJ surplus). In comparison, the lowest was (0.3857 MJ surplus) in Quercus dilatata, as mentioned in Figure 6.

3.13. Social Analysis of Biomass Pellets

The biomass pellets were given to more than (100) respondents to get their perceptions about the pellets. Five percent of respondents already knew about biomass pellets, while 95% of respondents were unknown about the biomass pellets. 86% of respondents had positive comments about the easy burning of biomass pellets, whereas 14% of respondents had negative comments about the easy burning of biomass pellets. 82% of respondents had positive perceptions about the better heating value of biomass pellets, while 18% of respondents had negative perceptions about better heating value. 25% of respondents said that biomass pellets produced smoke, while 75% of respondents said that the biomass pellets didn’t make the smoke. 20% of respondents faced eye irritation while burning biomass pellets, whereas 80% didn’t face any health-related issues. 90% of respondents said about the high heating duration/heating durability of biomass pellets, while 10% of respondents said about the low heating duration/heating durability of biomass pellets. 12% of respondents stated that more ash was produced after biomass pellets were burnt, whereas 88% of respondents stated that less ash was produced after burning biomass pellets, as shown in Figure 7.

3.14. Economic Analysis of Biomass Pellets

25 PKR was the price of one kilogram of biomass pellets of Abies pindrow. In which the price of different inputs was used in the manufacture of biomass pellets, i.e., sawdust 3 PKR, bio-binder 10 PKR, lubricating oil 3 PKR, electricity 3 PKR, Labor 2 PKR, Transport 3 PKR, and Packing 2 PKR. While 25 PKR was the price of one kg biomass pellets Pinus roxburghii respectively. In which the price of various inputs was used in the manufacture of biomass pellets, i.e., sawdust 3 PKR, bio-binder 10 PKR, lubricating oil 3 PKR, electricity 2 PKR, Labor 2 PKR, Transport 3 PKR, and Packing 2 PKR, respectively. Whereas 24 PKR was the price of one kg biomass pellets of Pinus wallichiana, respectively. In which the price of several inputs was used in the manufacture of biomass pellets, i.e., sawdust 4 PKR, bio-binder 8 PKR, lubricating oil 3 PKR, electricity 2 PKR, Labor 2 PKR, Transport 3 PKR, and Packing 2 PKR, respectively. However, 24 PKR was the price of one kg biomass pellets of Quercus dilatata. In which the price of different inputs was used in the manufacture of biomass pellets, i.e., sawdust 4 PKR, bio-binder 8 PKR, lubricating oil 3 PKR, electricity 2 PKR, Labor 2 PKR, Transport 3 PKR, and Packing 2 PKR. Whereas 24 PKR was the price of one kg biomass pellets of Melia azedarach, respectively. In which the price of several inputs was used in the manufacture of biomass pellets, i.e., sawdust 4 PKR, bio-binder 8 PKR, lubricating oil 3 PKR, electricity 2 PKR, Labor 2 PKR, Transport 3 PKR, and Packing 2 PKR, respectively. However, 25 PKR was the price of one kg biomass pellets of Albizia lebbeck. In which the price of different inputs was used in the manufacture of biomass pellets, i.e., sawdust 5 PKR, bio-binder 8 PKR, lubricating oil 3 PKR, electricity 2 PKR, Labor 2 PKR, Transport 3 PKR, and Packing 2 PKR. 26 PKR was the price of one kilogram of biomass pellets of Diospyros Lotus. In which the price of different inputs was used in the manufacture of biomass pellets, i.e., sawdust 5 PKR, bio-binder 9 PKR, lubricating oil 3 PKR, electricity 3 PKR, Labor 2 PKR, Transport 3 PKR, and Packing 2 PKR. While 22 PKR was the price of one kg biomass pellets Pinus roxburghii, respectively. In which the price of various inputs was used in the manufacture of biomass pellets, i.e., sawdust 3 PKR, bio-binder 8 PKR, lubricating oil 3 PKR, electricity 2 PKR, Labor 2 PKR, Transport 3 PKR, and Packing 2 PKR, respectively and the price of one kg biomass pellets produce from Parthenium hysterophorus 26 respectively. In which the price of various inputs was used in the manufacture of biomass pellets, i.e., sawdust 6 PKR, bio-binder 9 PKR, lubricating oil 3 PKR, electricity 2 PKR, Labor 2 PKR, Transport 3 PKR, and Packing 2 PKR as documented in Table 9.

4. Discussion

In the present study, length, diameter, and volume were determined for nine different biomass pellets produced from various species. The highest length was (43.9 mm) obtained for Pinus roxburghii species and (43.3 mm) for Diospyros lotus species. In comparison, the shortest length was determined (27.6 mm) for softwood mix species, a similar study in northeast Mexico was conducted by [43] biomass pellets made from the residues of three (3) species, Acacia wrightii (6.05 mm), Ebenopsis ebano (6.03 mm), and Havardia pallens (6.07_0.01 mm) all have similar diameters. While the length of Ebenopsis ebano pellets (17.37_1.61 mm) was longer than the Acacia wrightii (13.17_0.82 mm) and Havardia pallens (13.44_0.99.mm) pellets, the pellets of Ebenopsis ebano, Havardia pallens, and Acacia wrightii have length/diameter ratios of 2.88_0.27, 2.23_0.17, and 2.17_0.15, respectively. Another research conducted by [44] acknowledged that All of the pellets made from rice straw had a cylindrical shape with an average diameter of eight (8) mm and a length of ten (10) mm. A substance’s Moisture content is identified as the most critical element influencing pellet quality [45]. The results obtained from the research study [1] Before densification, the mean moisture content of the used materials was determined according to EN14774-3:2009 [46] and was found to be 11.22% for wood and 12.99% for bark. In the present study, the highest moisture content was recorded (9.97%) in Pinus roxburghii, followed by Diospyros Lotus (9.01%), while the lowest moisture content was found in Pinus wallichiana and Parthenium hysterophorus (5.14%). Our study is in line with [14] that In Indonesia, the average MC was 17.50 percent for tapioca flours and 16.24 percent for sago pulp waste binding materials, which were greater than the recommended MC of 12 percent. The MC of woody biomass pellet binding with tapioca flour derived from greater wood density tends to be higher than that of lighter density, such as Merbaou 18.40 percent, Matoa 18.17 percent, and Benuang 15.15 percent. Ash is a non-combustible component of biomass products that influences the combustion quality [47]. The ash content of the materials was determined according to ASTM D1102-2001 [1], averaging four replicates [1]. In the present study, the ash content of nine different biomass wood pellets was investigated. The highest ash content was recorded at 7% for Pinus wallichiana, followed by Quercus dilatata at 4.99%, while the lowest ash content was recorded at 0.31% by wood pellets produced from Abies pindrow followed by Pinus roxburghii 0.61%. A study by [48] showed the impact of various compounds on the burning reactivity of different biofuels. Wood pellets were made in Finland; the ash content was 0.5 percent [49]. Our study is in line with [50], who stated that pellets produced from fruit tree pruning and pallet wastes in Extremadura City (Spain) had an ash content of 1.44 percent. In comparison, pellets produced from pine forest deposits in Galicia city (Spain) had an ash content of 0.33 percent. Pellets produced from pine forest deposits in Regio Centro city (Portugal) had an ash content of 0.50 percent. Bulk density is an important quality characteristic of biomass. Bulk density is the percentage of the mass of all the components in a unit volume, and it is affected by the substance, moisture content, particle size, and shape [51]. In the present study, the highest bulk density was recorded at 930 kg/m3 in Abies pindrow, followed by Quercus dilatata at 810 kg/m. The lowest bulk density was recorded for 500 kg/m³ for Pinus roxburghii and 640 kg/m³ for Diospyros lotus. A similar study was conducted by [52] Pellets made of softwood that is white. The bulk density of wood pellets made from a combination of softwood and hardwood chips was 780 kg m3, while wood pellets made from softwood material had a bulk density of 615 kg m3. Our study is in line with [53] the results showed that the hazelnut pellet (581.30 kg m3) had a higher bulk density than the Olive pellet (562.38 kg m3) in the Viterbo province (Lazio region, Italy).
The quantity of heat emitted while burning a specific amount of fuel Is referred to as the calorific value of a fuel. The chemical makeup of the raw materials determines the heating value of biofuels. C, O, S, and H are the most critical elements in solid biofuels for heating value among biomass constituents [54]. At present, the high heating value (HHV) was recorded (24.79 MJ/kg) for Melia azedarach, followed by Softwood mixed with the value of (23.84 MJ/kg). While a lower heating value was recorded (20.24 MJ/kg) for Abies pindrow. In China, the high heating value of torrefied white commercial wood pellets from Premium Pellets Ltd. was 22.27 MJ/kg, the high heating value of torrefied brown commercial wood pellets from Shell Premium Pellets and pine woodchips from FP Innovation was 23.1, and the HHV of torrefied control pellets was 22.5 [55]. Our study is in line with [56] in Canada, the HHV of SPF (spruce, pine, and fir) shavings from the Wood Pellet Association of Canada and pine woodchip pellets from FP Innovation was 22.5 MJ/kg, Whereas, in the Japanese town of Nanporo, rice straw is used to make wood pellets. The LHV of dry rice straw was less than 15 MJ/kg, while the LHV of wood was 16.3 MJ/kg [57]. The carbon footprint was most probably derived from the global warming potential (GWP), an indicator often reported in LCA studies. Carbon footprint is the sum of all the GHG emissions directly or indirectly caused by a company, organization, process, product, or person, usually measured in terms of tones or kilograms of carbon dioxide equivalents (CO2 e) [58].The present study indicates the highest carbon footprint (0.186 CO2 e) for Softwood mixed species, while the lowest carbon footprint was recorded (0.173 CO2 e) for Quercus dilatata. Regarding carbon footprint or global warming potential, the literature suggests that high-quality pellet production for residential heating in the Tuscany region produces 40 kg CO2 eq t−1 [59]. The wood pellet industry in British Columbia generates 87.19 kg CO2 eq t−1 [60].Our study is in line with [61] the carbon footprint produced by various methods of fuel combustion has been studied (Fuel, fuel oil, lignite, brown coal, electricity, and pellets). Pellets have the lowest carbon dioxide equivalent emissions (0.29 CO2 e). The WF of average bio-energy carriers grown in the Netherlands is 24 m3, in the US 58 m3, in Brazil 61 m3, and in Zimbabwe 143 m3 [62]. A study by [63] stated that the water footprint of wood pellets produced in the Netherlands and Singapore was 41 m3. The present study’s maximum contribution to the water footprint or water scarcity index (Wwaswere from Softwood mixed, Pinus roxburghii, and Abies pindrow pellets, respectively. The lubricating oil, followed by sawdust and electricity, individually used in biomass pellets manufacture, also had the highest impacts on the water footprint family. However, no such detailed study is available regarding the water footprint of biomass pellets in the literature. In the present study, the nitrogen and Sulfur content was recorded for different wood pellets produced from different species. The highest nitrogen content was recorded at 1.20% in Pinus wallichiana wood pellets, followed by Quercus dilatata at 1.04%. While Sulfur was detected in only two species, 0.03% in Parthenium hysterophorus and 0.05% in Albizia lebbeck. Our study is in line with [50] in Western Europe Extremadura (Spain) pellets made from fruit tree trimming and pallet trash (labeled as COM 1 pellets). Pellets derived from pine forest wastes in Galicia (Spain) (COM.2 pellets). Pellets made from pine forest wastes from the Regio Centro region of Portugal (COM.3 pellets). The Nitrogen percentage of pellets produced from COM 1 pellets was (1.274 percent), COM 2 pellets were (0.33 percent), and the Nitrogen percentage from COM 3 was (0.06 percent). In comparison, the Sulfur % was recorded as 0.025 percent by COM 1 Pellets, 0.004 by COM 2 pellets, and 0.008% by COM 3 pellets. A study conducted by [64] Stated that the agricultural residues used were corncobs and rice husks from Northern Thailand, with nitrogen content of 0.53 percent in corncobs and 0.50 percent in rice husks, and sulfur content of 0.01 percent in corncobs and none detected in rice husks. In the present study, Softwood mixed pellets CED was 29.35 MJ, followed by Abies pindrow 26. 82 MJ was recorded highest cumulative energy demand during the production of one kg pellets, while the lowest CED was recorded at 25.95 MJ for Quercus dilatata. Our study is in line with [65] CED of terrified pellets (13.96 MJ/kg), and CED of sample wood pellets (10.41 MJ/kg) were measured in the United Kingdom. An LCA study can analyze all cradle-to-grave stages of a process to assess environmental, social, and economic concerns, or it can consider goods from the abstraction of raw materials to production, construction, distribution, use, maintenance, repair, and end-of-life [66]. For many years, global warming has been a source of concern on a global scale. It is widely acknowledged that emissions of GH gases, carbon dioxide (co2), are the primary driver of global warming [67].
In the present study, the highest global warming impact was recorded (0.18440 kg CO2 eq) during the production of a 1 kg biomass pellet. In contrast, the highest acidification was recorded (0.00091 kg SO2 eq) in Pinus wallichiana, followed by Abies Pindrow (0.00090 kg SO2 eq). The highest eutrophication was recorded (0.00036 kg PO4-eq) by four species: Diospyros lotus, Parthenium, Pinus roxburghii, and Softwood mixed. However, the contribution of Human toxicity impact factor was recorded (0.1643 kg 1,4-DB eq) by Softwood mixed, followed by Pinus roxburghii (0.1593 kg 1,4-DB eq) and Abies pindrow (0.1589 kg 1,4-DB eq). The contribution of Freshwater aquatic ecotoxicity was found (0.0709 kg 1,4-DB eq) in Softwood mixed and (0.0700 kg 1,4-DB eq) in Parthenium, While the terrestrial ecotoxicity was recorded (0.0008 kg 1,4-DB eq) same for all species. The contribution of Ozone layer depletion was recorded as almost similar for all species. Whereas the contribution of Photochemical oxidation was recorded (7.272 × 10⁻⁵ kg C2H4 eq) by Softwood mixed, and Abiotic depletion impact factor was recorded (0.00244 kg Sb eq) for Softwood mixed and (0.00241 kg Sb eq) in Pinus roxburghii. Our study is in line with [68]. In Canada, during the production of 1 kg pellets from wheat straw, the Global warming was recorded (326.30 g CO2 eq), Acidification (1.48 g SO2 eq), Eutrophication (0.54 g PO4 eq), Human toxicity (84.79 g 1,4-DB eq), Freshwater aquatic ecotoxicity (36.66 g 1,4-DB eq), Terrestrial ecotoxicity (0.46 g 1,4-DB eq), Ozone layer depletion (3.44 × 10⁻⁵ g CFC-11 eq), Photochemical oxidation (5.47 × 10⁻² g C2H4) and Abiotic depletion (2.24 g Sb eq). Another similar study was conducted by [69] in Thailand Climate change was recorded (6.79 × 101 kg CO2 eq) for one-ton wood pellets produced from Leucaena and (7.34 × 101 kg CO2 eq) for Acacia pellets. Terrestrial ecotoxicity was recorded (9.25 × 101 kg 1,4-DCB) for Leucaena and (1.01 × 10² kg 1,4-DCB) for wood pellets produced from Acacia, whereas for the Wood pellets produced from Leucaena Freshwater ecotoxicity was recorded (5.74 × 10⁻² kg 1,4-DCB) and similar result (6.24 × 10⁻² kg 1,4-DCB) was found for acacia. While human toxicity was recorded (7.00 × 101 kg 1,4-DCB) for Leucaena and (8.20 × 101 kg 1,4-DCB) for Acacia.
In the present study, the most major harm was caused by the resource depletion impact factor (0.4005 MJ surplus), which was recorded in Softwood mixed species. The second major impact was Ecosystem Quality which was recorded (0.3894 PDF*m2yr) in Softwood mixed, followed by Abies Pindrow (0.3514 PDF*m2yr). The human health impact category was recorded as the lowest among all categories. Our study is in line with [70]. The most significant harm was caused by resource depletion, which contributed a 5.35 megajoule (MJ) surplus, followed by ecosystem quality and human health, which contributed (0.927 PAF*m2yr) and (5.35106 DALY). Human health was not impacted by the pellets developed from three separate species. Kikar wood pellets (0.353, PAF*m2yr) caused the most damage to ecosystem quality, next by Mesquite pellets (3.0101% PAF*m2yr) and Oak sawdust wood pellets (2.75101% PAF*m2yr). The resource damage was most significant in pellets made by Kikar saw dust (1.92. MJ surplus) and Oak (1.75 MJ surplus) and the least in pellets from Mesquite (1.6 MJ surplus). Another study conducted by [71] Indicated that the impact of the environment on human being health is far greater than the effect on ecosystem quality and resources. Human health suffered the most damage in Italy (1.440 mPt), followed by resources (0.970 mPt), whereas ecosystem quality suffered the least (0.776 mPt). In the present study, nine different biomass pellets were used for the economic analysis. The functional unit was one kg. The highest price of 1 kg pellets was recorded at 26 PKR for Parthenium and Diospyros lotus, while the lowest price was 22 PKR for pellets produced from softwood mixed species. Wood pellet manufacturing prices vary between 119 and 160 € t−1 in Finland, Norway, Sweden, Germany, and the United States, including domestic transportation [72]. A similar study conducted by [69] showed the production of wood pellets (10 percent of wood pellets are for household usage, and 20 percent of wood pellets are for trade) is only 230,000 tones, generating a profit of nearly 2.2 million dollars while employing 327 people per year. In Thailand, the price of raw material is 0.8 THB (4 pkr) per kg, and wood pellets are sold at 3 THB per kg. The cost of raw materials is a significant cause for the sustainability of the production of wood pellets [73].

5. Conclusions

The main conclusions that could be drawn from the current work are summarized in the following.
  • Using Melia azedarach as a feedstock to produce wood pellets resulted in smoother and moderately denser wood pellets. The High Heating value was also recorded in the wood pellets of Melia azedarach.
  • In the environmental impacts, the highest contribution was shown in the Marin aquatic ecotoxicity by the wood pellets produced from the softwood sawdust.
  • It is concluded that lubricating oil should be replaced by an environmentally friendly adhesive to avoid environmental damage.
  • In future research, it is recommended to use the needles of Pine trees as it would improve the ignition properties due to the presence of high lignin and resinous contents.
  • This study concluded that the highest carbon footprint (0.186 CO2 e) was for Softwood mixed species, while the lowest carbon footprint was recorded (0.173 CO2 e) for Quercus dilatata.
  • In the conclusion reported by (Yusuf et al. [74]) it is recommended to use Mbwazirume peel (MP) in future research on wood pellets, as its thermal analysis showed excellent properties.
  • The limitations in this study were the unavailability of proper high voltage electricity and binder/adhesive for wood pellets biofuel manufacture.
  • This study was complicated because there were not enough sawmills near the study site to collect the data easily.

Author Contributions

Conceptualization, M.H. (Majid Hussain), M.H. (Maaz Hassan) and A.Y.; methodology, A.R. and R.S.M.; software, M.H. (Majid Hussain) and A.R.; validation, S.A.; formal analysis, A.R. and M.H. (Maaz Hassan).; investigation, M.A.K., S.Y. and F.R.; resources, N.U.; data curation, M.H. (Majid Hussain), N.U., S.Y. and S.A.; writing—original draft preparation, M.H. (Maaz Hassan) and S.Y.; writing—review and editing, A.R., R.S.M., F.R., S.A., M.H. (Majid Hussain), M.A.K. and visualization, A.Y., M.H. (Maaz Hassan) and A.R.; supervision, M.H (Majid Hussain); project administration, M.H. (Majid Hussain); funding acquisition, M.H. (Majid Hussain). All authors have read and agreed to the published version of the manuscript.

Funding

Research is funded by HEC Project No. TTSF-HEC-15 but for APC we did not received any funding.

Institutional Review Board Statement

Not applicable.

Informed Consent Statement

Informed consent was obtained from all subjects involved in the study.

Data Availability Statement

Not applicable.

Acknowledgments

We are very thankful all authors and especially to the Higher Education Commission (HEC), Islamabad, for providing financial assistance/funding to conduct this research study under Project No. TTSF-HEC-15 under the supervision of Majid Hussain, Department of Forestry and Wildlife Management, University of Haripur, KP, Pakistan.

Conflicts of Interest

The authors declare no conflict of interest.

References

  1. Lykidis, C.; Kamperidou, V.; Mantanis, G.I. The Use of Black Pine Bark for Improving the Properties of Wood Pellets. Forests 2023, 14, 1069. [Google Scholar] [CrossRef]
  2. Varma, A.K.; Thakur, L.S.; Shankar, R.; Mondal, P. Pyrolysis of wood sawdust: Effects of process parameters on products yield and characterization of products. Waste Manag. 2019, 89, 224–235. [Google Scholar] [CrossRef] [PubMed]
  3. Martins, F.; Felgueiras, C.; Smitkova, M.; Caetano, N. Analysis of fossil fuel energy consumption and environmental impacts in European countries. Energies 2019, 12, 964. [Google Scholar]
  4. Intergovernmental Panel on Climate Change. IPCC Climate Change; IPCC: Geneva, Switzerland, 2014. [Google Scholar]
  5. Malode, S.J.; Prabhu, K.K.; Mascarenhas, R.J.; Shetti, N.P.; Aminabhavi, T.M. Recent advances and viability in biofuel production. Energy Convers. Manag. 2021, 10, 100070. [Google Scholar] [CrossRef]
  6. Antar, M.; Lyu, D.; Nazari, M.; Shah, A.; Zhou, X.; Smith, D.L. Biomass for a sustainable bio economy: An overview of world biomass production and utilization. Renew. Sustain. Energy Rev. 2021, 139, 110691. [Google Scholar] [CrossRef]
  7. Perera, F.; Ashrafi, A.; Kinney, P.; Mills, D. Towards a fuller assessment of benefits to children’s health of reducing air pollution and mitigating climate change due to fossil fuel combustion. Environ. Res. 2019, 172, 55–72. [Google Scholar]
  8. Pełka, G.; Jach-Nocoń, M.; Paprocki, M.; Jachimowski, A.; Luboń, W.; Nocoń, A.; Wygoda, M.; Wyczesany, P.; Pachytel, P.; Mirowski, T. Comparison of Emissions and Efficiency of Two Types of Burners When Burning Wood Pellets from Different Suppliers. Energies 2023, 16, 1695. [Google Scholar] [CrossRef]
  9. Sharma, S.; Kundu, A.; Basu, S.; Shetti, N.P.; Aminabhavi, T.M. Sustainable environmental management and related biofuel technologies. J. Environ. Manag. 2020, 273, 111096. [Google Scholar] [CrossRef]
  10. Perea-Moreno, M.A.; Samerón-Manzano, E.; Perea-Moreno, A.J. Biomass as renewable energy: Worldwide research trends. Sustainability 2019, 11, 863. [Google Scholar] [CrossRef] [Green Version]
  11. Visser, L.; Hoefnagels, R.; Junginger, M. Wood pellet supply chain costs—A review and cost optimization analysis. Renew. Sustain. Energy Rev. 2020, 118, 109506. [Google Scholar] [CrossRef]
  12. Manzano-Agugliaro, F.; Alcayde, A.; Montoya, F.G.; Zapata-Sierra, A.; Gil, C. Scientific production of renewable energies worldwide: An overview. Renew. Sustain. Energy Rev. 2013, 18, 134–143. [Google Scholar] [CrossRef]
  13. Lazarus, M.; van Asselt, H. Fossil fuel supply and climate policy: Exploring the road less taken. Clim. Chang. 2018, 150, 1–13. [Google Scholar] [CrossRef] [Green Version]
  14. Arifudin, M.; Annakotapary, D.I.M.; Sariningsih, N.I. Characteristics of wood pellet from sawdust pelletized with the hand meat grinder. IOP Conf. Ser. Earth Environ. Sci. 2021, 753, 012017. [Google Scholar]
  15. Zadravec, T.; Rajh, B.; Kokalj, F.; Samec, N. The impact of secondary air boundary conditions on CFD results in small-scale wood pellet combustion. Fuel 2022, 324, 124451. [Google Scholar] [CrossRef]
  16. Brosowski, A.; Krause, T.; Mantau, U.; Mahro, B.; Noke, A.; Richter, F.; Raussen, T.; Bischof, R.; Hering, T.; Blanke, C.; et al. How to measure the impact of biogenic residues, wastes and by-products: Development of a national resource monitoring based on the example of Germany. Biomass Bioenergy 2019, 127, 105275. [Google Scholar] [CrossRef]
  17. Vassilev, S.V.; Vassileva, C.G.; Song, Y.C.; Li, W.Y.; Feng, J. Ash contents and ash-forming elements of biomass and their significance for solid biofuel combustion. Fuel 2017, 208, 377–409. [Google Scholar] [CrossRef]
  18. Gündüz, G.; Saraçoğlu, N.; Aydemir, D. Characterization and elemental analysis of wood pellets obtained from low-valued types of wood. Energy Sources Part A Recovery Util. Environ. Eff. 2016, 38, 2211–2216. [Google Scholar] [CrossRef]
  19. Di Giacomo, G.; Taglieri, L. Renewable energy benefits with conversion of woody residues to pellets. Energy. 2009, 34, 724–731. [Google Scholar] [CrossRef]
  20. Guo, M.; Song, W.; Buhain, J. Bioenergy and biofuels: History, status, and perspective. Renew. Sustain. Energy Rev. 2015, 42, 712–725. [Google Scholar] [CrossRef]
  21. Boukherroub, T.; LeBel, L.; Lemieux, S. An integrated wood pellet supply chain development: Selecting among feedstock sources and arange of operating scales. Appl. Energy 2017, 198, 385–400. [Google Scholar] [CrossRef]
  22. Obernberger, I.; Thek, G. The Pellet Handbook: The Production and Thermal Utilization of Pellets; Routledge: London, UK, 2010. [Google Scholar]
  23. Kuokkanen, M.; Kuokkanen, T.; Stoor, T.; Niinimäki, J.; Pohjonen, V. Chemical methods in the development of eco-efficient wood-based pellet production. Waste Manag. Res. 2009, 27, 561–571. [Google Scholar] [CrossRef]
  24. Thomson, H.; Liddell, C. The suitability of wood pellet heating for domestic households: A review of literature. Renew. Sustain. Energy Rev. 2015, 42, 1362–1369. [Google Scholar] [CrossRef]
  25. Hughes, N.M.; Shahi, C.; Pulkki, R. A review of the wood pellet value chain, modern value/supply chain management approaches, and value/supply chain models. J. Renew. Energy 2014, 2014, 654158. [Google Scholar] [CrossRef] [Green Version]
  26. Mola-Yudego, B.; Selkimäki, M.; González-Olabarria, J.R. Spatial analysis of the wood pellet production for energy in Europe. Renew. Energy 2014, 63, 76–83. [Google Scholar] [CrossRef]
  27. Hauschild, M.Z.; Rosenbaum, R.K.; Olsen, S.I. Life Cycle Assess; Springer International Publishing: Cham, Switzerland, 2018. [Google Scholar] [CrossRef]
  28. Demırbas, A. The social, economic, and environmental importance of biofuels in the future. Energy Sources Part B Econ. Plan. Policy 2017, 12, 47–55. [Google Scholar]
  29. Ji, X.; Long, X. A review of the ecological and socioeconomic effects of biofuel and energy policy recommendations. Renew. Sustain. Energy Rev. 2016, 61, 41–52. [Google Scholar] [CrossRef]
  30. Yousaf, A.; Hadi, R.; Khan, N.; Ibrahim, F.; Moin, H.; Rahim, S.; Hussain, M. Identification of suitable habitat for Taxus wallichiana and Abies pindrow in moist temperate forest using maxent modelling technique. Saudi J. Biol. Sci. 2022, 29, 103459. [Google Scholar] [CrossRef]
  31. Shah, G.M.; Khan, M.A. Checklist of medicinal plants of Siran Valley, Mansehra, Pakistan. Ethnobot. Leafl. 2006, 1, 6. [Google Scholar]
  32. Shah, A.H.; Khan, S.M.; Shah, A.H.; Mehmood, A.; Rahman, I.U.; Ahmad, H. Cultural uses of plants among Basikhel tribe of district Tor Ghar, Khyber Pakhtunkhwa, Pakistan. Pak. J. Bot. 2015, 47, 23–41. [Google Scholar]
  33. Haq, F. The critically endangered flora and fauna of district Battagram Pakistan. Adv. Life Sci. 2012, 2, 118–123. [Google Scholar] [CrossRef]
  34. Khayyam, U.; Noureen, S. Assessing the adverse effects of flooding for the livelihood of the poor and the level of external response: A case study of Hazara Division, Pakistan. Environ. Sci. Pollut. Res. 2020, 27, 19638–19649. [Google Scholar] [CrossRef]
  35. Khan, W.; Ahmad, H.; Haq, F.; Islam, M.; Bibi, F. Present status of moist temperate vegetation of Thandiani forests district Abbottabad Pakistan. Int. J. Biosci. 2012, 10, 80–88. [Google Scholar]
  36. Brand, M.A.; Rodrigues, T.M.; da Silva, J.P.; de Oliveira, J. Recovery of agricultural and wood wastes: The effect of biomass blends on the quality of pellets. Fuel 2021, 284, 118881. [Google Scholar] [CrossRef]
  37. Rashedi, A.; Gul, N.; Hussain, M.; Hadi, R.; Khan, N.; Nadeem, S.G.; Khanam, T.; Asyraf, M.R.M.; Kumar, V. Life cycle environmental sustainability and cumulative energy assessment of biomass pellets biofuel derived from agroforest residues. PLoS ONE 2022, 17, e0275005. [Google Scholar] [CrossRef] [PubMed]
  38. Tiryaki, B.; Yagmur, E.; Banford, A.; Aktas, Z. Comparison of activated carbon produced from natural biomass and equivalent chemical compositions. J. Anal. Appl. Pyrolysis 2014, 105, 276–283. [Google Scholar] [CrossRef]
  39. Adams, P.; McManus, M. Small-scale biomass gasification CHP utilization in industry: Energy and environmental evaluation. Sustain. Energy Technol. Assess. 2014, 6, 129–140. [Google Scholar]
  40. Khanam, T.; Khalid, F.; Manzoor, W.; Rashedi, A.; Hadi, R.; Ullah, F.; Rehman, F.; Akhtar, A.; Babu, N.K.; Hussain, M. Environmental sustainability assessment of biodiesel production from Jatropha curcas L. seeds oil in Pakistan. PLoS ONE 2021, 16, e0258409. [Google Scholar] [CrossRef]
  41. Suh, S.; Lenzen, M.; Treloar, G.J.; Hondo, H.; Horvath, A.; Huppes, G.; Jolliet, O.; Klann, U.; Krewitt, W.; Moriguchi, Y.; et al. System boundary selection in life-cycle inventories using hybrid approaches. Environ. Sci. Technol. 2004, 38, 657–664. [Google Scholar] [CrossRef] [PubMed]
  42. Padilla-Rivera, A.; Barrette, J.; Blanchet, P.; Thiffault, E. Environmental performance of eastern Canadian wood pellets as measured through life cycle assessment. Forests 2017, 8, 352. [Google Scholar]
  43. Artemio, C.P.; Maginot, N.H.; Serafín, C.U.; Rahim, F.P.; Guadalupe, R.Q.J.; Fermín, C.M. Physical, mechanical and energy characterization of wood pellets obtained from three common tropical species. PeerJ 2018, 6, e5504. [Google Scholar] [CrossRef] [Green Version]
  44. Moliner, C.; Lagazzo, A.; Bosio, B.; Botter, R.; Arato, E. Production, characterization, and evaluation of pellets from rice harvest residues. Energies 2020, 13, 479. [Google Scholar] [CrossRef] [Green Version]
  45. Samuelsson, R.; Larsson, S.H.; Thyrel, M.; Lestander, T.A. Moisture content and storage time influence the binding mechanisms in biofuel wood pellets. Appl. Energy 2012, 99, 109–115. [Google Scholar] [CrossRef]
  46. Lestander, T.A.; Finell, M.; Samuelsson, R.; Arshadi, M.; Thyrel, M. Industrial scale biofuel pellet production from blends of unbarked softwood and hardwood stems—The effects of raw material composition and moisture content on pellet quality. Fuel Process. Technol. 2012, 95, 73–77. [Google Scholar] [CrossRef]
  47. Feng, X.; Yu, C.; Shu, Z.; Liu, X.; Yan, W.; Zheng, Q.; Sheng, K.; He, Y. Rapid and non-destructive measurement of biofuel pellet quality indices based on two-dimensional near infrared spectroscopic imaging. Fuel 2018, 228, 197–205. [Google Scholar] [CrossRef]
  48. Qin, K.; Thunman, H. Diversity of chemical composition and combustion reactivity of various biomass fuels. Fuel 2015, 147, 161–169. [Google Scholar] [CrossRef]
  49. Alakangas, E. European Standard (EN 14961) for wood chips and hog fuel. For. Bioenergy 2010, 47, 329–340. [Google Scholar]
  50. Arranz, J.I.; Miranda, M.T.; Montero, I.; Sepúlveda, F.J.; Rojas, C.V. Characterization and combustion behaviour of commercial and experimental wood pellets in South West Europe. Fuel 2015, 142, 199–207. [Google Scholar] [CrossRef]
  51. Liu, Z.; Mi, B.; Jiang, Z.; Fei, B.; Cai, Z. Improved bulk density of bamboo pellets as biomass for energy production. Renew. Energy 2016, 86, 1–7. [Google Scholar] [CrossRef] [Green Version]
  52. Graham, S.; Eastwick, C.; Snape, C.; Quick, W. Mechanical degradation of biomass wood pellets during long term stockpile storage. Fuel Process. Technol. 2017, 160, 143–151. [Google Scholar] [CrossRef]
  53. Acampora, A.; Civitarese, V.; Sperandio, G.; Rezaei, N. Qualitative characterization of the pellet obtained from hazelnut and olive tree pruning. Energies 2021, 14, 4083. [Google Scholar] [CrossRef]
  54. Shojaeiarani, J.; Bajwa, D.S.; Bajwa, S.G. Properties of densified solid biofuels in relation to chemical composition, moisture content, and bulk density of the biomass. BioResources 2019, 14, 4996–5015. [Google Scholar] [CrossRef]
  55. Peng, J.; Wang, J.; Bi, X.T.; Lim, C.J.; Sokhansanj, S.; Peng, H.; Jia, D. Effects of thermal treatment on energy density and hardness of torrefied wood pellets. Fuel Process. Technol. 2015, 129, 168–173. [Google Scholar] [CrossRef]
  56. Peng, J.; Bi, H.; Lim, C.; Sokhansanj, S. Study on density, hardness, and moisture uptake of torrefied wood pellets. Energy Fuels 2013, 27, 967–974. [Google Scholar] [CrossRef]
  57. Kizuka, R.; Ishii, K.; Sato, M.; Fujiyama, A. Characteristics of wood pellets mixed with torrefied rice straw as a biomass fuel. Int. J. Energy Environ. Eng. 2019, 10, 357–365. [Google Scholar] [CrossRef] [Green Version]
  58. Hussain, M.; Malik, R.N.; Taylor, A. Carbon footprint as an environmental sustainability indicator for the particleboard produced in Pakistan. Environ. Res. 2017, 155, 385–393. [Google Scholar] [CrossRef] [PubMed]
  59. Pergola, M.; Gialdini, A.; Celano, G.; Basile, M.; Caniani, D.; Cozzi, M.; Gentilesca, T.; Mancini, I.M.; Pastore, V.; Romano, S.; et al. An environmental and economic analysis of the wood-pellet chain: Two case studies in Southern Italy. Int. J. Life Cycle Assess. 2018, 23, 1675–1684. [Google Scholar] [CrossRef]
  60. Magelli, F.; Boucher, K.; Bi, H.T.; Melin, S.; Bonoli, A. An environmental impact assessment of exported wood pellets from Canada to Europe. Biomass Bioenergy 2009, 33, 434–441. [Google Scholar] [CrossRef]
  61. Jović, M.; Laković, M.; Jovčevski, M. A Carbon Footprint from Wood Pellet. In Facta Universitatis. Series: Working and Living Environmental Protection; University of Niš: Niš, Serbia, 2018; pp. 81–88. [Google Scholar]
  62. Gerbens-Leenes, P.; Hoekstra, A.Y.; Van der Meer, T. The water footprint of energy from biomass: A quantitative assessment and consequences of an increasing share of bio-energy in energy supply. Ecol. Econ. 2009, 68, 1052–1060. [Google Scholar] [CrossRef]
  63. Schyns, J.F.; Booij, M.J.; Hoekstra, A.Y. The water footprint of wood for lumber, pulp, paper, fuel and firewood. Adv. Water Resour. 2017, 107, 490–501. [Google Scholar] [CrossRef]
  64. Homdoung, N. Characterization of torrefied biomass pellets from agricultural residues for solid fuels. Agric. Eng. Int.: CIGR J. 2020, 22, 118–128. [Google Scholar]
  65. Adams, P.; Shirley, J.; McManus, M. Comparative cradle-to-gate life cycle assessment of wood pellet production with torrefaction. Appl. Energy 2015, 138, 367–380. [Google Scholar] [CrossRef] [Green Version]
  66. Sultana, R.; Rashedi, A.; Khanam, T.; Jeong, B.; Hosseinzadeh-Bandbafha, H.; Hussain, M. Life cycle environmental sustainability and energy assessment of timber wall construction: A comprehensive overview. Sustainability 2022, 14, 4161. [Google Scholar] [CrossRef]
  67. Hassan, M.; Hussain, M.; Ali, A.; Rehman, F.; Tabassum, A.; Amin, M.; Usman, N.; Bashir, S.; Raza, G.; Yousaf, A.; et al. Economic valuation of selected ecosystem services in Islamabad Capital Territory (ICT), Pakistan. Braz. J. Biol. 2022, 84, e260614. [Google Scholar] [CrossRef]
  68. Li, X.; Mupondwa, E.; Panigrahi, S.; Tabil, L.; Adapa, P. Life cycle assessment of densified wheat straw pellets in the Canadian Prairies. Int. J. Life Cycle Assess. 2012, 17, 420–431. [Google Scholar] [CrossRef]
  69. Saosee, P.; Sajjakulnukit, B.; Gheewala, S.H. Environmental externalities of wood pellets from fast-growing and para-rubber trees for sustainable energy production: A case in Thailand. Energy Convers. Manag. 2022, 14, 100183. [Google Scholar]
  70. Rashedi, A.; Muhammadi, I.U.; Hadi, R.; Nadeem, S.G.; Khan, N.; Ibrahim, F.; Hassan, M.Z.; Khanam, T.; Jeong, B.; Hussain, M. Characterization and life cycle exergo-environmental analysis of wood pellet biofuel produced in Khyber Pakhtunkhwa, Pakistan. Sustainability 2022, 14, 2082. [Google Scholar] [CrossRef]
  71. Fantozzi, F.; Buratti, C. Life cycle assessment of biomass chains: Wood pellet from short rotation coppice using data measured on a real plant. Biomass Bioenergy 2010, 34, 1796–1804. [Google Scholar] [CrossRef] [Green Version]
  72. Trømborg, E.; Ranta, T.; Schweinle, J.; Solberg, B.; Skjevrak, G.; Tiffany, D.G. Economic sustainability for wood pellets production—A comparative study between Finland, Germany, Norway, Sweden and the US. Biomass Bioenergy 2013, 57, 68–77. [Google Scholar] [CrossRef]
  73. Saosee, P.; Sajjakulnukit, B.; Gheewala, S.H. Environmental and Socio-economic Assessment of Wood pellet Production from Fast growing trees in Thailand. IOP Conf. Ser. Earth Environ. Sci. 2020, 463, 012049. [Google Scholar] [CrossRef]
  74. Yusuf, A.A. Production, Evaluation and Testing of Bioethanol from Matooke Peels Species as an Alternative Fuel for Spark Ignition Engine: A Case Study of Uganda. Ph.D. Thesis, University of KwaZulu-Natal, Durban, South Africa, 2020. [Google Scholar]
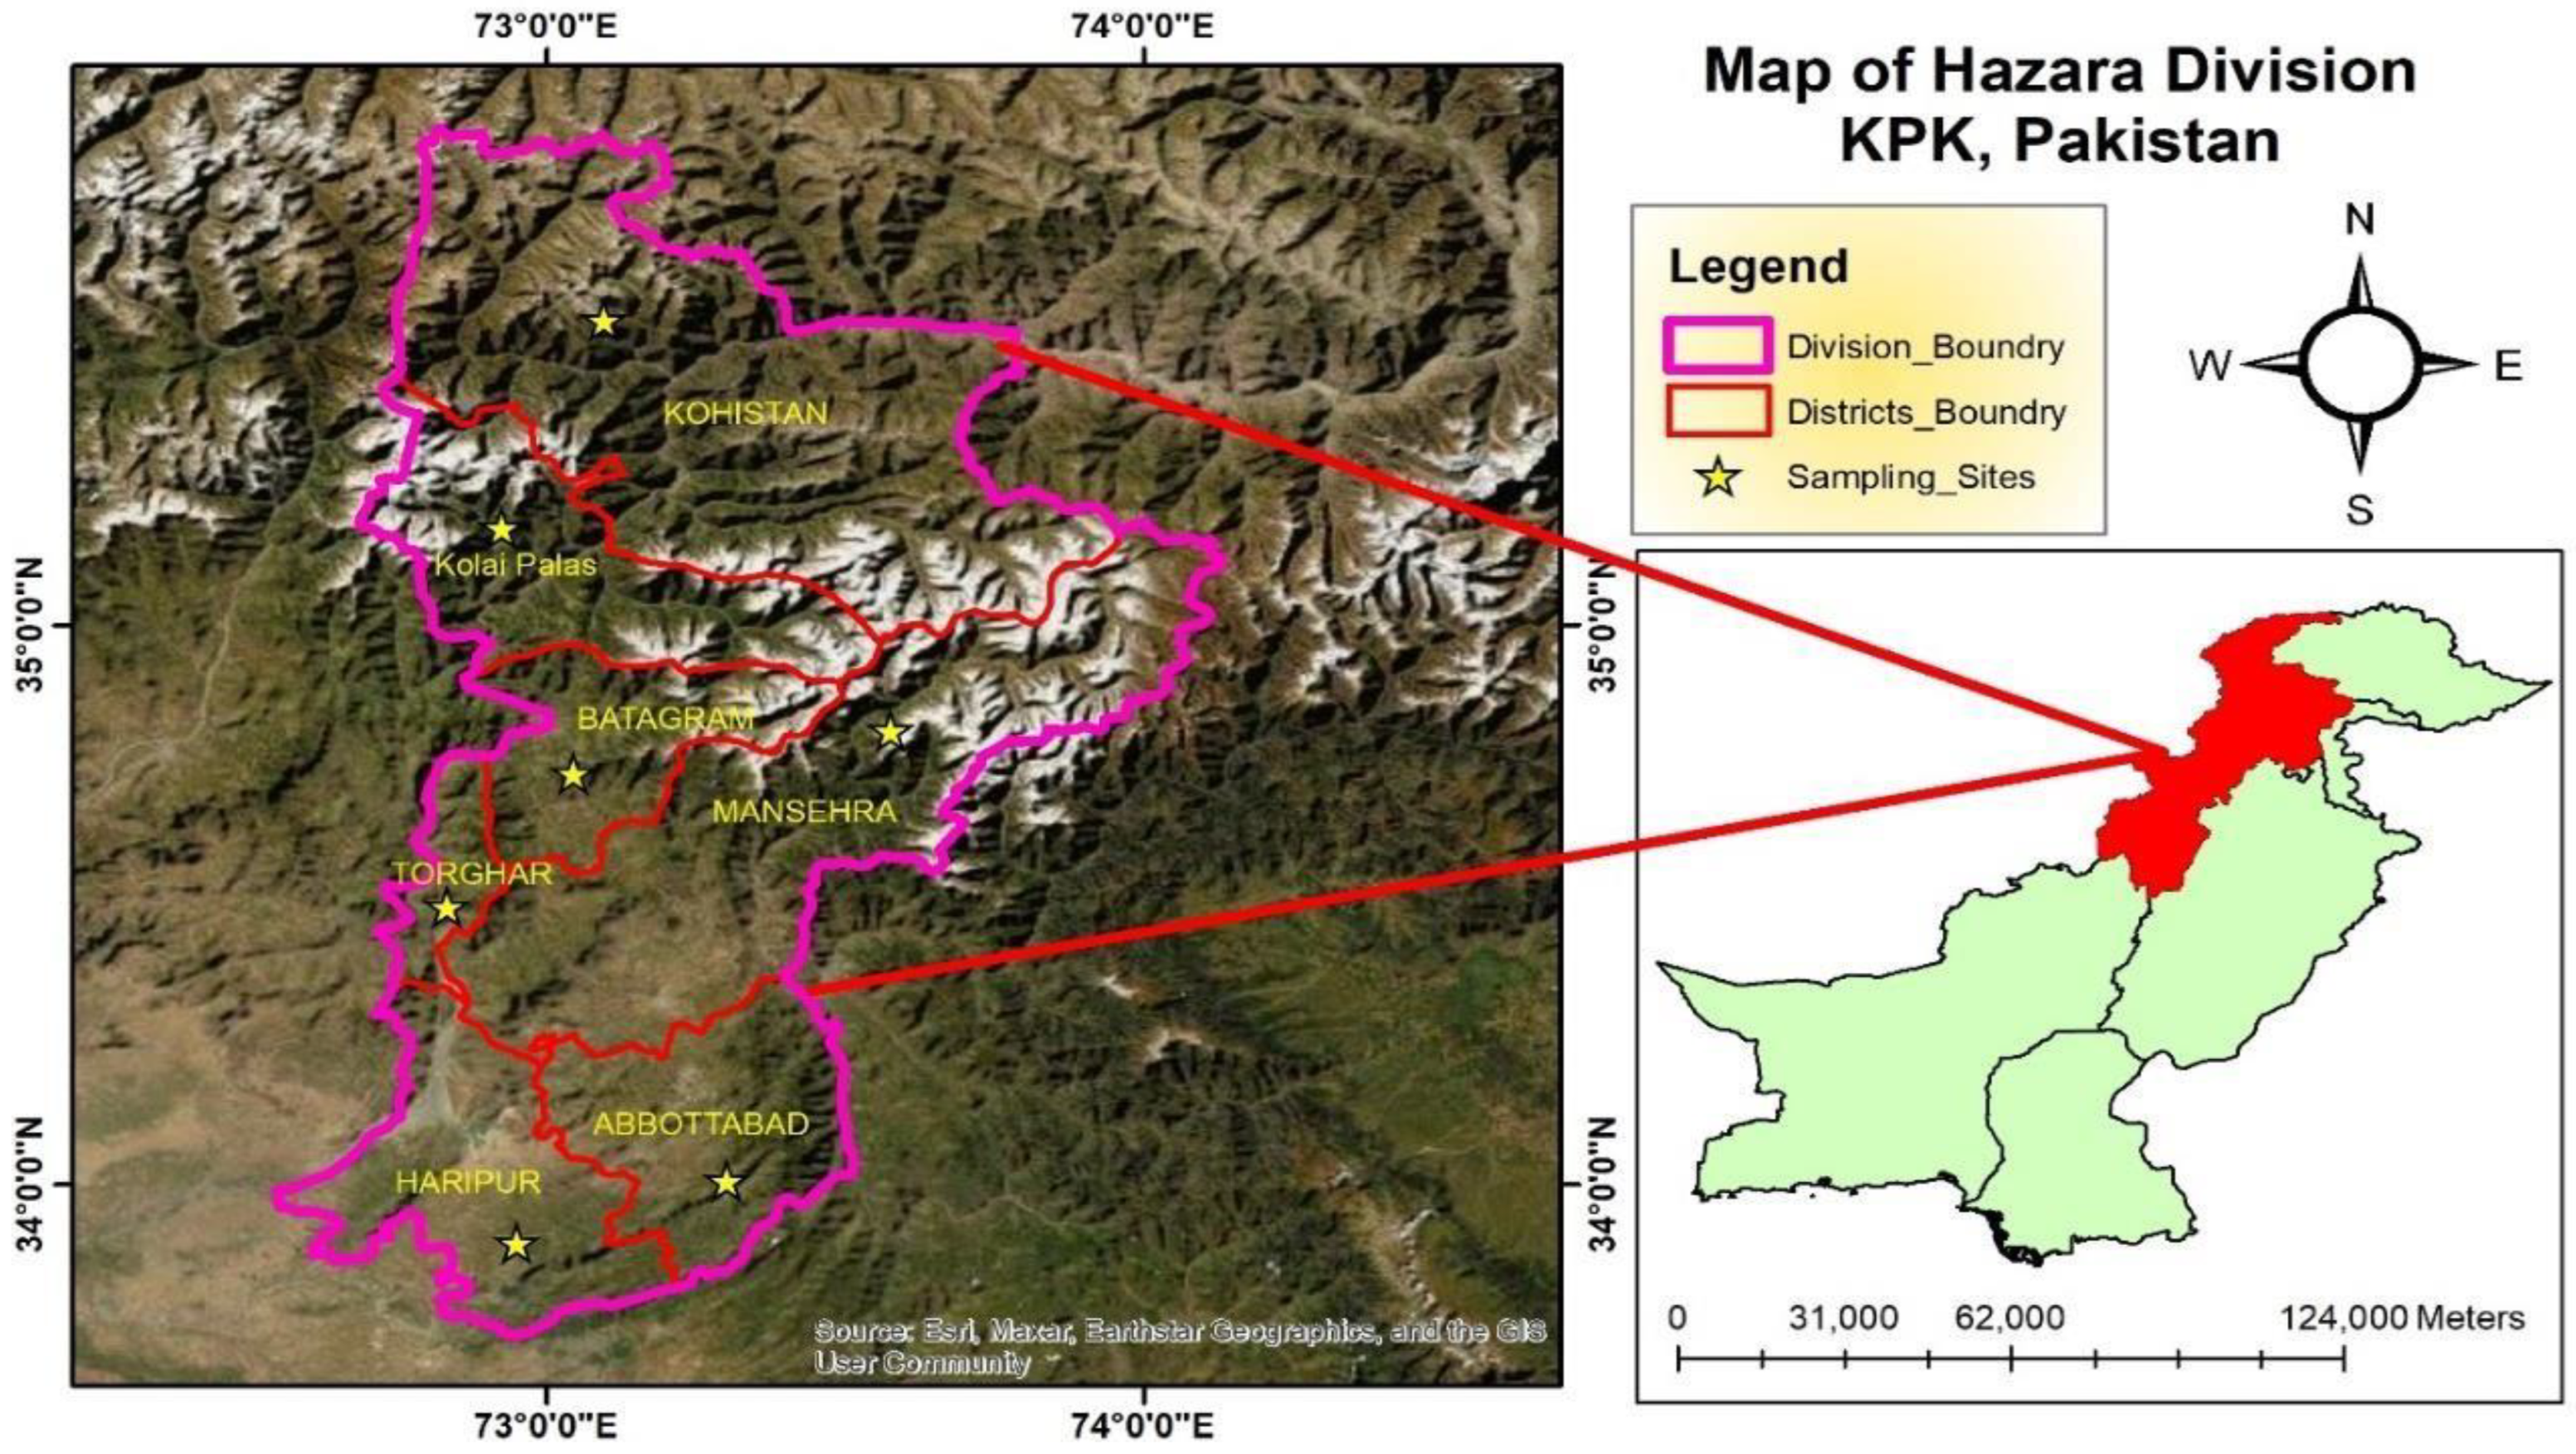
Figure 1. Map of the study area.
Sustainability 15 12089 g001
Figure 2. The system boundary of the study.
Sustainability 15 12089 g002
Figure 3. Carbon footprint (CF) of biomass pellets from different selected species.
Sustainability 15 12089 g003
Figure 4. The water footprint of biomass pellets from different selected species.
Sustainability 15 12089 g004
Figure 5. The ecological footprint of biomass pellets from different selected species.
Sustainability 15 12089 g005
Figure 6. Damage assessment of biomass pellets from different selected species.
Sustainability 15 12089 g006
Figure 7. Customer perceptions of biomass pellets biofuel in Hazara division.
Sustainability 15 12089 g007
Table 1. LCI for biomass pellets production from various selected species.
SpeciesSawdustBio BinderLubricating OilWaterElectricity Consumed
UnitgggLkWh
Parthenium hysterophorus1065180500.5550.056
Pinus wallichiana1050170500.5210.055
Quercus dilatata1040165500.4980.054
Pinus roxburghii1090200500.6010.055
Abies pindrow1080200500.5940.053
Melia azedarach1055175500.4110.055
Diospyros Lotus1070180500.5410.056
Albizia lebbeck1060175500.5290.054
Softwood mixed1045170500.4990.054
Table 2. The average diameter and average length of biomass pellets produced from different selected species.
Italian Standard6 ± 0.5–8≤10
PelletsDiameter Average (mm)Length Average (mm)
Parthenium hysterophorus10.336.4
Pinus wallichiana10.337.8
Quercus dilatata10.338.2
Pinus roxburghii10.343.9
Abies pindrow10.333.8
Melia azedarach10.341.2
Diospyros Lotus10.343.3
Albizia lebbeck10.340.2
Softwood mix10.327.6
Table 3. Moisture content and ash content of biomass pellets produced from different selected species.
Italian Standard≤10≤0.7620–720
PelletsMoisture Content, %Ash Content, %Bulk Density, kg/m³
Parthenium hysterophorus5.144.58650
Pinus wallichiana5.147680
Quercus dilatata5.294.99810
Pinus roxburghii9.970.61500
Abies pindrow7.940.31930
Melia azedarach8.763.15710
Diospyros Lotus9.013.98640
Albizia lebbeck7.360.68720
Softwood mix7.224.75700
Table 4. High heating and low heating values of biomass pellets are produced from various selected species.
Italian Standard for HHV of Wood Pellets (≥16.91 MJ/kg)
PelletsHHV, (MJ/kg)LHV, (MJ/kg)
Parthenium hysterophorus22.2320.26
Pinus wallichiana23.3921.65
Quercus dilatata22.8320.98
Pinus roxburghii23.0121.19
Abies pindrow22.2120.24
Melia azedarach24.7923.33
Diospyros Lotus23.2521.49
Albizia lebbeck22.6820.80
Softwood mixed23.8422.19
Table 5. Nitrogen and Sulfur percentage biomass pellets of different selected species.
Italian Standard≤0.3≤0.5
Wood PelletsNitrogen %Sulfur %
Parthenium hysterophorus1.030.03
Pinus wallichiana1.20Not detected.
Quercus dilatata1.04Not detected.
Pinus roxburghii0.49Not detected.
Abies pindrow0.69Not detected.
Melia azedarach0.61Not detected.
Diospyros Lotus0.56Not detected.
Albizia lebbeck0.720.05.
Softwood mix0.64Not detected.
Table 6. Environmental impact assessment of biomass pellets from different selected species.
Impact CategoryUnitAbies
pindrow
Albizia
lebbeck
Diospyros
lotus
Melia
azedarach
PartheniumPinus
roxburghi
Pinus
wallichiana
Quercus
dilatata
Softwood
Mixed
Abiotic depletionkg Sb eq0.002390.002390.002390.002370.002400.002410.002380.002350.00244
Acidificationkg SO2 eq0.000900.000890.000890.000880.000890.000910.000880.000860.00090
Eutrophicationkg PO4-eq0.000350.000350.000360.000350.000360.000360.000350.000340.00036
Global warmingkg CO2 eq0.176660.175730.176510.173880.176890.178730.174940.171970.18440
Ozone layer
depletion
CFC-11 eq4.4 × 10−84.44 × 10−84.45 × 10−84.438 × 10−84.454 × 10−84.47 × 10−84.438 × 10−84.42 × 10−84.58 × 10−8
Human toxicitykg 1,4-DB eq0.15890.15700.15760.15680.15790.15930.15640.15530.1643
Freshwater
aquatic ecotoxicity
kg 1,4-DB eq0.06900.06950.06960.06860.07000.06990.06940.06800.0709
Marine aquatic
ecotoxicity
kg 1,4-DB eq145.4711146.5664146.8872144.1382147.5428147.9535146.2456142.8842149.8558
Terrestrial
ecotoxicity
kg 1,4-DB eq0.00080.00080.00080.00080.00080.00080.00080.00080.0008
Photochemical
oxidation
kg C2H4 eq6.923 × 10−56.812 × 10−56.856 × 10−56.771 × 10−56.852 × 10−56.977 × 10−56.769 × 10−56.688 × 10−57.272 × 10−5
Table 7. Cumulative energy demand (CED) for one kilogram of biomass pellets produced by different selected species.
Impact CategoryUnitAbies
pindrow
Albizia
lebbeck
Diospyros
lotus
Melia
azedarach
PartheniumPinus
roxburghii
Pinus
wallichiana
Quercus dilatataSoftwood Mix
Nonrenewable fossilMJ5.04125.02855.04074.99895.04465.07455.01634.97115.1648
Non-renewable biomassMJ0.00170.00160.00160.00160.00160.00170.00160.00160.0018
Renewable biomassMJ21.785521.386121.586121.285621.486521.98621.186120.985224.1862
Renewable waterMJ0.00050.0030.00290.00080.00350.00260.00310.00050.0019
Table 8. Various environmental impacts are determined through Eco-indicator (EI) from different selected species.
Impact CategoriesUnitAbies
pindrow
Albizia
lebbeck
Diospyros lotusMelia
azedarach
PartheniumPinus
roxburghii
Pinus
wallichiana
Quercus
dilatata
Softwood Mix
CarcinogensDALY6.383 × 10−86.409 × 10−86.414 × 10−86.368 × 10−86.442 × 10−86.426 × 10−86.404 × 10−86.331 × 10−86.504 × 10−8
Respiratory organicsDALY1.680 × 10−91.675 × 10−91.677 × 10−91.674 × 10−91.676 × 10−91.682 × 10−91.673 × 10−91.671 × 10−91.700 × 10−9
Respiratory inorganicsDALY2.663 × 10−72.668 × 10−72.680 × 10−72.614 × 10−72.689 × 10−72.720 × 10−72.656 × 10−72.581 × 10−72.780 × 10−7
Climate changeDALY3.695 × 10−83.676 × 10−83.692 × 10−83.637 × 10−83.700 × 10−83.739 × 10−83.659 × 10−83.597 × 10−83.857 × 10−8
RadiationDALY2.945 × 10−102.988 × 10−102.989 × 10−102.940 × 10−103.009 × 10−102.993 × 10−102.986 × 10−102.910 × 10−103.030 × 10⁻¹⁰
Ozone layerDALY4.687 × 10−114.672 × 10−114.682 × 10−114.663 × 10−114.680 × 10−114.701 × 10−114.662 × 10−114.640 × 10−114.812 × 10⁻¹¹
EcotoxicityPAF*m2yr8.204 × 10−28.131 × 10−28.154 × 10−28.145 × 10−28.185 × 10−28.202 × 10−28.108 × 10−28.000 × 10−28.400 × 10−2
AcidificationPDF*m2yr3.931 × 10−33.843 × 10−33.870 × 10−33.825 × 10−33.872 × 10−33.955 × 10−33.815 × 10−33.700 × 10−34.000 × 10−3
Land usePAF*m2yr3.393 × 10−13.331 × 10−13.362 × 10−13.315 × 10−13.347 × 10−13.425 × 10−13.300 × 10−13.200 × 10−13.700 × 10−1
MineralsMJ surplus4.222 × 10−34.155 × 10−34.161 × 10−34.207 × 10−34.168 × 10−34.173 × 10−34.149 × 10−34.187 × 10−34.240 × 10−3
Fossil fuelsMJ surplus3.869 × 10−13.858 × 10−13.868 × 10−13.837 × 10−13.870 × 10−13.893 × 10−13.849 × 10−13.816 × 10−13.963 × 10−1
Table 9. Economic assessment of 1 kg biomass pellets produced from different selected species.
SpeciesUnitSawdustBio BinderLubricating OilElectricityLaborTransportPackingTotal
Abies pindrowPKR3103223225
Pinus roxburghiiPKR3103223225
Pinus wallichianaPKR483223224
Quercus dilatataPKR483223224
Melia azedarachPKR483223224
Albizia lebbeckPKR583223225
Diospyros LotusPKR593223226
Softwood mixPKR383222222
Parthenium hysterophorusPKR693222226
Disclaimer/Publisher’s Note: The statements, opinions and data contained in all publications are solely those of the individual author(s) and contributor(s) and not of MDPI and/or the editor(s). MDPI and/or the editor(s) disclaim responsibility for any injury to people or property resulting from any ideas, methods, instructions or products referred to in the content.