Article

Comparative Study on Shaking Table Tests for a Pile–Nuclear Island Structure under Different Soil Conditions

1
China Nuclear Energy Technology Co., Ltd., Beijing 100094, China
2
School of Civil Engineering, Xuzhou University of Technology, Xuzhou 221018, China
3
Key Laboratory of Earthquake Engineering and Engineering Vibration, Institute of Engineering Mechanics, China Earthquake Administration, Harbin 150080, China
*
Author to whom correspondence should be addressed.
Sustainability 2023, 15(15), 11988; https://doi.org/10.3390/su151511988
Submission received: 2 July 2023 / Revised: 25 July 2023 / Accepted: 1 August 2023 / Published: 4 August 2023
(This article belongs to the Special Issue Earthquake Engineering Technology and Its Application)

Abstract

:
In this paper, the shaking table tests of a Seismic–Soil–Pile–Superstructure Interaction (SSPSI) in medium-soft and hard base soil were carried out. Silted clay with a unit weight of 1.70 g/cm3 and a shear wave velocity of 175 m/s was adopted to simulate the medium-soft soil, while the composite soil obtained by adding 20% quicklime to silted clay with a unit weight of 1.75 g/cm3 and a shear wave velocity of 300 m/s was adopted to simulate the hard soil in the tests. By inputting the artificial seismic motion time history with different amplitudes synthesized by the RG1.60 response spectrum commonly used in nuclear power engineering to the models, the dynamic interaction characteristics and seismic response laws of the soil–pile–nuclear island structure in the medium-soft and hard base soil were compared, the internal force and deformation distribution characteristics of the pile foundation under different ground conditions were analyzed, and the site conditions and mechanism of seismic failure of the pile group foundation were described. The research results can provide a reference for site selection and seismic design of a nuclear power plant.

1. Introduction

Nuclear energy has been recognized and widely used by all countries as a clean, economical and efficient energy. The construction of nuclear power plants was mostly located in coastal bedrock sites for reasons of cooling and seismic safety in the past. However, the available coastal bedrock sites have gradually decreased with the rapid development of nuclear power, and the construction of nuclear power plants will extend to non-rock sites inevitably. Although there are a great deal of advantages with nuclear power generation, nuclear material is strongly radiative. It will bring a catastrophic impact on humans and the surrounding environment once nuclear leakage occurs. Therefore, the primary consideration for the construction of nuclear power plants is safety. The superstructure of nuclear power engineering is designed according to the strictest standards at present, of which safety can be ensured in the event of malicious impacts by large commercial aircraft and strong earthquakes [1]. The bedrock site is favorable for seismic design, on which the construction of nuclear power plants can meet the seismic safety requirements. However, in the construction of nuclear power plants in non-rock sites, the base soil has the characteristics of large discreteness and strong nonlinearity compared with the upper engineering structure of the nuclear island plant, which has a significant impact on the floor response spectrum and the inertial force of the structure. Therefore, the subsoil and foundation are the key to the seismic design of the nuclear island on the non-rock site, and it can be said that the seismic safety of the nuclear island plant depends on properties of the non-rock site and the seismic design of the foundation. The foundation design of a nuclear island in a non-rock site needs further study due to the characteristics of nuclear power structures and the complexity of the ground [2].
Pile foundations are generally adopted for important projects on non-rock soil, especially on soft soil, with the advantages of large bearing capacity, good stability and small differential settlement, and is widely used in bridge structures, high-rise buildings, port wharfs and offshore platforms. Earthquake damage investigations show that pile foundations have good seismic performance, but there is still some earthquake damage. The earthquake damage to a pile foundation is often concealed, and it is difficult to repair. For this reason, many scholars have carried out experimental and theoretical studies on the seismic performance of a pile foundation [3,4,5].
The theoretical research on the performance of a pile foundation was mostly focused on the bearing capacity of single pile and pile groups in the early stage, and the experimental research was mostly carried out on static pile pressing tests in the field to determine the bearing capacity and dynamic tests to test the integrity of the piles. With the accumulation of the seismic damage phenomenon of pile foundations during earthquakes and the development of test technology for seismic simulation, the seismic response law and damage to pile foundations has received more and more attention by engineers and scholars. In particular, the numerical simulation method is adopted to study the dynamic interaction of soil–pile–superstructure interactions under a seismic load (Seismic-Soil–pile–Superstructure-Interaction, referred to as SSPSI). However, the results of numerical simulations need to be tested and verified since the interaction involves complex nonlinear problems of the soil, the soil–pile contact surface, etc. The large-scale shaking table test of earthquake simulations is the most widely used laboratory test method for the study of soil–pile–superstructure dynamic interaction at home and abroad. The main feature of the test is that it is carried out in the 1 g gravity field, so a high-stress field, like in a centrifuge test, is not available. But the shaking table is capable of motion input in two dimensions and three dimensions, and the test model is generally much larger than that in the centrifuge test. Moreover, the shaking table test is not affected by the Coriolis effect in the centrifuge test, so it has unique advantages. Its 1 g test environment is most suitable for the test of cohesive soil, where the undrained stress–strain relationship and the confining pressure are independent.
Meymand [6] designed and used a cylindrical flexible soil box to carry out a large-scale shaking table test on a dynamic soft clay–pile–superstructure interaction. The test results show that the horizontal dynamic stiffness of the pile head is a function of the load level, and the results calculated according to the theory of elasticity are larger. Wei Xiao [7] carried out a series of shaking table tests on a dynamic soil–pile–pier structure interaction by using a rigid soil box, including a single-column pile-pier model, a single-pier pile group model and a double-pier pile group model test. Wu Xiaoping [8] used a layered shear soil box to carry out the shaking table test of an SSPSI for the first time in China, and the test verified the rationality of this soil box to eliminate the ‘model box effect’. After that, many domestic research institutions and scholars designed and manufactured this layered shear deformation soil box and achieved many research results [9,10,11]. Chau K T [12] found a possible failure form of a pile foundation via a shaking table test. This failure is caused by the impact between the pile foundation and the soil; that is, the failure is caused by inertial force, which may be one of the main forms of pile foundation failure in large earthquakes. Tokimatsua [13] conducted shaking table tests to study kinematic and inertial SSPSIs and found that if the natural period of the superstructure is greater than that of the soil, the phase of the kinematic and inertial interaction tends to be the same, and the internal force in the pile increases. The maximum value occurs when both the kinematic and inertial interactions reach their peak values in the same direction. Hokmabadi et al. [14] carried out shaking table tests with a layered shear box to investigate the effect of SSPSI on the dynamic response of superstructures with different heights. The experimental results indicate that the SSPSI increases the lateral displacement of the superstructure and that the higher the superstructure, the more obvious this effect is. In order to study the influence of SSPSI on the dynamic characteristics of a pile foundation system in liquefiable sand ground, Huang Zhanfang et al. [15] carried out the shaking table test of four cases: natural ground and ground reinforced by a pile foundation with a pile spacing of 3D, 3.5D, and 4D. The test results show that the liquefaction of base soil with reinforcement of the pile foundation lags behind that in natural ground, and the improvement of liquefaction resistance of reinforced foundation with pile spacing of 3D and 3.5D is more obvious. With the increase in pile spacing, the degree of improvement will be weakened. Li Xiaojun et al. [16] took the CAP1400 nuclear power plant structure as an example to conduct a shaking table test on a nuclear power plant structure in a non-rock site for the analysis of the applicability and seismic response characteristics of nuclear power plant structures under the non-rock site condition. The results show that the seismic motion in all directions is amplified in the model site, and the low frequency zone of the site response spectrum is greatly affected by the superstructure. Cracks appear in the site under the action of seismic motion lower than the reference, and the structure is separated from the soil under the action of seismic motion, meeting the reference. Jing Liping et al. [17] studied the dynamic response of a soil–pile foundation–nuclear island system by a shaking table test; analyzed the internal force distribution characteristics, deformation law and failure mode of a pile group foundation under a seismic load in a medium-soft soil site; and compared them with the numerical simulation results.
Compared to general building structures, nuclear islands have greater mass and stiffness. Therefore, the impact of nuclear islands on the seismic response of their pile foundations may be different from that of general building structures. Considering the importance of nuclear islands and the potential significant harm after damage, it is necessary to conduct research on their seismic performance. At present, due to the limitation of various factors and test conditions, there are relatively few large-scale shaking table test studies on the SSPSIs of nuclear power plants at home and abroad. The research results are more common in the studies of pile foundation theory and numerical simulation [18,19,20]. The stiffness ratio between soil and pile is a very important influence factor of the SSPSI The shaking table test of a single soil layer simulating medium-soft soil, medium-hard soil and hard soil is carried out so as to study the dynamic interaction law of a soil–pile–nuclear island containment structure and the failure mechanism and mode of the pile foundation in different subsoil layers under a horizontal seismic load. This paper presents a comparative analysis of the test results under medium-soft and hard soil site conditions in the series of tests, mainly analyzing the dynamic response law of the upper nuclear island structure as well as the deformation and internal force response law of the pile foundation. In addition, the seismic failure mechanism and mode of the pile group foundation are discussed.

2. The Facilities and Design of the Test

2.1. The Shaking Table System

The large-scale seismic simulation shaking table system (Yanjiao Park) of the Key Laboratory of Earthquake Engineering and Engineering Vibration, Institute of Engineering Mechanics, China Earthquake Administration has a table size of 5 m × 5 m, a bearing capacity of 30 t, a maximum displacement of ±0.5 m, a maximum velocity of 1.5 m/s and a maximum acceleration of 2 g.

2.2. The Layered Shear Soil Box

The soil container in the test is a self-developed three-dimensional laminated shear model box, as shown in Figure 1. The external size of the model box is 3.7 m in length, 2.4 m in width and 1.7 m in height. The box is composed of multi-layer square steel tube frames with equal spacing, and the spacing between the upper and lower frames is 20 mm. The natural frequency of the shear model soil box is 7.5 Hz, and the damping ratio is 0.226. The layered shear model box has completed many soil–structure dynamic interaction tests, and the results show that it has a good effect for boundary simulation [10].

2.3. Soil Model in the Test

The silted clay in a project site and the composite soil mixed with 20% quicklime were selected as the test soil for the simulation of the medium-soft and hard soil sites, respectively. The actual filling depth in the model box is 1.5 m. In order to ensure the uniformity of soil density and water content, the soil was artificially compacted and evenly sprinkled with each 0.1 m thickness soil filling, and then the density test and resonance column test of soil samples were conducted. The average density measured in laboratory test of the medium-soft soil is 1.70 g/cm3, while the hard soil is 1.75 g/cm3, and the shear wave velocities of the medium-soft and hard soil are 175 m/s and 300 m/s according to the resonance column test, respectively.

2.4. Model of the Pile Foundation and the Containment

According to the size of the model soil box in the test, the pile foundation is composed of the lower pile group and the upper embedded pile cap, and the surface of the pile cap is on an even height with the surface of the soil. The pile group consists of five piles arranged in a cross shape. The pile head is chipped after the pile group has been embedded, and then the upper pile cap is poured to simulate the pile cap connection mode of the actual site. The layout of the pile group is shown in Figure 2. The unit of the numbers in Figure 2 is millimeters, and ①–⑤ are serial number of piles. The length of the pile is 1.35 m, the diameter of the pile is 0.1 m, and there are four HRB335 longitudinal reinforcements with a diameter of 8 mm. The circular stirrups are arranged in a 100 mm interval with a diameter of about 4 mm. The pile spacing is 600 mm (six times the pile diameter), and the 20 mm thick steel plate set at the bottom of the pile is welded with the bottom of the model box to simulate the actual socketed pile stress. The plane size of the pile cap model is 1.9 m × 1.9 m, and the thickness is 0.15 m. The spacing of the internal HRB335 reinforcing bars with a diameter of 8 mm is 150 mm, which is configured as a double-layer and two-way steel mesh. The vertical reinforcing bars with hooks are arranged between the upper and lower layers of the steel mesh to enhance the integrity of the pile cap steel mesh. The C30 fine aggregate concrete was adopted to form the piles and the pile cap. The actual measured axial compressive strength of the concrete is 35.6 MPa, and the elastic modulus is 2.2567 × 10⁴ MPa.
The superstructure is composed of a nuclear island containment and a concrete baseplate, as shown in Figure 3. The unit of the numbers in Figure 3 is millimeters. The model is designed according to a 1/20 geometric scale and is made of steel concrete. The total height of the model is 1.769 m, and the height of the baseplate is 0.15 m. There is a barrier at every 0.4 m in the vertical direction of the model. The external diameter of the model is 1.5 m, while the internal diameter is 1.368 m. The inner and outer steel plates are pulled by bolts with a diameter of 4 mm and a spacing of 200 mm × 200 mm. For the convenience of subsequent analysis, the position of the upper surface on the pile cap in Figure 3 is defined as the first layer, and the positions of the three barriers from bottom to top are defined as the second, third, and fourth layer. The size and material of the model baseplate are consistent with those of the pile cap, and four high-strength bolts are used in the four corners of the baseplate to connect with the pile cap, as shown in Figure 4. The containment model is equipped with the clump weight to make its total mass reach about 104 kg.

2.5. The Sensors Layout and the Data Acquisition System

The main purpose of the sensor arrangement scheme is monitoring the dynamic response of piles under horizontal load input so as to study the seismic dynamic response and failure mechanism of the pile foundation. As shown in Figure 5, the sensors arranged on the piles are draw-wire displacement sensors and strain gauges. There are two kinds of strain gauges in the test: resistance strain gauges and fiber Bragg grating strain gauges. The draw-wire displacement sensors are arranged on piles 1# and 2#, the resistance strain gauges are arranged on piles 2# and 5#, and the fiber Bragg grating strain gauges are arranged on pile 3#. Moreover, accelerometers are arranged at the bottom of the nuclear island containment and on the internal partition plates so as to study the influence of the dynamic interaction of the soil–pile–superstructure system on the dynamic response of the superstructure.

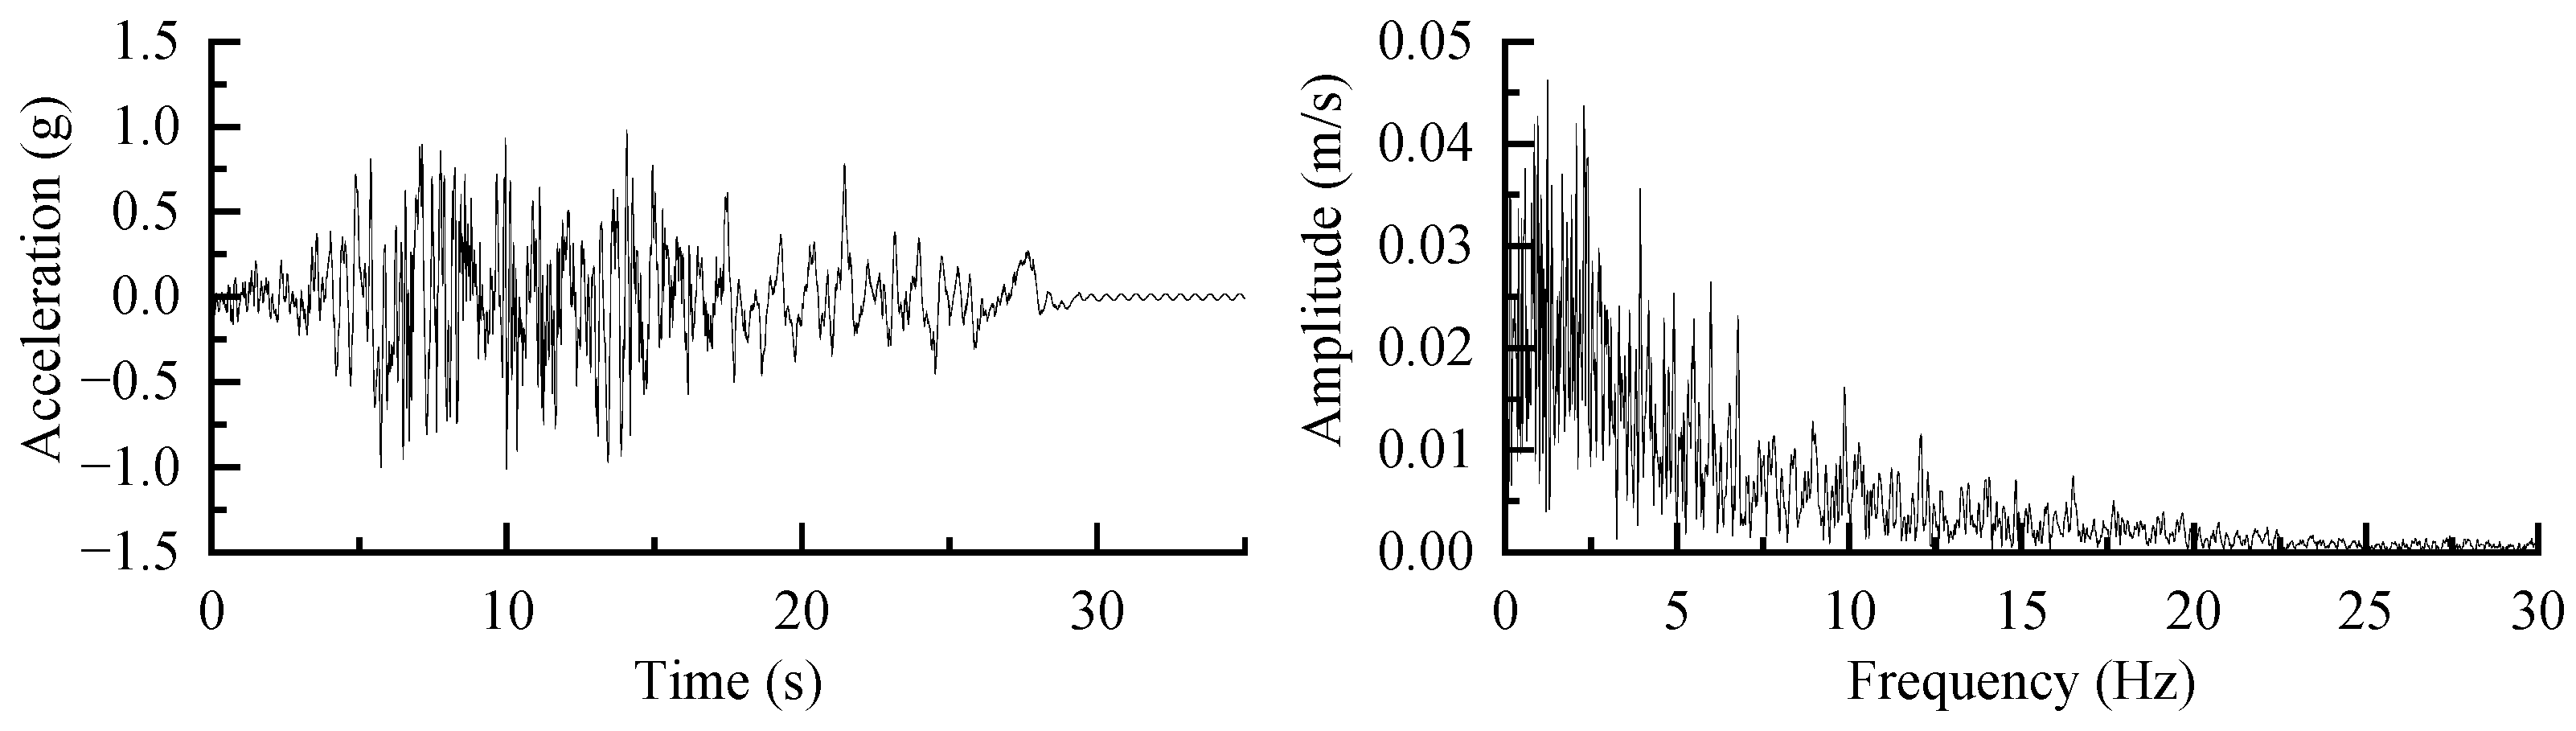
2.6. The Seismic Motion Input

The seismic simulation shaking table test for the soil–structure dynamic interaction under the condition of constant gravitational acceleration can only give qualitative dynamic response characteristics and laws because it cannot strictly meet the similarity relation. Since the main attention should be paid to the influence of far-field large earthquakes in the process of nuclear power plant site selection, a seismic motion time history manually fitted according to the US RG1.60 design response spectrum and two natural seismic records are selected for the test. The amplitude of the seismic motions input was adjusted, while the duration was not adjusted.
Due to the limitation of the length of this paper, only the test results of RG1.60 artificial seismic motion input are discussed here. The time history and spectrum characteristics of the seismic motion are shown in Figure 6. The RG1.60 seismic motion has more high-frequency components (10–20 Hz) compared to general natural seismic motions. Amplitudes of the seismic motion are 0.1 g, 0.2 g and 0.4 g in the test.

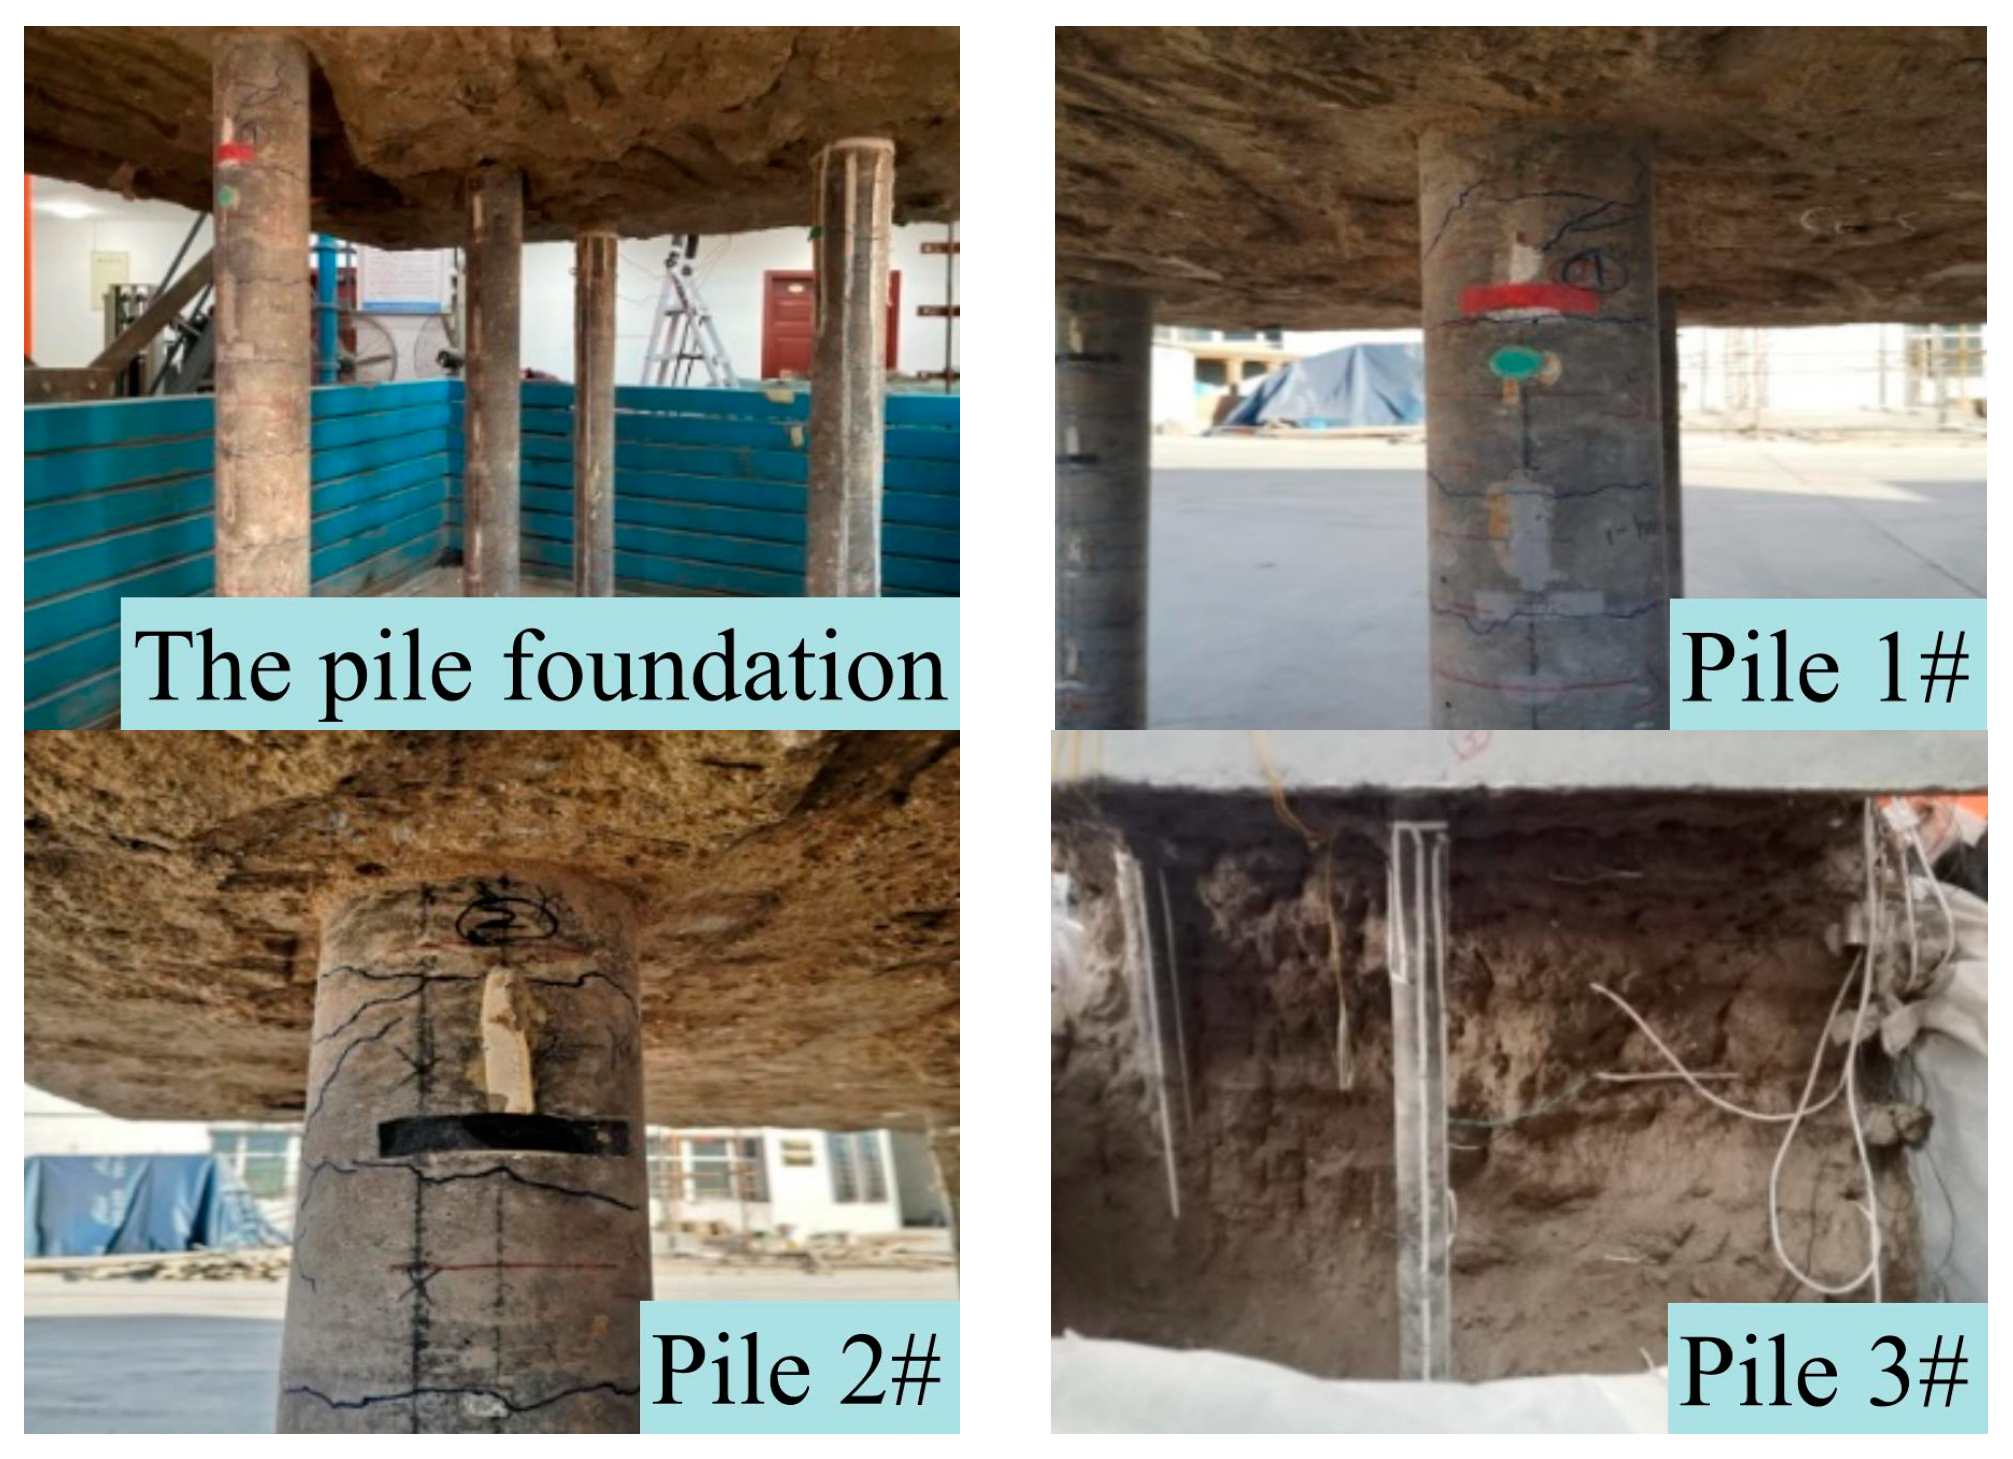
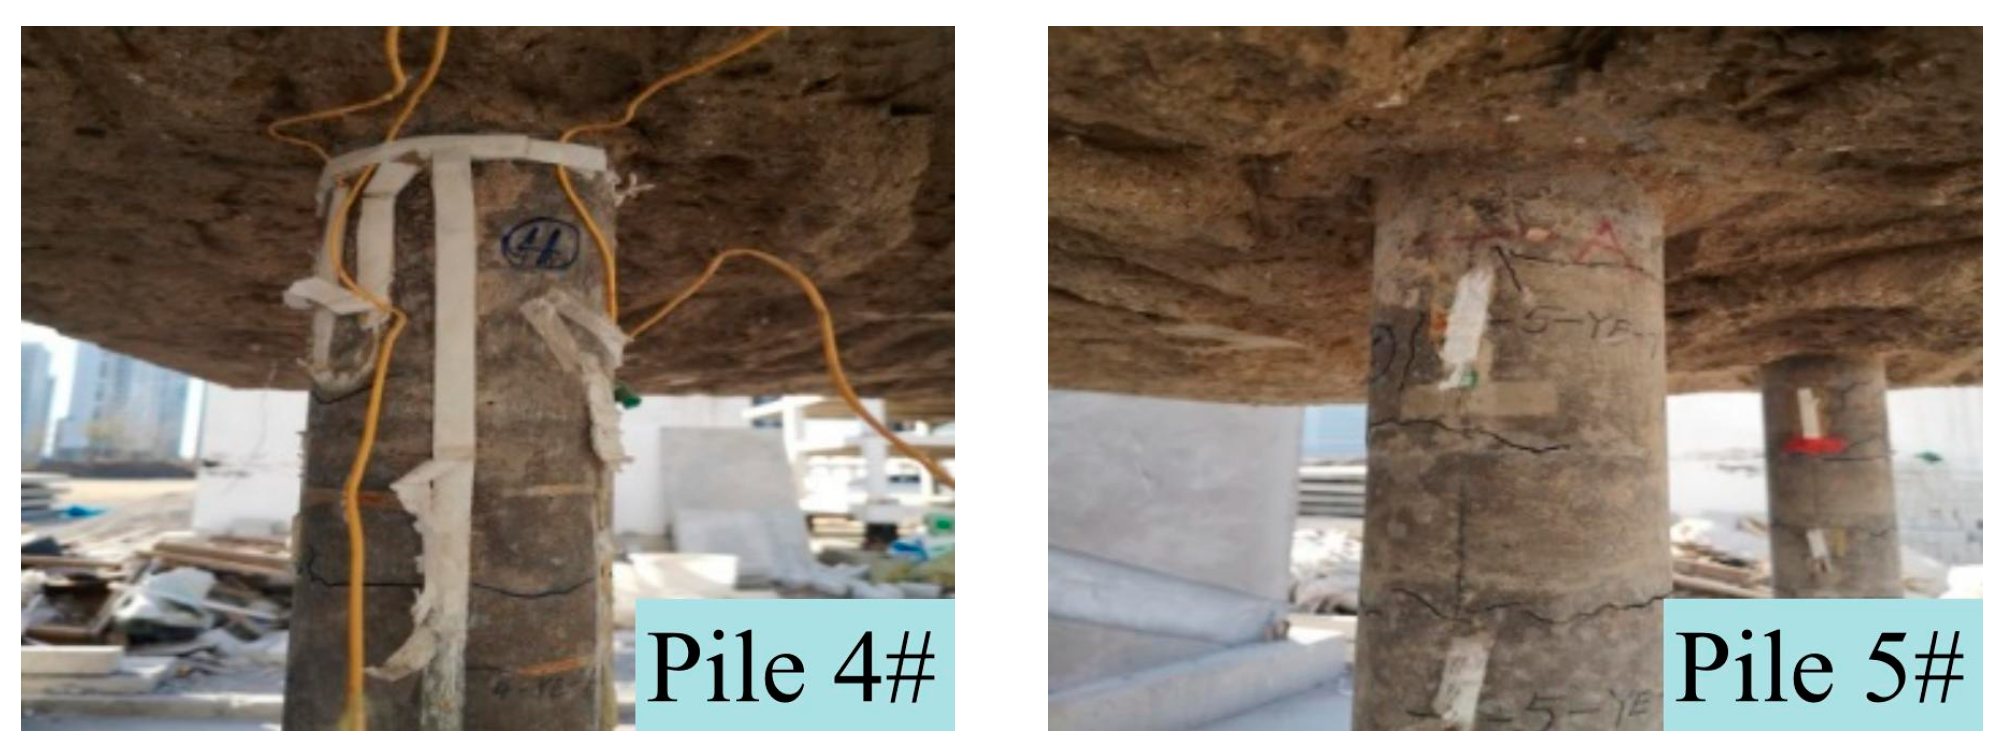
3. Macroscopic Phenomenon of Pile Foundation in the Test

The shaking table test of the soil–structure dynamic interaction system is different from that of the structural model because the structure is buried in the soil. During the test, the macroscopic test phenomenon of the pile foundation in soil cannot be observed intuitively. Although it can be determined indirectly whether the pile body is damaged by measurement results of the strain gauges arranged on the pile body during the test, the detailed and intuitive damage of the pile body can only be observed after all the test conditions and the excavation.
It can be found that the strain gauges on piles were unable to transfer data back when the input peak acceleration was 0.4 g in the test of the model with medium-soft soil. Based on this, it is determined that the pile body has been damaged, so the test is ceased. Then, the soil was excavated, and the macroscopic damage of piles was shown in Figure 7.
It can be seen from Figure 7 that damage occurs at the head of foundation piles, with failure modes of annular fracture, vertical and oblique cracks. Among them, the failure phenomenon at the head of piles 3# and 4# is obvious, part of concrete at the head of pile 2# has fallen off, and the vertical and oblique cracks appear at the heads of pile 1# and 5#, with obvious crack development trends. In addition, annular cracks appear at every 100 mm vertical interval of each pile body, and the position of the cracks is approximately in the middle of two stirrups. From the perspective of pile failure phenomenon, the damage degree from high to low is pile 3#, 4#, 2#, 5# and 1#. It is speculated that the damage of the pile foundation in the dynamic interaction of the system first occurs on the side stake on one side along the direction of motion, then passes to the side stakes in both sides normal to the direction of motion and the center stake, and finally passes the side stake in the other side along the direction of motion.
The strain gauges on piles can still work normally after seismic input with an amplitude of 0.4 g in the test of the model with hard soil, so the amplitude of the input motion was increased to 0.8 g gradually. Although the test results of the strain gauges on piles showed that the deformation of piles was still small, a vibration phenomenon with a large amplitude of the upper containment model was observed. The test was ceased for safety reasons. The macroscopic phenomenon of the piles after excavation is shown in Figure 8.
During the process of excavation, it was found that the base soil is hard and dense, and there is almost no separation between the base soil and the pile foundation. This is because the hard soil ground is a mixture composed of silted clay and quicklime, and the maintenance time from model forming to test conducting further increases the stiffness of the composite soil. There is no damage at the connection between the piles and the cap. After excavation, it is found that the pile body is basically intact, with small annular concrete cracks in the surface of the pile body.
From the macroscopic phenomenon of the pile foundation in the test, it can be seen that the stiffness of the base soil has a great influence on the damage degree of the pile foundation under the seismic load, and the damage of the pile foundation in the medium-soft soil site is serious.

4. Analysis of Test Results

Although the maximum acceleration amplitude in the hard subsoil test reached 0.8 g, only the law of system response in the artificial RG1.60 seismic motion input condition with amplitudes of 0.1 g, 0.2 g and 0.4 g was analyzed for comparison with the medium-soft subsoil test.

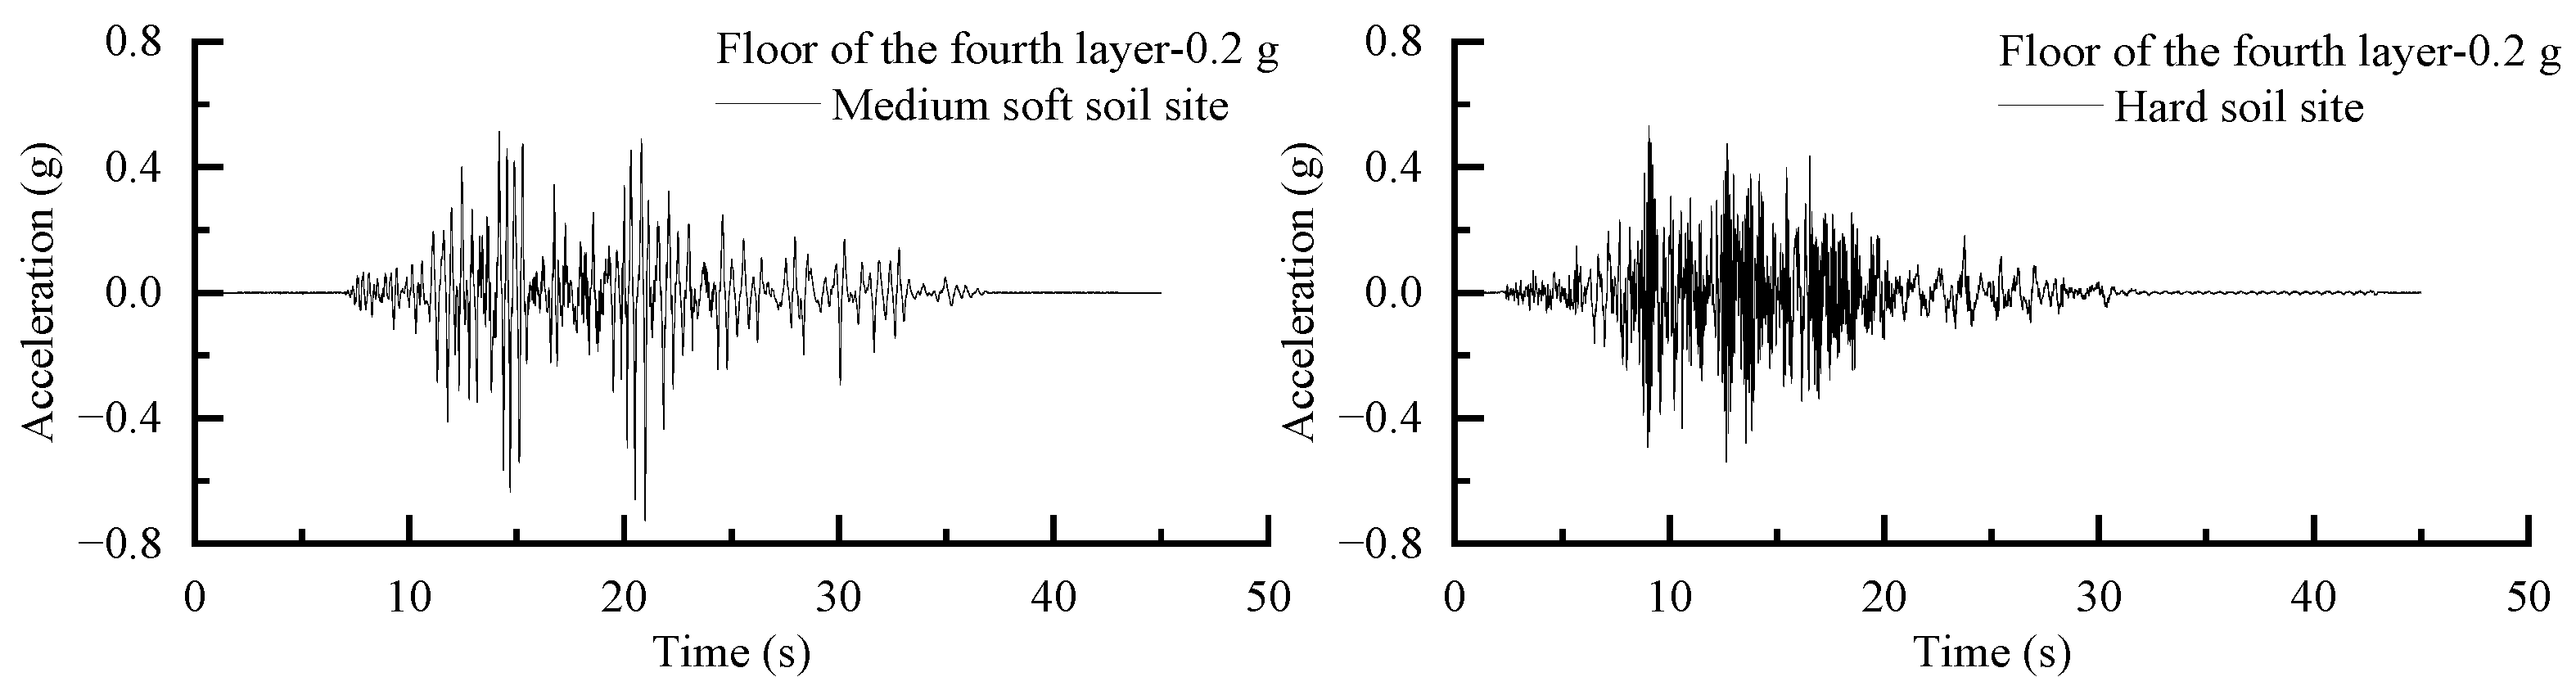
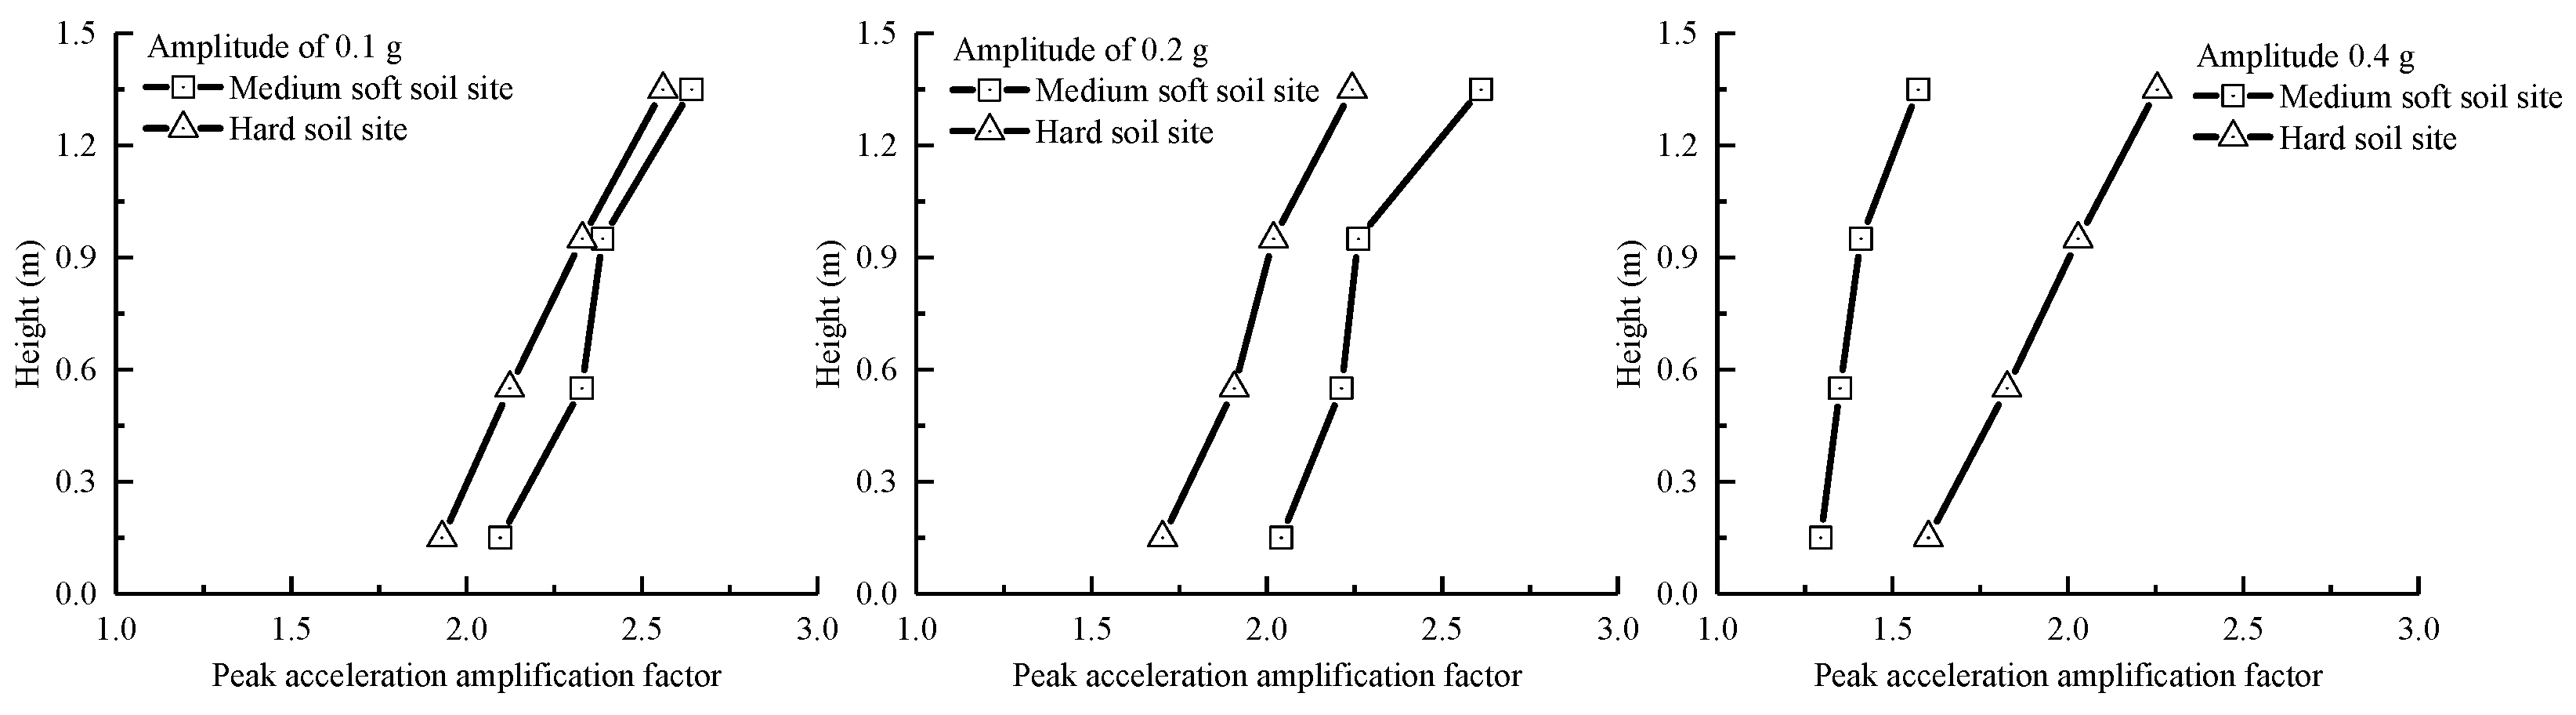
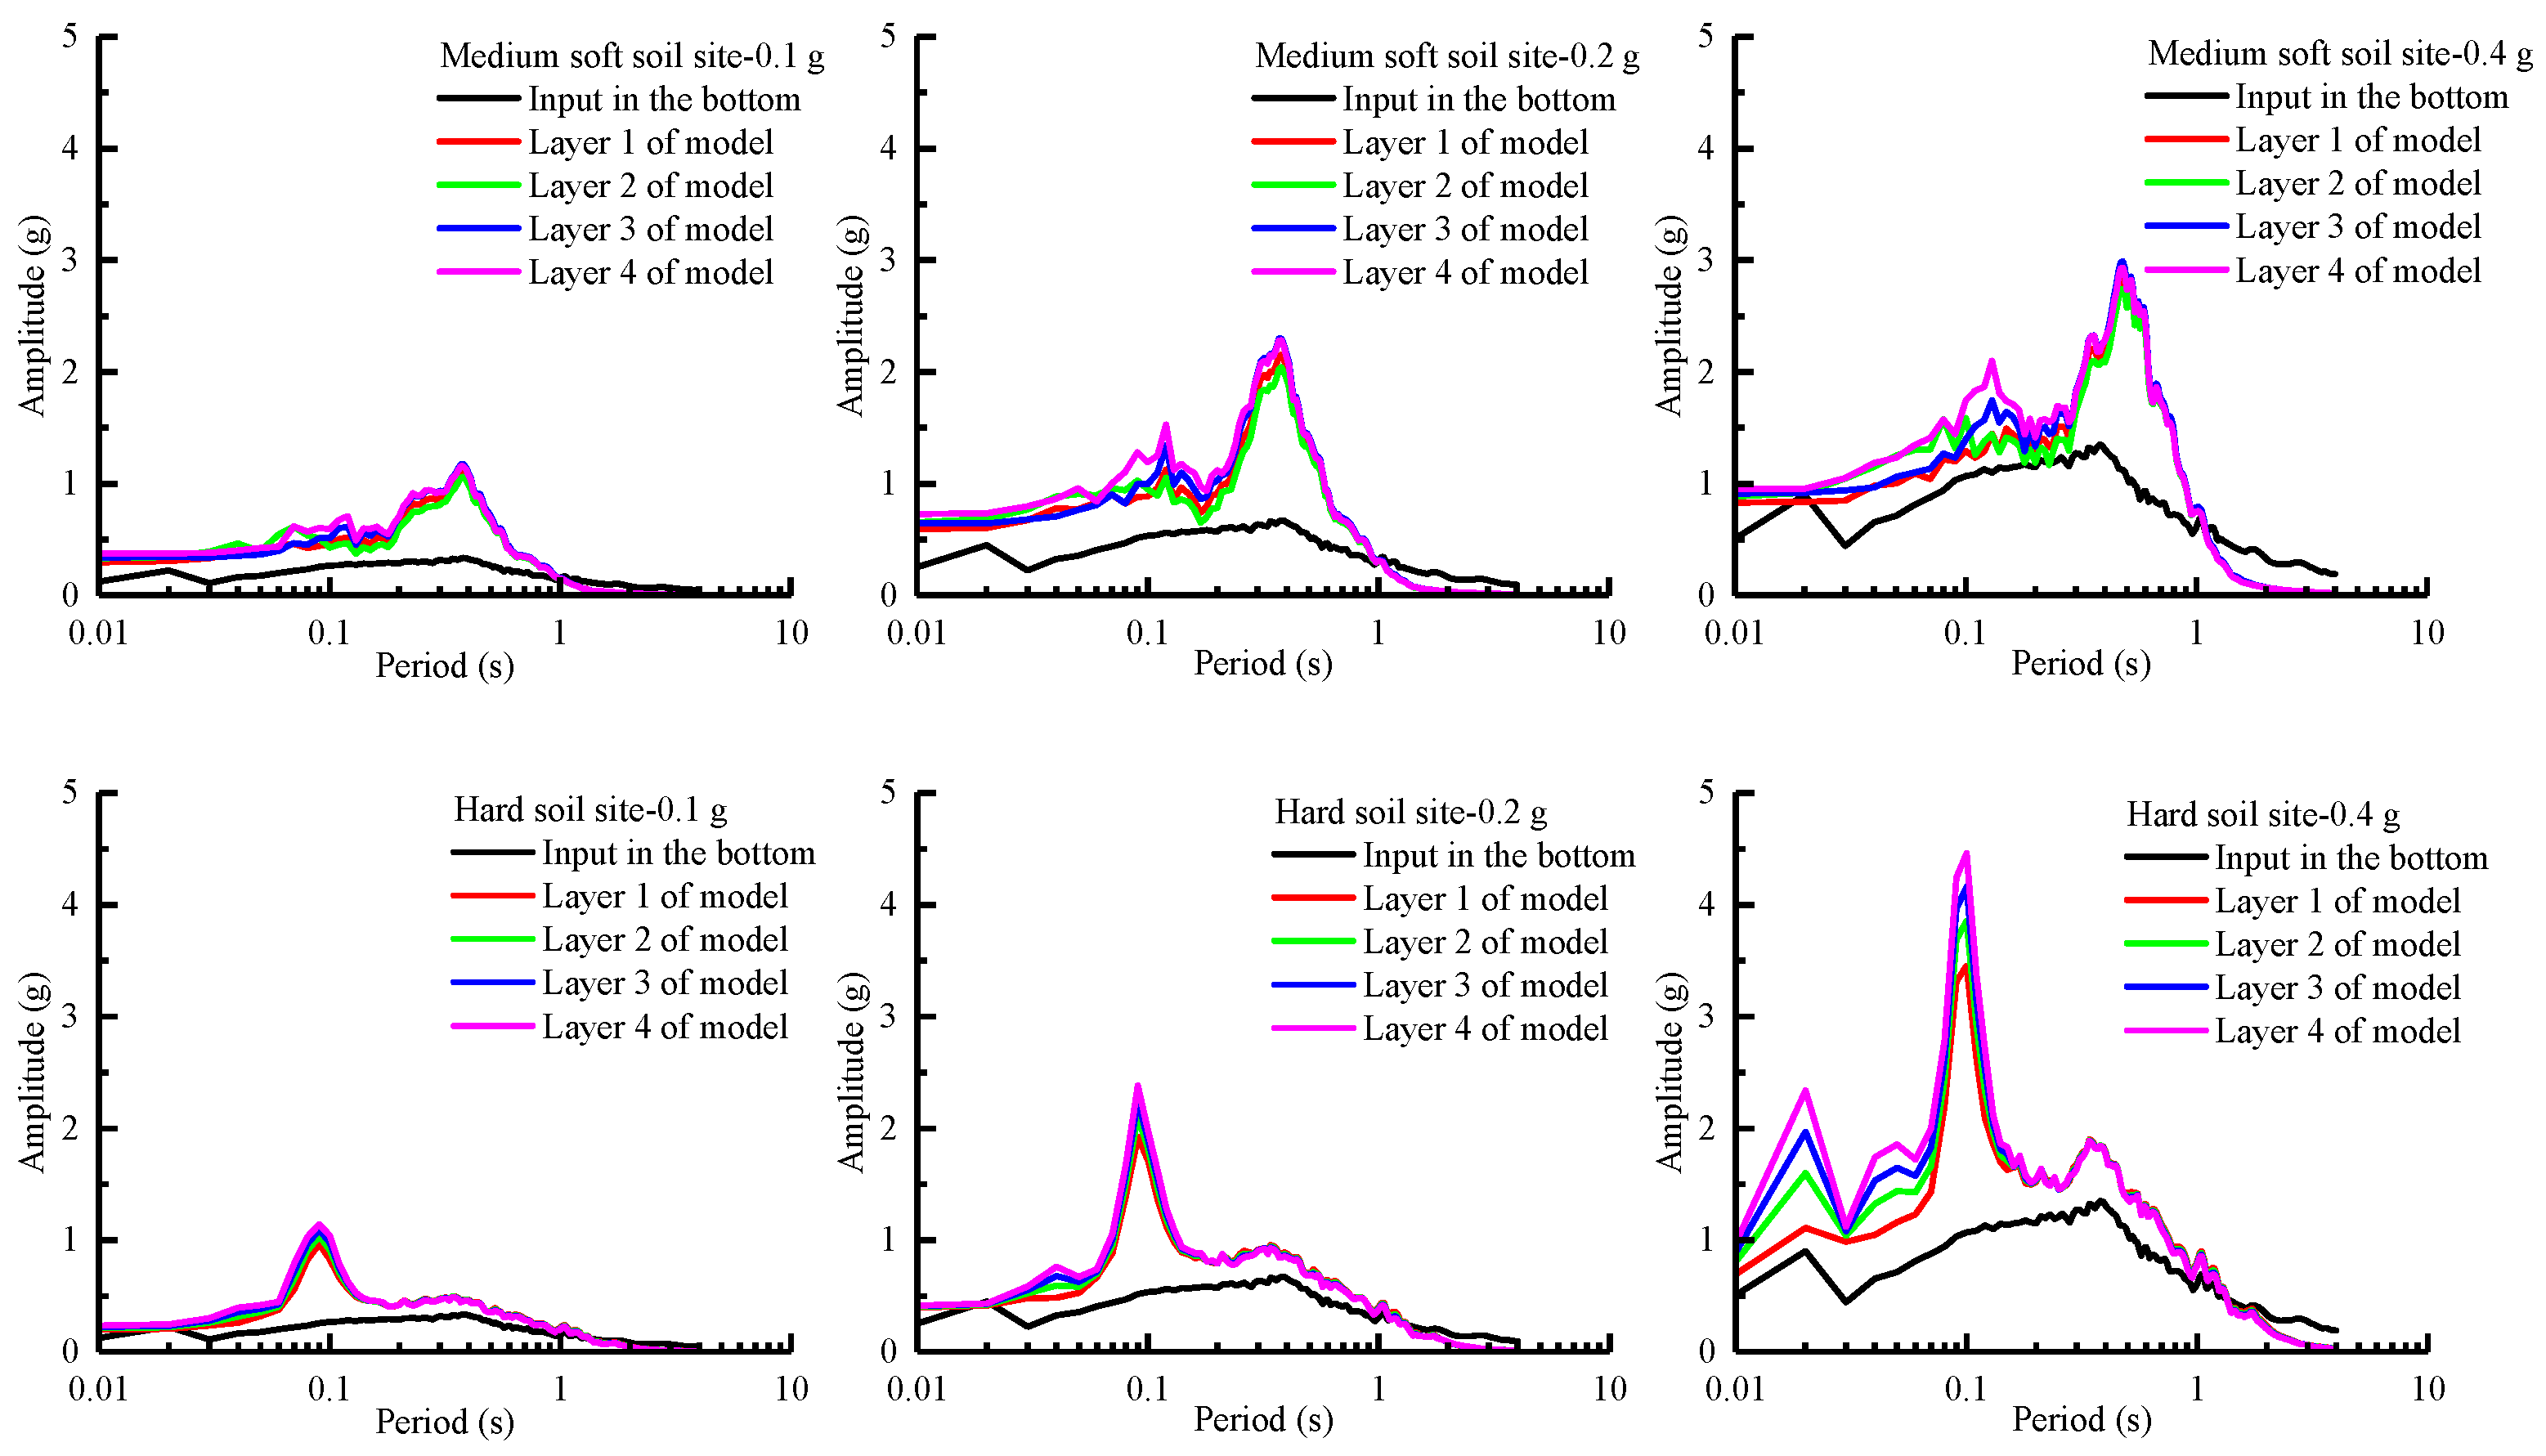
4.1. Acceleration Response of Nuclear Island Containment

Figure 9 shows the typical acceleration response time histories of the nuclear island model collected in the test. It can be seen intuitively from the diagram that high frequency components in the acceleration time history response of the superstructure are more abundant in the hard soil site than in the medium-soft soil site.
Figure 10 shows the amplification factor of the peak acceleration response at each layer in the nuclear island containment model relative to the input acceleration peak of the shaking table in conditions of two subsoils. It can be seen from the figure that the peak acceleration amplification factor of the nuclear island model on the medium-soft soil site is greater than that on the hard soil site when the amplitude of the seismic motion input is less than 0.2 g, indicating that the base soil is approximately in the elastic state when the amplitude of the input seismic motions is small and the response of the nuclear island structure on the site with smaller soil stiffness is larger. When amplitude of the seismic motion input is 0.4 g, however, the soil in medium-soft site reaches the strong nonlinear state, which has a greater dissipative effect on the energy of the input seismic motion, and the pile foundation is also destroyed, while the soil in the hard site is in the quasi-elastic state, which can transfer more energy of seismic motion, so the peak acceleration amplification factor of the nuclear island structure on the hard soil site is larger.
Figure 11 shows a comparison of the floor spectrum in the nuclear island containment model on two different base soils. It can be seen from the figure that the predominant period of the floor spectrum in the nuclear island structure is very close to that of the input seismic motion in the test, which is about 0.4 s, and the structure may have a resonance response when the input amplitude is 0.1 g and 0.2 g, while the predominant period of the floor spectrum is about 0.6 s, indicating that the soil has been destroyed, which makes the spectrum period of the superstructure longer when the input amplitude is 0.4 g in the soft soil site. In the case of 0.1 g, 0.2 g and 0.4 g inputs in the hard soil site, the period of the floor spectrum is basically about 0.1 s, far away from the predominant period of the input seismic motion. From the floor spectrum of the nuclear island structure, it can be found that properties of the soil around the pile foundation have a significant impact on the response characteristics of the superstructure. In addition, it also shows that the reason for macroscopic failure of the pile foundation in the test is mainly the small stiffness of the medium-soft soil and the weak constraint on the pile foundation. Furthermore, the natural period of the system is close to the predominant period of the input seismic motion, which may produce a resonance effect and cause serious damage to the pile foundation. Nevertheless, in the hard soil site, the stiffness of the soil is large, and the constraint effect on the pile foundation is strong. Moreover, the natural period of the system is quite different from the predominant period of the input seismic motion, and no resonance phenomenon occurs in the test with the hard soil model. Therefore, the pile foundation in the hard soil site remains intact.

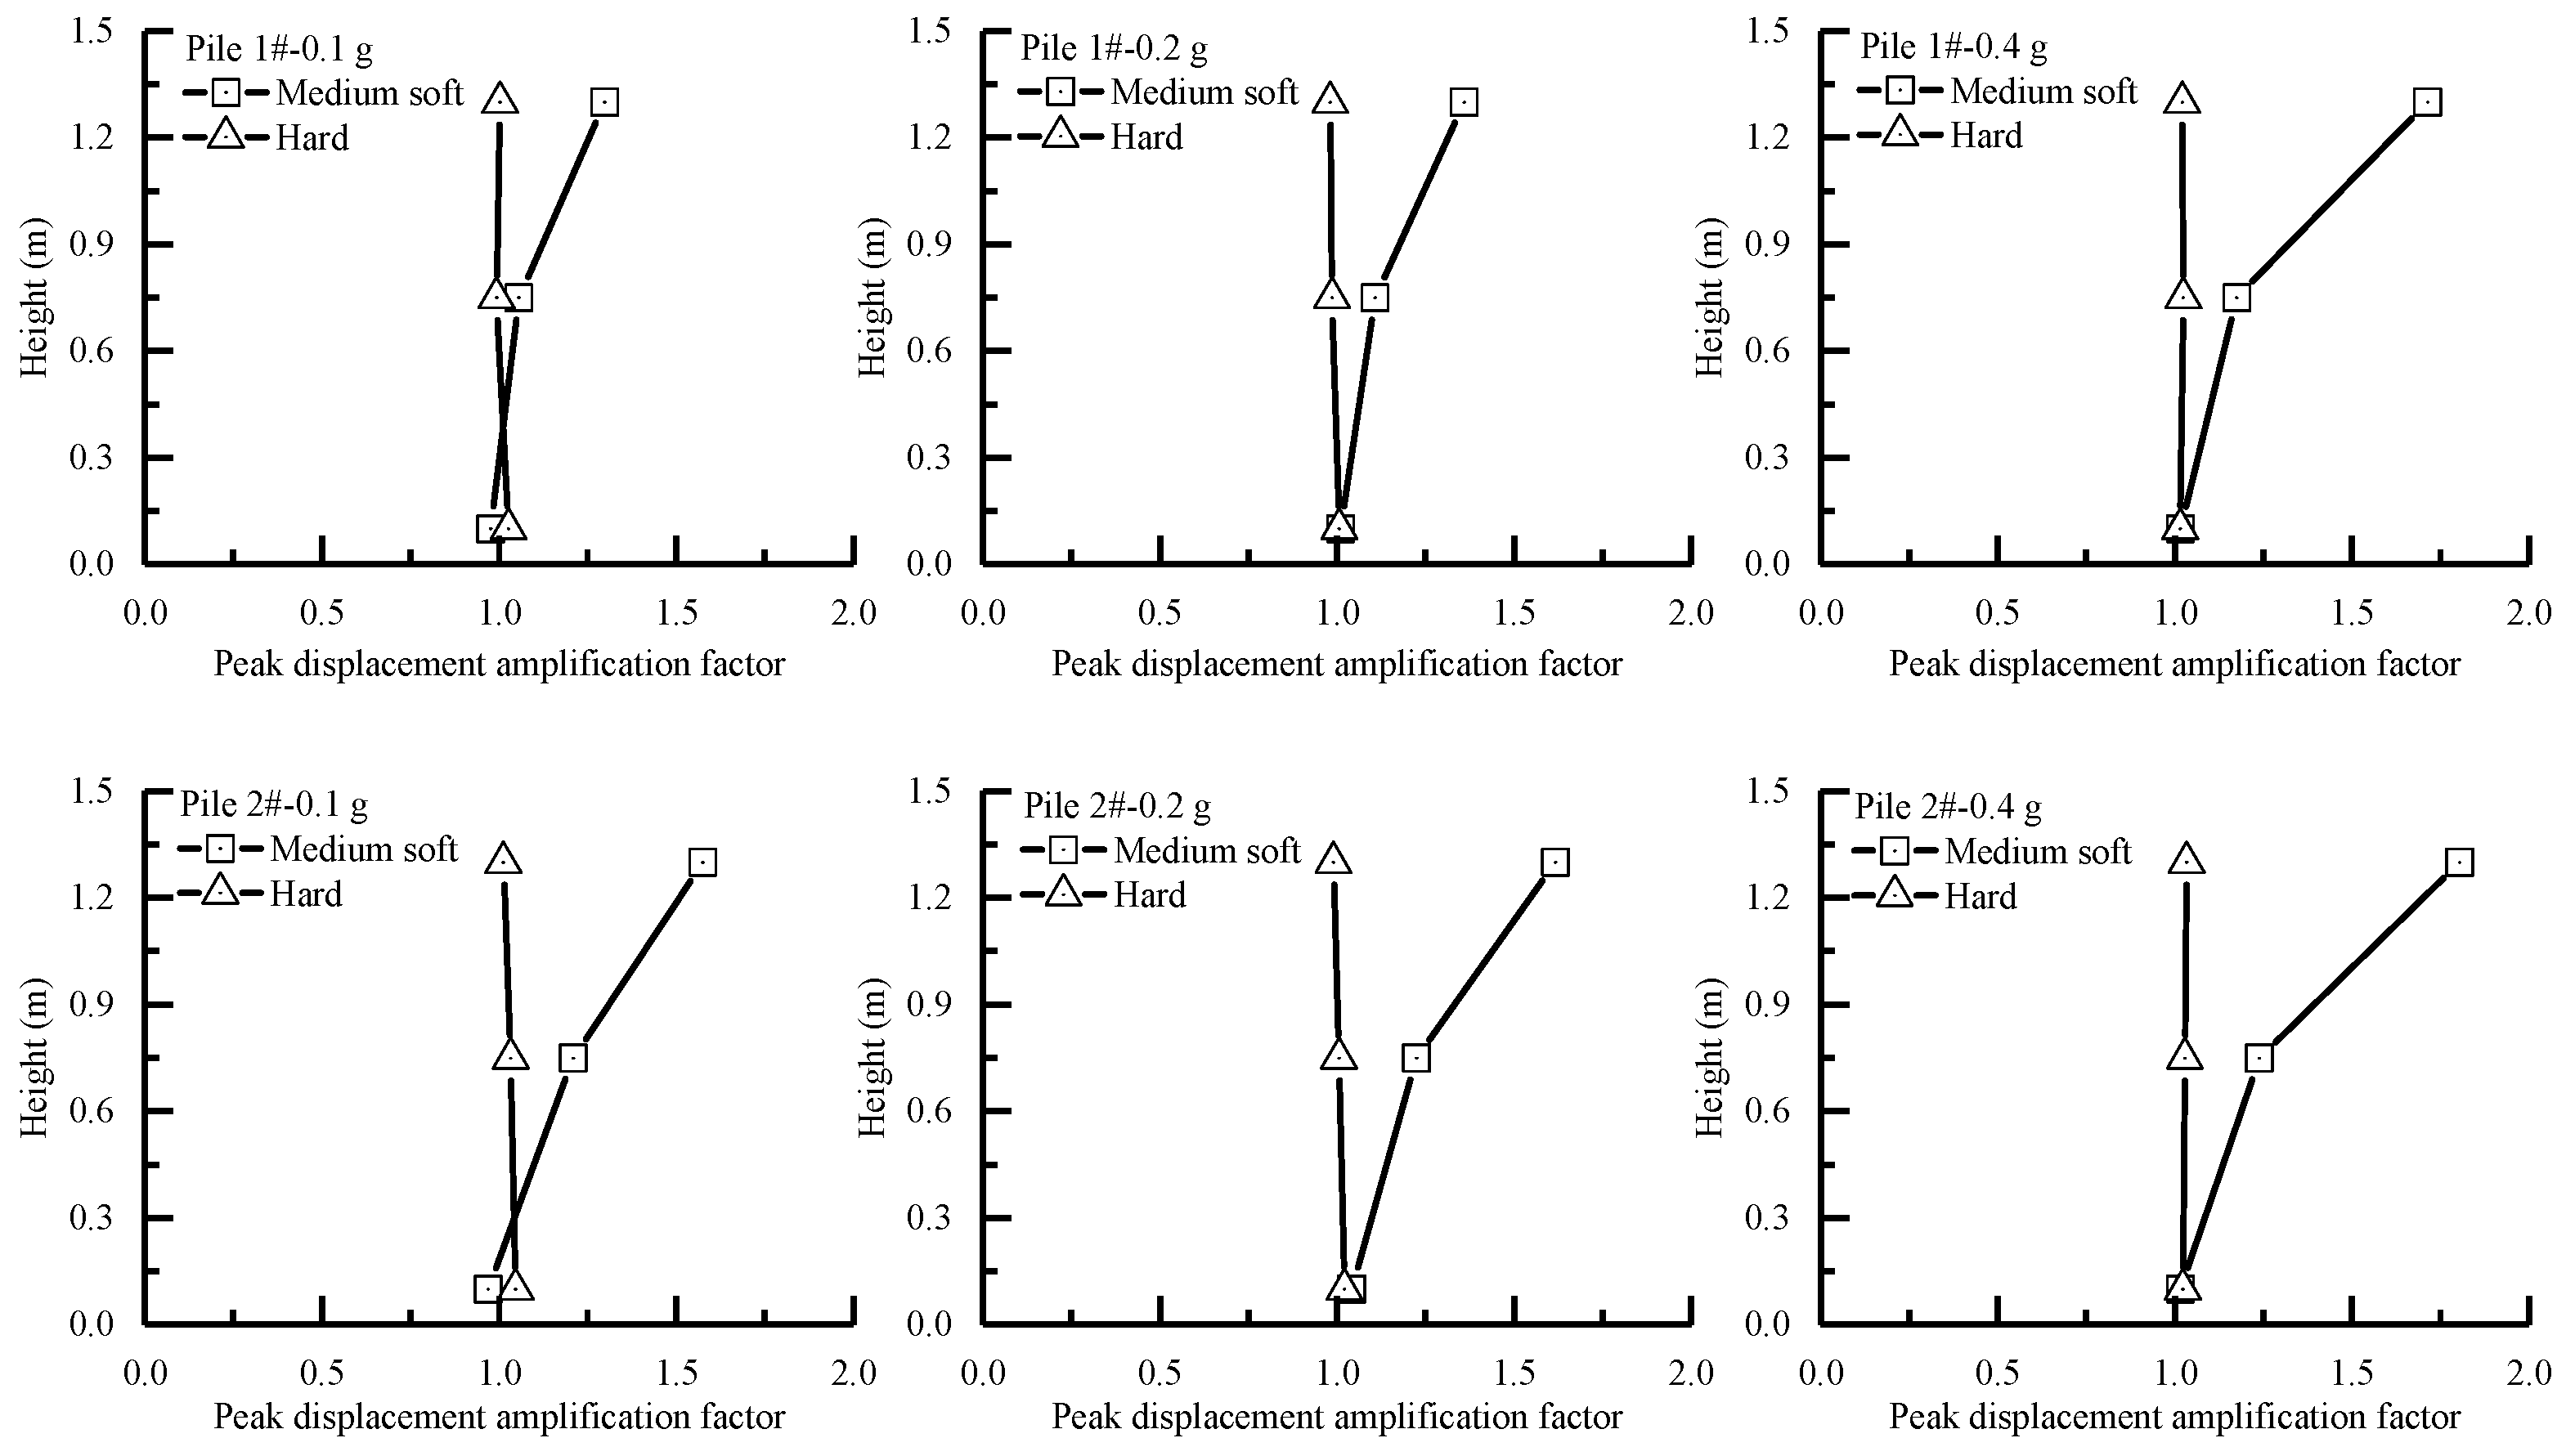
4.2. Displacement Response of Pile Foundation

Figure 12 shows the comparison of the peak displacement amplification factors along the height of the two piles (pile 1# and pile 2#) measured by the draw-wire displacement sensors in the cases of the two different sites. It can be seen from the figure that the peak displacement amplification factors of the two piles in the medium-soft soil site condition are larger than those in the hard soil site condition regardless of the input seismic motion amplitude, the peak displacement of piles increases with the increase in the height, which is largest in the pile head, and the deformation of the piles is also great in the medium-soft soil site condition, while the peak displacements of piles change little with the height in the hard soil site condition. This indicates that the soil has little constraint on the deformation of the pile body when the site soil is soft. It is easy to show the separation phenomenon between pile body and soil so that the displacement and deformation of the pile body are large, and the pile foundation failure occurs.

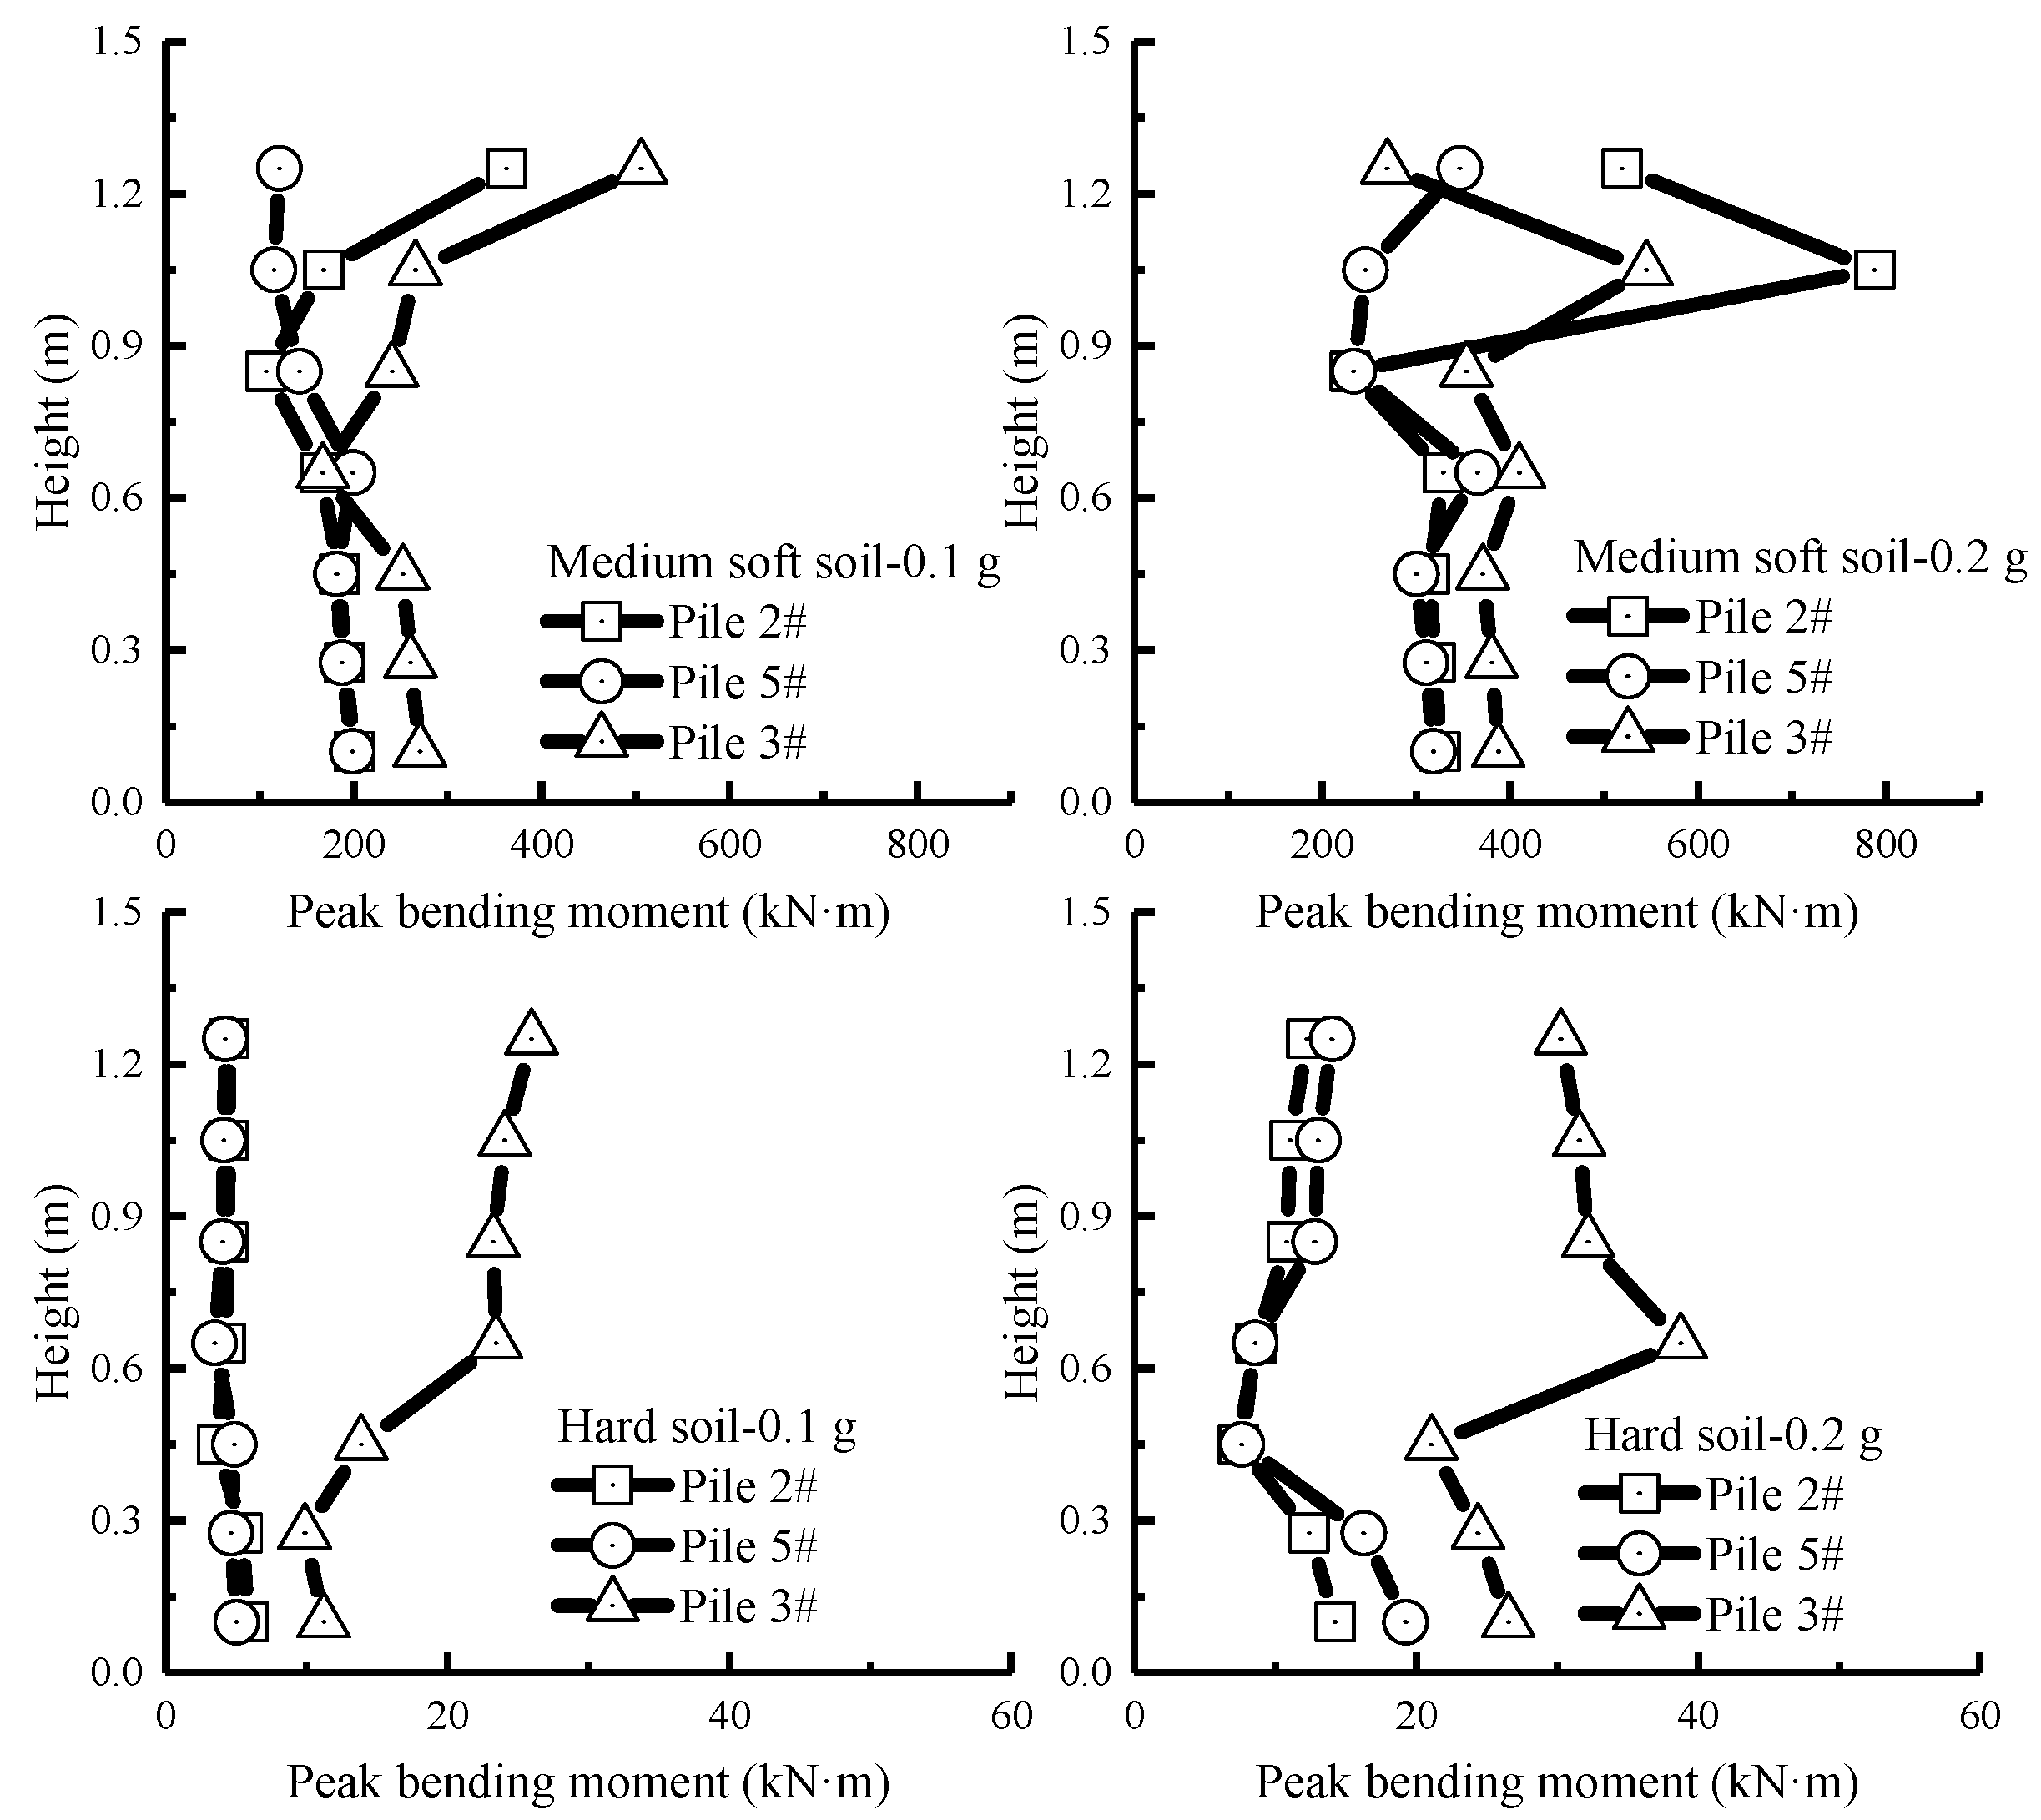
4.3. Bending Moment Response of Pile Foundation

Figure 13 shows the comparison of the peak bending moment envelope diagram of three piles (pile 2#, pile 3# and pile 5#) in two site soil conditions. The bending moment of piles is calculated according to Formula (1) with the strain measured by the strain gauges on piles. Since the pile foundation has been damaged in the medium-soft soil site condition when the input seismic motion amplitude reaches 0.4 g, only the peak bending moment in conditions of 0.1 g and 0.2 g amplitude seismic motion input is compared in Figure 13.
M = ε 1 ε 2 D × E I
where M is the bending moment of the pile, ε 1 and ε 2 are bending strains on both sides of the pile body, D is the pile diameter, and E I is the bending stiffness of the pile section.
The following can be seen from Figure 13: (1) In the condition of the medium-soft soil site, the maximum peak bending moment of piles 2# and 3# appears at the pile head, while that of pile 5# appears at the middle of the pile when the input amplitude is 0.1 g, and the maximum peak bending moment of piles 2# and 3# moves down to the upper part of the pile with a height of about 1.05 m, while that of pile 5# still appears in the middle of the pile, but the peak bending moment at the pile head also increases significantly when the input amplitude is 0.2 g. (2) In the condition of the hard soil site, the maximum peak bending moment of piles 2# and 5# appears at the lower part of the pile, with a height of 0.275 m and 0.45 m, respectively, while that of pile 3# appears at the middle part of the pile, with a height of 0.65 m when the input amplitude is 0.1 g, and the position of the maximum peak bending moment occurrence remains unchanged. Furthermore, the peak bending moment at the upper part of piles 2# and 5#, with a height of 0.85 m, increases significantly when the input amplitude is 0.2 g. (3) In the condition of the medium-soft soil site, the order of the peak bending moment value at the three piles’ heads is pile 3# > pile 2# > pile 5# when the input amplitude is 0.1 g, while the order is pile 2# > pile 5# > pile 3# when the input amplitude is 0.2 g. In the condition of the hard soil site, the peak bending moment value of pile 3# is largest in the three piles regardless of the input magnitude. (4) With the same input seismic motion amplitude, the peak bending moment of each pile in the medium-soft soil site condition is greater than that in the hard soil site condition, which is consistent with the analysis results of the pile displacement above and shows the reliability of the test results of draw-wire displacement sensors used on piles.
From the above analysis, it can be seen that the peak bending moment of the end-bearing pile group foundation under the action of seismic motion is affected by the hardness of the site soil and the position of the pile in the pile group due to the soil–pile–superstructure dynamic interaction. Specifically, the following can be concluded: (1) In the medium-soft soil, the deformation of the pile body is large, so the peak bending moment of the pile body is large, too. The maximum bending moment of the pile body generally appears at the pile head, which is also proved by the serious damage phenomenon at the pile head after the test. Conversely, in the hard soil, both the deformation and the peak bending moment of the pile body are small. The peak bending moment generally appears in the middle or lower part of the pile body. (2) The stress of the side piles in the pile group (such as pile 3#) is the largest. When the side piles are damaged, the stress of the middle side pile (such as pile 2#) increases significantly. Therefore, the failure order of the piles is judged as follows: the side pile, the middle side pile and the central pile. This order is consistent with the analysis results of the macroscopic failure phenomenon of the pile foundation above.

5. Numerical Simulation

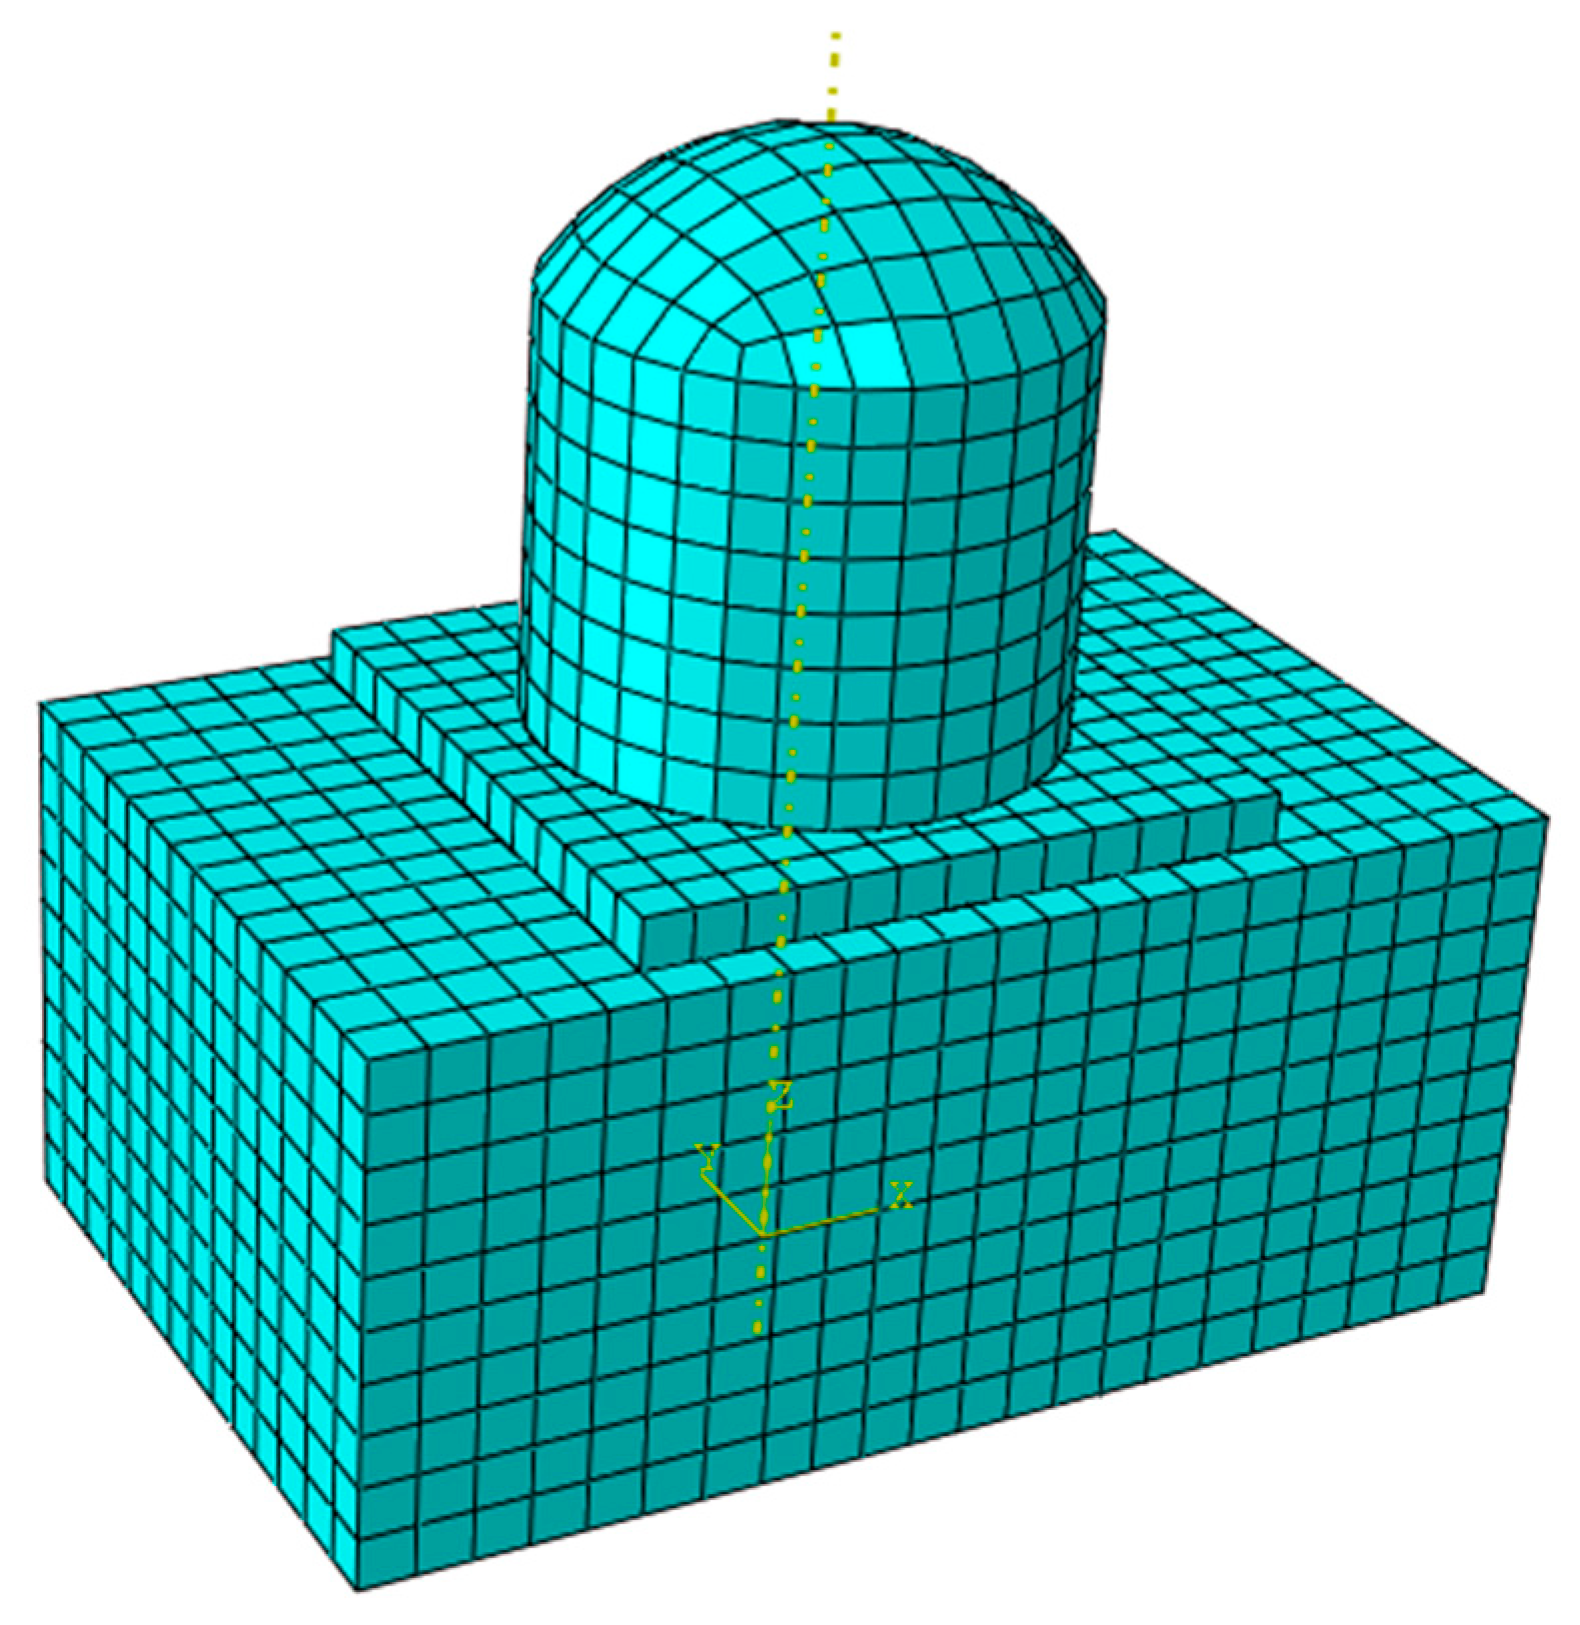
5.1. The Finite Element Model

For further analysis, a finite element model of the medium-soft soil–pile group–nuclear island system was established. The size and material of the finite element model are consistent with those of the shaking table test model. Except that the reinforcement in the pile foundation was built with two-node rod elements, the rest of the model was built with eight-node solid elements, as shown in Figure 14.
The Mohr–Coulomb constitutive model was adopted for the soil, the plastic damage model was adopted for the pile concrete, and the ideal elastic–plastic constitutive model was adopted for the steel bars. Due to the high stiffness of the pile cap and nuclear island, and because the deformation during the test was very small, both were modeled using linear elastic constitutive models. The parameters of each material in the finite element model are shown in Table 1, Table 2, Table 3 and Table 4.
In the finite element model, the pile foundation reinforcement was placed inside the pile with embedded constraints. Binding contact was adopted between the pile and the pile cap. Normal hard contact and tangential penalty contact were adopted between the soil and the pile foundation. The friction coefficient was set to 0.577. Binding contact was set between the nuclear island containment and the baseplate and between the baseplate and the pile cap. The side boundary of the model adopted the degree of freedom binding boundary, and the bottom boundary adopted the acceleration input boundary. Then, the RG1.60 seismic motion with an amplitude of 0.4 g was input into the model.

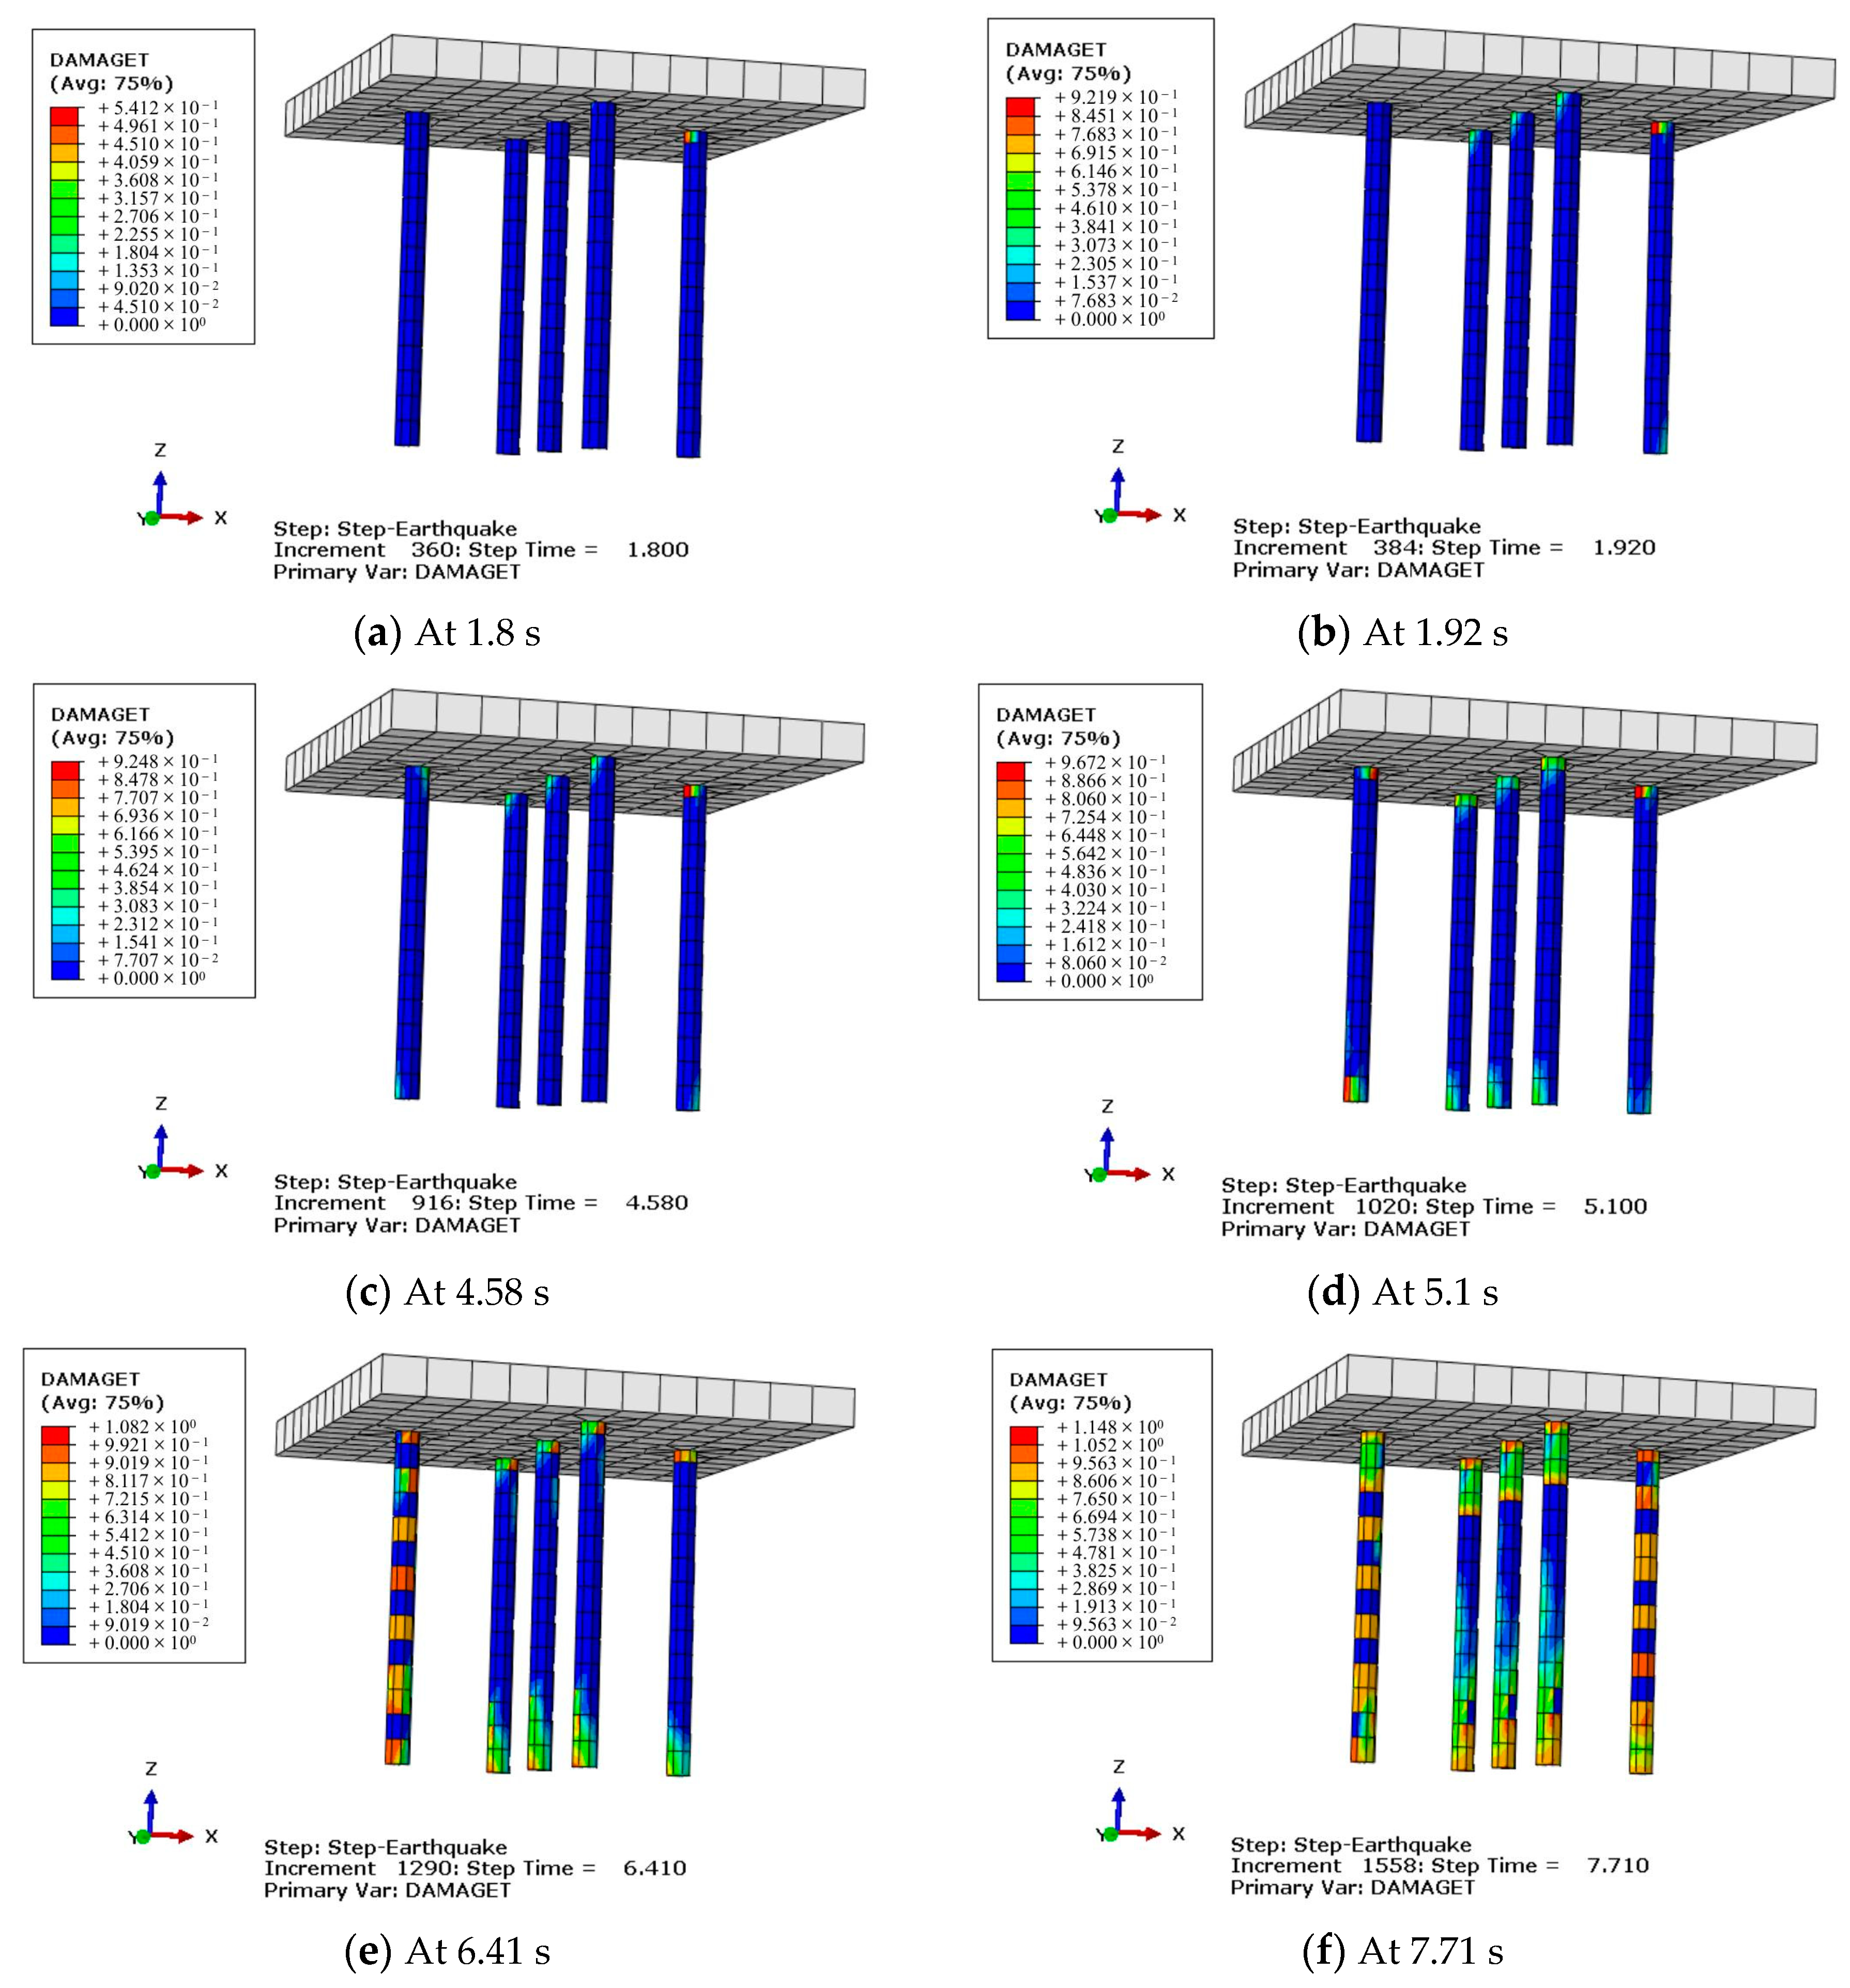
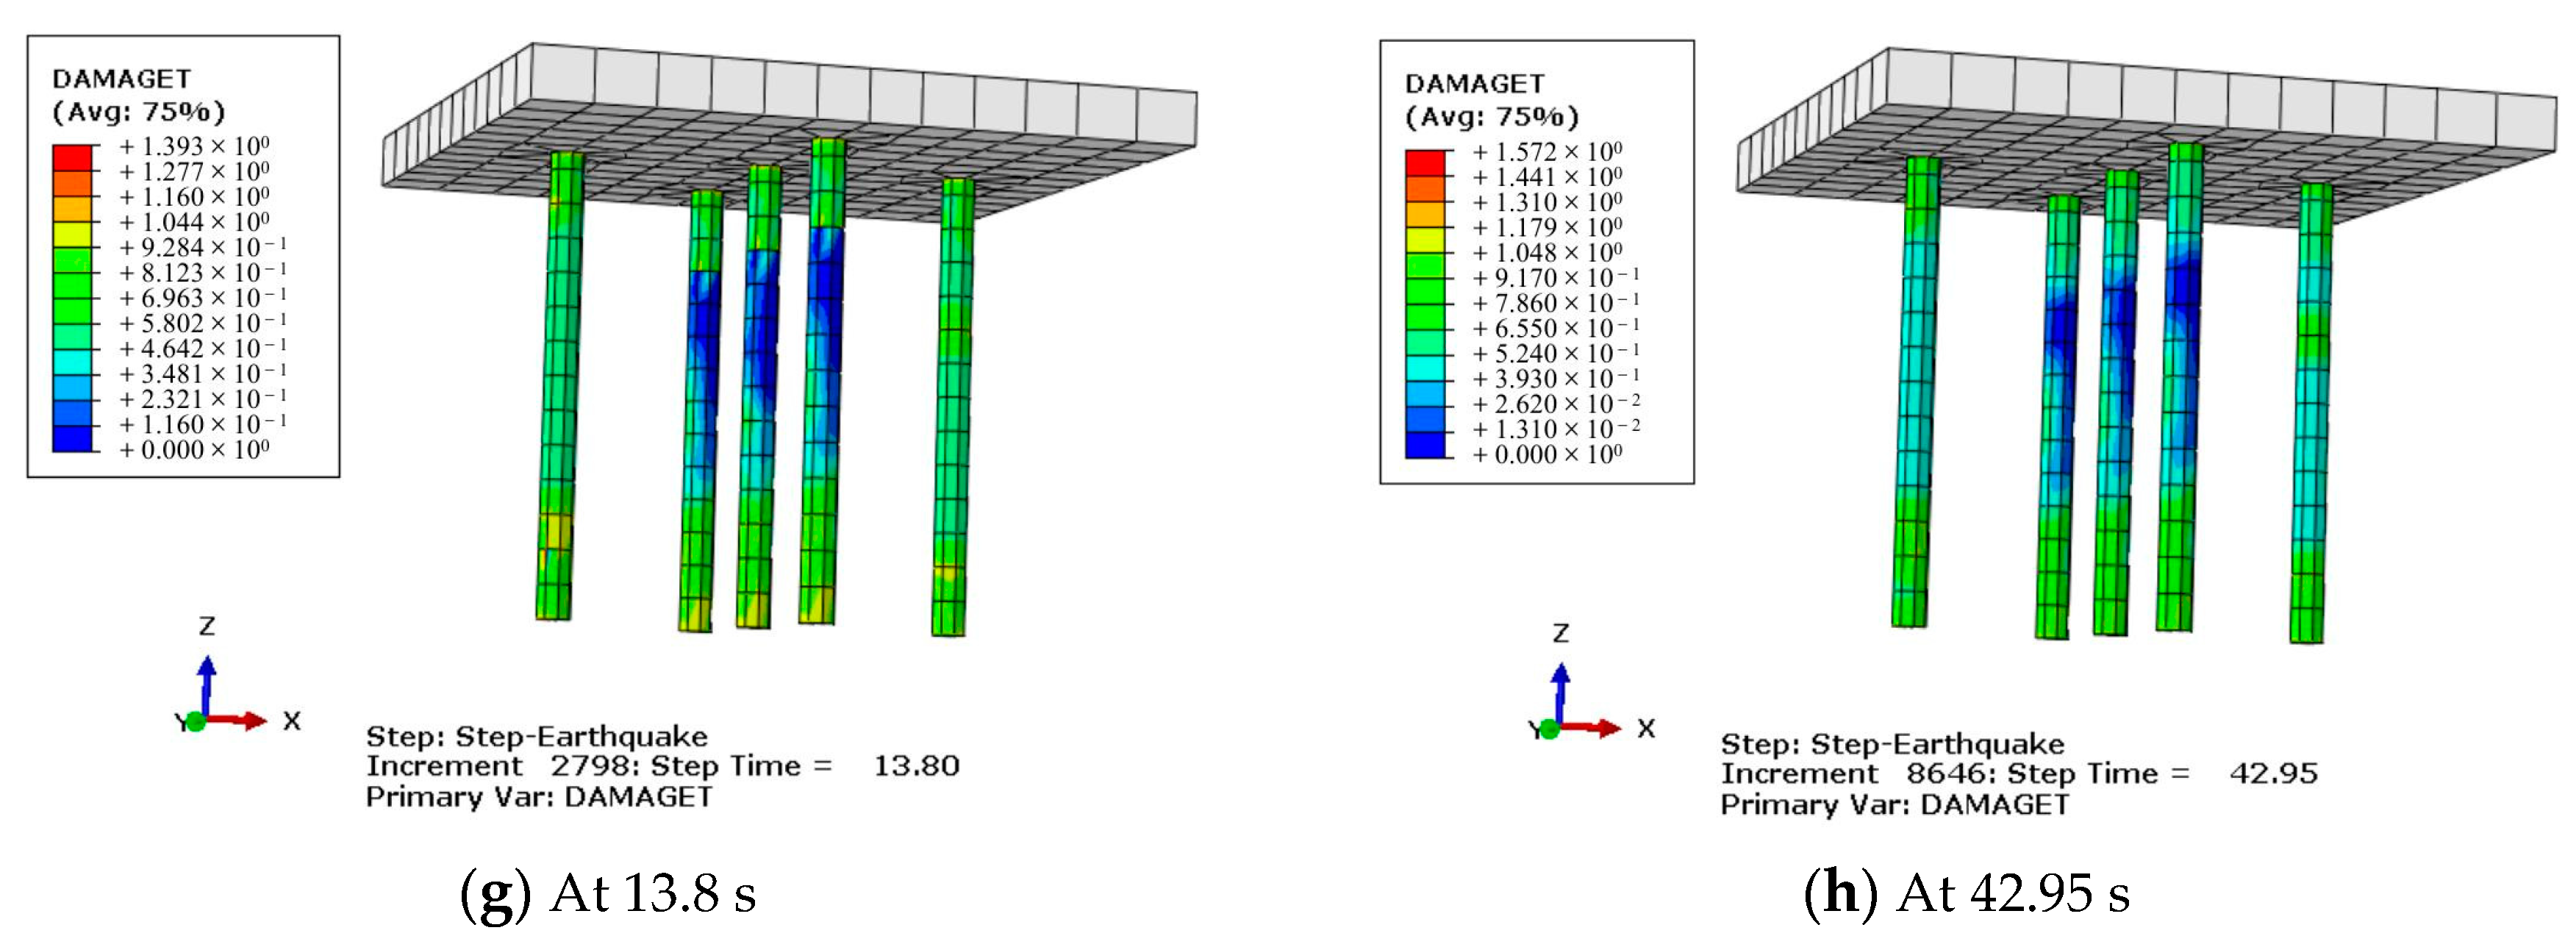
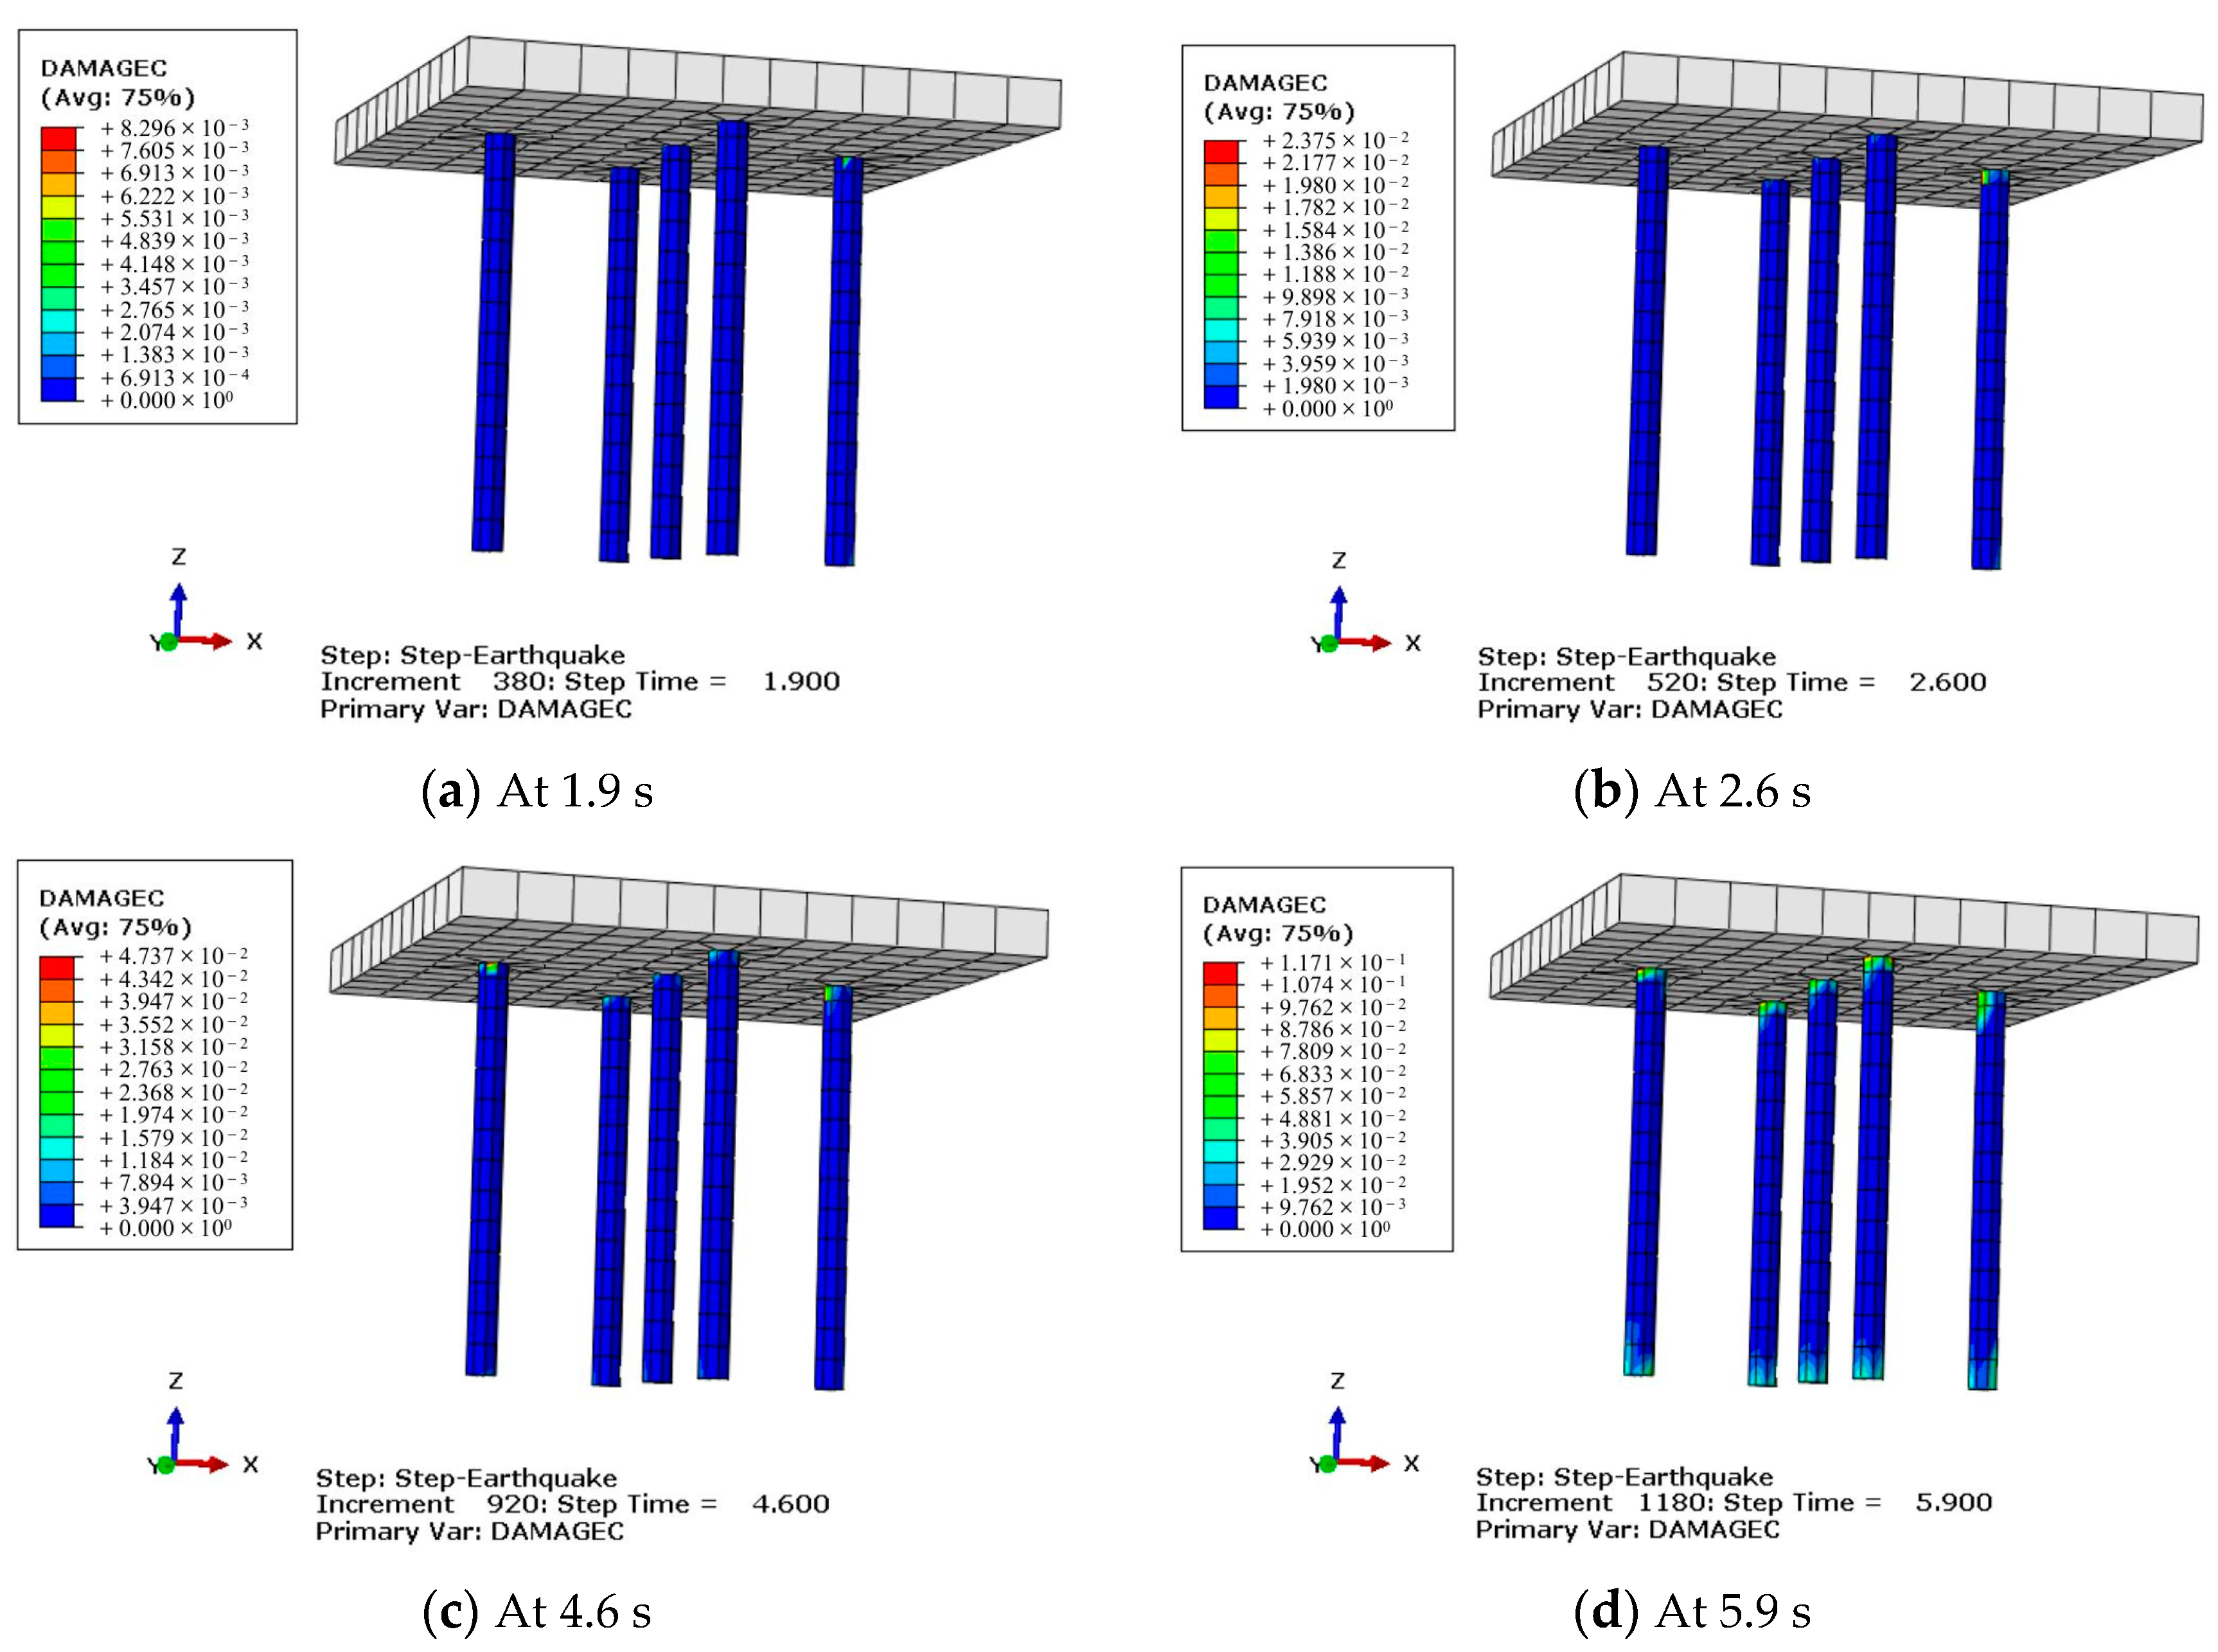
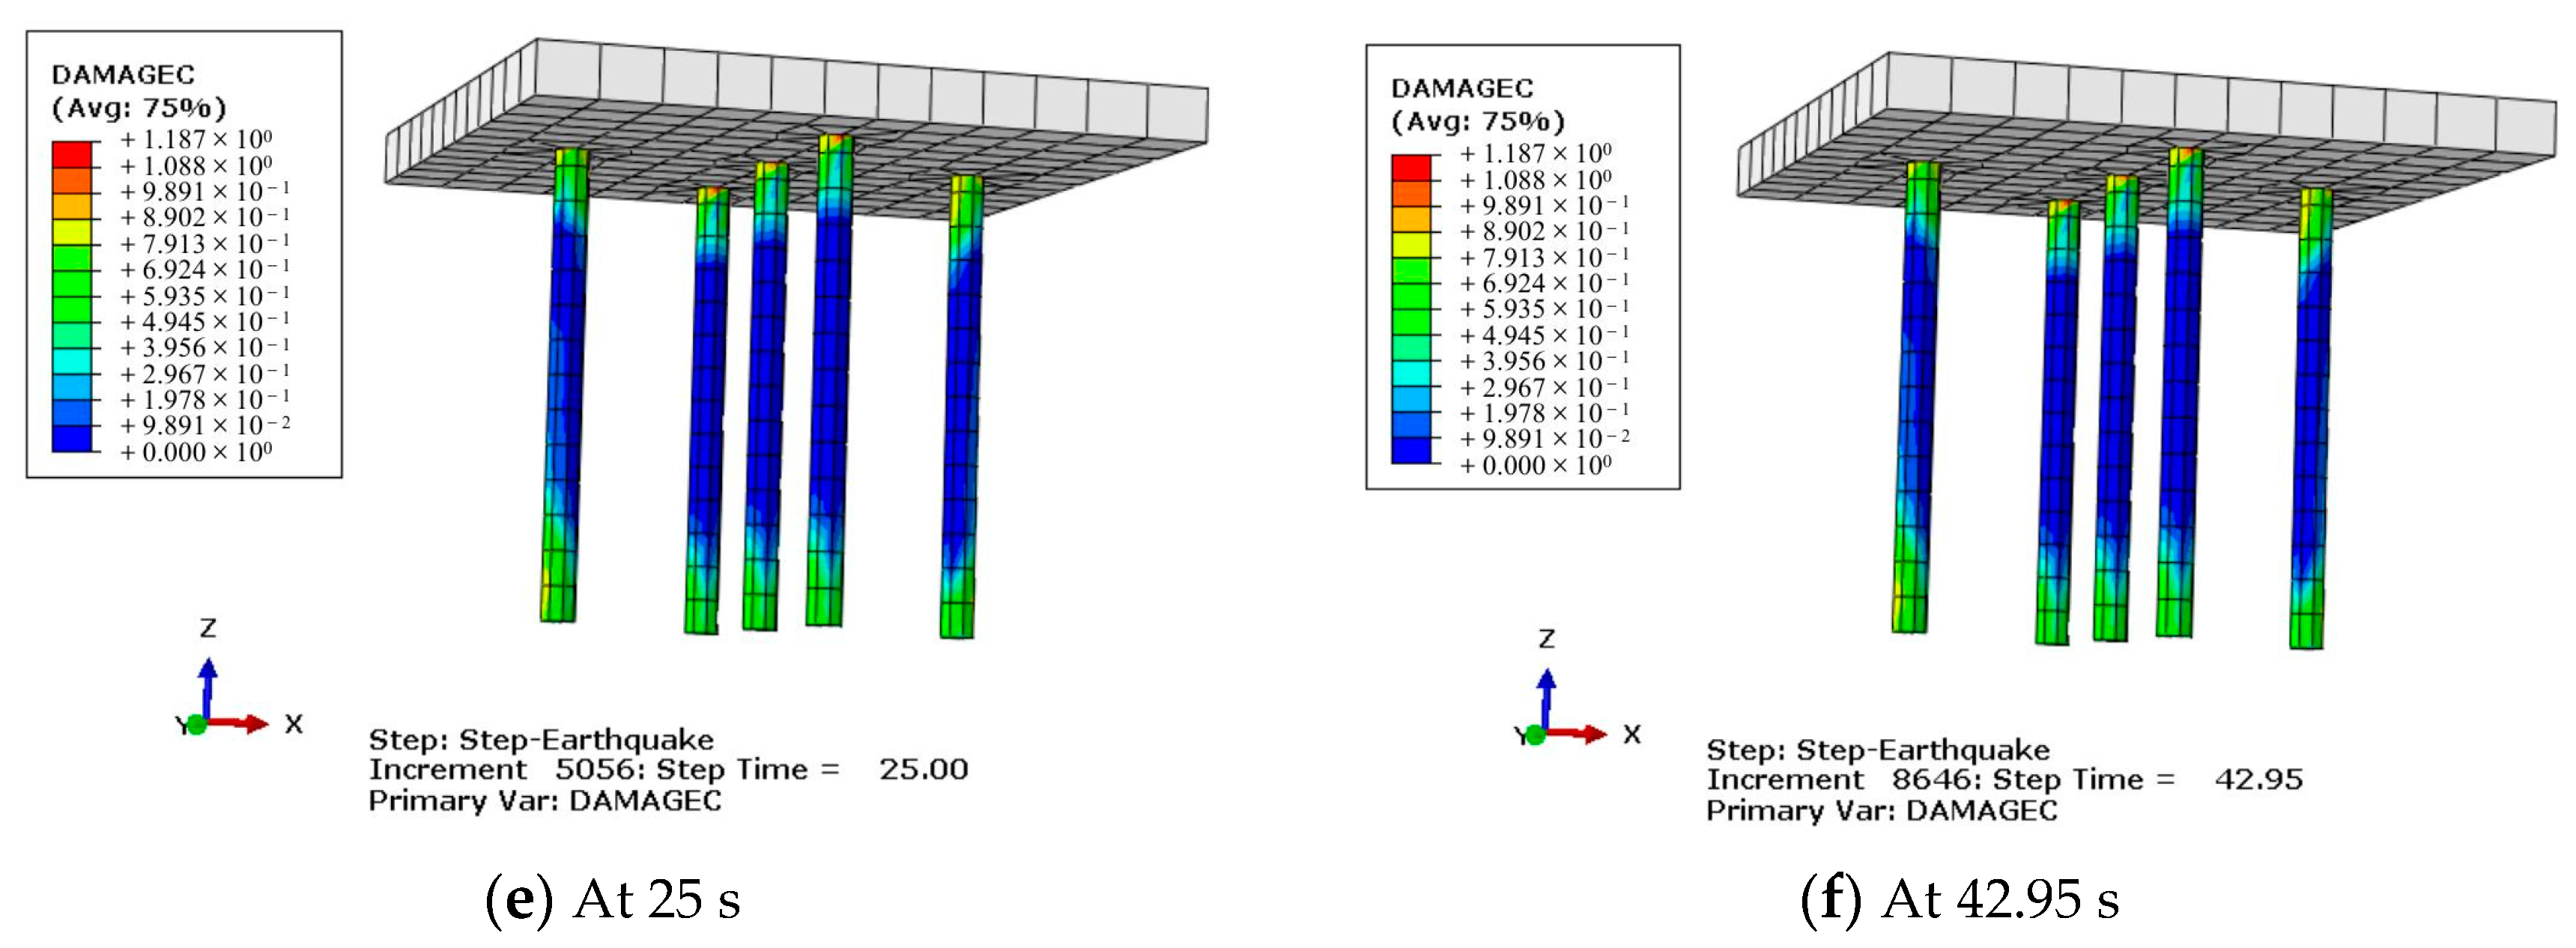
5.2. Development Process of the Plastic Damage

Figure 15 shows the development of the nephogram of the tensile damage area on the pile under the RG seismic motion with an amplitude of 0.4 g. From Figure 15, it can be seen that the sequence of the tensile damage positions is as follows: the top of pile 3#; the top of piles 2#, 4# and 5# and the bottom of pile 3#; the top and bottom of pile 1#; the top and bottom of piles 2#, 4#, 5#; damage distributed at a certain distance along pile 1#; damage distributed at a certain distance along pile 3#; the middle area of piles 2#, 4# and 5#; the remaining areas of piles 1# and 3#.
Figure 16 shows the development of the nephogram of the pressure damage area on the pile under the RG seismic motion with an amplitude of 0.4 g. From Figure 16, it can be seen that the sequence of the pressure damage positions is as follows: the top of pile 3#; the top of piles 2#, 4# and 5#; the top of pile 1#; the bottom of all piles; and the middle upper and middle lower parts of all piles.
From Figure 15 and Figure 16, it can be seen that the order of damage of the piles is generally as follows: side piles located in one direction of the vibration, side piles located in the middle position and the central pile and side piles located in the other direction of the vibration. This is consistent with the damage phenomenon of each pile in the shaking table test under medium-soft soil conditions. The order of damage locations on the pile in the numerical model is pile top, pile bottom, middle of the pile body. In the shaking table test of medium-soft soil, there was obvious damage to the top and body of the piles, but the degree of damage in the bottom of the piles was relatively mild. It is speculated that the addition of a 20 mm thick steel plate at the bottom of the piles in the shaking table test reduced the stress concentration phenomenon at the bottom of the piles.

6. Conclusions

In this paper, by comparing the shaking table test results of a soil–pile–nuclear island structure dynamic interaction model in conditions of simulating medium-soft soil and hard soil sites, the acceleration response law of the nuclear island model and the deformation and internal force response law of the pile foundation are analyzed. Moreover, the seismic failure mechanism and mode of the pile group foundation are discussed. The following conclusions can be drawn:
(1)
When the amplitude of the input seismic motion is small (less than 0.2 g in this paper), the peak acceleration amplification factor of the nuclear island plant in the medium-soft soil site is larger than that in the hard soil site. However, when the amplitude of the input seismic motion is large (0.4 g in this paper), the peak acceleration amplification factor of the upper nuclear island structure is smaller than that in the hard soil site because the medium-soft soil has entered a strong nonlinear stage, and the pile foundation has been damaged.
(2)
The properties of the soil around the pile foundation have a significant effect on the response characteristics of the superstructure. The predominant period value of the floor spectrum of the nuclear island plant in the soft soil site is greater than that in the hard soil site. Resonance occurs when the predominant period value of the floor spectrum is similar to that of the far-field seismic motion response spectrum, which aggravates the vibration of the plant structure and its pile foundation, resulting in great damage to the structural system.
(3)
The properties of site soil have a great influence on the seismic damage of piles. The deformation constraint effect of soil on piles is small under the action of the seismic motion when the site soil is soft, and it is easy for the separation phenomenon between piles and soil to occur, resulting in the large displacement and deformation of piles, which may cause damage to the pile foundation.
(4)
The internal force of piles is also related to the position of the pile in the pile group. The piles at the edge along the direction of the seismic motion input of the pile group have a large internal force and the most serious damage. Therefore, attention should be paid to strengthening the protection of the side piles in the seismic design of the nuclear island containment structure.
(5)
The pile failure is most likely to occur at the head, which is damaged by the combined action of bending, shear and pressure with the increase in seismic motion amplitude when the site soil is soft, followed by the possible bending failure of the pile body.
The test results show that the hardness grade of the site soil has a great influence on the damage to the pile foundation of a nuclear island plant under the action of seismic motion, which should be taken into consideration during the site selection of a nuclear island plant structure and the seismic design of the pile foundation.

Author Contributions

Conceptualization, Y.S. and L.J.; methodology, Y.S. and L.J.; software, G.W.; validation, Y.W. and J.T.; formal analysis, Y.S.; data curation, L.J.; writing—original draft preparation, G.W.; writing—review and editing, G.W.; visualization, Y.W.; project administration, W.Q.; funding acquisition, W.Q. All authors have read and agreed to the published version of the manuscript.

Funding

This research was funded by the National Science and Technology Major Project of the Ministry of Science and Technology of China (Grant No. 2018ZX06902016) and the Scientific Research Fund of Institute of Engineering Mechanics, China Earthquake Administration (Grant No. 2019B10).

Institutional Review Board Statement

Not applicable.

Informed Consent Statement

Not applicable.

Data Availability Statement

Data are available in a publicly accessible repository.

Conflicts of Interest

The authors declare no conflict of interest.

References

  1. Yang, Y.; Wu, H.; Fang, Q. Numerical simulation analyses of damage and vibration response of a nuclear power plant under aircraft impact. J. Vib. Shock 2023, 42, 312–324. [Google Scholar]
  2. Yang, J.; Ma, Y.; Cai, L.; Shen, L. Research on the seismic response analysis of nuclear island buildings with pile foundation. Ind. Constr. 2021, 51, 31–36. [Google Scholar]
  3. Tian, Z.; Li, P.; Zhu, S.; Zhang, Y.; Li, Y.; Liu, Y.; Zhou, K.; Yan, L. Shaking table tests on negative friction of piles in soft soils under strong earthquake motion. Chin. J. Geotech. Eng. 2022, 44, 550–559. [Google Scholar]
  4. Zhuang, H.; Zhao, C.; Yu, X.; Chen, G. Earthquake responses of piles-soil dynamic interaction system for base-isolated structure system based on shaking table tests. Chin. J. Geotech. Eng. 2022, 44, 979–987. [Google Scholar]
  5. Liang, F.; Liang, X.; Zhang, H. Simplified analysis of dynamic response of pile-supported bridge under local scour and verification by centrifugal shaking tests. Chin. J. Geotech. Eng. 2021, 43, 1771–1780. [Google Scholar]
  6. Meymand, P. Shaking Table Scale Model Tests of Nonlinear Soil-Pile-Superstructure Interaction in Soft Clay; University of California: Berkeley, CA, USA, 1998. [Google Scholar]
  7. Wei, X. Shake Table Tests of Soil-Pile-Structure Interaction and Its Theoretical Analysis; Tongji University: Shanghai, China, 1999. [Google Scholar]
  8. Wu, X. Shake Table Tests of Sand-Pile-Structure Interaction; Tongji University: Shanghai, China, 2002. [Google Scholar]
  9. Chen, G.; Wang, Z.; Zuo, X.; Du, X.; Han, X. Development of laminar shear soil container for shaking table tests. Chin. J. Geotech. Eng. 2010, 32, 89–97. [Google Scholar]
  10. Sun, H.; Jing, L.; Meng, X.; Wang, N. A three-dimensional laminar shear soil container for shaking table test. J. Vib. Shock 2012, 31, 26–32. [Google Scholar]
  11. Ni, K. Shaking Table Test of Pile and Composite Foundations’ Dynamic Behavior in Layered Soils Subjected to Earthquake Excitation; China Academy of Building Research: Beijing, China, 2013. [Google Scholar]
  12. Chau, K.; Shen, C.; Guo, X. Nonlinear seismic soil–pile–structure interactions: Shaking table tests and FEM analyses. Soil Dyn. Earthq. Eng. 2008, 29, 300–310. [Google Scholar] [CrossRef]
  13. Tokimatsu, K.; Suzuki, H.; Sato, M. Effects of inertial and kinematic interaction on seismic behavior of pile with embedded foundation. Soil Dynamatics Earthq. Eng. 2005, 25, 753–762. [Google Scholar] [CrossRef]
  14. Hokmabadi, A.S.; Fatahi, B.; Samali, B. Physical Modeling of Seismic Soil-Pile-Structure Interaction for Buildings on Soft Soils. Int. J. Geomech. 2015, 15, 04014046. [Google Scholar] [CrossRef]
  15. Huang, Z.; Bai, X. Shaking table model test for seismic response of a pile group foundation with liquefiable sandy soil. J. Vib. Shock 2013, 32, 153–158. [Google Scholar]
  16. Li, X.; Wang, X.; He, Q.; Liu, A. Shaking Table Test for Evaluation of Seismic Behavior of Nuclear Power Plants on Non-Rock Site. Nucl. Power Eng. 2017, 38, 31–35. [Google Scholar]
  17. Jing, L.; Wang, G.; Li, J.; Sun, Y.; Zhou, Z.; Qi, W. Shaking Table Test and Numerical Simulation of Soil-Pile-Nuclear Island System Dynamic Interaction. Chin. J. Geotech. Eng. 2022, 44, 163–172. [Google Scholar]
  18. Hu, C.; Yang, X. Analysis of seismic response on pile in liquefiable site. J. Vib. Shock 2007, 106, 133–137. [Google Scholar]
  19. Zhang, Y.; Li, J. Numerical solution of pile-soil interaction problem in ocean. J. Vib. Shock 2009, 28, 160–163. [Google Scholar]
  20. Luo, C.; Zhan, C.; Lou, Y.; Jin, X.; Ding, Z. Effects of pile-soil nonlinear coupling actions on dynamic response features of pile foundation under earthquake. J. Vib. Shock 2017, 36, 20–26. [Google Scholar]
Figure 1. Soil box for the test.
Sustainability 15 11988 g001
Figure 2. Schematic diagram of pile group layout.
Sustainability 15 11988 g002
Figure 3. Schematic diagram of nuclear island plant model.
Sustainability 15 11988 g003
Figure 4. Bolted connection between the baseplate and the pile cap.
Sustainability 15 11988 g004
Figure 5. Schematic diagram of sensors layout.
Sustainability 15 11988 g005
Figure 6. Time history and Fourier spectrum of the artificial seismic motion input in the test.
Sustainability 15 11988 g006
Figure 7. Failure of pile group in medium-soft soil site.
Sustainability 15 11988 g007
Figure 8. Status of piles in hard soil site after the test.
Sustainability 15 11988 g008aSustainability 15 11988 g008b
Figure 9. Typical acceleration time history collected in the test.
Sustainability 15 11988 g009
Figure 10. Comparison diagram of peak acceleration amplification factor of nuclear island model.
Sustainability 15 11988 g010
Figure 11. Comparison diagram of floor response spectrum in nuclear island model.
Sustainability 15 11988 g011
Figure 12. Comparison diagram of peak displacement amplification factor of piles.
Sustainability 15 11988 g012
Figure 13. Comparison diagram of envelope curves of pile bending moment.
Sustainability 15 11988 g013
Figure 14. The finite element model.
Sustainability 15 11988 g014
Figure 15. Development of pile tensile damage nephogram.
Sustainability 15 11988 g015aSustainability 15 11988 g015b
Figure 16. Development of pile pressure damage nephogram.
Sustainability 15 11988 g016aSustainability 15 11988 g016b
Table 1. Parameters of the soil.
ItemDensity
(kg/m3)
Elastic Modulus
(kPa)
Poisson’s RatioCohesion
(kPa)
Friction Angle
(°)
Dilation Angle
(°)
Soil surface170010.350.01200.1
Soil bottom170015,0000.3525200.1
When the parameter values in the surface and the bottom of soil are different, it indicates that the parameter values vary linearly in the vertical direction in the soil.
Table 2. Parameters of the concrete.
ItemDensity
(kg/m3)
Elastic Modulus
(Gpa)
Poisson’s RatioCohesion (°)Eccentricityfb0/fc0Kc
Value2400220.2350.11.160.6667
Table 3. Parameters of the reinforcement inside the pile.
ItemDensity
(kg/m3)
Elastic Modulus
(Gpa)
Poisson’s RatioYield Stress (Mpa)
Longitudinal reinforcement78002000.2335
stirrup78002000.2235
Table 4. Parameters of the pile cap and the nuclear island.
ItemDensity
(kg/m3)
Elastic Modulus
(Gpa)
Poisson’s Ratio
Pile cap25001000.2
Baseplate of nuclear island25001000.2
Nuclear island containment17,9002000.2
Disclaimer/Publisher’s Note: The statements, opinions and data contained in all publications are solely those of the individual author(s) and contributor(s) and not of MDPI and/or the editor(s). MDPI and/or the editor(s) disclaim responsibility for any injury to people or property resulting from any ideas, methods, instructions or products referred to in the content.

