Article

Collaborative Integrated Sustainable Tourism Management Model Using System Dynamics: A Case of Labuan Bajo, Indonesia

by
Shana Fatina
*,
Tri Edhi Budhi Soesilo
and
Rudy Parluhutan Tambunan
School of Environmental Science, University of Indonesia, Jakarta 10430, Indonesia
*
Author to whom correspondence should be addressed.
Sustainability 2023, 15(15), 11937; https://doi.org/10.3390/su151511937
Submission received: 23 June 2023 / Revised: 21 July 2023 / Accepted: 26 July 2023 / Published: 3 August 2023

Abstract

:
Tourism is one of a region’s most prominent development vehicles. However, quality tourism is only achieved when supported by multi-sectors. This study aims to create a model of sustainable tourism management using a system dynamics approach. The model is based on the tourism development case in Labuan Bajo, a newly growing destination in Indonesia and a UNESCO Komodo biosphere reserve area. The research results in a model of sustainable tourism relevant to similar destinations with characteristics of high biodiversity but vulnerable to social inequality. This research finds it is critical to balance tourism growth and impact through the environment, economy, and social aspects and how destination management shall ensure multi-sector participation to create a conducive tourism ecosystem in the long run.

1. Introduction

Labuan Bajo, the beautiful port town of West Manggarai Regency, East Nusa Tenggara Province, has been designated as one of the Super Priority Destinations by the Government of Indonesia in the National Mid-Term Development Plan in 2020. The place has been widely known since the Sail Komodo Event in 2013 and the establishment of the 10 New Balis Project in 2016. This destination is a magnet for special interest tourism with the unique main attraction of Komodo National Park, a UNESCO world heritage site. However, Labuan Bajo tourism still needs to solve the poverty issue in West Manggarai. West Manggarai Regency has 17.92% of poor people, which is relatively high compared to the national figure of 10.19% [1]. Labuan Bajo, one of the richest marine ecosystems globally, part of the Komodo Biosphere Reserve and the entrance to Komodo National Park, is also highly vulnerable because it is sensitive to the number of visits and forms of tourism activity. In addition to having a positive impact, tourism has the potential to have consequences, especially for endemic species or native species in an area [2].
The Komodo Biosphere Reserve has outstanding biodiversity [3,4,5,6,7,8,9]. The natural beauty and cultural diversity bring Labuan Bajo extraordinary appeal and high demand by tourists and investors. If protected and managed sustainably, it can generate the benefits of integrated sustainable tourism development throughout the region and provide sustainable prosperity. In previous studies, tourism was considered capable of being a solution that supports conservation [10,11,12,13], such as wildlife tourism [14,15]. Economically, global tourism has become a development tool [16] to reduce regional economic vulnerability [17,18]. Nevertheless, on the other hand, opening conservation areas for tourism might cause irreversible damage [19,20]. Tourism activities are even considered to contribute to the decline in the quality of the environment and the lives of local people.
Sustainable tourism has become a tourism development ethic focusing on resource sustainability [21]. It maintains the long-term sustainable use of conservation assets [22], natural capital, and local culture [23]. Tourism is a subsystem of the biosphere that depends on irreplaceable natural resources and services and the interaction between humans, culture, and the biosphere as a unity [16,24]. The environmental economics perspective increases social equity and human well-being while significantly reducing ecological scarcities and environmental risks. The economy depends on the environment and vice-versa. Therefore, sustainable tourism must be environmentally sustainable [25], socially acceptable [26], and economically profitable [27]. The management must ensure the future of life on earth and prevent scarcity and even extinction [28].
Tourism creates opportunities. The benefits of tourism range from job creation [29], improving the indigenous life quality [30], increased local productivity [31], and destination creation [32,33]. However, tourism also has negative impacts, such as imperialism [34], inequality in trade [35], and livelihood shifting [36]. To manage tourism effectively, integrated management of natural capital and local culture in a balance between environmental, social, and economic aspects is essential [23,37,38,39]. In conservation-based destinations, biodiversity can be managed to encourage local people’s welfare by prioritizing integrative, inclusive, adaptive, and pluralist principles [40]. Therefore, multi-stakeholder engagement in managing coastal and marine tourism destinations is significant [41].
Inequalities in Labuan Bajo and West Manggarai Regency indicate a need for more direct benefits for the community and the environment as a unified tourism ecosystem [42,43]. A significant nature gap between tourism and other primary sectors’ cultures—such as fisheries, plantations, and agriculture—needs more community education and participation efforts. More studies are needed from the perspective of an integrated system to link local communities to the activities and benefits of tourism. Modelling tourism on an integrated collaboration model is necessary to meet world-class sustainable tourism standards.
This study aims to create an alternative model of sustainable tourism management using a system dynamics approach. The model is built upon the destination’s carrying capacity, including the availability of resources, the convenience of tourist attractions and activities, amenities, accessibility connectivity, public awareness and participation, governance, and others [44]. Tourism management must address the environmental carrying capacity of Komodo National Park as the conservation area, which receives a direct impact from tourism development, as well as the urban carrying capacity of Labuan Bajo. This research results in a sustainable tourism management model relevant to similar destinations with world heritage status [45].
This study consists of five sections. Section 1 explains the research background and research problems. Section 2 explains the use of the system dynamics approach in other destinations and previous research on Labuan Bajo tourism. Section 3 explains the system dynamics approach used in the research of this study and the research location. Section 4 explain the research findings, which are then delivered in Section 5.

2. Literature Review

Tourism is a complex dynamic system [46]. Sustainability [47] is the latest issue for the global tourism industry in the twenty-first century, where quality tourism is believed to be the only way to achieve it [46,48]. The system dynamics method has been used to investigate many tourism complexity phenomena. Mai and Smith’s research in 2015 [49] and 2018 [44] built an SD model and development scenarios for Cat Ba Island tourism to overcome the challenges of water shortages, pollution and overcrowding. Meanwhile, Utami et al. [50] studied the behaviour of the environmental and economic dimensions of mangrove ecotourism tourism in Blekok Village, which found the highest sensitivity variables that could affect ecotourism income in the economic subsystem and mangrove density in the ecological subsystem. Santoso et al. [51] researched the Cibodas agrotourism-creative economy development system using SD modelling and simulations to explain how increased innovation will drive a village’s creative economy competitiveness. The method is also used by Luo et al. [52] to create low-carbon tourism systems at Xingwen Global Geopark and by Wang L. et al. [53] as a decision-support tool to achieve sustainable water-quality management in Yangtze Delta Area. Even though these methods can be very strategic and operational as policy development tools at many different levels for regulators, the number of tourism research that uses the system thinking and system dynamics methods still needs to be increased [54].
On the other hand, various studies have been conducted to investigate the sustainability of Labuan Bajo tourism to explain each social, economic, and environmental phenomenon. For the environmental aspect, the issue of water scarcity has been investigated in Farah et al.’s research [55] using the spatial and water-carrying capacity analysis method which finds how dependent the islands around Labuan Bajo are on water supply from the mainland or Cole’s research [56] using the ethnographic method which raises competition in the use of water between the needs of tourists and local communities that harm women. Other research warns of threats to biodiversity and animal behaviour changes in the Komodo National Park using behavioural assessment methods [2] and benchmarking studies with Kruger National Park [57]. For the economic aspect, Baskoro’s 2021 [58] research focuses on the performance of the tourism business in Labuan Bajo, which has not been optimal and had less impact on local community welfare. For the social aspect, Sianipar’s research [59] used the human ecosystem method which essentially notes the challenges of managing Komodo National Park in the future, namely the sustainability of the Komodo dragon population, economic inequality with the presence of foreign investors, and the declining quality of the Komodo dragon’s kinship relationship with the island’s indigenous tribal community due to reduced intensity of the meeting between the two. Benu et al.‘s research [60] used the SEM method to analyse the readiness of community-based tourism from the Komodo National Park. Islahuddin’s research [61] examines the adaptation and collaboration of local communities in the transformation of Labuan Bajo tourism. Wibowo’s [62] research on natural disaster preparedness uses the TUNAMI method to model the tsunami potential in Labuan Bajo.
All the previous research has been carried out qualitatively and quantitatively to explain Labuan Bajo tourism in separate sustainability dimensions. However, they have yet to be linked to one another. This study elaborates on all three dimensions of sustainability using systemic thinking which is then poured into a system dynamics model to describe the tourism sector ecosystem supported by other sectors in a holistic sustainability perspective.

3. Materials and Methods

This section will explain the location of the case study in the Labuan Bajo tourism destination, then the research methodology and a more detailed explanation of the system dynamics method used in this study.

3.1. Case Study

The research was conducted in the Labuan Bajo tourism corridor and focuses on the Key Tourism Area (KTA) 1 of Komodo National Park and Cluster of Urban Development 1 of Labuan Bajo from KTA 2 of Labuan Bajo, located in the northwest part of West Manggarai Regency, East Nusa Tenggara Province, Indonesia as in Figure 1. Administratively, the Labuan Bajo tourism area is bordered by the Flores Sea on the north side, Golo Bilas Village on the west side, the Flores Sea on the east side, and Wae Kelambu Village on the south side. Labuan Bajo tourism is part of the Komodo Biosphere Reserve Area, with the main attraction for conservation tourism in Komodo National Park.
Key Tourism Area 1 of Komodo National Park is a 173,300-hectare conservation island area which is the natural habitat of endemic Komodo dragons and various special marine biota. Key Tourism Area 2 Labuan Bajo and its surroundings is the western mainland region of Flores which consists of five development clusters, namely the Labuan Bajo City, the Batu Cermin-Wae Kelambu, the Gorontalo-Golo Bilas, the Labuan Bajo Waters, and the Golo Mori-Warloka.

3.2. Methodology

The research uses mix methods. Quantitative methods are used to obtain measurable field data to be processed in search of causal relationships between variables as dynamic hypothesis testing. Qualitative methods are used to obtain a more in-depth study to understand the phenomenon according to the research focus. This research was carried out in several stages, namely data collection, identification of the roles and functions of stakeholders in the tourism ecosystem network, formulation of System Dynamics models, validation, and scenario simulations based on tourism carrying capacity.
Information related to the condition of the existing tourism ecosystem was carried out by focused discussions and interviews on sections that needed in-depth study. Interviews were conducted with Penta helix Labuan Bajo tourism stakeholders. Discussions were held specifically to identify and understand the actors and networks involved in the sustainable tourism ecosystem in Labuan Bajo. Interviews were conducted by taking recordings with the permission of the participants, which the researchers then transcribed. Actors will present different problems, and the actor demanded to solve the problem will most likely be the key actor. All discussion of the problem is drawn from a common goal, namely the sustainable management of Labuan Bajo tourism, with the characteristics of the Komodo Biosphere Reserve. The actors will try to solve the problems expressed based on these common goals. To complete the perspective on the discussion, the researcher also triangulated with other secondary data analysis in the form of documents, reports, work programs, and related and significant material for the context of sustainable tourism development in Labuan Bajo in 2010–2022. The results then become input for preparing the System Dynamics model, built with an environmental science perspective.

3.3. System Dynamics Modeling

Systems thinking is a way of seeing a problem as a unified or as a whole system that there is always a link between its elements or components. A model is a simplified and deliberately made imitation of the real world to mimic a natural phenomenon or an actual process [63]. The model is structured to make studying the interrelationships of components in complex systems more manageable. The models can be quantitative, qualitative, and iconic models.
System dynamics is a method that studies systems to understand the system, optimise system performance, and predict system performance [64]. The system has the characteristics of complex, dynamic, nonlinear and feedback management. The component model in the system dynamics method is a system structure consisting of various actors, sources of information, and a network of information flow that links between the two. The following steps are carried out to develop the system dynamics model as in Table 1.
Modelling begins with building a causal-loop diagram (CLD) which is then transferred into a stock-and-flow diagram (SFD). The CLD explains past and current development patterns with simple system mapping [49]. The CLD model identifies the root causes of complex problems and the impacts of sustainable tourism development systems to develop and test alternative management policies [65]. There are two main types of behaviour in a CLD: Reinforcing (R) and Balancing (B). Reinforcing behaviour occurs when the relationship between the two components is mutually reinforcing. At the same time, balancing behaviour occurs when there is a relationship between the two components that weaken each other.
The CLD model then becomes the basis for making the SFD. Making the SFD begins with determining the stock, inflow, outflow, constants, and auxiliary variables, then building relationships between components using mathematical operations. The stock-and-flow diagram needs to pay attention to the continuity of the units and the relationship between components as described in the cause-and-effect relationship in the CLD that was prepared previously. After the SFD is formed, the model is validated before simulation.
Model validation is carried out in several ways, including visual methods and other simple statistical methods, namely AME (absolute mean error), AVE (absolute variation error), or RMSE (root mean square error). After the model is declared valid, the Business-as-Usual simulation and other scenario options desired by the modeller can be carried out to achieve the system’s goals.
The weakness of the system dynamics method is that the model built is very dependent on the modeller’s mental model, so it will only describe a part of the selected system as a locus and research perspective, while the advantages of this method are being able to map complex interaction patterns, compile alternative scenario projections, and assist in decision-making.
The System Dynamics modelling in this study is carried out in stages according to Soesilo & Karuniasa [64] as follows:

3.3.1. System Observation

Researchers identify problems and actors to understand the root causes of tourism in Labuan Bajo and Komodo National Park. System observation identifies related components of each environmental, social, and economic subsystem as part of the tourism system. The system reality is then translated into a mental model by the researcher.

3.3.2. Compilation of the Problem Structure

The researcher then translates the mental model into a causal loop diagram. The causal loop diagram describes the causal relationship between components in the system in an image language. Elements are connected by arrows representing the relationship to form a causal loop. The top of the arrow describes the cause, and the tip of the arrow explains the effect.

3.3.3. Modeling

The causal loop diagram is then translated into a stock-and-flow diagram with a correlation formula between its components. The SFD is developed using Powersim Studio 10 software. Data from field observations are then translated into the SFD formula to explain the relationship between components in the model. Each component in the CLD is translated into symbols that represent stock (level), flow (rate), auxiliary, and constant.

3.3.4. Model Validation

Model validation aims to check the suitability of the model with reality. Validation was carried out using visual methods and calculating AME (absolute mean error). The SFD model was also reviewed in a stakeholder Focus Group Discussion of tourism actors consisting of local government, academics, travel and tour operators, community, local leaders, and the media.

3.3.5. Simulation of Business-as-Usual Model

After the model was validated, the researchers simulated a Business-as-Usual (BAU) scenario using Powersim Studio 10 software to analyse the sensitivity of tourism development to an increase in the number of visits and population growth until 2045.

3.3.6. Simulation of the Intervention Scenario

The following simulation is conducted to find the best scenario for managing tourism. In general, there are two proposed intervention scenarios, namely: (1) the best scenario that promotes sustainable tourism and (2) the worst scenario without promoting sustainable tourism. The simulation finds the limit of tourism activities due to the tourism and resources carrying capacity in various perspectives.

3.3.7. Interpretation and Use of Model Simulation Results

The data analysis results are presented as descriptive narratives, pictures, tables, and displays that make it easier for the reader to understand them: tables obtained from primary data processing, secondary data, and documentation during research activities. Images and charts display the results of research data processing visually. Data interpretation will be carried out using an environmental science perspective to answer the research objectives. The research results will become input for formulating policies and improving the governance of tourism management.

4. Results

This section presents the research results of the System Dynamics model for sustainable tourism management. The sustainable tourism system includes the tourism visit, environment, social, and economy subsystems. The model was developed based on the Labuan Bajo coastal tourism model components in Table 2. ‘Tourism visits’ is a critical subsystem in setting the tourism development scenarios, leading to tourist visits, length of stay, and spending.

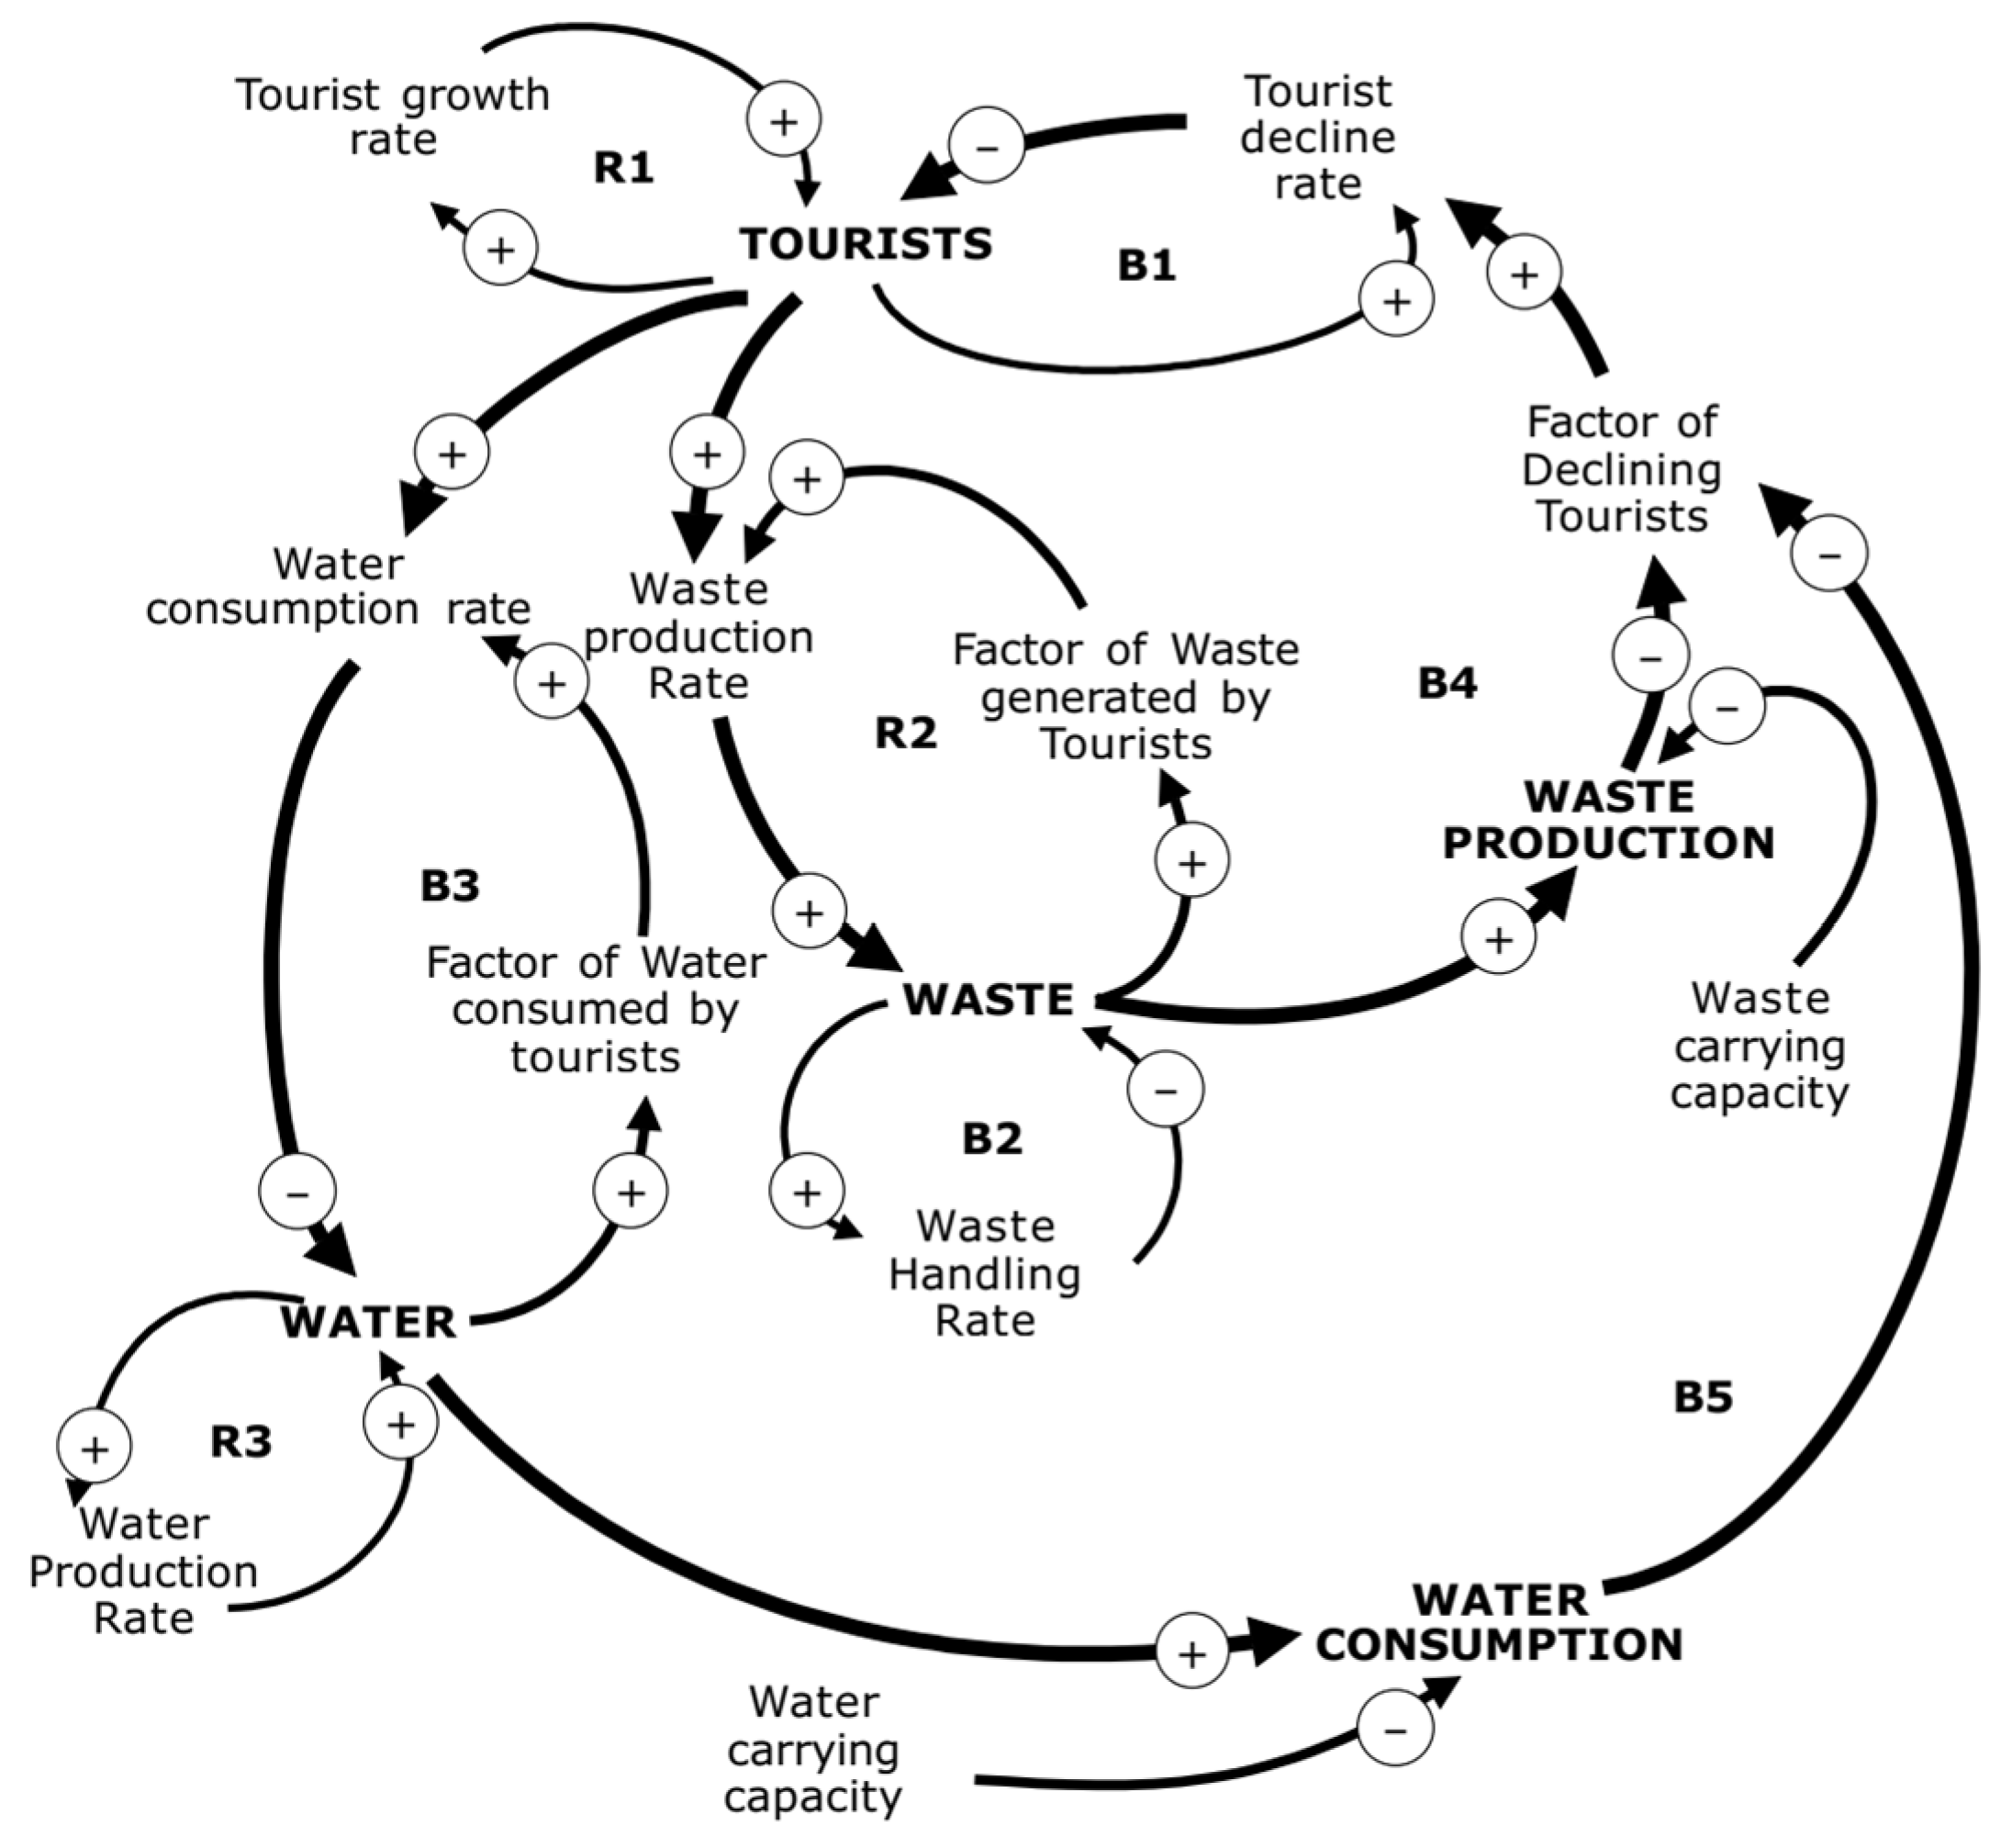
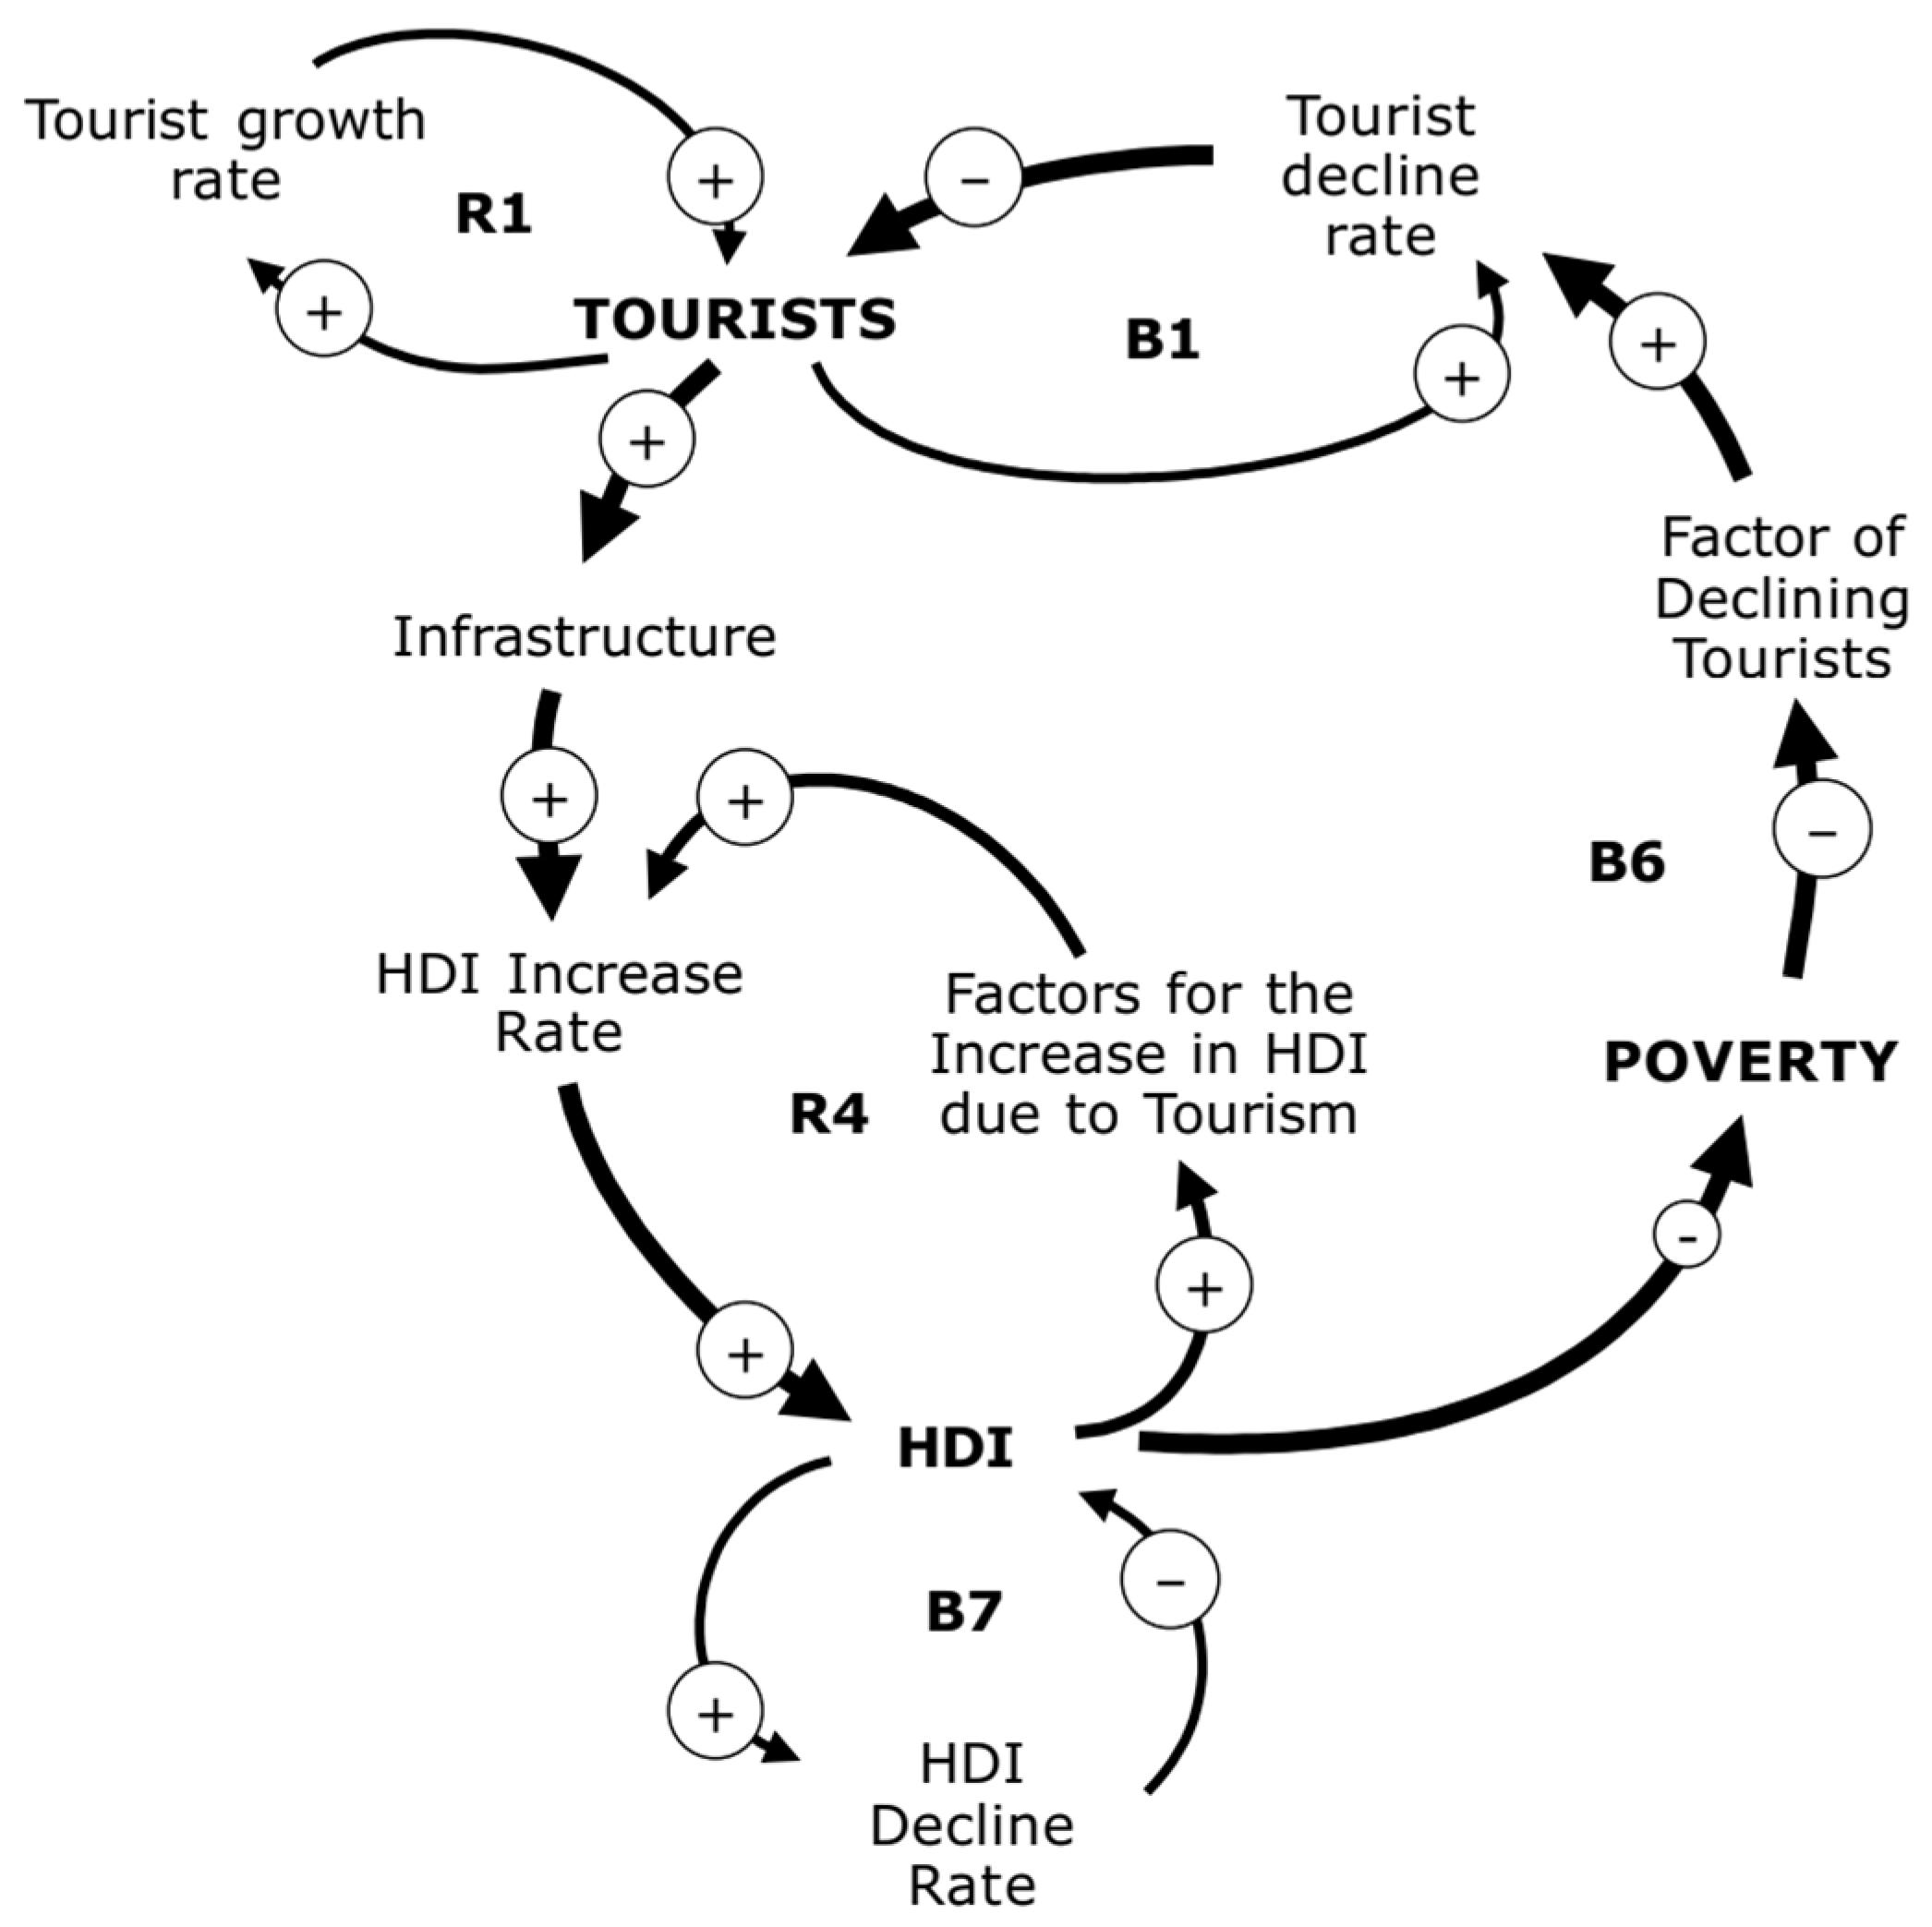
4.1. Causal-Loop Diagram

A causal loop diagram is made for each environmental, social, and economic sustainability aspect. The CLD is then combined into a single unit which describes the causal relationship in a sustainable tourism system. The CLD for sustainable tourism can be seen in Figure 2.
The CLD of sustainable tourism consists of seven Reinforcing loops (R1–R7) and eleven Balancing loops (B1–B11). Separately, each CLD aspect of sustainable tourism can be seen in Figure 3 for Environmental CLD, Figure 4 for Social CLD, and Figure 5 for Economic CLD. The CLD shows how the tourism visit subsystem is related to each other subsystem in a close loop.
The causal loop diagram for the environmental aspect consists of three Reinforcing loops (R1, R2, R3) and five Balancing loops (B1, B2, B3, B4, B5), as shown in Figure 3. The number of tourist visits will affect the increase in waste production and consumption of clean water. When it is within the carrying capacity, the unhandled waste and untapped clean water needs of tourists will cause a downward trend in tourists’ interest in visiting the destination.
The causal loop diagram for social aspects consists of two Reinforcing loops (R1, R4) and three Balancing loops (B1, B6, B7) in Figure 4. The number of tourist visits will affect infrastructure provision, increasing the Human Development Index. The increase in the HDI rate is in line with the decrease in poverty. Reducing poverty will increase tourists’ interest in visiting the destination.
The causal loop diagram for the economic aspect consists of four Reinforcing loops (R1, R5, R6, R7) and five Balancing loops (B1, B8, B9, B10, B11) in Figure 5. The number of tourist visits will affect the increase in the length of stay of tourists. An increase in the length of stay of tourists will impact increasing food consumption and accommodation needs. Food consumption consists of rice, fish, meat, vegetables, and fruit—provision of accommodation in hotel rooms and boat rooms. The provision of food and accommodation will increase employment. An increase in the length of stay of tourists will increase tourist spending. Spending on tourists and creating jobs will increase the GRDP figure. Increased GRDP and investment inflows will increase infrastructure provision. Infrastructure improvements will increase tourists’ interest in visiting the destination.

4.2. Stock-and-Flow Diagram

The stock-and-flow diagram is made based on the CLD that has been prepared previously. The stock-and-flow diagram of the research can be seen in Figure 6. The stock-and-flow diagram integrates the tourism visits, environmental, social, and economic subsystems and shows their relationship.
The relationship is driven by the accumulation of foreign and domestic tourist visits that result in total tourist length of stay, affecting food consumption, accommodation usage, water consumption, and waste production. The tourist spending then drives the increase of GRDP, infrastructure provision, increasing HDI, and reducing poverty. However, increasing tourism businesses like hotels and boats and non-tourism businesses like food production will create more local jobs and opportunities. The stock-and-flow diagram is made based on the CLD that has been prepared previously. The stock-and-flow Diagram of the research can be seen in Figure 6.
The blue colour shows the tourism visit subsystem, the red colour shows the economic subsystem, the green colour shows the environmental subsystem, and the black colour shows the social subsystem. Even though the data collected in this study were for 2010–2021, the SD modelling only used reference data for 2010–2019 because the COVID-19 pandemic occurred in 2020–2021, reducing tourist visits. During the pandemic, tourist visits dropped dramatically, especially foreign tourists due to the closure of the country’s entrances. However, the model built can be used as a guide for future development trends in Labuan Bajo tourism.
The model was then adapted for use in the Labuan Bajo tourism ecosystem based on reference data from 2010 to 2022. The stocks are ‘tourist visits’, ‘foreign tourists’, ‘domestic tourists’, ‘water’, ‘waste’, ‘hotel rooms’, ‘boat rooms’, ‘rice’, ‘fish’, ‘meat’, ‘vegetable and fruit’, ‘GDRP’, ‘poverty’, and ‘HDI’. The average growth rates of datasets are used to calculate the flow rate formulas. The remaining datasets are used to calculate model formulas as auxiliary and constants.
The number of tourist visits is taken from the number of Komodo National Park visitors from 2010 to 2021 [66] in Figure 7.
The tourism carrying capacity data use the results of the previous study, namely a total of 8230 tourists per day, or 2,880,660 tourists per year. References to the length of stay and tourist spending are obtained based on the 2022 Exit Survey results conducted by the Office of Tourism and Creative Economy and Culture of West Manggarai Regency [67] in Table 3. These figures are used to formulate the total length of stay of tourists and spending at destinations per year, based on the level of tourist visits.
As a marine destination, Labuan Bajo offers land attractions and sailing activities. Tourist boats facilitate activities at sea, allowing tourists to stay on board so the tour boats have rooms. These activities are called ‘Live onboard’. Moreover, hotel rooms are also available on the mainland or islands for tourist accommodation. The growth in the number of hotel rooms is shown in Figure 8, and the number of boat rooms in Table 4 is based on official tourist boats registered at the West Manggarai Cultural Creative Economy and Tourism Office. These figures formulate the available land and sea accommodation to serve tourists.
The growth of hotel rooms is caused by newly built and opened hotels, while closed hotel operations or under-maintenance rooms cause a decline in hotel room availability. The growth of tourist boat rooms is caused by newly built and operate tourist boats, while the decline in boat numbers is caused by closed operation boats, boat sinks, or under-maintenance boats.
Figure 9 is the food production reference data, including rice, fish, meat, vegetables, and fruit in West Manggarai [1]. The reference for tourist food consumption is 0.34 kg of rice/day/person, 0.1 kg of fish/day/person, 0.05 kg of meat/day/person, and 0.4 kg of fruit vegetables/day/person. These figures are used to formulate the availability of food supply and estimated daily consumption for each tourist for each rice, fish, meat, vegetables and fruit.
Figure 10 is the reference data for poverty patterns and the Human Development Index in West Manggarai Regency [1]. Poverty data and HDI are used as indicators of community welfare as part of a social subsystem. The number of poverties is calculated by multiplying the poverty rate by the total annual population of West Manggarai.
Table 5 is the reference data for the tourism water generation in West Manggarai. Availability of clean water and waste management represent components of the environmental subsystem. The availability of electricity supply is not used in this study because no reference data can be used. The number of clean water needs is calculated by multiplying the amount of clean water usage per tourist per day by the total length of stay of tourists. This model formulation calculates the ability to provide clean water in destinations to meet the needs of tourists. Table 5 is the reference data for tourism water consumption.
Table 6 is the reference data for the tourist waste generation in KTA Komodo National Park and KTA Labuan Bajo. The West Manggarai tourism waste production is obtained in Table 7.
Waste handling is calculated by multiplying the amount of waste production per tourist per day by the total length of stay of tourists. This model formulates the capacity of waste management facilities at destinations to handle tourist waste.

4.3. Model Validation

Model validation was carried out using visual and simple statistical methods and AME (Absolute Mean Error) calculations. The model is declared valid if, visually, the behaviour of the simulation pattern matches the reference pattern. The model is also tested using the AME calculation and is declared valid if the AME value is less than 30%. AME is measured as the average absolute difference between the simulation and reference values. Model validation in Figure 11 and the AME test result show that the model is valid and can be used to simulate BAU and intervention scenarios.
Figure 11 is a visual validation between the reference and simulation patterns. The visual results show that the model’s behaviour is appropriate so that the model structure is correct or declared valid.
After visually validation, researchers used AME calculation to validate the models further with results as follows:
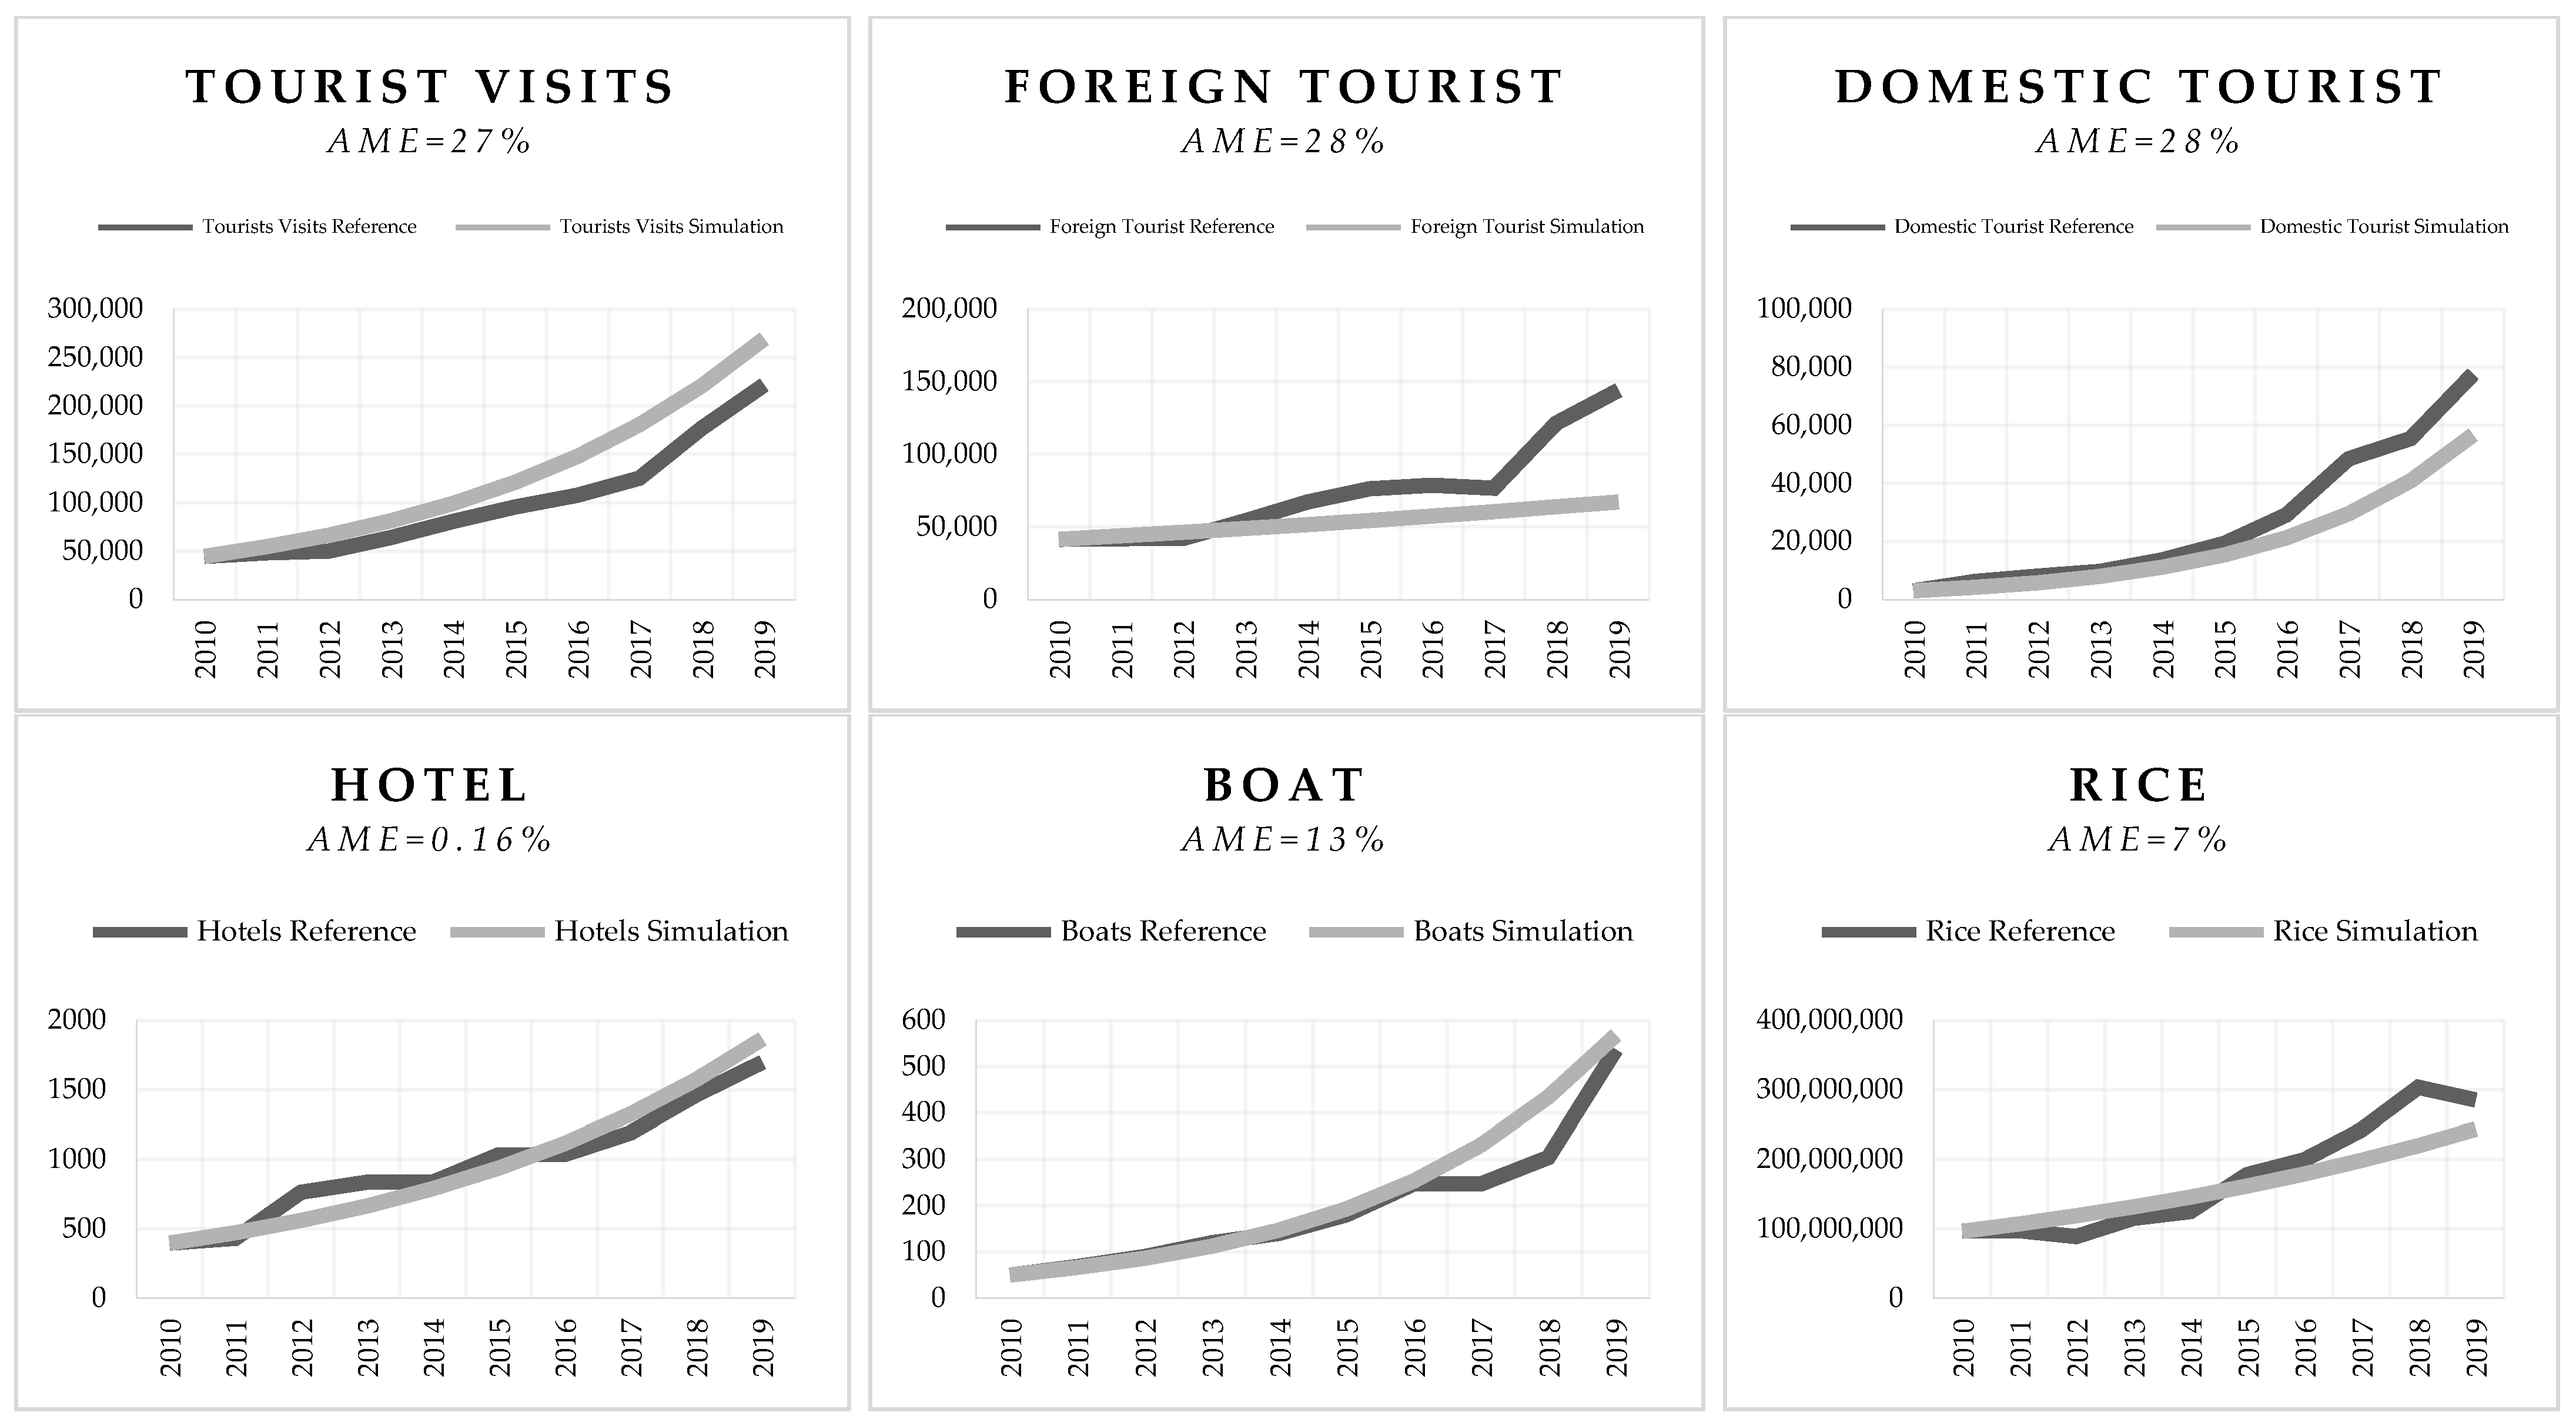
  • For the number of Tourist Visits, each AME value is 28% for foreign tourists, 28% for domestic tourists, and 27% for total tourists. The tourist visits models are declared valid.
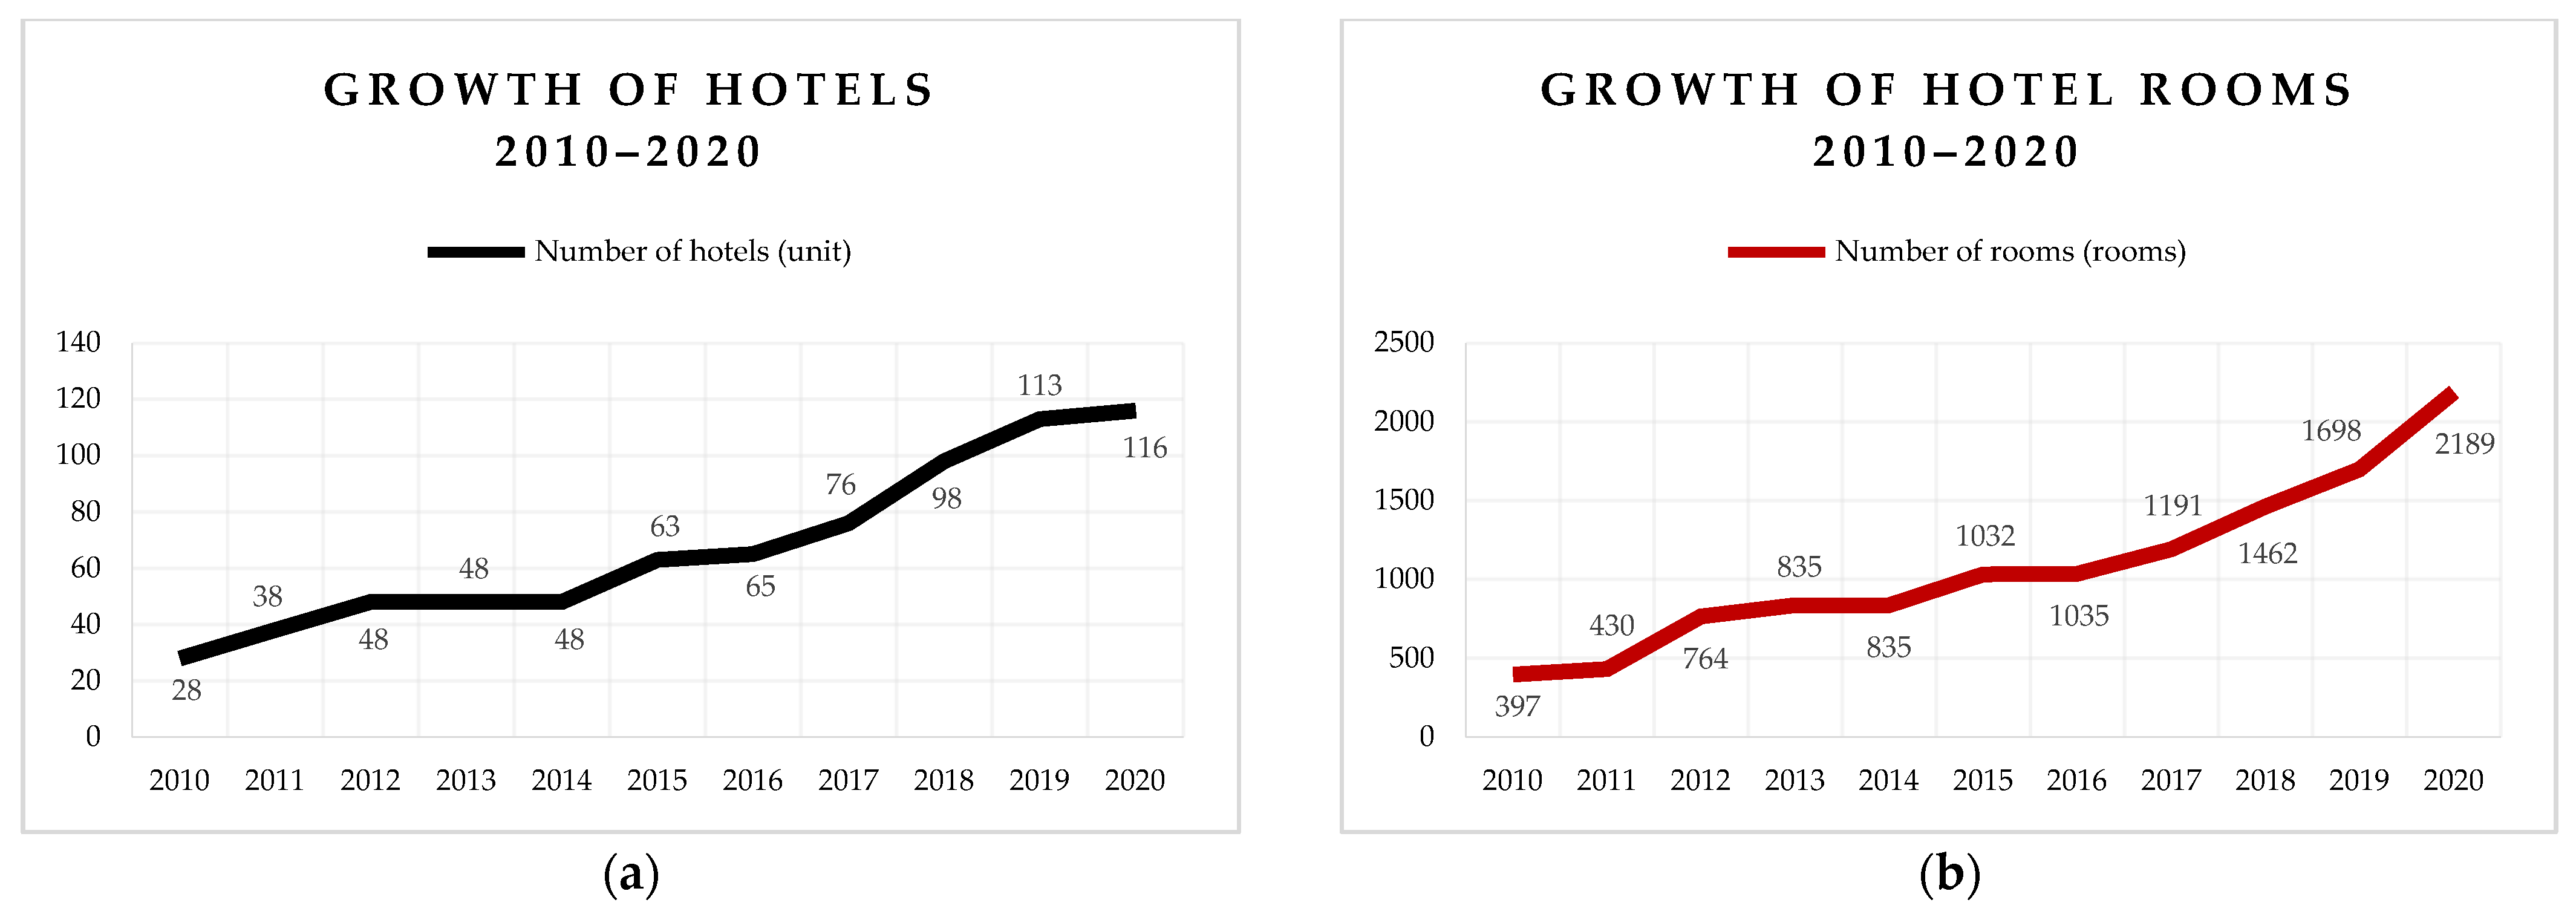
  • For the number of Hotel Rooms and Boat Rooms, each AME value is 0.16% for hotel rooms and 13% for boat rooms. The Hotel Rooms and Boat Rooms models are declared valid.
  • For GRDP, Poverty Rate, and West Manggarai HDI, each AME value is 0.17% for GRDP, 9% for poverty, and 3% for HDI. The GRDP, Poverty Rate, and HDI models are declared valid.
  • For food production in West Manggarai Regency, AME values were 7% for rice, 20% for fish, 10% for meat, and 11% for vegetables and fruit. The food production models are declared valid.

4.4. Business-as-Usual Model Simulation

The behaviour of tourist growth affects the carrying capacity of Labuan Bajo destinations. Tourist visits consist of visits by foreign tourists and domestic tourists. In the compiled model, the growth in tourist visits will result in tourist spending. To be able to serve tourist visits, it is necessary to have tourist attractions and accommodations consisting of hotels and tourism boats. In addition, tourist visits will also affect water use and waste production, which must be within their carrying capacity.
Optimal benefits of tourist visits are expected to increase GRDP income, reduce poverty rates, and increase the Human Development Index as a co-benefit of tourism growth. In the BAU scenario, tourist arrivals will exceed the tourism carrying capacity of Labuan Bajo in 2031 in Figure 12.
Tourist spending will grow exponentially during visits where domestic tourist spending is significantly greater than foreign tourist spending, as in Figure 13. Thus, visits by domestic tourists provide more economic benefits for destinations. The average expenditure of foreign tourists is IDR 2,366,634.29/day with a stay of 4.52 days, while the average expenditure of domestic tourists is IDR 1,829,355.43/day with a stay of 5.25 days. Only 42% of the total foreign tourists shop for souvenirs, while 73% of the total domestic tourists shop for souvenirs. Even though the total expenditure of foreign tourists per person is more than that of domestic tourists, the visits of foreign tourists per person directly impact the community’s creative economy.
Tourist accommodation services consist of hotels and tourism boats. Limited land and the vulnerability of the existing ecosystem are the basis for limiting the number of hotels to 10,000 rooms and tourism boats to a limit of 2000 rooms. Under these conditions, the carrying capacity of accommodation will be exceeded in 2026 in Figure 14.
In terms of providing clean water services, the availability of water infrastructure will only be able to support tourism until 2032, as in Figure 15. Although West Manggarai water sources are still abundant, they cannot be utilized because they are not connected to distribution pipelines. For this reason, finding new water sources connected to distribution pipes has to be a priority to answer the need for clean water after 2032.
It is also projected in the BAU scenario that the carrying capacity of waste will not be able to accommodate tourist waste production in 2032, as in Figure 16. Thus, it is necessary to add waste facilities and reduce the amount of waste that is not handled.
Regarding food availability, BAU’s tourism growth can still be met by rice, vegetable, and fruit production from West Manggarai. However, the availability of fish production will be exceeded in 2037, and meat will be exceeded in 2039, so it needs to be supplied from outside the region, as in Figure 17. This projection has yet to consider the local community’s consumption needs, which means that carrying capacity can be exceeded faster, and products must be imported from outside the area.
BAU simulation for GRDP is in Figure 18, and the simulation for the poverty rate and the Human Development Index is carried out with the results in Figure 19 to evaluate the social impact of tourist growth.
The BAU simulation results that the GRDP will reach IDR 10 trillion in 2037, and the Human Development Index will reach the high category (70–79) in 2039 with the condition that there is an accelerated infrastructure financing intervention of 10% of the GRDP.
In the BAU scenario, tourist visits will exceed the carrying capacity of tourism in 2031, where the carrying capacity of accommodation will be exceeded in 2026, the availability of water infrastructure is only able to support tourism until 2032, and the availability of waste infrastructure is only able to handle tourist waste until 2032. Food needs in the BAU scenario can still be fulfilled by producing rice, vegetables, and fruit from West Manggarai. Still, the availability of fish production will be exceeded in 2037, and meat will be exceeded in 2039, so it needs to be supplied from outside the region.

5. Discussion

This research dissects tourism in systemic thinking, whereas a system has components with interaction, interdependence, diversity, harmony, and sustainability [47]. A causal relationship between the demand for tourist needs and the supply of destinations is associated with travelling or mobilization activities. Travel activities start from choosing destinations, planning trips, making payments, carrying out tourist activities at destinations, to returning to their residences. This travel experience is shaped by cross-sectoral collaboration starting from infrastructure, transportation, food, environmental management, human resource capacity management, and technology. Therefore, tourism leaders must be able to mobilize all supporting sectors to deliver quality travel experiences.
The built model has mapped linkages between the tourism visit subsystem and destination service capabilities, which are translated into environmental, social, and economic subsystems. The simulation results show that, even though the tourism carrying capacity is exceeded in 2031, the accommodation carrying capacity will be exceeded much faster, namely in 2026. It means that the destination will fails to serve tourists before its tourism carrying capacity exceed the limit. This situation occurs because the ability to provide accommodation consisting of hotels and boats cannot handle the faster immense growth in tourist visits. Increasing the number of hotel rooms will take time. It requires at least three years from planning, construction to being ready for operation. Likewise, adding tourist boat rooms requires at least two years to prepare and build. However, the number of tourist boats will be limited due to reducing the burden on waters and conservation areas. It is necessary to suppress the growth rate of visits and provide time for industry players to invest in increasing the number of hotels and tourist boats. For example, anticipating exceeding carrying capacity in 2026 can be performed by limiting flights or reducing destination promotions. This model can carry out various intervention simulations as a guideline for policymakers.
The model helps oversee tourism management carried out in an integrated manner through cross-sector and multi-stakeholder collaboration. Each actor in the environmental, economic, and social subsystems will maintain a balance to be beneficial in the long term. The SD model allows researchers to obtain a crucial factor in the tourism ecosystem: the number of tourist visits. The SD model does help the decision-making process, which aligns with previous studies that have linked SD to scenario planning or decision-making [44,49,50,51,52,53,54].
By modelling the Labuan Bajo tourism system, this study can map the raised issues in previous research and effectively identify systemic solutions for them. For example, the issue of water scarcity [55,56] can be visualized in projection and solved by adding more clean water resources tapped into the system to anticipate incoming clean water scarcity in 2032. Animals’ behavioural change and ecosystem sustainability [2,57] can be solved by implementing a tourism-carrying capacity to manage tourist visits. The controlled number of visitors will give space and time for the ecosystem to recover after high-impact tourism activities. In the economic subsystem, components consisting of the tourism business of hotels or tourist boats are linkages to the agriculture, fishery, and livestock sectors, which will automatically create jobs and bring economic benefits to non-tourism communities. It is in line with the expected solution from previous study [58]. The model also shows the social benefits of tourism, which are encouraging job creation, increasing the quality of the Komodo dragon conservation habitat, strengthening local communities [59,60,61,62], and gradually accumulatively increasing the HDI and reducing the amount of poverty.
Policymaking is crucial as a follow-up on the model simulation findings to address destination management issues without compromising sustainability. Tourism success cannot only be seen from the number of tourist visits or tourist spending as the primary goal but how the presence of tourism can encourage the life quality of residents to be better than before. Balancing biodiversity management between conservation and responsible tourism in the Komodo National Park Area and the Komodo Biosphere Reserve is challenging. Still, it can start with the tourism carrying capacity of implementation. The carrying capacity can be increased by improving infrastructure, such as adding raw water facilities to meet clean water needs or building waste recycling facilities to reduce residues at final disposal sites. It can also be achieved by adding alternative tourism products or distributing tourists to other destinations to avoid congestion and degradation. Carrying capacity must be integrated with spatial and regional planning so that tourism can run optimally without destroying existing sustainability. This perspective must also be used in integrated transformative governance with multi-stakeholder collaboration [72,73].
Scenario planning will benefit Labuan Bajo tourism. Tourism, environmental, and accommodation carrying capacity are critical success factors in optimizing economic and social benefits [44,74,75]. It also aligns with the comprehensive carrying capacity theory, defined as the maximum or optimal limit for tourism growth without damaging physical, biological, economic, socio-cultural, and psychological conditions [17].
Tourism leaders need to map the destination’s capacity before receiving tourist visits, from the ecological aspect [76], namely the availability of adequate natural resources and the ability to restore itself; the social aspect, namely the acceptance of the community towards the arrival of new cultures without eroding existing culture and even strengthening cultural preservation; and to economic aspect, namely welfare benefits that are distributed not only to specific groups or regions but are felt by all classes of society. However, tourism is also an appropriate tool for transferring knowledge and social transformation of the local community due to interactions between locals with tourists. The multi-stakeholder collaboration integration model is a perspective used by destination managers to lead destination orchestration with the goal of high-quality travel experience with commitment of sustainability.

6. Conclusions

The integrated model of sustainable tourism management in Labuan Bajo integrates the management of tourist visits with accommodation availability, food availability, increasing GRDP, poverty alleviation, and improving the quality of life of the local community. Carrying capacity is essential to ensure the destination’s longevity and sustainability in designing a tourism destination. The sustainable tourism integration model compiled by researchers has proven that the environmental, social, and economic dimensions represented by the simplified components will be limited by the carrying capacity from various aspects. It is in line with the theory of sustainable tourism, which is implemented through the carrying capacity management.
Sustainable tourism management requires multi-stakeholder collaboration that considers the carrying capacity to improve the quality of the tourism experience effectively. The multi-stakeholder collaboration model is applied to balance the three pillars of sustainability: environmentally sustainable, economically profitable, and socially acceptable. The model helps map the distribution of stakeholder roles and responsibilities. Intervention scenario simulations can be developed further with various modeller objectives to obtain information and behavioural trends between components incorporated in the tourism system.
Labuan Bajo has evolved to be the next world-class biodiversity destination. The port town now has attracted investment from the government and private sectors, which is expected to increase tourist visits while driving welfare benefits due to increased tourism spending on local products and creating jobs for the community. However, the sensitive biodiversity as the main attraction must be managed wisely so that the world-class tourism potential can preserve the environment.
Using this model helps provide an overview of the current situation of sustainable tourism from a tourist destination for policymakers and tourism stakeholders. Trends and findings from simulation results are input for policy formulation, which must anticipate the limited ability of destinations to handle tourism activities. The tourism carrying capacity of the destination must be the primary reference in deciding on destination management.
It is necessary to periodically collect field data for each system component to optimise the built model in describing the dynamic situation. Measurements are essential to solving exceeding tourism carrying capacities problems. This model shows that achieving sustainable tourism requires more than just the role of actors in the tourism sector but also requires the role of other significant sectors, such as the availability of infrastructure, accessibility, food, to social transformation.
The limitations of the research in building the model are caused by the unavailability of all official data and information, so adjustments need to be made based on input from stakeholders. Data 2022 has yet to be available because the Bureau of Statistics will officially release it at the end of 2023. However, the pandemic in 2020–2021 had given outlier data, which the researchers used to adapt the result. The developed tourism model only simulates tourist travel patterns for the scope of seven tourist points in KTA 1 of Komodo National Park and eight tourist points in KTA 2 of Labuan Bajo. The model uses only food commodities such as rice, fish, meat, vegetables, and fruit from West Manggarai Regency. Other factors are considered exogenous factors that are not considered in the model.
The researcher recommends conducting further research that develops models in more detail on each aspect of sustainability. Adding other limiting factors such as land-carrying capacity, energy-carrying capacity, human resource-carrying capacity, and others is necessary. The model produced in this study must also be tested on other tourist destinations, with adjustments to the local context.

Author Contributions

Conceptualization, S.F.; methodology, S.F. and T.E.B.S.; software, S.F. and T.E.B.S.; validation, S.F., T.E.B.S. and R.P.T.; formal analysis, S.F., T.E.B.S. and R.P.T.; investigation, S.F. and T.E.B.S.; resources, S.F.; data curation, S.F., T.E.B.S. and R.P.T.; writing—original draft preparation, S.F.; writing—review and editing, S.F., T.E.B.S. and R.P.T.; visualization, S.F., T.E.B.S. and R.P.T.; supervision, T.E.B.S. and R.P.T.; project administration, S.F.; funding acquisition, S.F. All authors have read and agreed to the published version of the manuscript.

Funding

This research received no external funding.

Institutional Review Board Statement

Not applicable.

Informed Consent Statement

Not applicable.

Data Availability Statement

All data have been presented in the paper.

Acknowledgments

The authors thank the Labuan Bajo Flores Tourism Authority and the Ministry of Tourism and Creative Economy Republic of Indonesia for supporting data and discussion in this context.

Conflicts of Interest

The authors declare no conflict of interest.

References

  1. Central Bureau of Statistics of West Manggarai Regency. West Manggarai Numbers 2020, 2020, 181.
  2. Ardiantiono; Jessop, T.S.; Purwandana, D.; Ciofi, C.; Imansyah, M.J.; Panggur, M.R.; Ariefiandy, A. Effects of human activities on Komodo dragons in Komodo National Park. Biodivers. Conserv. 2018, 27, 3329–3347. [Google Scholar] [CrossRef]
  3. Ariefiandy, A.; Purwandana, D.; Benu, Y.J.; Letnic, M.; Jessop, T.S. Knee deep in trouble: Rusa deer use an aquatic escape behaviour to delay attack by Komodo dragons. Aust. Mammal. 2019, 42, 103–105. [Google Scholar] [CrossRef]
  4. Ariefiandy, A.; Purwandana, D.; Natali, C.; Imansyah, M.J.; Surahman, M.; Jessop, T.S.; Ciofi, C. Conservation of Komodo dragons Varanus komodoensis in the Wae Wuul nature reserve, Flores, Indonesia: A multidisciplinary approach. Int. Zoo Yearb. 2015, 49, 67–80. [Google Scholar] [CrossRef]
  5. Jessop, T.S.; Ariefiandy, A.; Purwandana, D.; Ciofi, C.; Imansyah, J.; Benu, Y.J.; Fordham, D.A.; Forsyth, D.M.; Mulder, R.A.; Phillips, B.L. Exploring mechanisms and origins of reduced dispersal in island Komodo dragons. Proc. R. Soc. B Biol. Sci. 2018, 285, 20181829. [Google Scholar] [CrossRef] [Green Version]
  6. Jessop, T.S.; Madsen, T.; Ciofi, C.; Imansyah, M.J.; Purwandana, D.; Rudiharto, H.; Arifiandy, A.; Phillips, J.A. Island differences in population size structure and catch per unit effort and their conservation implications for Komodo dragons. Biol. Conserv. 2007, 135, 247–255. [Google Scholar] [CrossRef]
  7. Ministry of Environment and Forestry Republic of Indonesia. Komodo National Park 25 Year Management Plan; Ministry of Environment and Forestry Republic of Indonesia: Labuan Bajo, Indonesia, 2000.
  8. Kennedi, U.F.; Kusrini, M.D.; Ariefiandy, A.; Mardiastuti, A. Invasive toads are close to but absent from Komodo National Park. BIO Web. Conf. 2020, 19, 00017. [Google Scholar] [CrossRef] [Green Version]
  9. Ministry of Environment and Forestry Republic of Indonesia. Komodo National Park Management Plan 2016–2025; Ministry of Environment and Forestry Republic of Indonesia: Labuan Bajo, Indonesia, 2016.
  10. Dushani, S.N.; Aanesen, M.; Vondolia, G.K. Balancing conservation goals and ecotourism development in coastal wetland management in Sri Lanka: A choice experiment. Ocean Coast. Manag. 2021, 210, 105659. [Google Scholar] [CrossRef]
  11. García-Jiménez, R.; Morales-Reyes, Z.; Pérez-García, J.M.; Margalida, A. Economic valuation of non-material contributions to people provided by avian scavengers: Harmonizing conservation and wildlife-based tourism. Ecol. Econ. 2021, 187, 107088. [Google Scholar] [CrossRef]
  12. Gonzáles-Mantilla, P.G.; Gallagher, A.J.; León, C.J.; Vianna, G.M.S. Challenges and conservation potential of shark-diving tourism in the Macaronesian archipelagos. Mar. Policy 2021, 131, 104632. [Google Scholar] [CrossRef]
  13. Zhou, W.; Zheng, B.; Zhang, Z.-Q.; Song, Z.-J.; Duan, W. The role of eco-tourism in ecological conservation in giant panda nature reserve. J. Environ. Manag. 2021, 295, 113077. [Google Scholar] [CrossRef]
  14. Muntifering, J.R.; Clark, S.; Linklater, W.L.; Uri-Khob, S.; Hebach, E.; Cloete, J.; Jacobs, S.; Knight, A.T. Lessons from a conservation and tourism cooperative: The Namibian black rhinoceros case. Ann. Tour. Res. 2020, 82, 102918. [Google Scholar] [CrossRef]
  15. Tanalgo, K.C.; Hughes, A.C. The potential of bat-watching tourism in raising public awareness towards bat conservation in the Philippines. Environ. Chall. 2021, 4, 100140. [Google Scholar] [CrossRef]
  16. Warne, S.J.; Thompson, M. Future approaches to evaluating tourism in the developing world: Assessing realism in the Solomon Islands. J. Hosp. Tour. Manag. 2022, 50, 391–399. [Google Scholar] [CrossRef]
  17. Wang, J.; Huang, X.; Gong, Z.; Cao, K. Dynamic assessment of tourism carrying capacity and its impacts on tourism economic growth in urban tourism destinations in China. J. Destin. Mark. Manag. 2020, 15, 100383. [Google Scholar] [CrossRef]
  18. Wang, W.C.; Lin, C.H. A model for sustainable tourism development of hot spring destinations following poverty alleviation: Understanding the tourists’ perspective. Sustainability 2021, 13, 9856. [Google Scholar] [CrossRef]
  19. Bahja, F.; Hancer, M. Eco-guilt in tourism: Do tourists intend to behave environmentally friendly and still revisit? J. Destin. Mark. Manag. 2021, 20, 100602. [Google Scholar] [CrossRef]
  20. Insch, A. The challenges of over-tourism facing New Zealand: Risks and responses. J. Destin. Mark. Manag. 2020, 15, 100378. [Google Scholar] [CrossRef]
  21. Zhang, S.; Chan, E.S.W. A modernism-based interpretation of sustainable tourism. Int. J. Tour. Res. 2020, 22, 223–237. [Google Scholar] [CrossRef]
  22. Gkoumas, A. Evaluating a standard for sustainable tourism through the lenses of local industry. Heliyon 2019, 5, e02707. [Google Scholar] [CrossRef]
  23. Grilli, G.; Tyllianakis, E.; Luisetti, T.; Ferrini, S.; Turner, R.K. Prospective tourist preferences for sustainable tourism development in Small Island Developing States. Tour. Manag. 2021, 82, 1041178. [Google Scholar] [CrossRef]
  24. Diesendorf, M.; Hamilton, C. Human Ecology, Human Economy: Ideas for an Ecologically Sustainable Future; Allen & Unwin: St. Leonards, Australia, 1997. [Google Scholar]
  25. Pan, S.Y.; Gao, M.; Kim, H.; Shah, K.J.; Pei, S.L.; Chiang, P.C. Advances and challenges in sustainable tourism toward a green economy. Sci. Total Environ. 2018, 635, 452–469. [Google Scholar] [CrossRef] [PubMed]
  26. Sheller, M. Reconstructing tourism in the Caribbean: Connecting pandemic recovery, climate resilience and sustainable tourism through mobility justice. J. Sustain. Tour. 2020, 29, 1436–1449. [Google Scholar] [CrossRef]
  27. Schoneveld, G.C. Sustainable business models for inclusive growth: Towards a conceptual foundation of inclusive business. J. Clean. Prod. 2020, 277, 124062. [Google Scholar] [CrossRef]
  28. Valdivia, S.; Ugaya, C.M.L.; Hildenbrand, J.; Traverso, M.; Mazijn, B.; Sonnemann, G. A UNEP/SETAC approach towards a life cycle sustainability assessment—Our contribution to Rio+20. Int. J. Life Cycle Assess. 2013, 18, 1673–1685. [Google Scholar] [CrossRef]
  29. Andereck, K.L.; Nyaupane, G.P. Exploring the Nature of Tourism and Quality of Life Perceptions among Residents. J. Travel Res. 2011, 50, 248–260. [Google Scholar] [CrossRef]
  30. Camargo, B.A.; Winchenbach, A.; Vázquez-Maguirre, M. Restoring the dignity of indigenous people: Perspectives on tourism employment. Tour. Manag. Perspect. 2022, 41, 100946. [Google Scholar] [CrossRef]
  31. Gyawali, P.; Bhandari, S.; Shrestha, J. Horti-tourism; an approach for strengthening farmers’ economy in the post-covid situation. J. Agric. Food Res. 2022, 7, 100278. [Google Scholar] [CrossRef]
  32. An, H.M.; Xiao, C.D.; Tong, Y.; Fan, J. Ice-and-snow tourism and its sustainable development in China: A new perspective of poverty alleviation. Adv. Clim. Chang. Res. 2021, 12, 881–893. [Google Scholar] [CrossRef]
  33. Pan, Y.; Wang, X.; Ryan, C. Chinese seniors holidaying, elderly care, rural tourism and rural poverty alleviation programmes. J. Hosp. Tour. Manag. 2021, 46, 134–143. [Google Scholar] [CrossRef]
  34. Higgins-Desbiolles, F. The “war over tourism”: Challenges to sustainable tourism in the tourism academy after COVID-19. J. Sustain. Tour. 2020, 29, 551–569. [Google Scholar] [CrossRef]
  35. Zhang, J. The effects of tourism on income inequality: A meta-analysis of econometrics studies. J. Hosp. Tour. Manag. 2021, 48, 312–321. [Google Scholar] [CrossRef]
  36. Pham, T.T.T. Tourism in marine protected areas: Can it be considered as an alternative livelihood for local communities? Mar. Policy 2020, 115, 103891. [Google Scholar] [CrossRef]
  37. Lee, C.C.; Chen, M.P. Ecological footprint, tourism development, and country risk: International evidence. J. Clean. Prod. 2021, 279, 123671. [Google Scholar] [CrossRef]
  38. Shi, Y.; Shi, S.; Wang, H. Reconsideration of the methodology for estimation of land population carrying capacity in Shanghai metropolis. Sci. Total Environ. 2019, 652, 367–381. [Google Scholar] [CrossRef]
  39. Virtanen, P.K.; Siragusa, L.; Guttorm, H. Introduction: Toward more inclusive definitions of sustainability. Curr. Opin. Environ. Sustain. 2020, 43, 77–82. [Google Scholar] [CrossRef]
  40. Visseren-Hamakers, I.J.; Razzaque, J.; McElwee, P.; Turnhout, E.; Kelemen, E.; Rusch, G.M.; Fernández-Llamazares, A.; Chan, I.; Lim, M.; Islar, M.; et al. Transformative governance of biodiversity: Insights for sustainable development. Curr. Opin. Environ. Sustain. 2021, 53, 20–28. [Google Scholar] [CrossRef]
  41. Dimitrovski, D.; Lemmetyinen, A.; Nieminen, L.; Pohjola, T. Understanding coastal and marine tourism sustainability—A multi-stakeholder analysis. J. Destin. Mark. Manag. 2021, 19, 100554. [Google Scholar] [CrossRef]
  42. Ahmad, R.; Nurmawati, K.M.; Kodir, A. Air dan konflik: Studi ketersediaan sumber daya air di kawasan taman nasional Komodo. J. Ilmu Sos. dan Hum. 2021, 10, 337–350. [Google Scholar] [CrossRef]
  43. Kodir, A.; Tanjung, A.; Astina, I.K.; Nurwan, M.A.; Nusantara, A.G.; Ahmad, R. The Dynamics of Access on Tourism Development in Labuan Bajo, Indonesia. Geoj. Tour. Geosites 2020, 29, 662–671. [Google Scholar] [CrossRef]
  44. Mai, T.; Smith, C. Scenario-based planning for tourism development using system dynamic modelling: A case study of Cat Ba Island, Vietnam. Tour. Manag. 2018, 68, 336–354. [Google Scholar] [CrossRef]
  45. Hosseini, K.; Stefaniec, A.; Hosseini, S.P. World Heritage Sites in developing countries: Assessing impacts and handling complexities toward sustainable tourism. J. Destin. Mark. Manag. 2021, 20, 100616. [Google Scholar] [CrossRef]
  46. Sweeney, L.B.; Sterman, J.D. Bathtub dynamics: Initial results of a systems thinking inventory. Syst. Dyn. Rev. 2000, 16, 249–286. [Google Scholar]
  47. Miller, G.T.; Spoolman, S.E. Environmental Science, 15th ed.; Cengange Learning: Boston, MA, USA, 2016. [Google Scholar]
  48. Martínez, J.M.G.; Martín, J.M.M.; Fernández, J.A.S.; Mogorrón-Guerrero, H. An analysis of the stability of rural tourism as a desired condition for sustainable tourism. J. Bus. Res. 2019, 100, 165–174. [Google Scholar] [CrossRef]
  49. Mai, T.; Smith, C. Addressing the threats to tourism sustainability using systems thinking: A case study of Cat Ba Island, Vietnam. J. Sustain. Tour. 2015, 23, 1504–1528. [Google Scholar] [CrossRef]
  50. Utami, T.N.; Fattah, M.; Intyas, C.A. The System Dynamic of Mangrove Ecotourism of “Kampung Blekok” Situbondo East Java Indonesia: Economic and Ecological Dimension. Environ. Res. Eng. Manag. 2022, 78, 58–72. [Google Scholar] [CrossRef]
  51. Santoso, S.; Widyanty, W.; Nurhidajat, R.; Marfatah, M.R.; Mahmud, G.; Fahlevi, M.; Aljuaid, M.; Zhghenti, T.; Shahid, D. System dynamics modeling for developing an agrotourism-creative economy in the framework of the village innovation system. Front. Environ. Sci. 2022, 10, 962235. [Google Scholar] [CrossRef]
  52. Luo, Y.; Mou, Y.; Wang, Z.; Su, Z.; Qin, Y. Scenario-based planning for a dynamic tourism system with carbon footprint analysis: A case study of Xingwen Global Geopark, China. J. Clean. Prod. 2020, 254, 119999. [Google Scholar] [CrossRef]
  53. Wang, L.; Wang, R.; Yan, H. System-dynamics modeling for exploring the impact of industrial-structure adjustment on the water quality of the river network in the Yangtze Delta Area. Sustainability 2021, 13, 7696. [Google Scholar] [CrossRef]
  54. Sedarati, P.; Santos, S.; Pintassilgo, P. System Dynamics in Tourism Planning and Development. Tour. Plan. Dev. 2019, 16, 256–280. [Google Scholar] [CrossRef]
  55. Muchtar, F.S.; Hasibuan, H.S.; De Rozari, P. Land management semi-arid archipelago based on water carrying capacity: Studies on Labuan Bajo, East Nusa Tenggara. J. Degrad. Min. Lands Manag. 2023, 10, 4647–4658. [Google Scholar] [CrossRef]
  56. Cole, S. Water worries: An intersectional feminist political ecology of tourism and water in Labuan Bajo, Indonesia. Ann. Tour. Res. 2017, 67, 14–24. [Google Scholar] [CrossRef]
  57. Reindrawati, D.Y.; Rhama, B.; Hisan, U.F.C. Threats to Sustainable Tourism in National Parks: Case Studies from Indonesia and South Africa. Afr. J. Hosp. Tour. Leis. 2022, 11, 919–937. [Google Scholar]
  58. Yudhoyono, E.B.; Siregar, H.; Achsani, N.A.; Irawan, T. Financial Performance of Tourism Businesses in Labuan Bajo Tourist Area. Indonesia. J. Environ. Manag. Tour. 2021, 12, 458–465. [Google Scholar] [CrossRef] [PubMed]
  59. Sianipar, I.M.J.; Tehupeiory, A.; Maya, A.J.; Huy, H.L.A.; Tuan, H.Q.; Suryawan, I.W.K. Human Ecosystem Approach to The Dynamics of Sustainable Development in Komodo National Park, Indonesia. J. Gov. Civ. Soc. 2022, 6, 276–291. [Google Scholar]
  60. Benu, F.; Muskanan, M.W.; King, P.G.; Asa, H.M.; Wulakada, H.H. Issue 2 Spring. J. Environ. Manag. Tour. 2020, XI, 250–262. [Google Scholar] [CrossRef]
  61. Islahuddin, I.; Eppang, B.M.; Som, A.P.M.; Masatip, A.; Salim, M.A.M. Adaptation and collaboration of local community in super priority destination tourism program in Labuan Bajo. ETNOSIA J. Etnogr. Indones. 2022, 7, 15–28. [Google Scholar] [CrossRef]
  62. Wibowo, M. Modeling the Potential of Tsunami Hazard in Labuan Bajo Towards A Disaster-Resilient Tourism Area. Indones. J. Geogr. 2022, 54, 83–91. [Google Scholar] [CrossRef]
  63. Muhammadi; Aminullah, E.; Soesilo, B. System Dynamics Analysis: Environmental, Social, Economic, Management, 1st ed.; UMJ Press: Jakarta, Indonesia, 2001; Volume 1. [Google Scholar]
  64. Soesilo, B.; Karuniasa, M. Permodelan Sistem Dinamis, 1st ed.; Lembaga Penerbit Fakultas Ekonomi Universitas Indonesia: Jakarta, Indonesia, 2014; Volume 1. [Google Scholar]
  65. Husain; Zarlis, M.; Mawengkang, H.; Efendi, S. Causal Loop Diagram (CLD) Model in Planning A Sustainable Smart Sharia Tourism. J. Phys Conf. Ser. 2020, 1641, 012099. [Google Scholar] [CrossRef]
  66. Komodo National Park Office. Visitors of Komodo National Park Office 2010–2022; Komodo National Park Office: Labuan Bajo, Indonesia, 2022. [Google Scholar]
  67. West Manggarai Cultural Creative Economy and Tourism Office. West Manggarai Regency Visitor Satisfaction Exit Survey 2022; West Manggarai Cultural Creative Economy and Tourism Office: Labuan Bajo, Indonesia, 2022.
  68. West Manggarai Cultural Creative Economy and Tourism Office. West Manggarai Regency Tourism Data 2022; West Manggarai Cultural Creative Economy and Tourism Office: Labuan Bajo, Indonesia, 2022.
  69. Ministry of Public Works and Housing Republic of Indonesia, 2022. Integrated Tourism Master Plan Komodo National Park and Labuan Bajo; Ministry of Public Works and Housing: Jakarta, Indonesia, 2022.
  70. West Manggarai Regional Water Company. West Manggarai Regency Water Service Data 2022; West Manggarai Regional Water Company: Labuan Bajo, Indonesia, 2022. [Google Scholar]
  71. Obersteiner, G.; Gollnow, S.; Eriksson, M. Carbon footprint reduction potential of waste management strategies in tourism. Environ. Dev. 2021, 39, 100617. [Google Scholar] [CrossRef]
  72. Ariyani, N.; Fauzi, A. Pathways toward the Transformation of Sustainable Rural Tourism Management in Central Java, Indonesia. Sustainability 2023, 15, 2592. [Google Scholar] [CrossRef]
  73. Wondirad, A.; Tolkach, D.; King, B. Stakeholder collaboration as a major factor for sustainable ecotourism development in developing countries. Tour. Manag. 2020, 78, 104024. [Google Scholar] [CrossRef]
  74. Hothi, N.; Hothi, G. Water crisis of Shimla Town: Past and present scenario. Mater. Today Proc. 2022, 64, 1250–1254. [Google Scholar] [CrossRef]
  75. Pizzitutti, F.; Walsh, S.J.; Rindfuss, R.R.; Gunter, R.; Quiroga, D.; Tippett, R.; Mena, C.F. Scenario planning for tourism management: A participatory and system dynamics model applied to the Galapagos Islands of Ecuador. J. Sustain. Tour. 2017, 25, 1117–1137. [Google Scholar] [CrossRef]
  76. Lee, T.H.; Jan, F.H.; Liu, J.T. Developing an indicator framework for assessing sustainable tourism: Evidence from a Taiwan ecological resort. Ecol. Indic. 2021, 125, 107596. [Google Scholar] [CrossRef]
Figure 1. Tourism map of Labuan Bajo and Komodo National Park in West Manggarai Regency, East Nusa Tenggara Province, Indonesia.
Sustainability 15 11937 g001
Figure 2. Causal loop diagram of sustainable tourism.
Sustainability 15 11937 g002
Figure 3. Causal loop diagram of the environmental aspect.
Sustainability 15 11937 g003
Figure 4. Causal loop diagram of the social aspect.
Sustainability 15 11937 g004
Figure 5. Causal loop diagram of the economic aspect.
Sustainability 15 11937 g005
Figure 6. Stock-and-flow diagram of Labuan Bajo sustainable tourism.
Sustainability 15 11937 g006
Figure 7. The number of tourist visits to Komodo National Park.
Sustainability 15 11937 g007
Figure 8. Growth of hotel rooms in West Manggarai Regency: (a) Hotels; (b) Hotel rooms.
Sustainability 15 11937 g008
Figure 9. West Manggarai Food production: (a) Rice production; (b) Fish production; (c) Meat production; (d) Vegetable and fruits production.
Sustainability 15 11937 g009
Figure 10. West Manggarai Poverty and Human Development Index: (a) Poverty; (b) Human Development Index.
Sustainability 15 11937 g010
Figure 11. Model validation.
Sustainability 15 11937 g011aSustainability 15 11937 g011b
Figure 12. BAU simulation of tourist visits.
Sustainability 15 11937 g012
Figure 13. BAU simulation of tourist spending.
Sustainability 15 11937 g013
Figure 14. Accommodation carrying capacity: (a) BAU simulation of accommodation; (b) Accommodation availability.
Sustainability 15 11937 g014
Figure 15. BAU simulation of water carrying capacity.
Sustainability 15 11937 g015
Figure 16. BAU simulation of waste management carrying capacity.
Sustainability 15 11937 g016
Figure 17. Food carrying capacity: (a) BAU simulation of rice capacity; (b) BAU simulation of fish capacity; (c) BAU simulation of meat capacity; (d) BAU simulation of vegetable and fruit capacity.
Sustainability 15 11937 g017
Figure 18. BAU simulation of gross domestic regional product.
Sustainability 15 11937 g018
Figure 19. BAU simulation social aspect: (a) BAU simulation of poverty; (b) BAU simulation of human development index.
Sustainability 15 11937 g019
Table 1. System dynamics modelling stages.
Muhammadi et al. [63]Soesilo & Karuniasa [64]
  • Create a concept
  • Observe the system
2.
Modelling
2.
Develop the problem structure
3.
Perform model simulations
3.
Modelling
4.
Perform model validation
4.
Perform model validation
5.
Analyse policies
5.
Perform the Business-as-Usual model simulation
6.
Perform the intervention model simulation
7.
Interpretation and utilization of model simulation results
Table 2. Components of sustainable tourism system based on Labuan Bajo coastal tourism.
SubsystemSpecific Key ParametersUnit
Tourism VisitTourist visitspersons
Tourist length of staydays
Tourist spendingIDR
Tourism carrying capacitypersons/year
EnvironmentDomestic water consumptionlitres/person/day
Tourism water consumptionlitres/bed/day
Water supply capacitym3/year
Water needsm3/year
Waste productionton/day
Tourist waste generationkg/day
Waste management capacityton/year
SocialInfrastructuredimensionless
Workforcepersons
Povertypersons
Human Development Indexdimensionless
EconomyGRDPIDR
InvestmentIDR
Number of hotelsunits
Number of hotel roomsrooms
Number of boatsunits
Number of boat roomsrooms
Rice productionton
Fish productionton
Meat productionton
Vegetable and fruit production ton
Table 3. Tourist length of stay and spending.
DomesticForeigner
Average length of stay (days)5.254.52
Average spending (IDR)9,604,11610,697,187
Average spending on souvenirs (IDR)1,853,7761,399,445
Percentage of tourists shopping souvenirs (%)7342
Source: West Manggarai Cultural Creative Economy and Tourism Office, 2022 [67].
Table 4. Growth of tourist boat rooms.
YearNumber of Tourist Boats (Unit)GrowthNumber of Rooms (Rooms)Growth
201690 247
201876−18%30419%
202012640%53743%
Average 2016–202011% 31%
Source: West Manggarai Cultural Creative Economy and Tourism Office, 2022 [68].
Table 5. West Manggarai tourism water consumption.
Unit
Domestic water consumption120 litres/person/day
Leak tolerance20%
Tourist water consumption (SNI. 03-7065-2005)250litres/bed/day
Labuan Bajo urban water supply system capacity160litres/second
5,045,760 m3/year
Total surface water flow260,996,054m3/year
Average runoff coefficient of runoff in Komodo district0.397
Total domestic, non-domestic, and tourist water needs5,760,280.35m3/year
Source: Ministry of Public Works and Housing, 2022 [69]; West Manggarai regional water company, 2023 [70].
Table 6. KTA Komodo National Park and KTA Labuan Bajo estimated waste sources.
SourceUnitGeneration
(kg/Unit.Day)
Volume
(litres/Unit.Day)
KTA Komodo National Park
Household waste
Komodo Villageperson0.132.43
Pasir Panjang Villageperson0.132.43
Papagarang Villageperson0.132.43
Total household waste 0.397.29
Non-household waste
Loh Liang tourismtourist0.020.5
Loh Buaya tourismtourist0.020.5
Padar tourismtourist0.020.5
Total non-household waste 0.061.5
Total KTA KNP waste 0.458.79
KTA Labuan Bajo
Householdsperson0.32.5
Medical facilitiesbed0.67.7
Restaurant chair1.69.2
Marketm20.10.6
Hotelbed0.11.9
Officeemployee0.17.9
Storeemployee0.30.5
Schoolstudent0.00.2
Boatspassenger0.68.8
Road accessm0.0250.1
Total household waste 0.32.5
Total non-household waste 3.42536.9
Total KTA Labuan Bajo waste 3.72539.4
Source: Ministry of Public Works and Housing, 2022 [69].
Table 7. West Manggarai tourism waste production.
Unit
Tourist waste generation [71]1.67kg/person/day
Hotel and restaurant1.783ton/day
Tourist boats0.2ton/day
KTA Labuan Bajo waste generation [69]3.725kg/day
Total Labuan Bajo waste in 2020 [69]37,104.59Ton
Labuan Bajo waste management capacity by 20200.397ton/year
Disclaimer/Publisher’s Note: The statements, opinions and data contained in all publications are solely those of the individual author(s) and contributor(s) and not of MDPI and/or the editor(s). MDPI and/or the editor(s) disclaim responsibility for any injury to people or property resulting from any ideas, methods, instructions or products referred to in the content.

