
A Model Assembly Approach of Planning Urban–Rural Transportation Network: A Case Study of Jiangxia District, Wuhan, China

Abstract
:1. Introduction
2. Literature Review
3. Methodology
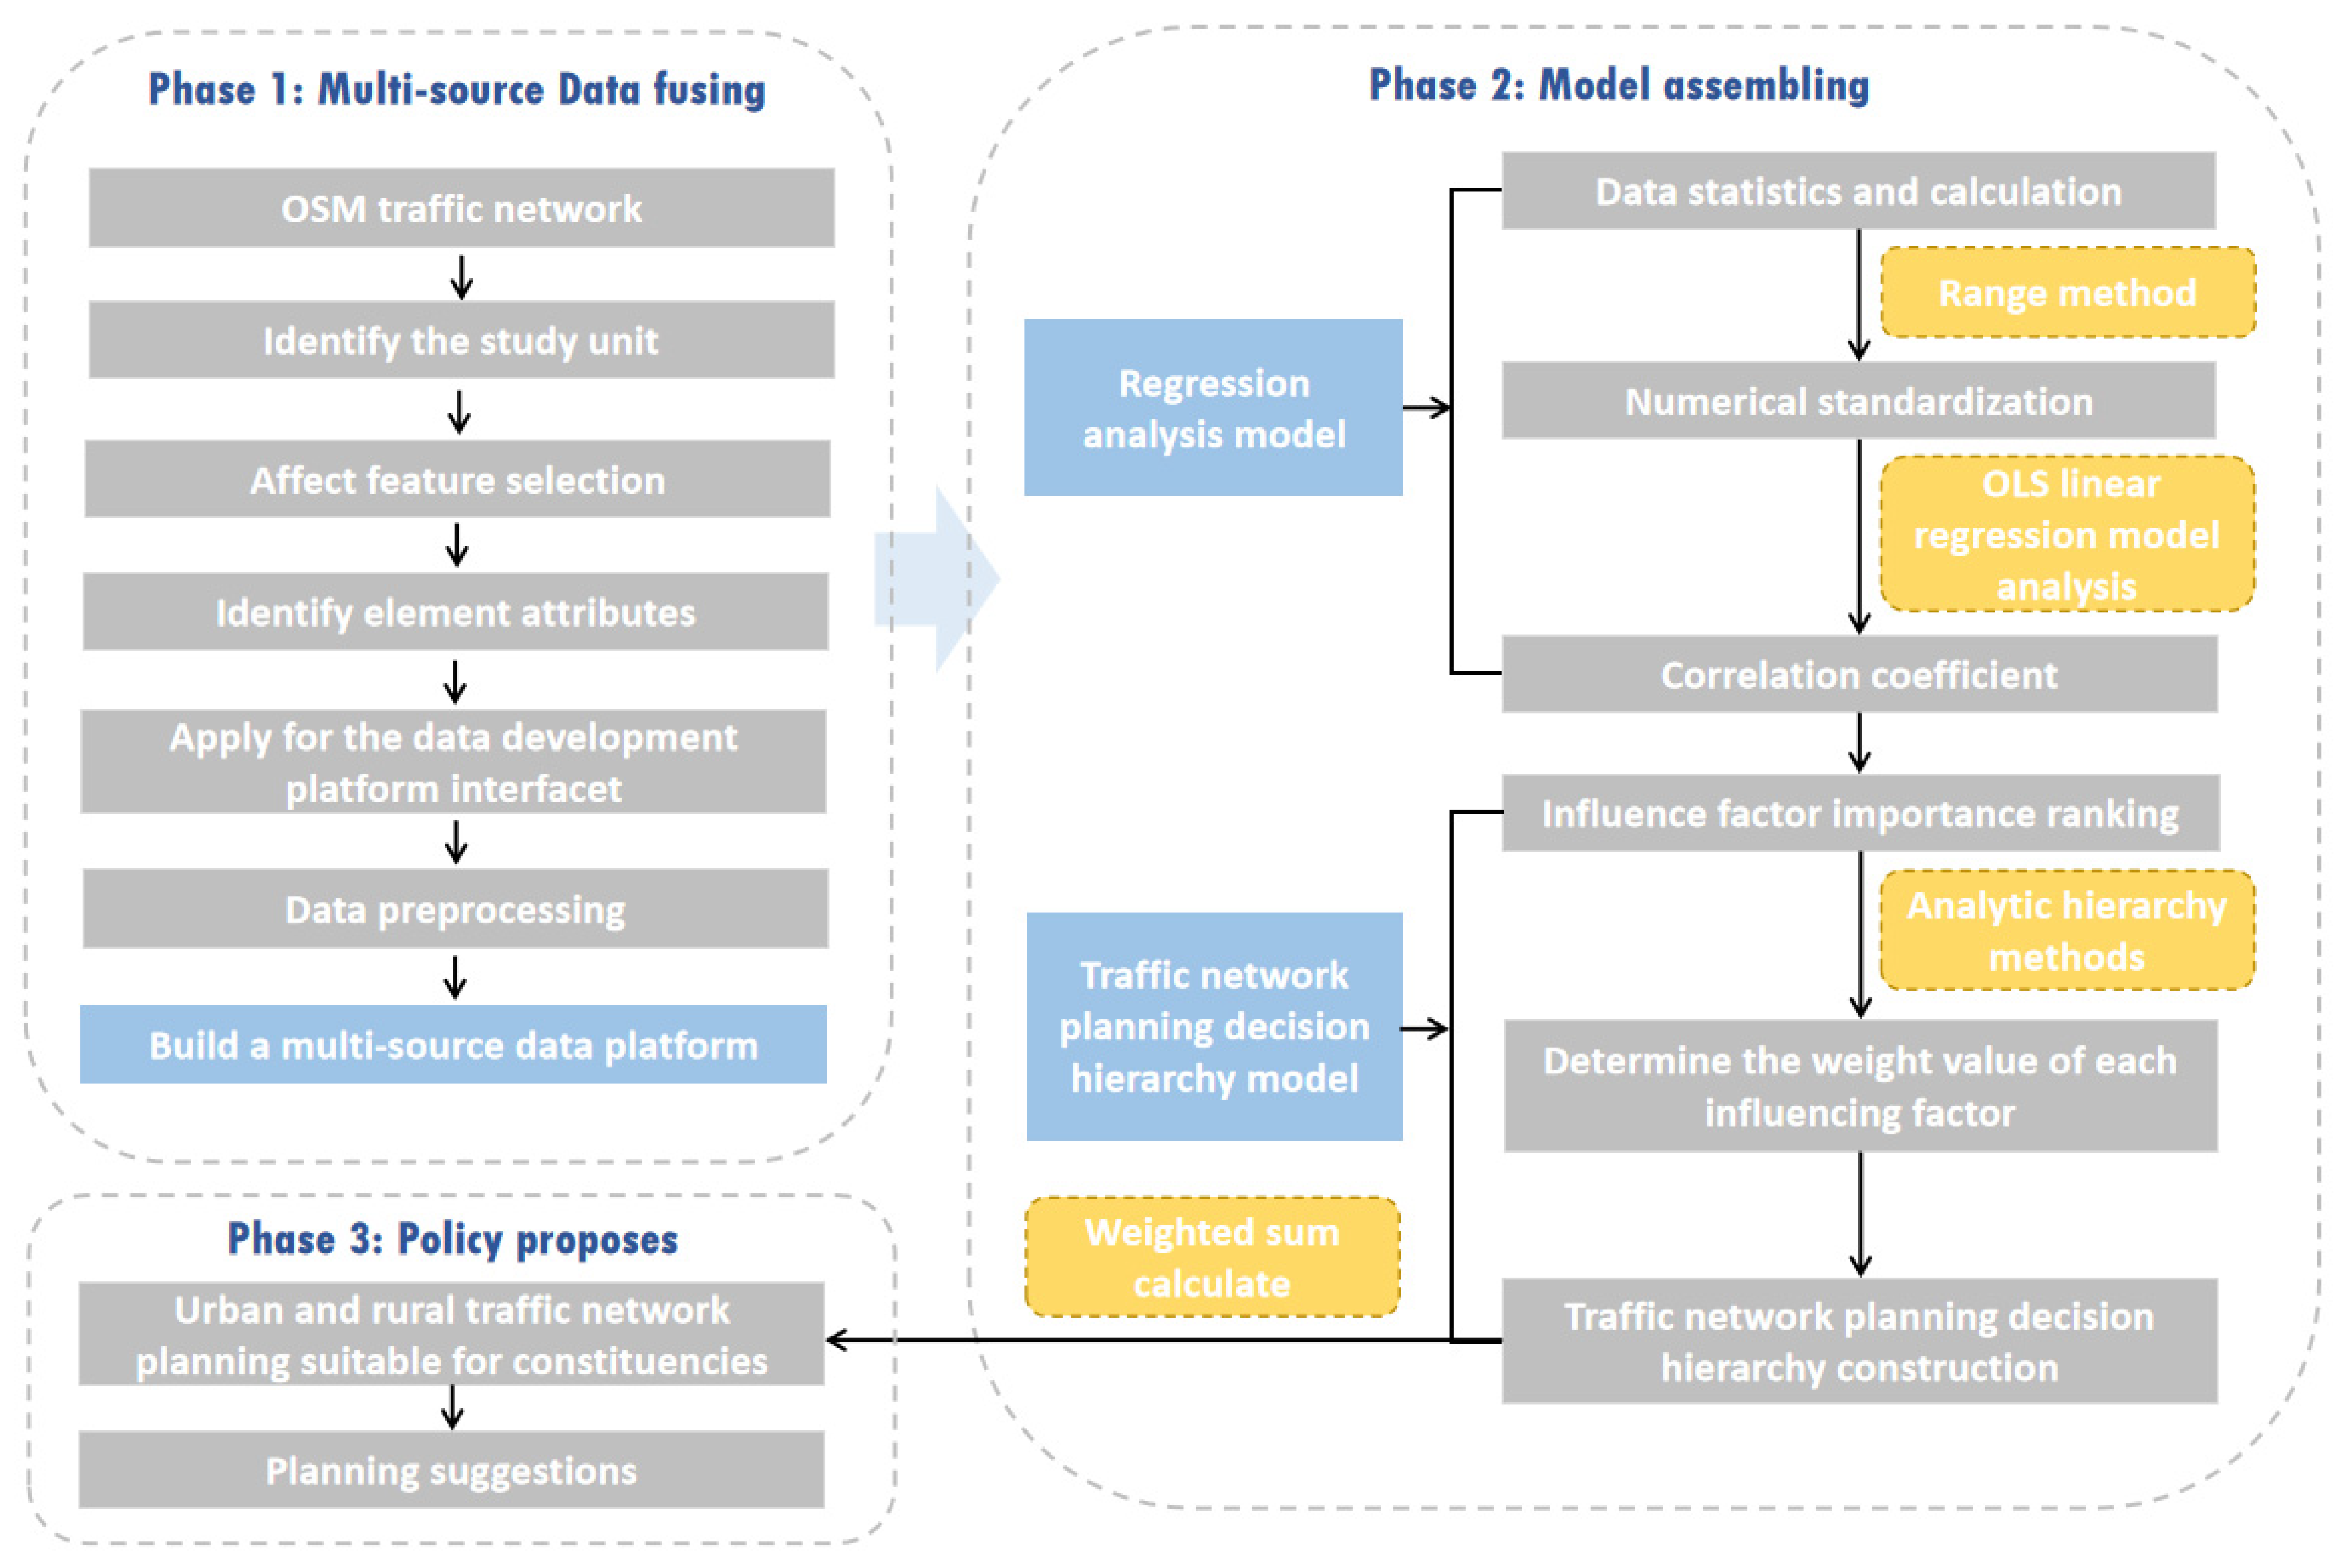
3.1. Workflow of Model Assembly Approach of Urban and Rural Transportation Network Planning
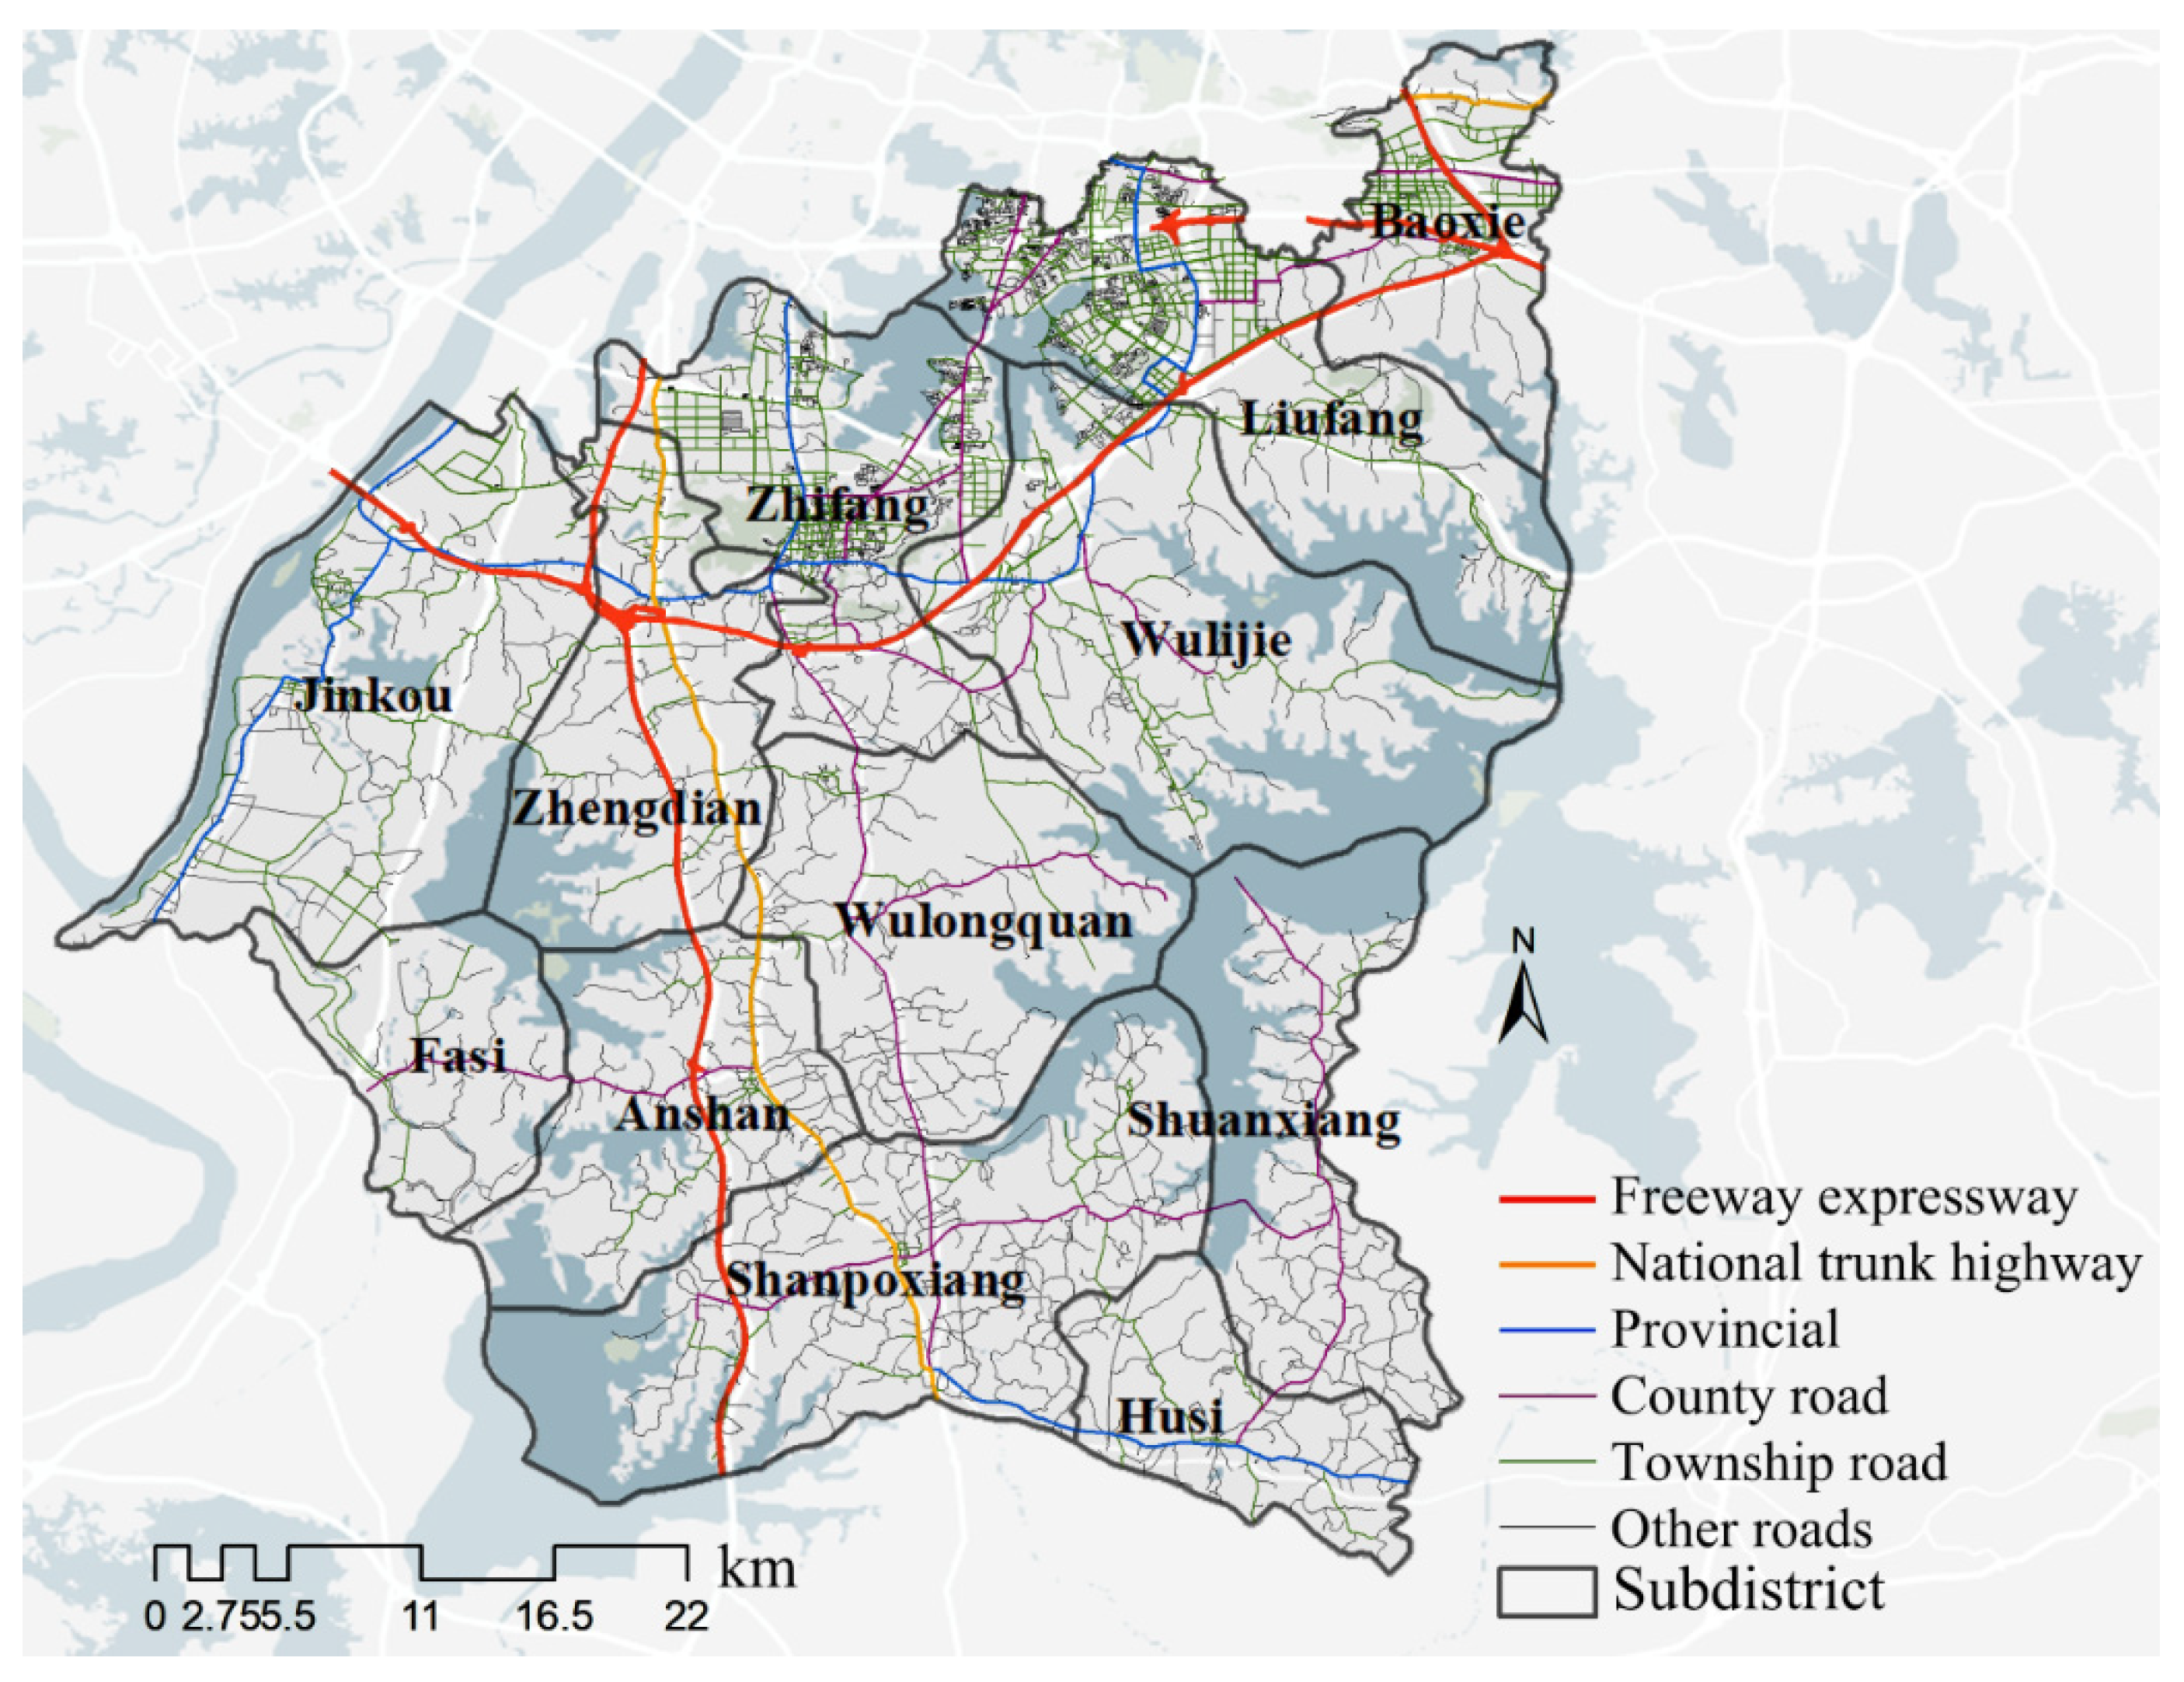
- Collect multi-source data on network map data and POI data in the research area. All data are imported into the unified coordinate system and projected onto the administrative subdistrict map of Jiangxia. The China Geodetic Coordinate System 2000 (CGCS2000) is used for geographical coordinates in this study.
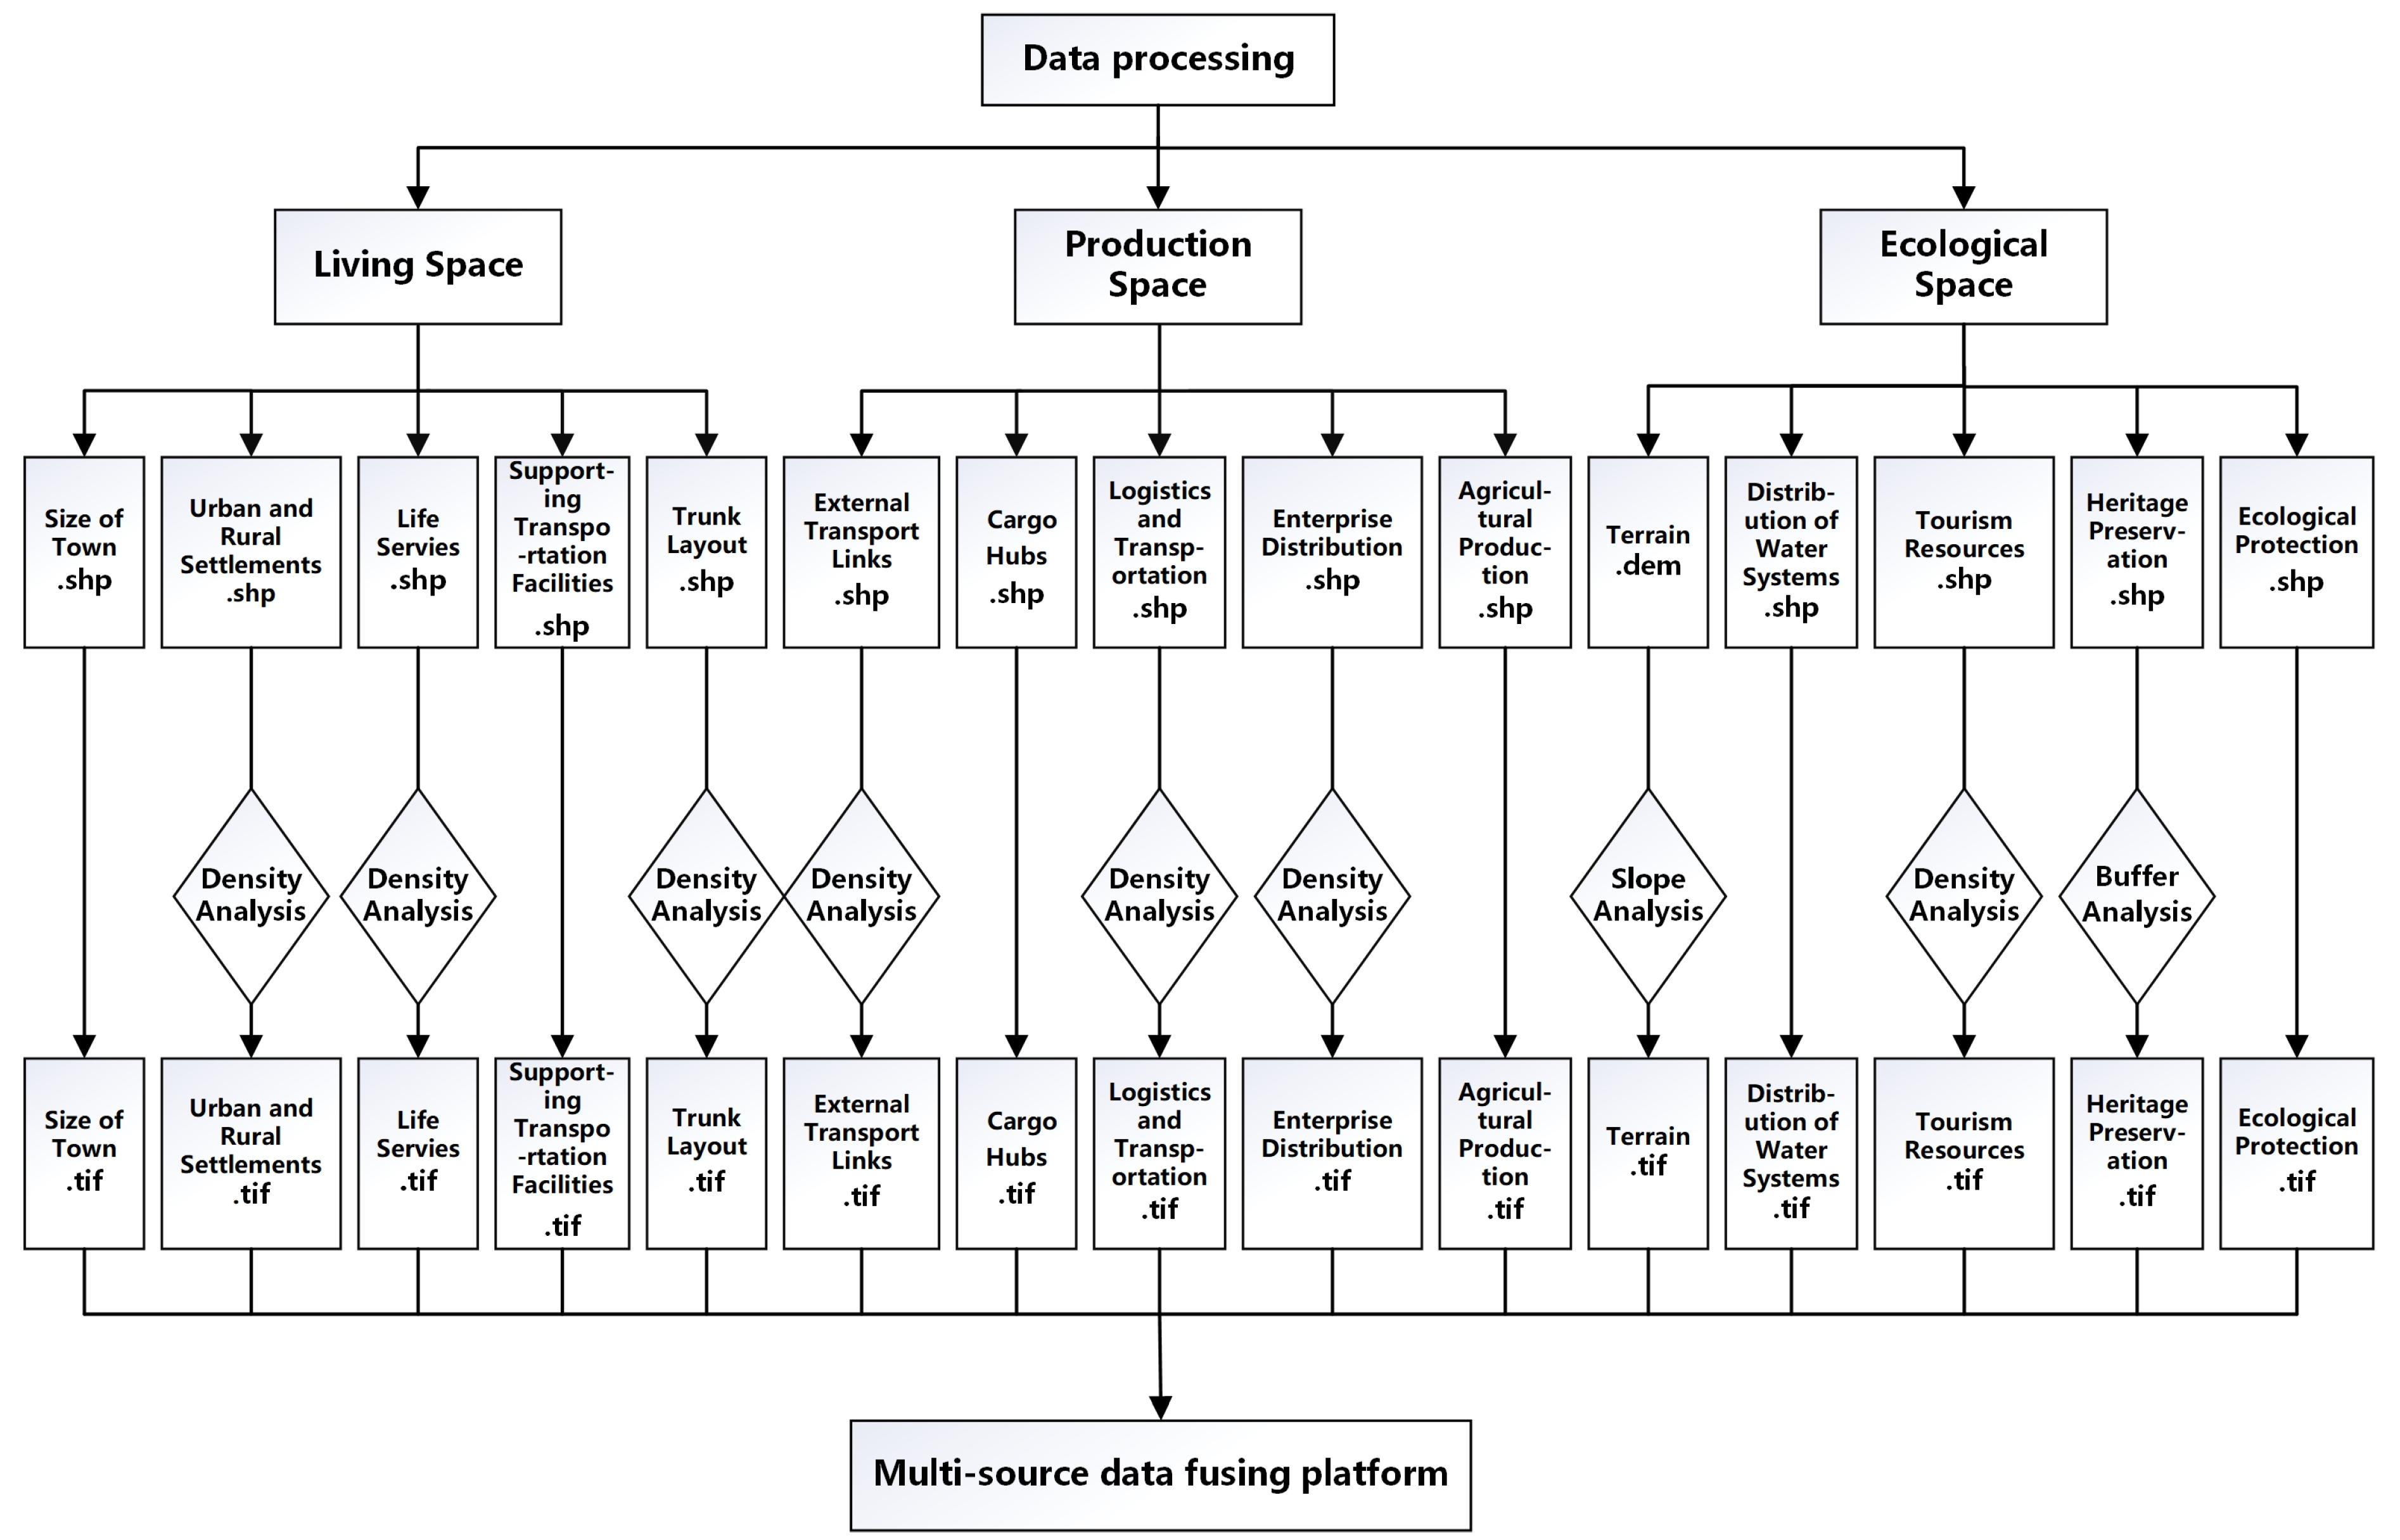
- Calculate and unify data form. The point data and line data are calculated by density analysis, and raster data are obtained. The area data are directly converted to raster data.
- Calculate the density of the transportation network in each subdistrict individually.
- Analyze the correlation between traffic density and its influencing factors by OLS linear regression model. The correlation results of factors provide a reference for the weight ranking of influencing elements of transportation network planning.
- Combined with the analytic hierarchy method, the weight values of various transportation network planning considerations are calculated, and the urban and rural transportation network planning decision-making model is constructed.
- Calculate the suitable area for traffic construction by raster math.
- Put forward corresponding optimization suggestions to solve the limit in urban and rural transportation network.
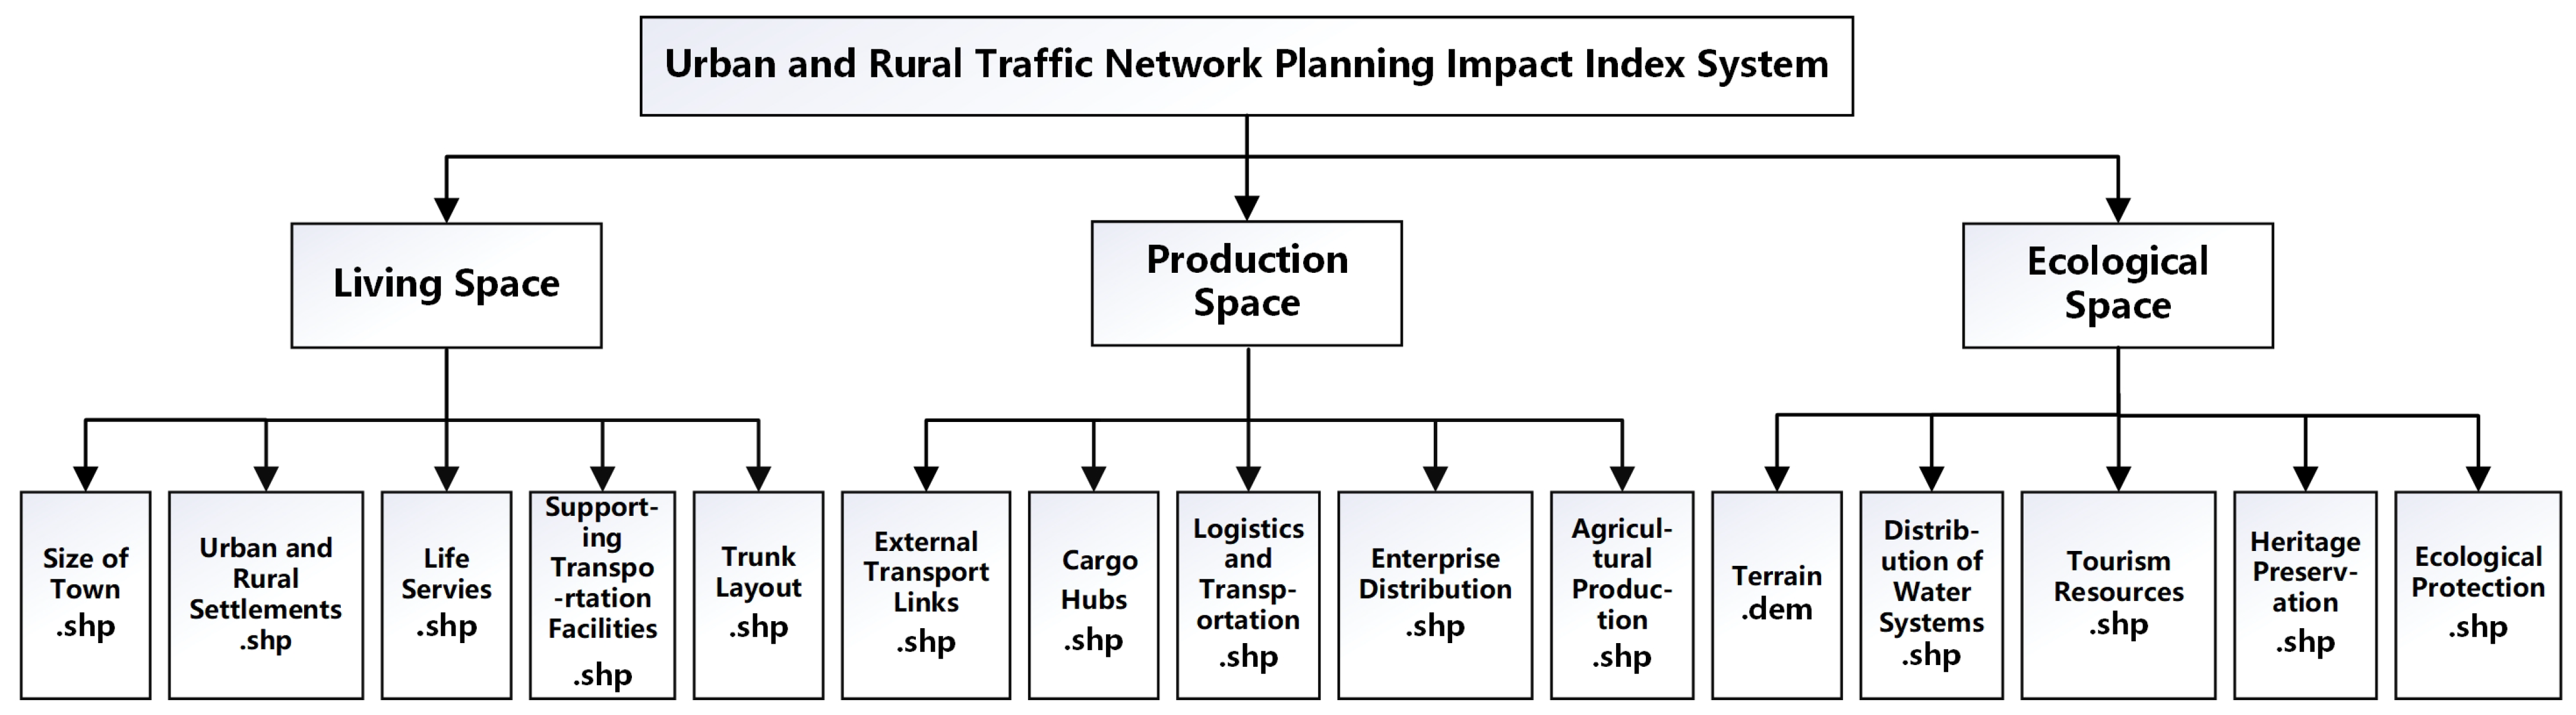
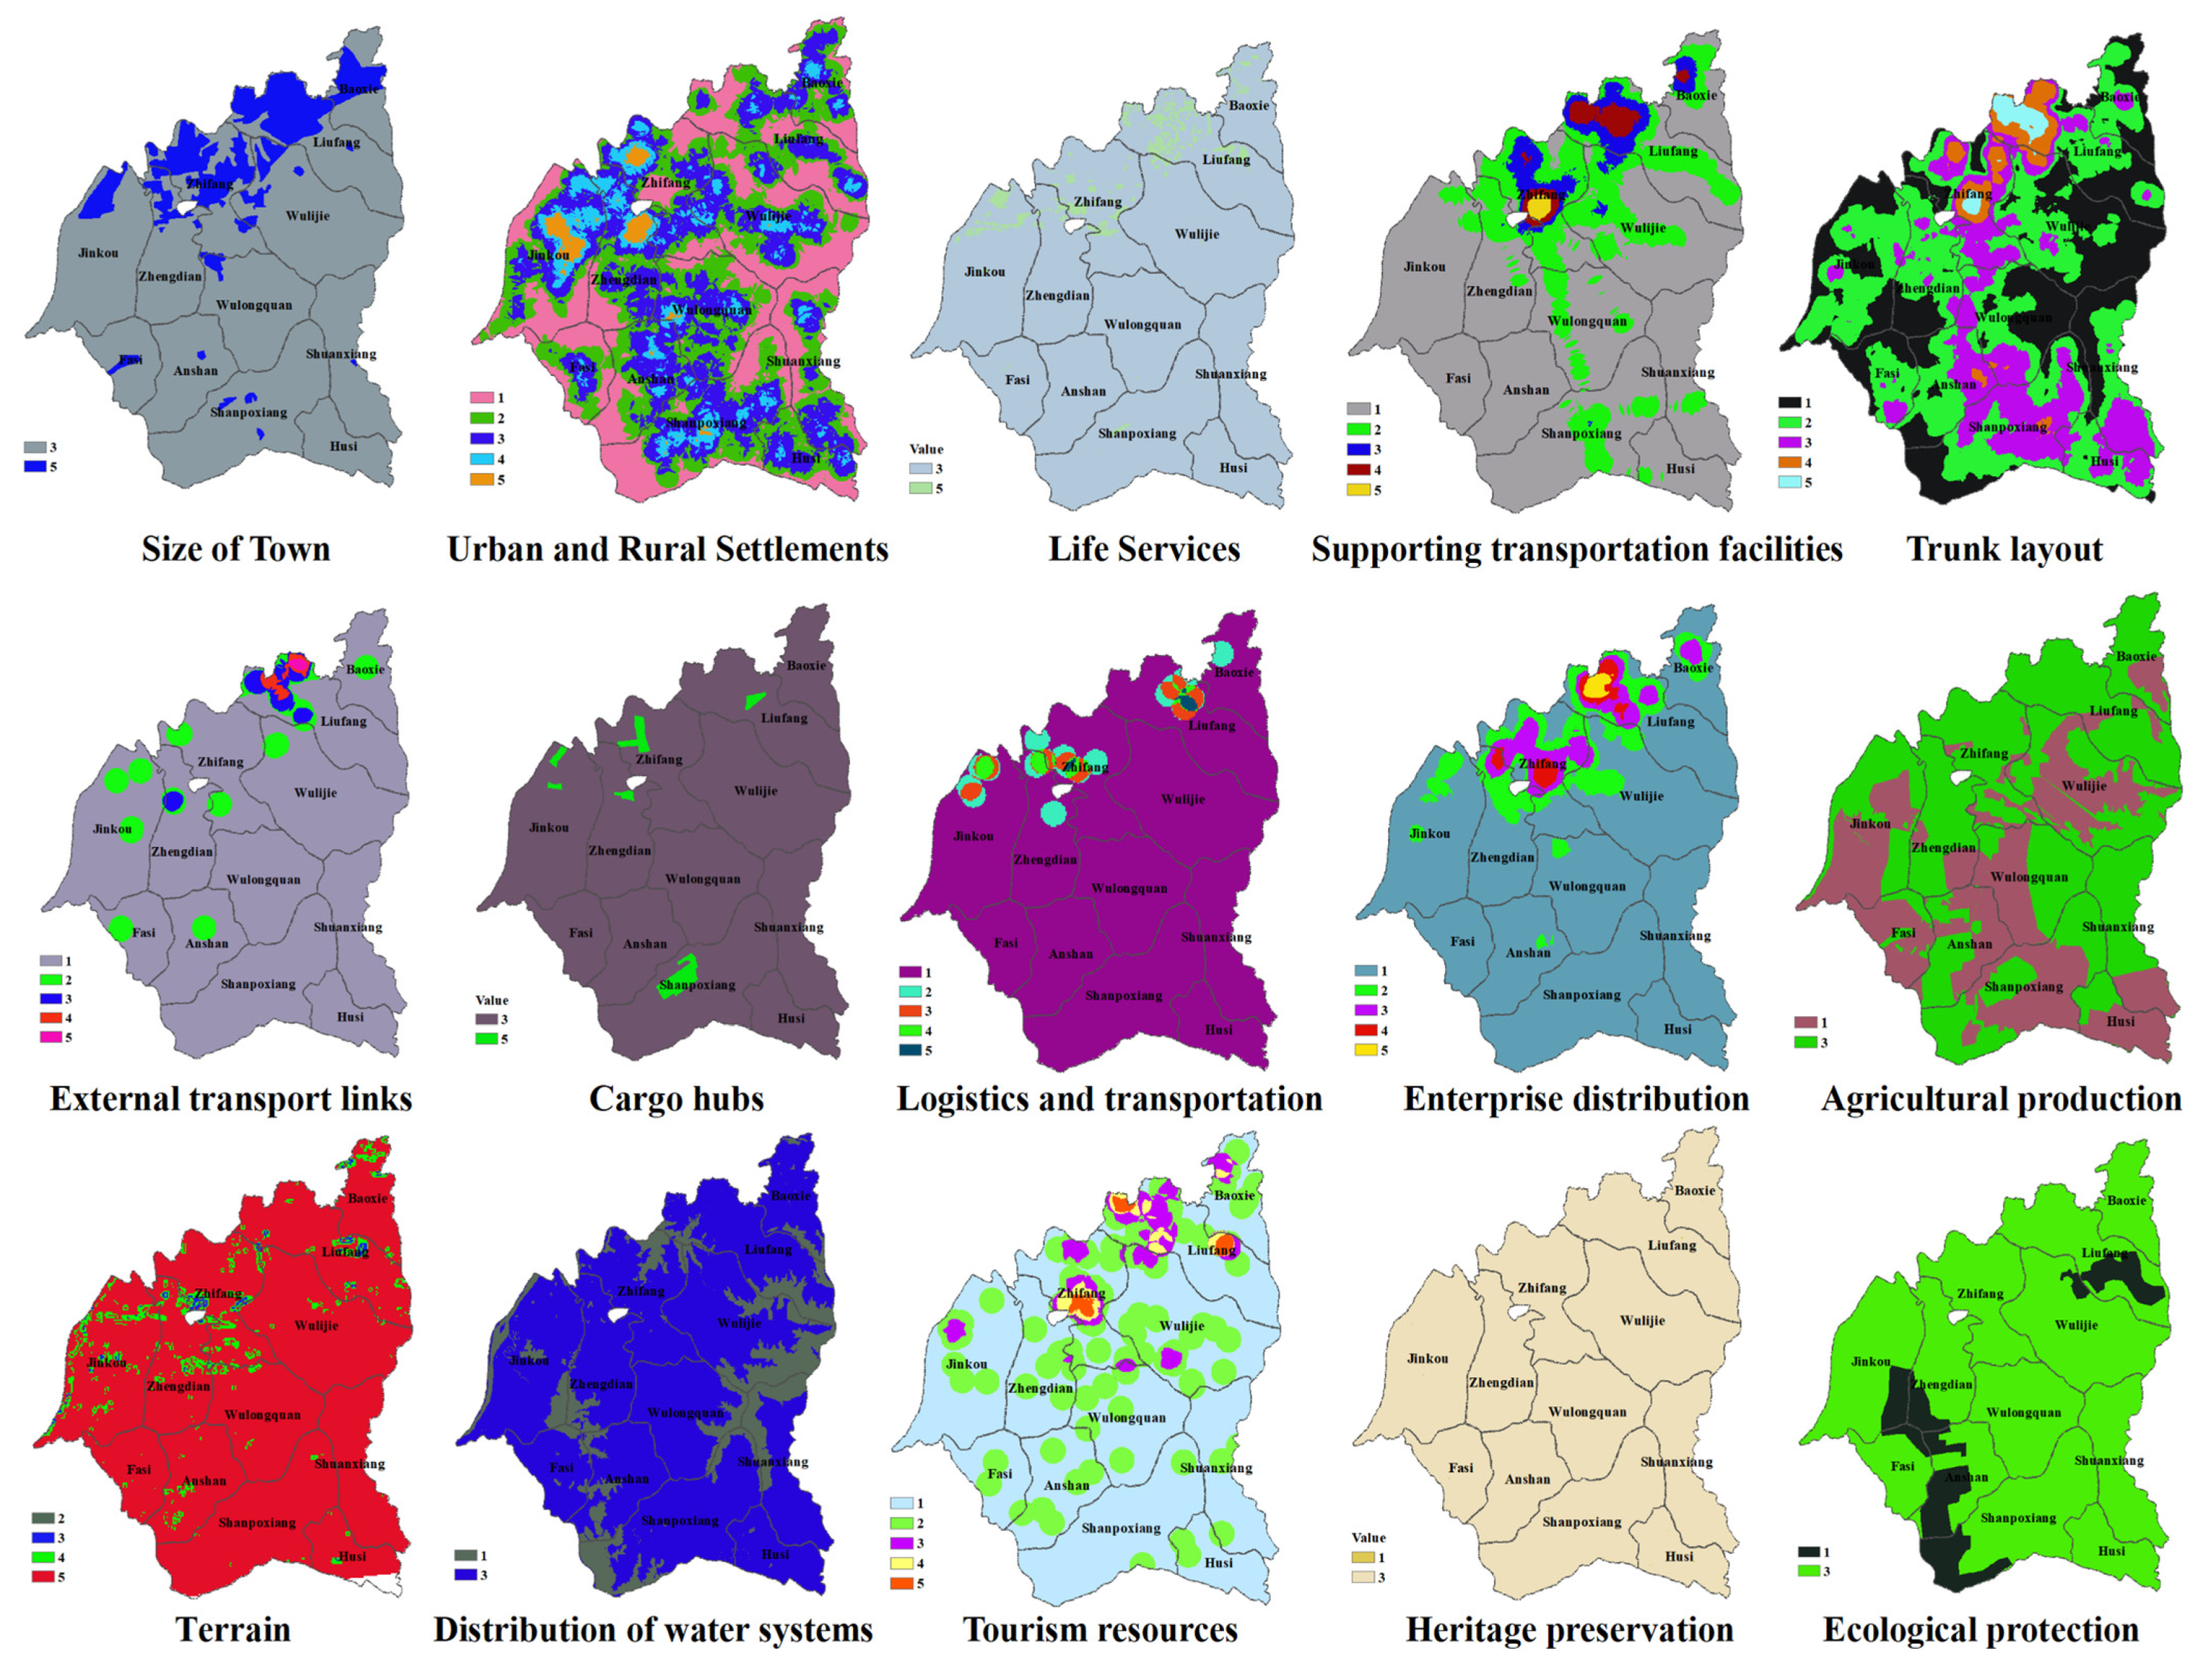
3.2. Transportation Network Planning Influencing Factor Analyses and Data Fusion
3.3. The Model Assembly Approach
- (i)
- Establish the hierarchical structure model of influencing factors of road network planning;
- (ii)
- Based on the correlation degree analysis of the OLS linear regression model, the importance of indirect measurement of the weight of decision-making criteria is judged by pairwise comparison.
- (iii)
- In terms of calculating the weight vector and testing the consistency of the judgment matrix, this study defines the follows equations:
4. Study Area and Data
4.1. Study Area
4.2. Dataset Description
5. Research Process and Results
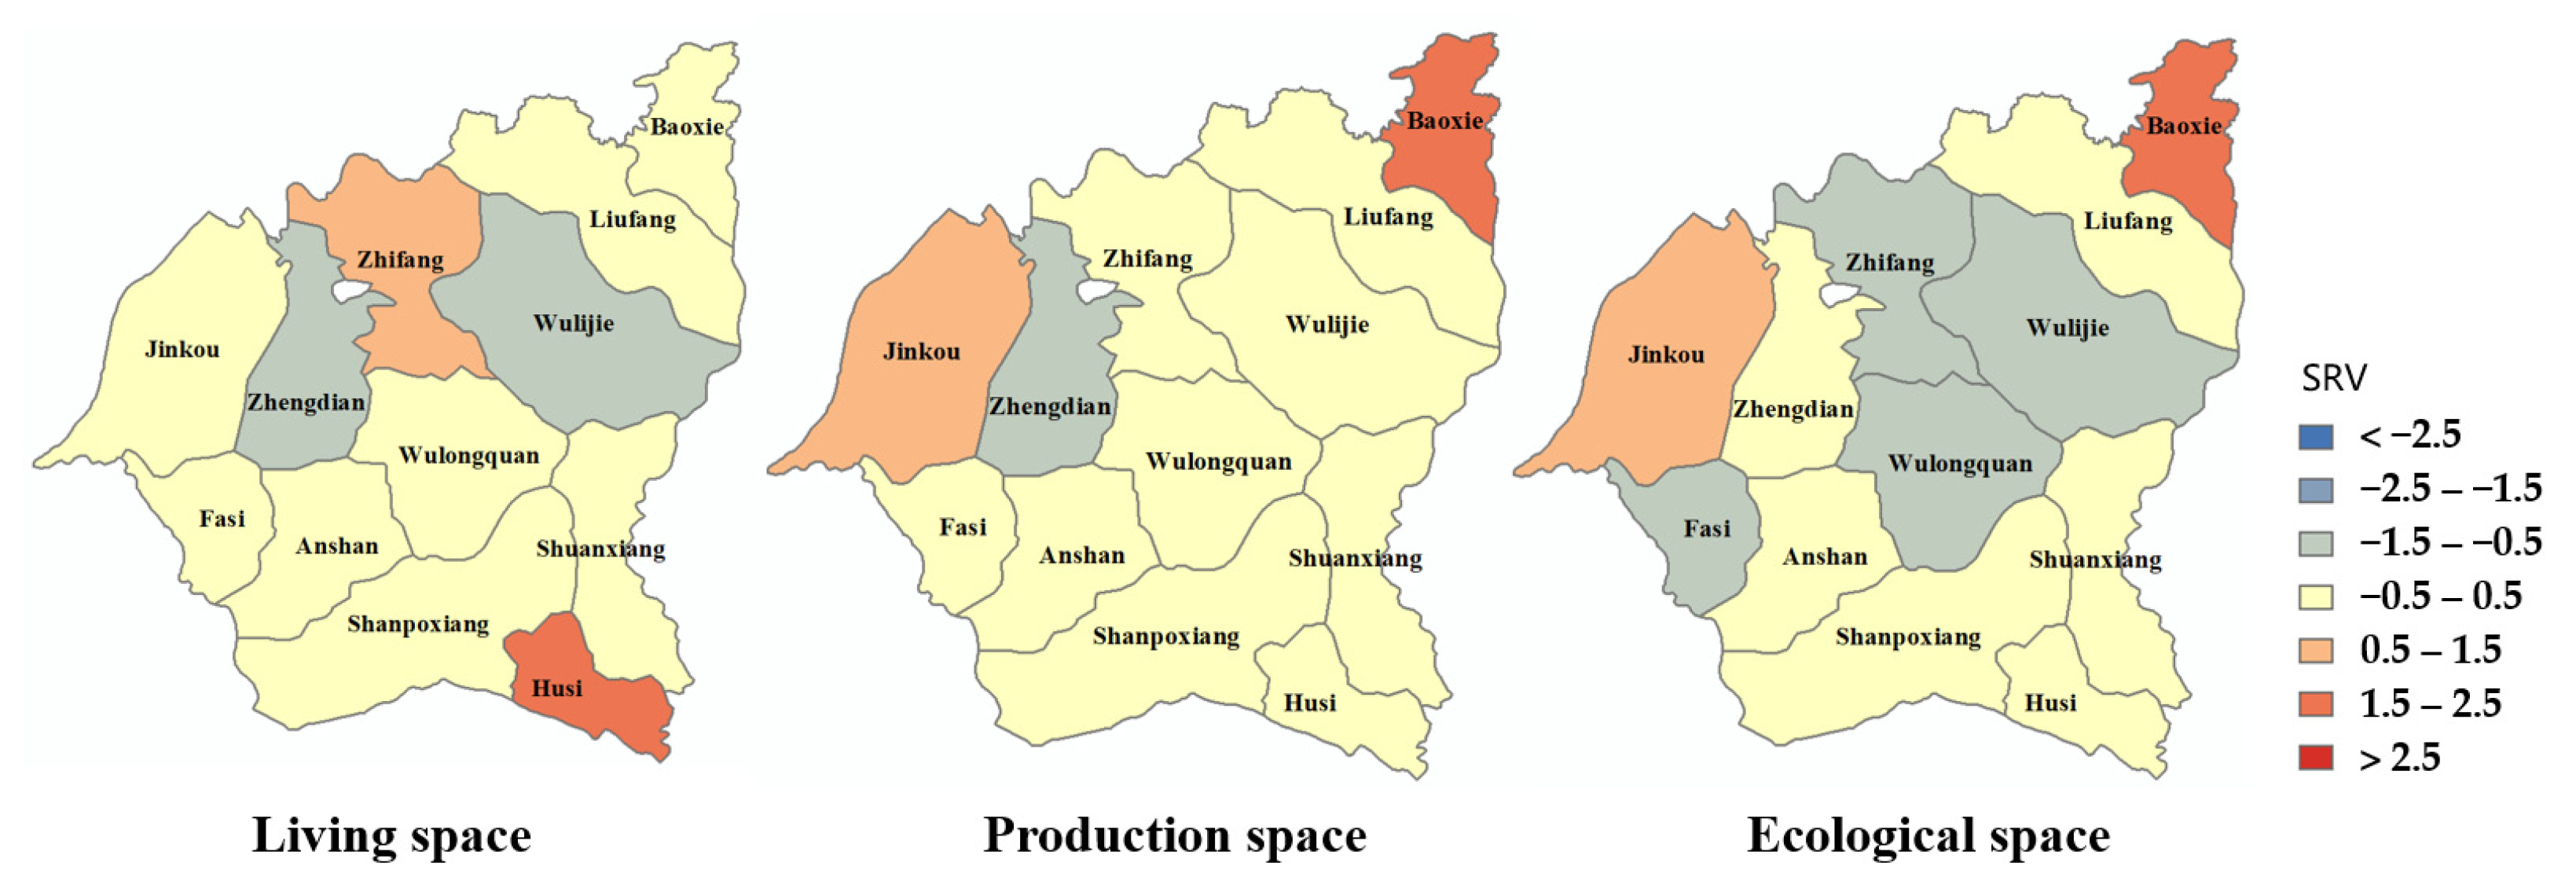
5.1. Regression Analysis Results
5.2. Model Assembly Results
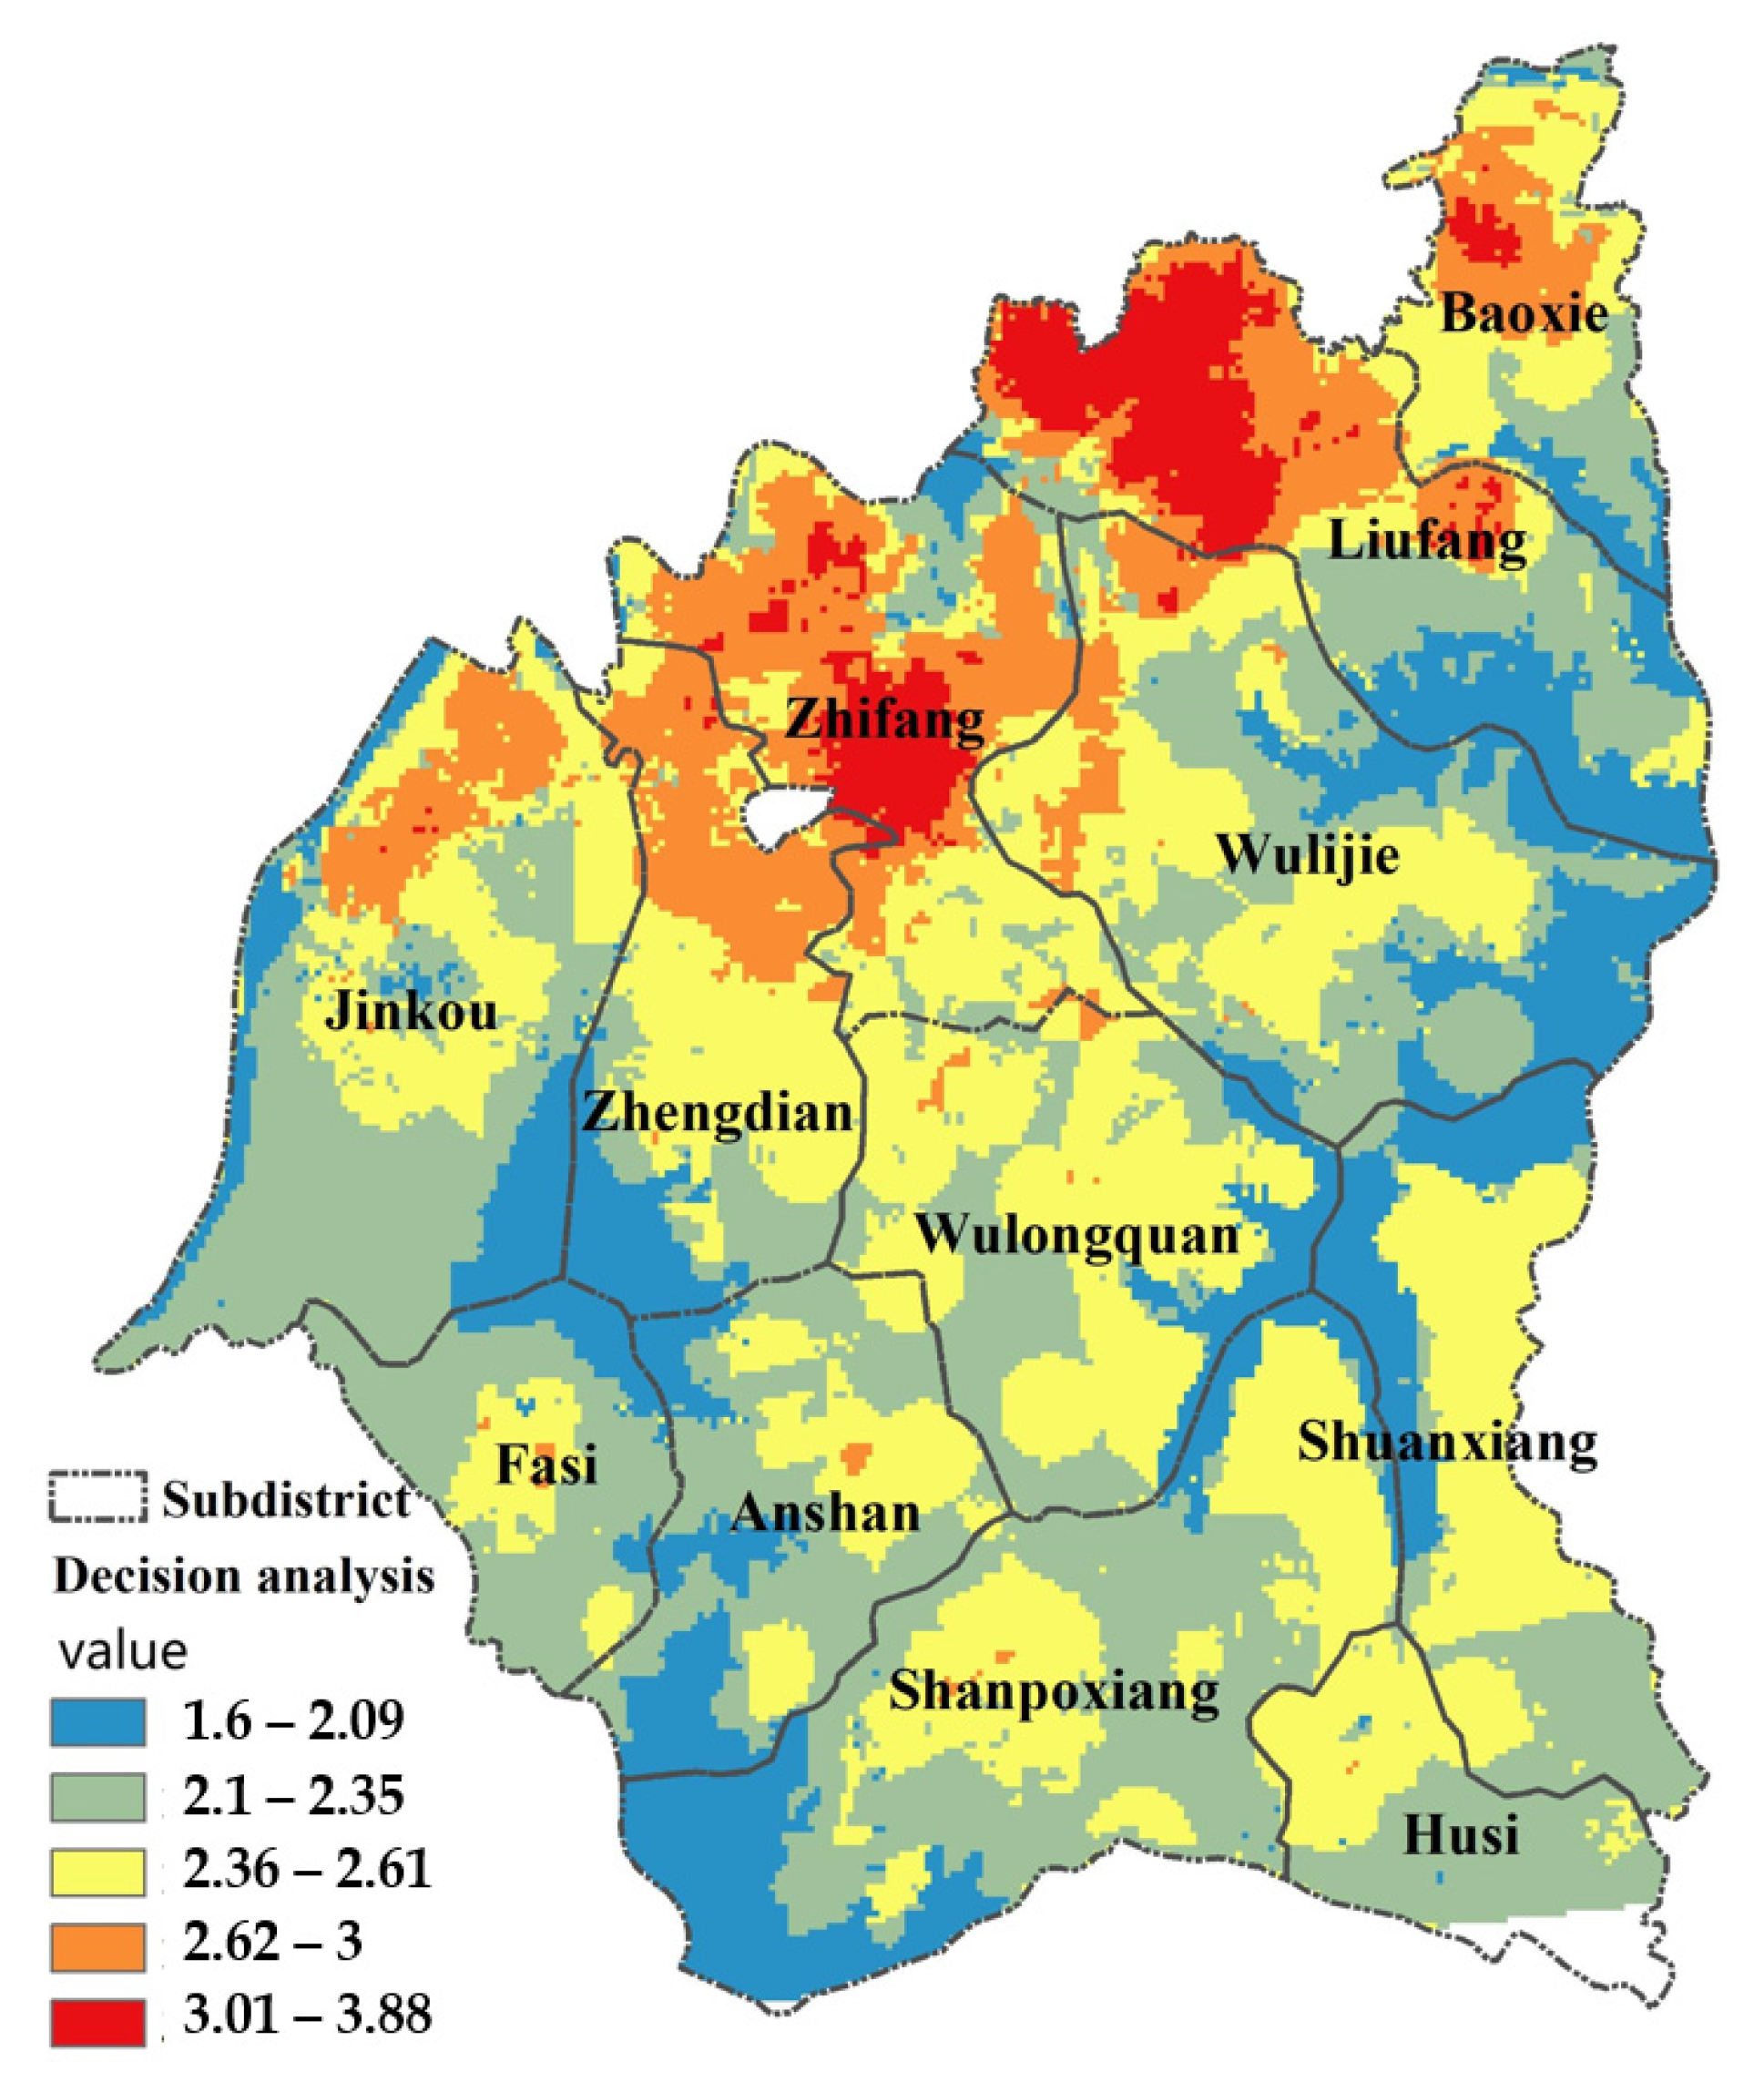
5.3. Urban and Rural Transportation Network Planning Decision Model Results
5.4. Discussion
5.4.1. Planning Strategies
- (1)
- Planning urban and rural transportation network system with urban and rural integration as the goal. In the central area of Jiangxia District, the supply level of transportation service facilities should match the living space of urban and rural residents. Rural roads in areas with concentrated distribution of urban and rural residential areas and living service facilities should be upgraded and connected to urban arterial roads. Thus, the urban and rural transportation axis is formed, which can gradually penetrate urban public transportation and slow-moving traffic in rural areas and establish a multi-mode public transport system in urban and rural areas.
- (2)
- Layout urban and rural transportation network based on industrial development. In the Jiangxia District, traffic development policies can be formulated separately according to concentrated industrial production and agricultural production areas. Industrial production zones, according to the production distribution of enterprises in Jiangxia District, give full play to the advantages of agglomeration and industrial corridor cooperation, and allow for planning of production and transportation corridors. Network nodes are planned according to cargo storage and transportation, logistics transportation hubs, so as to establish a comprehensive urban and rural transportation network. For agricultural production areas, transportation construction should reduce the damage and pollution to cultivated land and plan the transportation of agricultural products to the outside world on the basis of ensuring the integrity of agriculturally concentrated contiguous cultivated land.
- (3)
- Formulate time sequence of transportation network construction based on demand intensity. According to the evaluation results of transportation network planning decision analysis, for the region with a higher score, the transportation network construction is relatively complete, and for the regions with low scores, the needs of cultivated land and ecological protection, the construction time of transportation network construction projects in these regions can be implemented later. For the central region, the urgency of transportation network construction is higher than that of other regions, so priority should be given to the implementation of transportation network construction projects in this region. From this, construction timing zoning can be delineated.
5.4.2. Model Comparison
6. Conclusions
- The construction of a transportation system is not simply designed to meet the needs of spatial flow, but it also needs to consider land for various uses, urban construction, regional development, ecological protection, and social progress. Transportation planning must pay attention to the synergy between transportation elements and other land and spatial elements, and focus on the spatial analysis of the supply level of transportation facilities. Based on this case, the methods and steps for the model assembly approach of planning urban–rural transportation network decision-making were proposed, and the results were tested.
- The 15 important transportation planning decision-making factors in the living–production–ecological space were systematically proposed. The hierarchical model of urban and rural transportation planning decision-making was established, and the data acquisition methods of 15 decision-making factors were proposed.
- Combined with OSL regression analysis and AHP analysis, the weight ranking of transportation planning decision-making factors was determined. Regression analysis is added to the weight ranking step of the analytic hierarchy method, which effectively considers the actual situation of the development of the research area and reduces the subjective judgment component.
Author Contributions
Funding
Data Availability Statement
Conflicts of Interest
References
- Lichter, D.T.; Brown, D.L.; Parisi, D. The rural-urban interface: Rural and small town growth at the metropolitan fringe. Popul. Space Place 2021, 27, e2415. [Google Scholar] [CrossRef]
- Patrick, K.D.; James, L.M. Reviewed Work: Pastoral Cities: Urban Ideals and the Symbolic Landscape of America. Am. Lit. 1988, 60, 111–112. [Google Scholar]
- Xiao, D.; Xu, X. Investigating interaction pattern between urban-rural integration and transport network: A dynamic evolution model. PLoS ONE 2022, 17, e0266063. [Google Scholar] [CrossRef] [PubMed]
- Fu, H.; Wang, Y.; Mao, L.; Hong, N.; Wang, Z.; Zhao, S.; Liao, C. The spatial pattern and governance of Zhongyuan Urban-Rural System in its development trajectory. J. Geogr. Sci. 2022, 32, 1261–12802. [Google Scholar] [CrossRef]
- Rönkkö, E.; Luusua, A.; Aarrevaara, E.; Herneoja, A.; Muilu, T. New Resource-Wise Planning Strategies for Smart Urban-Rural Development in Finland. Systems 2017, 5, 10. [Google Scholar] [CrossRef] [Green Version]
- Mehran, A.; Nazanin, A. Transportation and Sustainable Urban Development. SSRG Int. J. Civ. Eng. 2019, 6, 17–22. [Google Scholar]
- Duranton, G.; Turner, M.A. Urban Growth and Transportation. Rev. Econ. Stud. 2012, 79, 1407–1440. [Google Scholar] [CrossRef]
- Zhu, M.; Zi, W.; Cui, H.; Yao, S. Rural Transportation Network Planning Based on 5G and Traffic Big Data. J. Adv. Transp. 2022, 2022, 9. [Google Scholar] [CrossRef]
- Wu, X.; Wu, P.; Guo, Z. The Correlations of Transportation with Regional Economy and Demographic Space. J. Intell. Fuzzy Syst. 2021, 41, 4813–4823. [Google Scholar] [CrossRef]
- Zheng, C.; Gu, Y.; Shen, J.; Du, M.; Ma, G.; Sun, K. Comprehensive Evaluation of Urban Integrated Transportation Network with Multivariate Statistical Analysis: A Case Study of Haimen. IEEE Access 2021, 9, 165034–165048. [Google Scholar] [CrossRef]
- Chen, C.; Cai, M.; Xiong, C. Research on Human Travel Correlation for Urban Transport Planning Based on Multisource Data. Sensors 2021, 21, 195. [Google Scholar] [CrossRef] [PubMed]
- Li, D.; Tang, Y.; Chen, Q. Multi-Mode Traffic Demand Analysis Based on Multi-Source Transportation Data. IEEE Access 2020, 8, 65005–65019. [Google Scholar] [CrossRef]
- Niu, Q.; Yang, C.; Gu, C.T.; Zhang, Y.X.; Tang, X. Analysis of influencing factors of urban road patency based on real-time traffic situation data and geographically weighted regression: A case study of the morning peak of weekdays in the central area of Wuhan. Mod. Urban Res. 2022, 3, 72–79. [Google Scholar]
- Shi, F. Thinking on Collaborative Planning of Transportation under Land and Spatial Planning System. Urban Plan. J. 2022, 46, 79–83. [Google Scholar]
- Li, W.; Feng, W.; Yuan, H.Z. Multimode Traffic Travel Behavior Characteristics Analysis and Congestion Governance Research. J. Adv. Transp. 2020, 2020, 8. [Google Scholar] [CrossRef]
- Cai, Z.; Yan, J. The planning and design of transportation network structure in urban railway transit hub areas. Int. J. Low-Carbon Technol. 2018, 13, 198–203. [Google Scholar] [CrossRef] [Green Version]
- Chai, S.; Liang, Q.; Zhong, S. Design of Urban Rail Transit Network Constrained by Urban Transportation network, Trips and Land-Use Characteristics. Sustainability 2019, 11, 6128. [Google Scholar] [CrossRef] [Green Version]
- Mondal, M.S.; Garg, R.D.; Pandey, V.; Kappas, M. Route alignment planning for a new highway between two cities using Geoinformatics techniques. Egypt. J. Remote Sens. Space Sci. 2021, 24, 595–607. [Google Scholar] [CrossRef]
- Wu, S.; Liu, D.; Chen, G. Comprehensive Transportation Planning in Suburban Areas: A Case Study in Wuhan. Urban Transp. China 2021, 10, 44–60. [Google Scholar]
- Tavana, M.; Soltanifar, M.; Santos-Arteaga, F.J. Analytical hierarchy process: Revolution and evolution. Ann. Oper. Res. 2023, 326, 879–907. [Google Scholar] [CrossRef]
- Xu, H.; Li, W.; Wang, T.; Yang, A. Research on dynamic prediction method for traffic demand based on trip generation analysis. Adv. Mech. Eng. 2019, 11, 1687814019854561. [Google Scholar] [CrossRef] [Green Version]
- Hamurcu, M.; Eren, T. Strategic Planning Based on Sustainability for Urban Transportation: An Application to Decision-Making. Sustainability 2020, 12, 3589. [Google Scholar] [CrossRef]
- Naidu, S.; Chand, A. Barriers to micro, small and medium enterprise growth in the Fiji Islands: An empirical estimation using OLS regression model. Int. J. Entrep. Small Bus. 2012, 16, 147–163. [Google Scholar] [CrossRef]
- Ghislain, G.; Martinetti, D. New method for dealing simultaneously with spatial autocorrelation and spatial heterogeneity in regression models. Reg. Sci. Urban Econ. 2018, 72, 74–85. [Google Scholar]
- Fu, Z.; Ahmad, I.; Fenta, A.; Dar, M.A.; Teka, A.H.; Belew, A.Z.; Teshome, A.; Damtie, M.; Nega, H.; Andualem, T.G.; et al. Identification of potential dam sites using OLS regression and fuzzy logic approach. Environ. Sci. Eur. 2022, 34, 105. [Google Scholar] [CrossRef]
- Zhang, X.; Wu, J.; Sun, D. Analysis of influencing factors of housing prices in Anhui Province based on linear regression model. J. Fuyang Norm. Univ. 2018, 35, 73–77. [Google Scholar]
- Bothe, K.; Hansen, H.K.; Winther, L. Spatial restructuring and uneven intra-urban employment growth in metro- and non-metro-served areas in Copenhagen. J. Transp. Geogr. 2018, 70, 21–30. [Google Scholar] [CrossRef]
- Shaopei, C.; Ming, F.; Dachang, Z. Spatial differentiation of road density and its influence on urban form in Guangzhou. Geomat. World 2019, 26, 37–43. [Google Scholar]
- Ng, C.; Law, T.; Wong, S.; Kulanthayan, S. Relative improvements in road mobility as compared to improvements in road accessibility and economic growth: A cross-country analysis. Transp. Policy 2017, 60, 24–33. [Google Scholar] [CrossRef]
- Cowie, C.T.; Ding, D.; Rolfe, M.I.; Mayne, D.J.; Jalaludin, B.; Bauman, A.; Morgan, G.G. Neighbourhood walkability, road density and socio-economic status in Sydney. Environ. Health 2016, 15, 58. [Google Scholar] [CrossRef] [PubMed] [Green Version]
- Prus, P.; Sikora, M. The Impact of Transport Infrastructure on the Sustainable Development of the Region—Case Study. Agriculture 2021, 11, 279. [Google Scholar] [CrossRef]
- Duan, Y.; Lei, K.; Tong, H.; Li, B.; Wang, W.; Hou, Q. Land use characteristics of Xi’an residential blocks based on pedestrian traffic system. Alex. Eng. J. 2021, 60, 15–24. [Google Scholar] [CrossRef]
- Qian, Y.; Dong, Z.; Yan, Y.; Tang, L.N. Ecological risk assessment models for simulating impacts of land use and landscape pattern on ecosystem services. Sci. Total Environ. 2022, 833, 155218. [Google Scholar] [CrossRef] [PubMed]
- He, Y. Research on Rural Transportation Network Planning in Urban-Rural Areas; Chongqing Jiaotong University: Chongqing, China, 2014; pp. 33–42. [Google Scholar]
- Gao, G.; Wang, Z.; Liu, X.; Li, T. An Empirical Spatial Accessibility Analysis of Qingdao City Based on Multisource Data. J. Adv. Transp. 2020, 2020, 7570148. [Google Scholar] [CrossRef]
- Wang, F.; Ye, M.; Zhu, H.; Gu, D. Optimization Method for Conventional Bus Stop Placement and the Bus Line Network Based on the Voronoi Diagram. Sustainability 2022, 14, 7918. [Google Scholar] [CrossRef]
- Roşca, M.; Oprea, C.; Ilie, A.; Olteanu, S.; Dinu, O. Solutions for Improving Transit through Intermodal Passenger Terminals. Procedia Manuf. 2020, 46, 225–232. [Google Scholar] [CrossRef]
- Betkier, I.; Zak, J.K.; Mitkow, S. Parking Lots Assignment Algorithm for Vehicles Requiring Specific Parking Conditions in Vehicle Routing Problem. IEEE Access 2021, 9, 161469–161487. [Google Scholar] [CrossRef]
- Yu, H.; Jiao, J.; Houston, E.; Peng, Z.-R. Evaluating the relationship between rail transit and industrial agglomeration: An observation from the Dallas-fort worth region, TX. J. Transp. Geogr. 2018, 67, 33–52. [Google Scholar] [CrossRef]
- Ko, S.; Lautala, P.; Zhang, K.L. Data-Driven Analysis of Short-Distance Freight Rail Transportation Potential: A Case Study of Log Movements in the U.S. Lake Superior Region. Transp. Res. Rec. 2023, 2677, 133–148. [Google Scholar] [CrossRef]
- Dudzińska, M.; Bacior, S.; Prus, B. Motorway Route Planning with Regarding the Adverse Effects on Agricultural Production Space. Sustainability 2019, 11, 6770. [Google Scholar] [CrossRef] [Green Version]
- Sahu, P.K.; Chandra, A.; Pani, A. Examining the Impacts of Highway Proximity on Freight Flow Patterns of Establishments. Transp. Res. Rec. 2023, 2677, 523–539. [Google Scholar] [CrossRef]
- Xu, Z.; Fang, X. Research on Collaborative Optimization Model of Tourism Resources and Highway Network Based on IoT Network and Deep Learning. Secur. Commun. Netw. 2022, 2020, 1637348. [Google Scholar] [CrossRef]
- Kroczak, R.; Bryndal, T.; Bucała, A.; Joanna, F. The development, temporal evolution and environmental influence of an unpaved transportation network on mountain terrain: An example from the Carpathian Mts. (Poland). Environ. Earth Sci. 2016, 75, 250. [Google Scholar] [CrossRef]
- Slávka, G. Assessment of implementation of protection of mineral deposits in spatial planning in Poland. Land Use Policy 2017, 67, 584–596. [Google Scholar]
- Cai, W.; Zhang, Y. Inland Extent and Evolution of Central City Based on Field Strength Model: A Comparative Study between Jiangsu Province and Hubei Province. Urban Issues 2020, 7, 36–46. [Google Scholar]
- Kala, A.K.; Tiwari, C.; Mikler, A.R.; Atkinson, S.F. A comparison of least squares regression and geographically weighted regression modeling of West Nile virus risk based on environmental parameters. PeerJ 2017, 5, e3070. [Google Scholar] [CrossRef] [PubMed] [Green Version]
- Meloun, M.; Militký, J. Detection of single influential points in OLS regression model building. Anal. Chim. Acta 2001, 439, 169–191. [Google Scholar] [CrossRef]
- Fang, Z.; Zhang, L.; Zheng, M. Transferability analysis of built environment variables for public transit ridership estimation in Wuhan, China. Trans. Urban Data Sci. Technol. 2022, 1, 56–85. [Google Scholar] [CrossRef]
- Fang, Z.; Wu, Y.; Zhong, H.; Liang, J.; Song, X. Revealing the impact of storm surge on taxi operations: Evidence from taxi and typhoon trajectory data. Environ. Plan. B Urban Anal. City Sci. 2021, 48, 1463–1477. [Google Scholar] [CrossRef]
- Yang, L.; Li, C.; Lu, L.; Guo, T. Evaluation of Port Emergency Logistics Systems Based on Grey Analytic Hierarchy Process. J. Intell. Fuzzy Syst. 2020, 39, 4749–4761. [Google Scholar] [CrossRef]
- You, X.; Zhang, P.; Li, S.; Wang, F.; Su, G.; Zhang, S. FAHP-Based Reliability Evaluation of Distributed IoT Devices in a Distribution Power Grid. Wirel. Commun. Mob. Comput. 2022, 2022, 11. [Google Scholar] [CrossRef]
- Niu, Q. GIS Method and Classical Analysis of Gis Technology Application Guide for Urban and Rural Planning; China Building Industry Press: Beijing, China, 2017; pp. 217–231. [Google Scholar]


| Space | Influencing Factor | Analysis Description |
|---|---|---|
| Living Space | Size of town | The ratio of the area enclosed by the permitted construction area of the town to the area of the administrative subdistrict jurisdiction. |
| Urban and rural settlements | Point kernel density analysis is used to obtain the raster cell values of the kernel density of urban and rural settlements in the study area. Then, the average value of the kernel density per unit area of the cells in each research unit is calculated, that is, the average point density of urban and rural settlements (the average point density is calculated as below). | |
| Life services | The total number of POIs of regional government, catering, medical, education, hotel, sports, shopping, and other life service facilities is calculated, and the average point density of life service functions is determined. | |
| Supporting transportation facilities | The mean point density of POI at bus stops and bus terminals. | |
| Trunk layout | The ratio of trunk line transportation network mileage to rural transportation network mileage. | |
| Production space | External transport links | The total number of high-speed and expressway entrances and exits is counted, and the average point density of the external entrance and exit is determined. |
| Cargo hubs | Cargo hub facility footprint statistics. | |
| Logistics and transportation | The average point density of the distribution of logistics and transportation-related service facilities. | |
| Enterprise distribution | Mean enterprise POI point density is determined. | |
| Agricultural production | The ratio of the area of cultivated land concentration in the study unit to the area of the study unit. | |
| Ecological space | Terrain | The mean value of the slope of the study unit is determined based on the DEM data. |
| Distribution of water systems | The ratio of the area of rivers and lakes in the study unit to the area of the study unit. | |
| Tourism resources | Average point density of distribution of tourism resources. | |
| Heritage preservation | Statistics on the number of cultural relics protected. | |
| Ecological protection | The ratio of the area of ecological protection redlines in the study unit to the area of the study unit. |
| Influencing Factor | Reclassification of Hierarchical Assignments | Illustration |
|---|---|---|
| Size of town | The inside and outside of the construction area are allowed to be assigned 5 and 3 at two levels, respectively. | There is a large demand for transportation network construction within the permitted scope of urban construction, and the construction conditions are relatively good, while the transportation network construction in other regions will be limited to a certain extent. |
| Urban and rural settlements | According to the natural discontinuity method, it is divided into five levels, and the value is assigned 5 to 1 according to the density value from high to low, respectively. | In areas with dense urban and rural residential areas, there is more traffic demand, so the transportation network construction should be more intensive and more complete. |
| Life services | Hierarchical assignment is the same as urban and rural settlements. | In areas with dense living service facilities, residents have more travel needs. |
| Supporting transportation facilities | If the transportation supporting service facilities are concentrated, the construction of the transportation network should be coordinated with the construction of supporting transportation facilities. | |
| Trunk layout | In areas with intensive rural traffic construction, local rural traffic can be upgraded and incorporated into urban trunk roads according to actual needs. | |
| External transport links | In the distribution area of the entrances and exits of expressways, the construction of the transportation network should be improved to facilitate urban and rural external transportation. | |
| Cargo hubs | The inside and outside of the cargo hub area are allowed to be assigned 5 and 3 at two levels, respectively. | Transportation network construction should be improved in urban and rural cargo hub areas to facilitate cargo storage and transportation. |
| Logistics and transportation | Hierarchical assignment is the same as urban and rural settlements. | Transportation network construction should be improved in areas where urban and rural logistics and transportation service facilities are concentrated to facilitate logistics and transportation. |
| Enterprise distribution | The construction of transportation networks should be strengthened in areas where urban and rural enterprises are concentrated, so as to quickly transport out the production products. | |
| Agricultural production | The inside and outside of the cultivated land concentrated distribution area are allowed to be assigned 1 and 3 at two levels, respectively. | In order to protect the distribution area of concentrated cultivated land, the construction of the transportation network should reduce or avoid planning in the area. |
| Terrain | Assign values according to the double evaluation grading, slope from low to high, assign a value of 5 to 1 respectively. | Areas with gentle slopes are more suitable for transportation network construction to reduce its cost and ensure road safety. |
| Distribution of water systems | The inside and outside of the distribution of water systems area are allowed to be assigned 1 and 3 at two levels, respectively. | Transportation network construction should be avoided in water system distribution areas to reduce the damage and pollution to water bodies. |
| Tourism resources | Hierarchical assignment is the same as urban and rural settlements. | In areas rich in tourism resources, transportation network construction should be strengthened to promote the development of urban and rural tourism industry. |
| Heritage preservation | The inside and outside of the heritage conservation buffer zone are allowed to be assigned 1 and 3 at two levels, respectively. | Cultural relics protection units shall reduce the construction of transportation networks in the control construction areas to reduce the damage caused by traffic congestion and pollution to cultural protection units. |
| Ecological protection | The inside and outside of the ecological protection redline areas are allowed to be assigned 1 and 3 at two levels, respectively. | Transportation network construction should reduce the number of areas crossing the ecological protection red line to protect ecological functional areas, environmental quality, and natural resources. |
| Data Name | Data Source | Data Format |
|---|---|---|
| Subdistrict map | Map sharing website, Self-drawn | Vector |
| Land use status | Wuhan Land Use Master Plan (2006~2020) and satellite imagery, Self-drawn | Vector |
| Transportation network | Open Street Map open-source map download platform | Vector |
| Service facility POI | Map of Gaode | Excel |
| Digital elevation model | Geospatial data cloud | Raster |
| Satellite imagery | Tiff | |
| Water system | Satellite imagery, Self-drawn | Vector |
| Distribution of urban and rural settlements | Map of Jiangxia District, Self-drawn | Vector |
| Distribution of natural resources | Boyaa tourism sharing website and Wuhan mineral resources development and protection and utilization plan, Self-drawn | Vector |
| Logistics park | Planning layout of different functional units in Jiangxia District, Self-drawn | Vector |
| Agricultural production functional area | Vector | |
| Ecological main functional area | Vector | |
| Heritage sites | Boyaa Travel Sharing Website, Self-drawn | Vector |
| Influencing Factor | Minimum | Maximum | Average | Variance |
|---|---|---|---|---|
| Size of town | 0 | 84.992 | 23.484 | 904.242 |
| Urban and rural settlements | 0.419 | 0.776 | 0.586 | 0.011 |
| Life services | 440 | 44,701 | 7880.25 | 204,348,132.932 |
| Supporting transportation facilities | 0 | 1.303 | 0.327 | 0.179 |
| Trunk layout | 0 | 3 | 0.92 | 0.674 |
| External transport links | 0 | 0.249 | 0.042 | 0.005 |
| Cargo hubs | 0 | 17.762 | 3.202 | 29.777 |
| Logistics and transportation | 0 | 0.038 | 0.010 | 0.000 |
| Enterprise distribution | 0.096 | 7.206 | 1.942 | 6.555 |
| Agricultural production | 0.077 | 0.773 | 0.413 | 0.049 |
| Terrain | 18.974 | 36.374 | 28.034 | 28.327 |
| Distribution of water systems | 0.008 | 0.328 | 0.170 | 0.008 |
| Tourism resources | 0.007 | 0.283 | 0.086 | 0.009 |
| Heritage preservation | 0 | 3 | 1.17 | 1.061 |
| Ecological protection | 0 | 0.447 | 0.108 | 0.018 |
| Space | Living Space | ||||
| Influencing factor | Size of town | Urban and rural settlements | Life services | Supporting transportation facilities | Trunk layout |
| Regression coefficient | 0.145 | −0.007 | 0.433 | 0.035 | 0.361 |
| Space | Production Space | ||||
| Influencing factor | External transport links | Cargo hubs | Logistics and transportation | Enterprise distribution | Agricultural production |
| Regression coefficient | 0.072 | −0.034 | −0.131 | 0.779 | −0.021 |
| Space | Ecological Space | ||||
| Influencing factor | Terrain | Distribution of water systems | Tourism resources | Heritage preservation | Ecological protection |
| Regression coefficient | −0.094 | −0.107 | 0.808 | 0.017 | −0.077 |
| Index | Living Space | Production Space | Ecological Space |
|---|---|---|---|
| Living space | 1 | 1/2 | 1/3 |
| Production space | 3 | 2 | 1 |
| Ecological space | 2 | 1 | 1/2 |
| Index | Size of Town | Urban and Rural Settlements | Life Services | Supporting Transportation Facilities | Trunk Layout |
|---|---|---|---|---|---|
| Size of town | 1 | 1/5 | 1/9 | 2 | 1/3 |
| Urban and rural settlements | 5 | 1 | 1/2 | 7 | 2 |
| Life services | 9 | 2 | 1 | 9 | 6 |
| Supporting transportation facilities | 1/2 | 1/7 | 1/9 | 1 | 1/5 |
| Trunk layout | 3 | 1/2 | 1/6 | 5 | 1 |
| Index | External Transport Links | Cargo Hubs | Logistics and Transportation | Enterprise Distribution | Agricultural Production |
|---|---|---|---|---|---|
| External transport links | 1 | 8 | 4 | 1/2 | 1/2 |
| Cargo hubs | 1/8 | 1 | 3 | 1/8 | 1/6 |
| Logistics and transportation | 1/4 | 1/3 | 1 | 1/9 | 1/6 |
| Enterprise distribution | 2 | 8 | 9 | 1 | 2 |
| Agricultural production | 2 | 6 | 6 | 1/2 | 1 |
| Index | Terrain | Distribution of Water Systems | Tourism Resources | Heritage Preservation | Ecological Protection |
|---|---|---|---|---|---|
| Terrain | 1 | 1/3 | 3/5 | 2 | 1/2 |
| Distribution of water systems | 3 | 1 | 3/2 | 3 | 5/4 |
| Tourism resources | 5/3 | 2/3 | 1 | 4 | 6/7 |
| Heritage preservation | 1/2 | 1/3 | 1/4 | 1 | 2/7 |
| Ecological protection | 2 | 4/5 | 7/6 | 7/2 | 1 |
| Criterion layer | Weight | Index Layer | Weight | CI Value | Absolute Weight |
|---|---|---|---|---|---|
| B1 Living space | 0.163 | C1 Size of town | 0.056 | 0.032 < 0.1 | 0.009 |
| C2 Urban and rural settlements | 0.262 | 0.043 | |||
| C3 Life services | 0.511 | 0.083 | |||
| C4 Supporting transportation facilities | 0.035 | 0.006 | |||
| C5 Trunk layout | 0.135 | 0.022 | |||
| B2 Production space | 0.297 | C6 External transport links | 0.207 | 0.081 < 0.1 | 0.061 |
| C7 Cargo hubs | 0.052 | 0.015 | |||
| C8 Logistics and transportation | 0.037 | 0.011 | |||
| C9 Enterprise distribution | 0.424 | 0.126 | |||
| C10 Agricultural production | 0.280 | 0.083 | |||
| B3 Ecological space | 0.540 | C11 Terrain | 0.128 | 0.013 < 0.1 | 0.069 |
| C12 Distribution of water systems | 0.311 | 0.168 | |||
| C13 Tourism resources | 0.231 | 0.125 | |||
| C14 Heritage preservation | 0.073 | 0.039 | |||
| C15 Ecological protection | 0.257 | 0.139 |
| This Study | The Dual Evaluation | |
|---|---|---|
| Analyze factors | Size of town, urban and rural settlements, life services, supporting transportation facilities, trunk layout, external transport links, cargo hubs, logistics and transportation, enterprise distribution, agricultural production, terrain, distribution of water systems, tourism resources, heritage preservation, and ecological protection. | Traffic artery, urban accessibility, transportation hub, accessibility of surrounding cities, road density. |
| Analysis tool | Density analysis, feature to raster, raster reclassification. | Buffer analysis, raster reclassification. |
| Weight assignment | Combining regression analysis and analytic hierarchy to give weight to each factor. | The weights are assigned according to the size of the road level, highway = 1.5, first-class highway = 1, secondary highway = 0.5, and third-level highway = 0.3. |
| Overlay calculations | The sum of the product of weights and factor raster attribute values, which are calculated by raster math. | The sum of 10 [Location traffic conditions.tif] and [Transportation network density] which are calculated by raster math. |
| Results output | The results are divided into five levels according to the natural point discontinuity method. | The results show the scores of the two evaluations, ten digits represent the evaluation scores of regional traffic conditions, and the number of each number is the evaluation of traffic network density. Location condition evaluation takes precedence over transportation network density evaluation. With the same score, the former will be higher than the latter. Therefore, the results are divided into six levels. |
Disclaimer/Publisher’s Note: The statements, opinions and data contained in all publications are solely those of the individual author(s) and contributor(s) and not of MDPI and/or the editor(s). MDPI and/or the editor(s) disclaim responsibility for any injury to people or property resulting from any ideas, methods, instructions or products referred to in the content. |
© 2023 by the authors. Licensee MDPI, Basel, Switzerland. This article is an open access article distributed under the terms and conditions of the Creative Commons Attribution (CC BY) license (https://creativecommons.org/licenses/by/4.0/).
Share and Cite
Xu, H.; Zhao, J.; Yu, X.; Mei, X.; Zhang, X.; Yan, C. A Model Assembly Approach of Planning Urban–Rural Transportation Network: A Case Study of Jiangxia District, Wuhan, China. Sustainability 2023, 15, 11876. https://doi.org/10.3390/su151511876
Xu H, Zhao J, Yu X, Mei X, Zhang X, Yan C. A Model Assembly Approach of Planning Urban–Rural Transportation Network: A Case Study of Jiangxia District, Wuhan, China. Sustainability. 2023; 15(15):11876. https://doi.org/10.3390/su151511876
Chicago/Turabian StyleXu, Hong, Jin Zhao, Xincan Yu, Xiaoxia Mei, Xinle Zhang, and Chuanjie Yan. 2023. "A Model Assembly Approach of Planning Urban–Rural Transportation Network: A Case Study of Jiangxia District, Wuhan, China" Sustainability 15, no. 15: 11876. https://doi.org/10.3390/su151511876
APA StyleXu, H., Zhao, J., Yu, X., Mei, X., Zhang, X., & Yan, C. (2023). A Model Assembly Approach of Planning Urban–Rural Transportation Network: A Case Study of Jiangxia District, Wuhan, China. Sustainability, 15(15), 11876. https://doi.org/10.3390/su151511876