
Smart Energy Urban Agglomerations in China: The Driving Mechanism, Basic Concepts, and Indicator Evaluation


Abstract
:1. Introduction
2. Theoretical Analysis
3. Methodology and Data
3.1. Conceptual Analysis
3.2. Indicator Evaluation
3.2.1. The Development Level Indicators
3.2.2. The Reason Analysis Indicators
- (1)
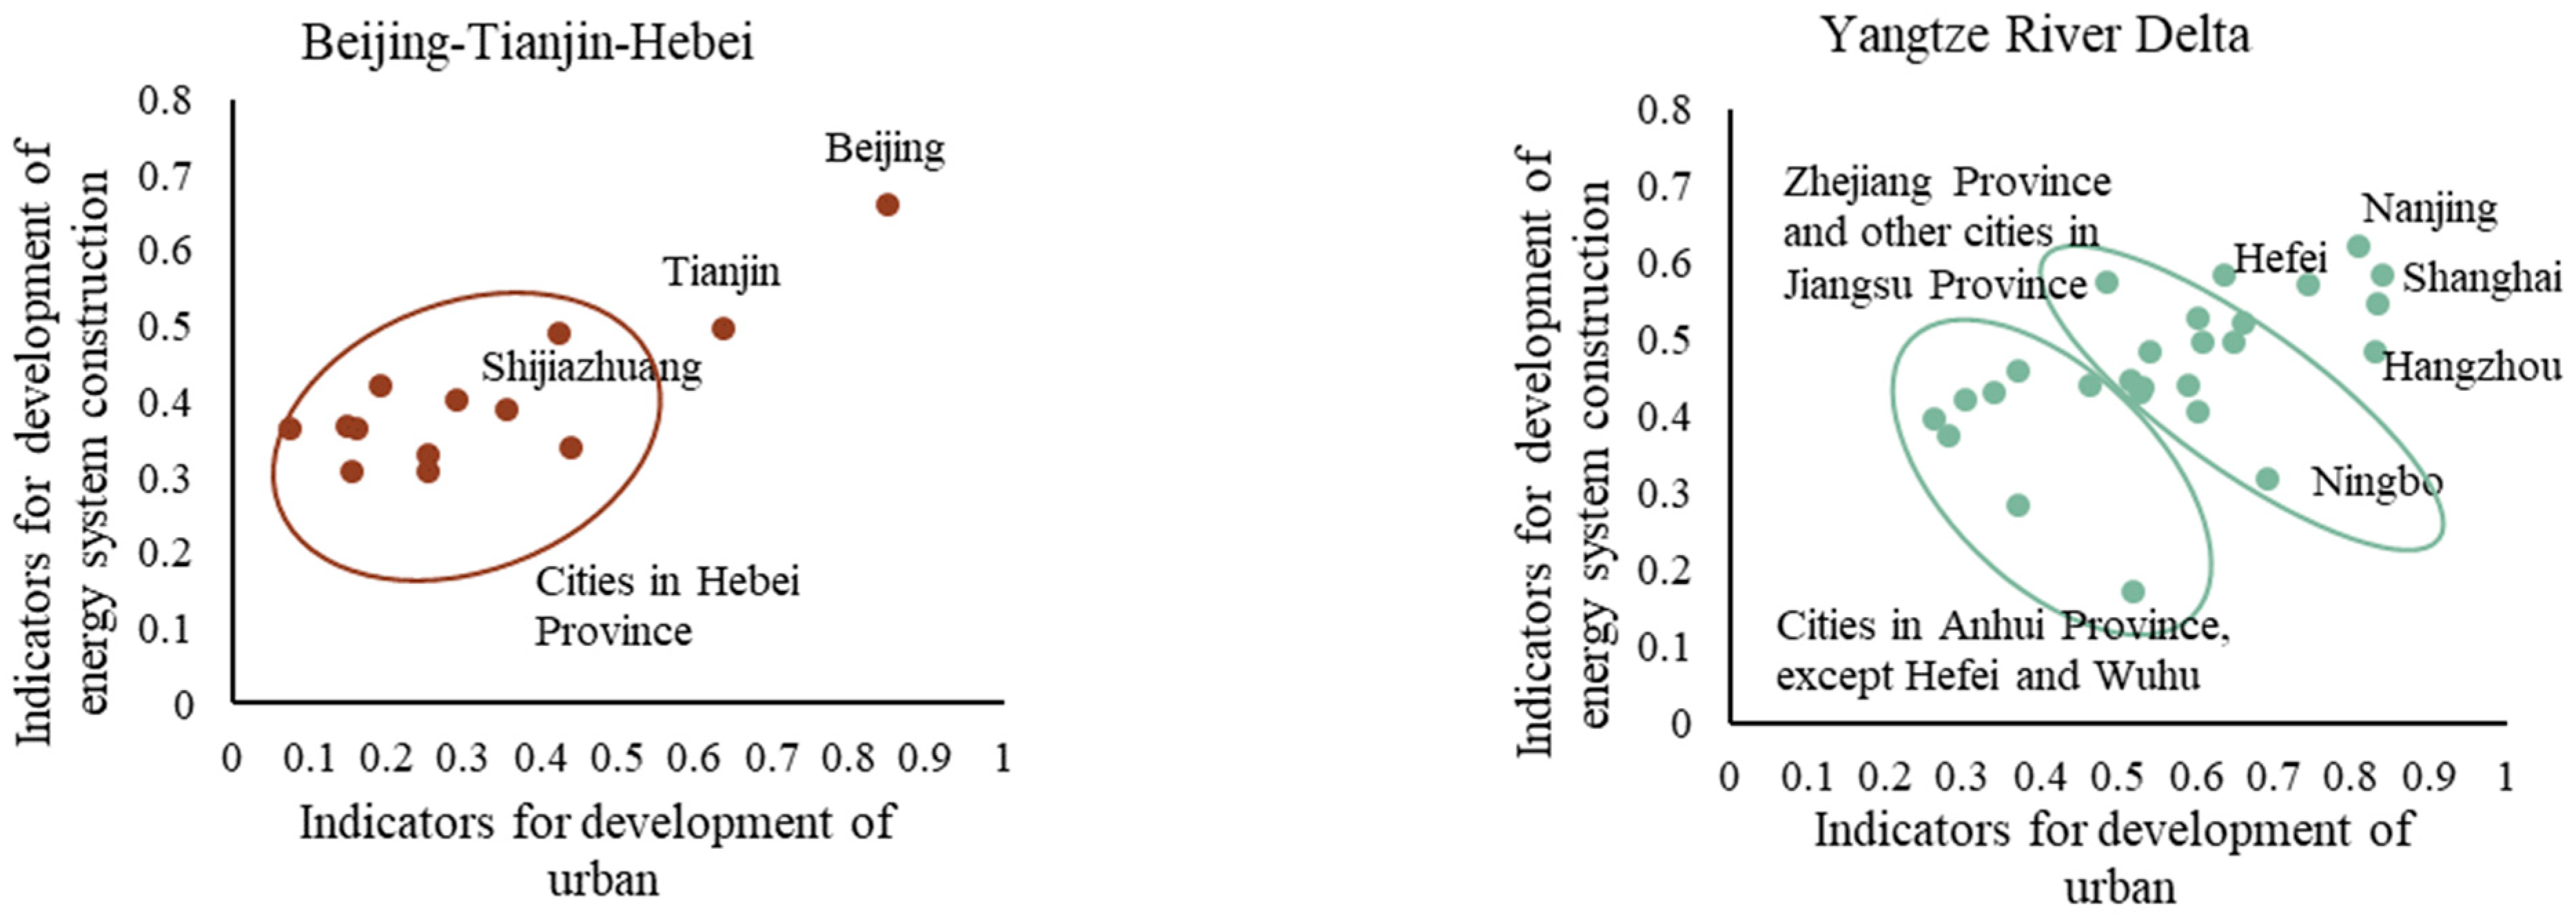
- The internal driving force for the development of SEUAs comes from the individual cities within the urban agglomerations. This paper believes that the urban development and energy system integration level of the individual cities within the urban agglomerations can reflect the size of the internal driving force. These two indicators of the individual cities can refer to the evaluation indicators of the SEUAs (Table 1). We first referred to the indicators of SEUA, and we then simplified the evaluation indicators of SEUA considering the worse data availability of internal cities. We constructed a set of two axes indicators for the development level of internal cities as shown in Table 2. The research object is cities within the four major urban agglomerations, and the details of data sources of each indicator are explained in Appendix A.
- (2)
- Based on the driving mechanism of SEUAs, we believe that when evaluating the development level of SEUAs, we also need to examine the degree of national support for the development of each SEUA to analyze the external driving force of SEUAs. The level of national support for the development of SEUAs can be observed through the inclusion of urban agglomerations in national policy documents. As of now, China does not have specific policy documents exclusively targeting the smart energy systems of individual urban agglomerations. Instead, the construction of smart energy systems encompasses various aspects of urban agglomerations as a whole. We believe that measuring the number and data of the country’s guidance documents for the development of each urban agglomeration can reflect the external driving force level of the construction of each urban agglomeration. Therefore, we set up these qualitative indicators of national policies for the SEUAs.
3.2.3. Determination of Indicator Weights
4. Results and Discussion
4.1. Basic Concepts of SEUA
4.1.1. Concept Connotation
- (1)
- The construction of SEUAs should be based on the construction of smart energy systems in internal cities. Each region within the urban agglomerations should adapt to its local condition, develop renewable energy, distributed energy, and improve the energy structure;
- (2)
- With the goal of regional coordinated development, SEUAs should strengthen the energy interaction between cities, promote the sharing and co-construction of energy, transportation, and communication infrastructure between cities, and realize the integration of electricity, heat, and fuel networks;
- (3)
- The government should innovate the business model of energy within SEUAs and among urban agglomerations, build a larger unified energy market, and use information and communication technology to participate in management and decision-making. The overall energy system can achieve high energy efficiency and high renewable energy ratio.
4.1.2. Development Barriers
- The smart energy system project is still in the small-scale demonstration stage, and the cross-regional project is still in the conceptual design stage. The energy system of most projects is simple, most of which are industrial zones;
- The technical scheme of smart energy system applied in some projects is relatively simple and not comprehensive. Some projects pay too much attention to information and communication technology, and relatively neglect energy technology;
- Most smart energy projects lack appropriate business models, market mechanisms, and financial coordination mechanisms.
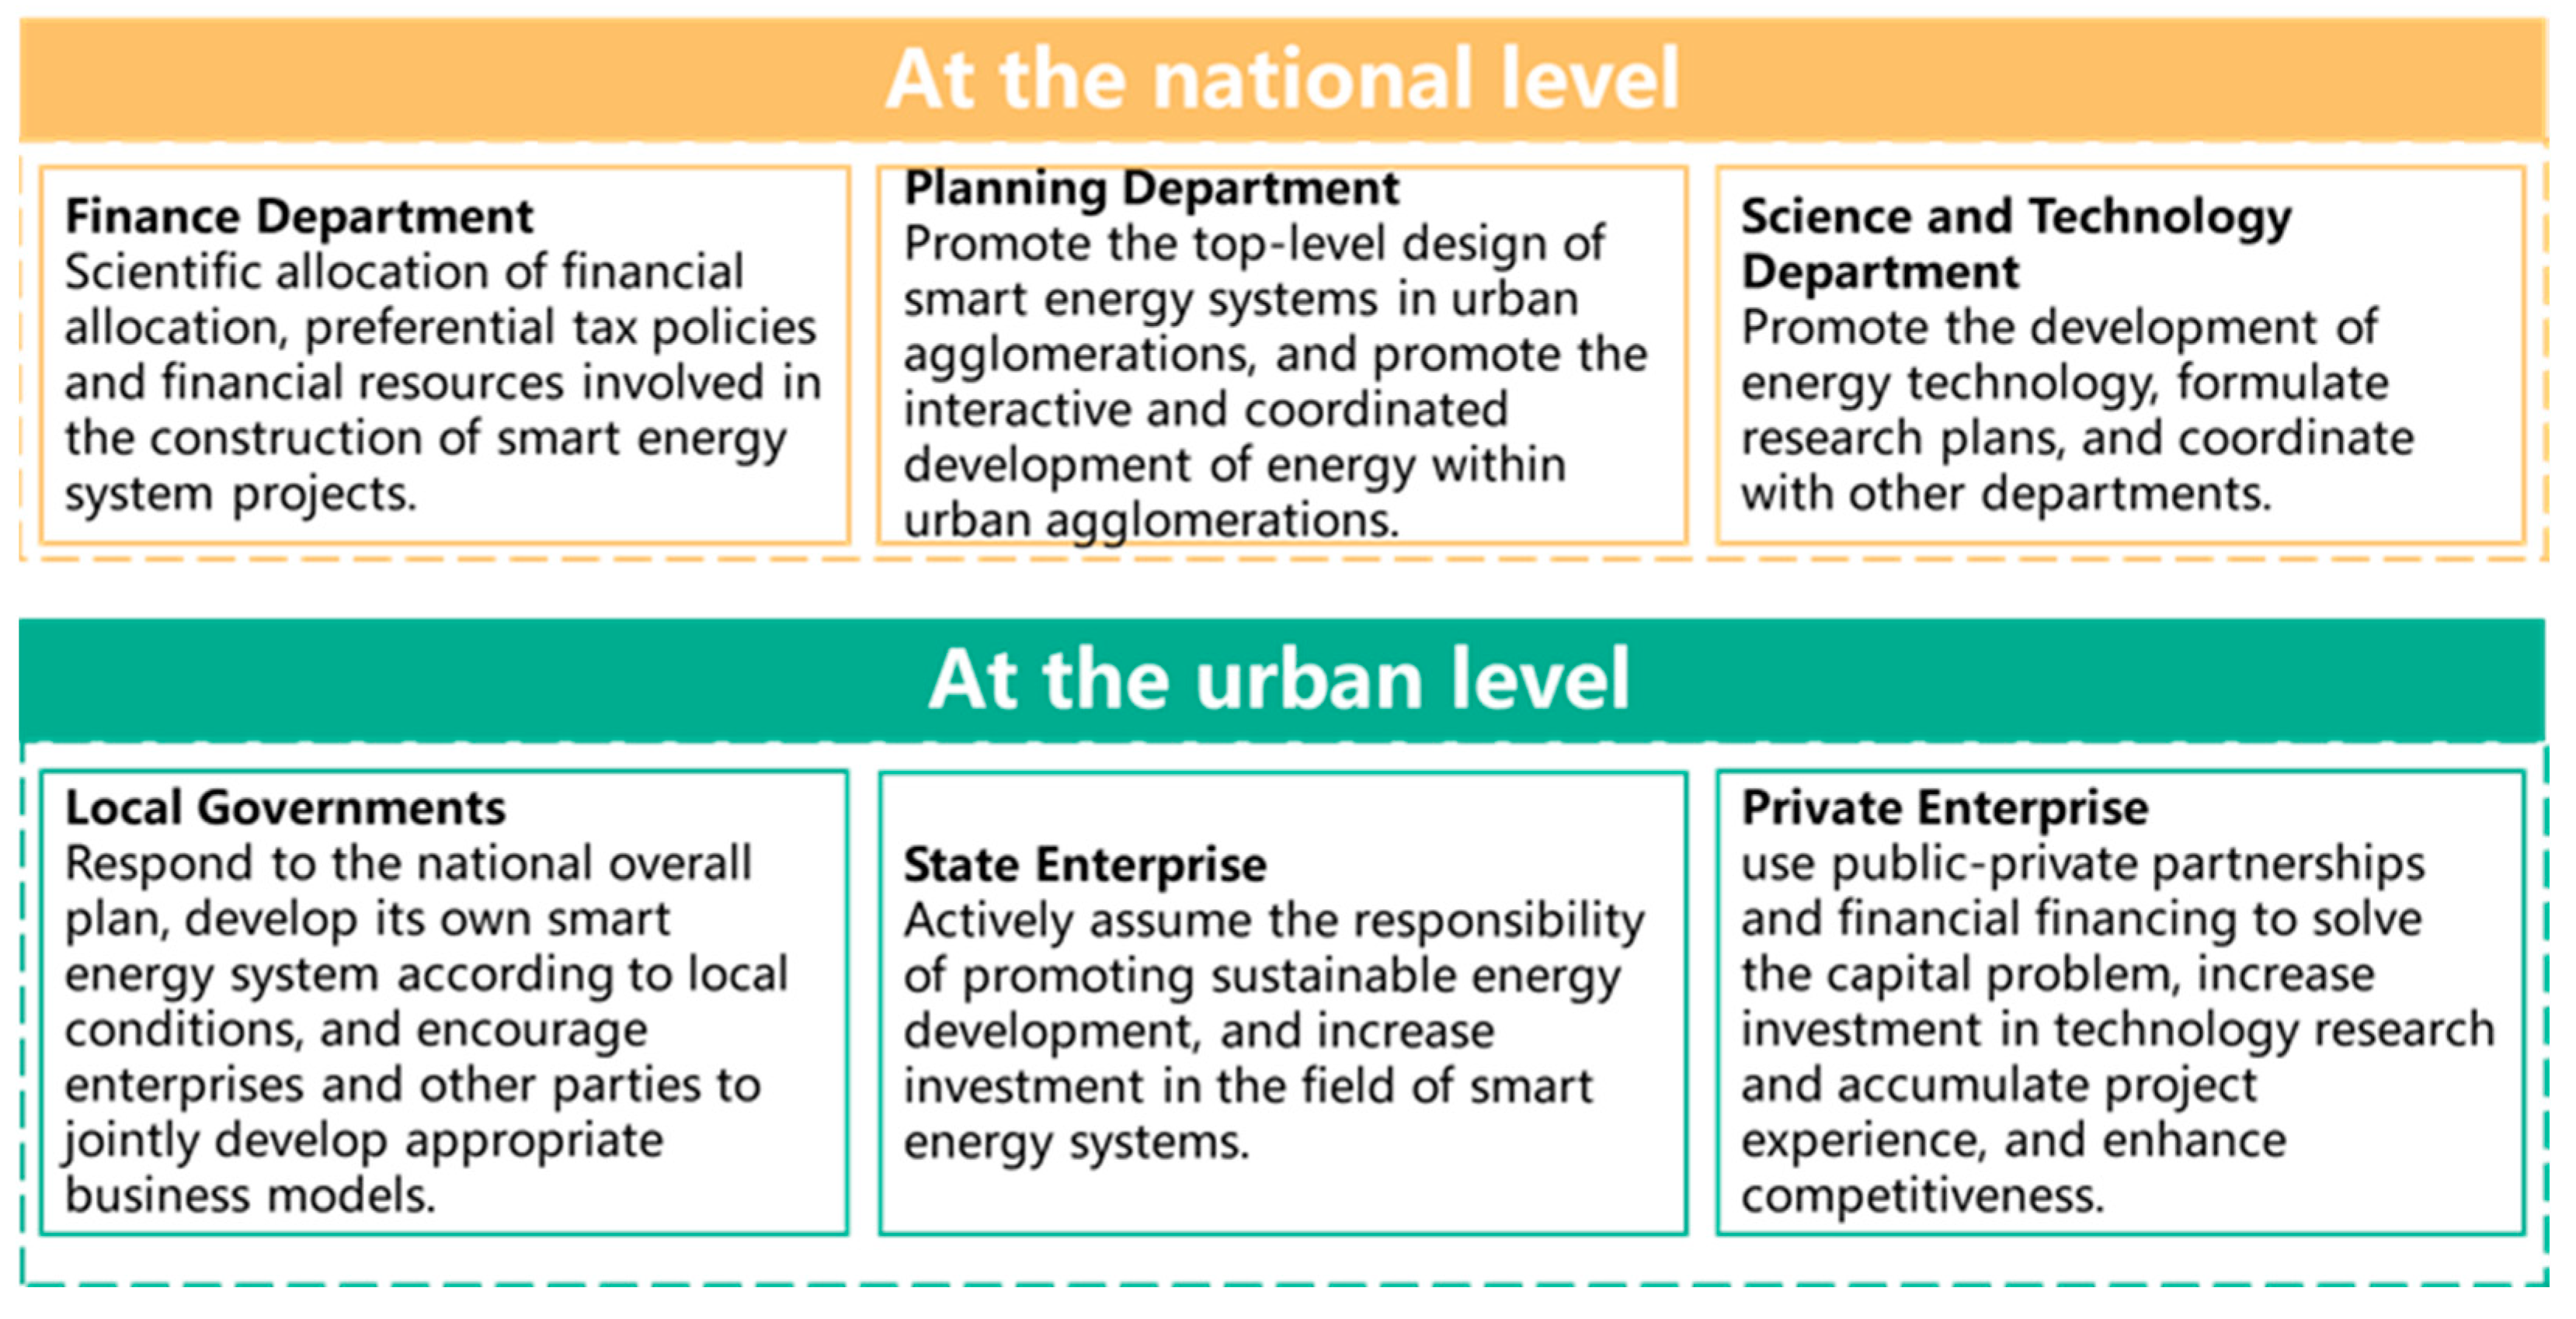
- At the national level, energy policy makers lack a clear design of the overall structure, development path, and operation mode of building smart energy system at the urban agglomeration level. The aforementioned projects have utilized diverse technical approaches, including thermoelectric conversion, clean energy-based heating, photovoltaic power generation, heat storage technology, and information and communication technology, to contribute to the operation and management of the energy system. However, it is important to acknowledge that the majority of these projects tend to concentrate on specific technical solutions, thereby lacking a comprehensive application of technology, but there are few plans at the level of urban agglomerations in the national smart energy system planning. The makers of regional planning policies should establish a more efficient system of communication, cooperation, and co-construction among cities in urban agglomeration to improve the process and effect of building SEUA.
- At the urban level, the policy executors of the energy system should strengthen the guidance of the smart energy system of enterprises to help enterprises cope with the problems of low return on projects, insufficient operating experience, and immature technology. The makers of regional planning should fully integrate the construction and operation of smart energy systems into urban planning.
4.1.3. Action Suggestion
4.2. Evaluation and Analysis of Indicators for SEUAs in China
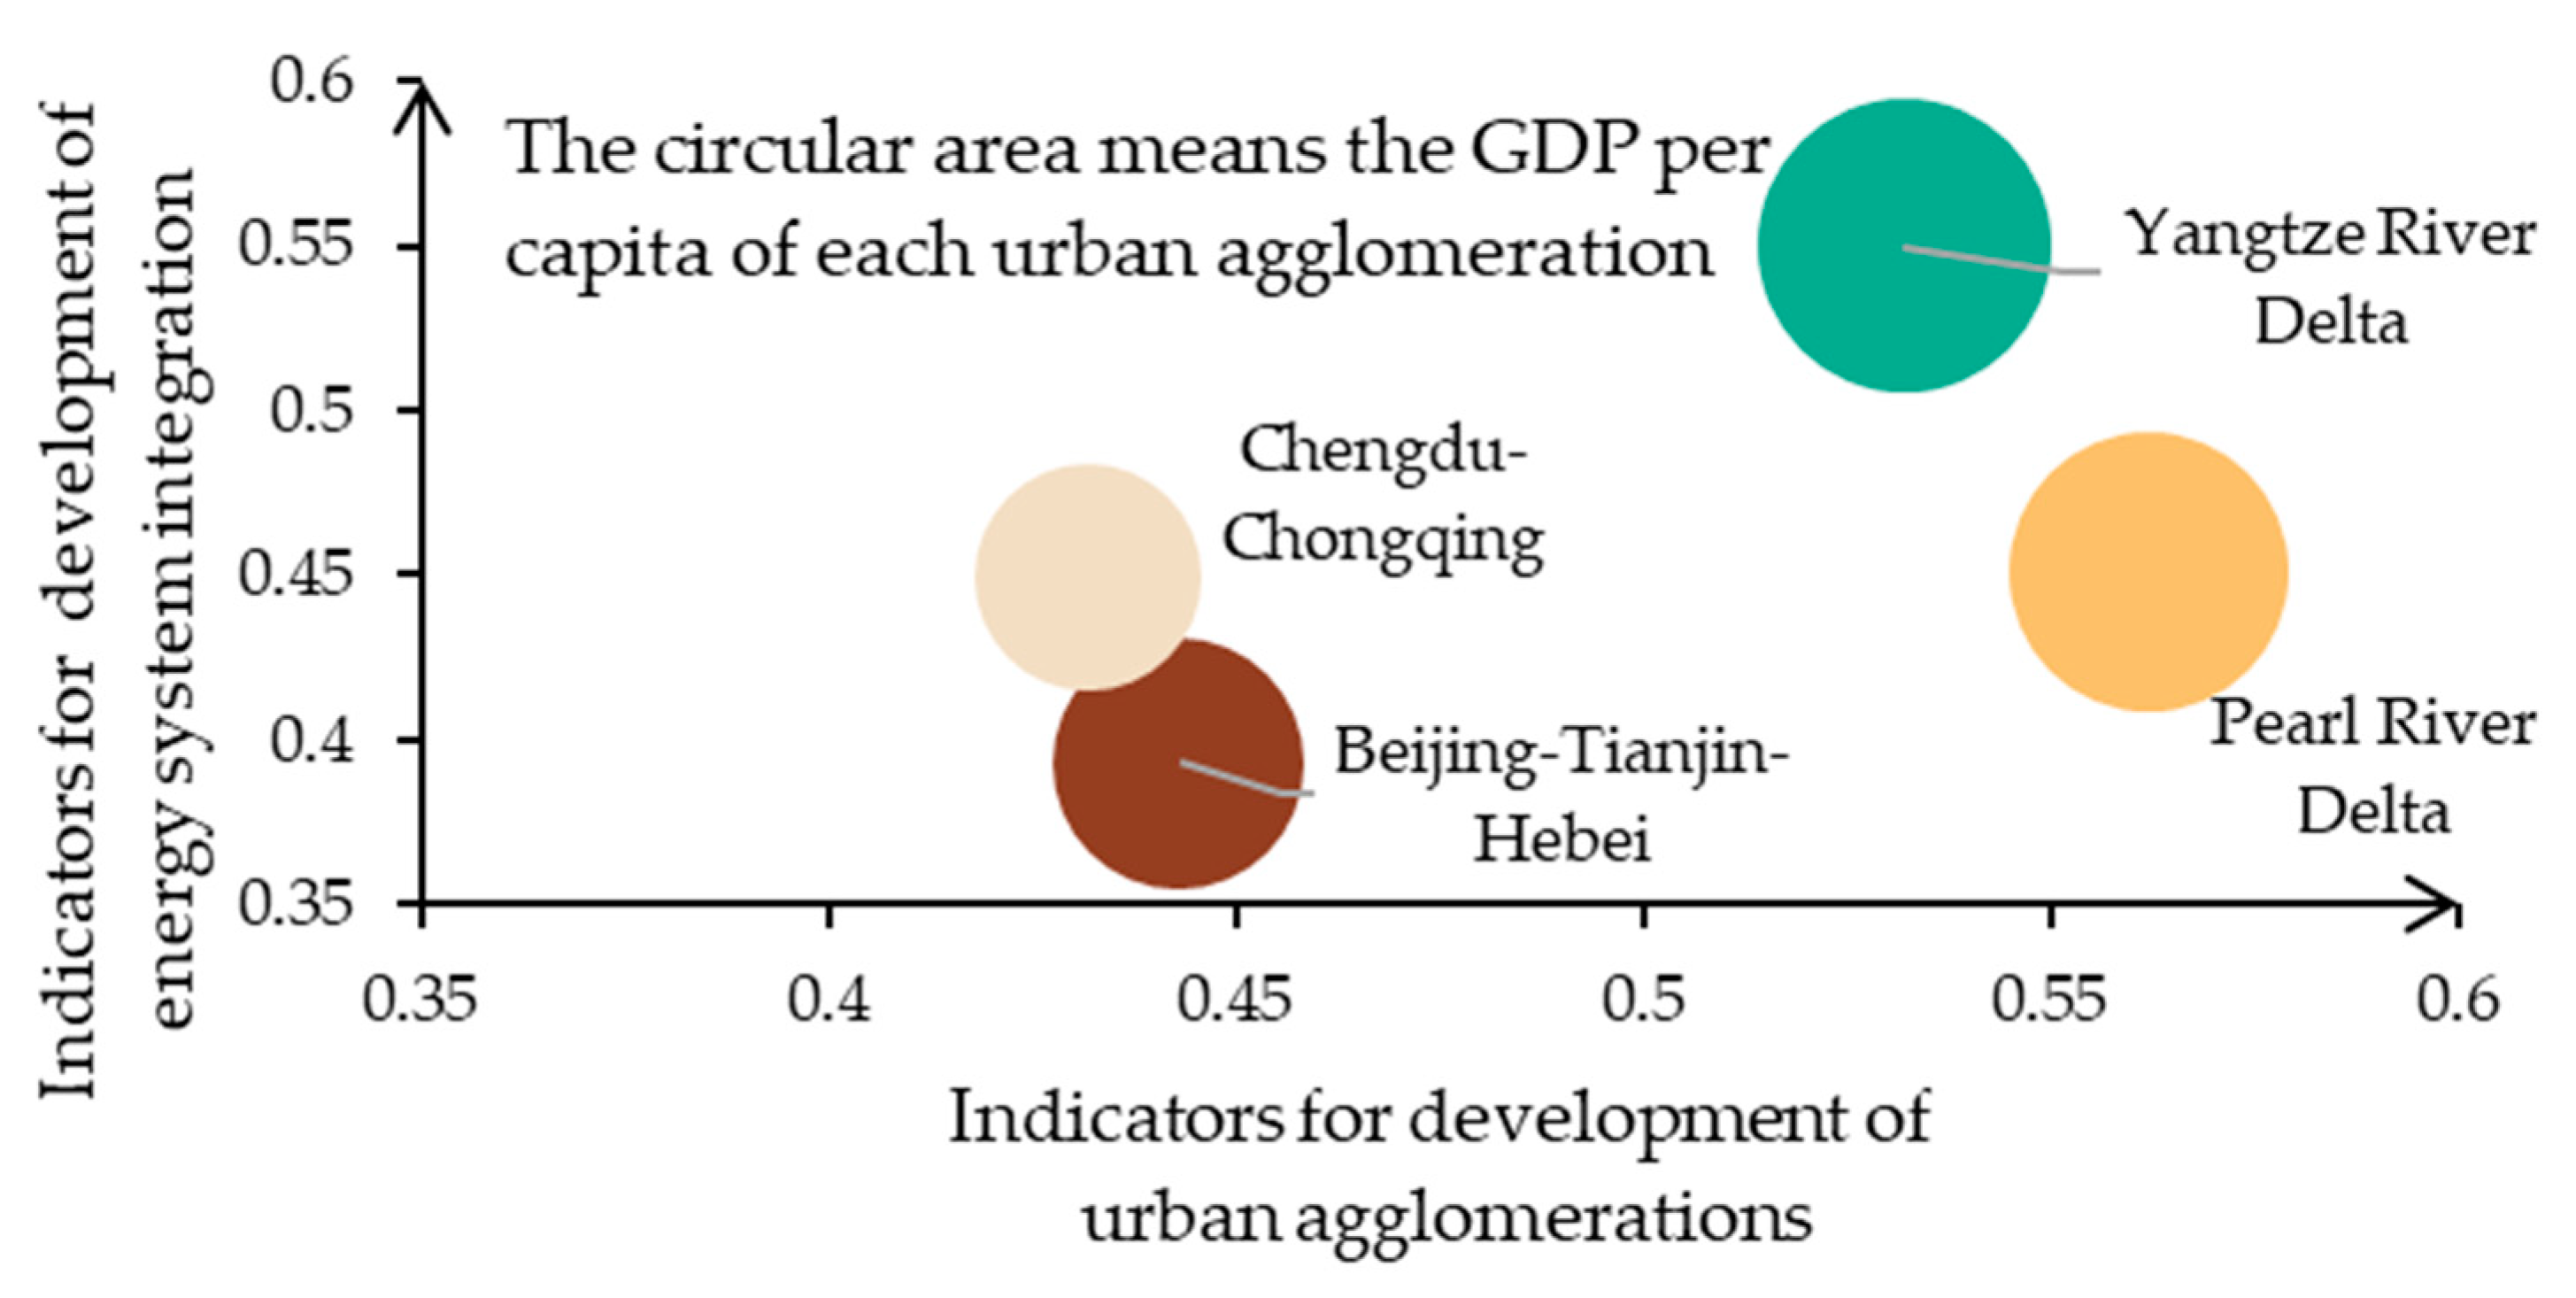
4.2.1. Indicator Evaluation for the Development of the Four Major SEUAs in China
4.2.2. Reasons for the Different Development of the Four Major SEUAs in China
4.3. Policy Implications
4.4. Limitations of this Study
5. Conclusions and Recommendations
- The development of China’s SEUAs is driven by the external national policies of urban agglomerations and the internal construction of cities, and the driving forces of these two levels are realized along the two axes of urban planning and energy system integration.
- China’s SEUAs are a kind of urban agglomeration that aim at regional coordinated development, take the construction of internal urban smart energy system as the foundation, and realize high operation quality, high energy efficiency, and high renewable energy proportion through innovation of information and communication technology, energy technology, and market mechanism.
- The Yangtze River Delta and Pearl River Delta urban agglomerations are closer to the development requirements of China’s SEUAs.
- The internal driving force of cities in China’s SEUAs is stronger than the external driving force from the national policies.
- The construction of SEUAs should be promoted from the aspects of energy system integration and regional construction at the national level and internal city level.
- In the process of building SEUAs, we should take the Yangtze River Delta and Pearl River Delta as the demonstration of building SEUAs.
- We should take advantage of the effect of spontaneous construction of internal cities and strengthen the guidance of national policies on SEUAs.
Author Contributions
Funding
Institutional Review Board Statement
Informed Consent Statement
Data Availability Statement
Acknowledgments
Conflicts of Interest
Appendix A

| Axis | Indicator Name | Data | Year | Data Resource |
|---|---|---|---|---|
| Indicators for development of urban agglomerations | GDP per capita | GDP; Permanent population | 2019 | ① |
| Share of GDP in secondary and tertiary sectors | GDP of secondary industry; GDP of tertiary industry; GDP | 2019 | ① | |
| Urbanization rate of permanent population | Urban permanent population; Permanent population | 2019 | ① | |
| Carbon emission intensity (negative indicator) | Carbon emissions; GDP | 2017 | ②; ① | |
| Industrial waste gas emission intensity (negative indicator) | Industrial waste gas emissions; GDP | 2015 | ③; ① | |
| Indicators for development of energy system integration | Energy intensity (negative indicator) | Total energy consumption; GDP | 2018 | ④; ① |
| Share of renewable electricity (including hydropower) | Consumption of renewable energy power (including hydropower; Electricity consumption of the whole society | 2019 | ⑤; ① | |
| Urban gas penetration rate | Number of urban gas users; Urban permanent residents | 2019 | ④; ① | |
| Per capita residential electricity consumption | Household electricity consumption; Permanent population | 2018 | ① | |
| Ratio of urban energy industry investment to GDP | Investment in urban energy industry; GDP | 2017 | ④; ① | |
| Number of smart energy system projects | Count directly | ⑤ |
| Axis | Indicator Name | Data | Year | Data Resource |
|---|---|---|---|---|
| Indicators for development of urban agglomerations | GDP per capita | GDP; Permanent population | 2019 | ①; ② |
| Share of GDP in secondary and tertiary sectors | GDP of secondary industry; GDP of tertiary industry; GDP | 2019 | ① | |
| Urbanization rate of permanent population | Urban permanent population; Permanent population | 2019 | ② | |
| Indicators for development of energy system integration | Power consumption intensity | Total electricity consumption; GDP | 2016 | ③; ① |
| Per capita domestic electricity consumption of urban residents | Domestic electricity consumption of residents in municipal districts; Urban permanent population | 2016 | ③; ② | |
| Per capita gas consumption of urban residents | Domestic gas supply of artificial gas and natural gas in the municipal area; Urban permanent population | 2018 | ③; ② |
Appendix B
- 1.
- Construction of the judgment matrix.
- 2.
- Calculation of indicator weights.
- 3.
- Consistency inspection
| Expert No. | GDP per Capita | Share of GDP in Secondary and Tertiary Sectors | Urbanization Rate of Permanent Population | Carbon Emission Intensity (Negative Indicator) | Industrial Waste Gas Emission Intensity (Negative Indicator) | CR |
|---|---|---|---|---|---|---|
| 1 | 0.106 | 0.293 | 0.037 | 0.352 | 0.212 | 0.099 |
| 2 | 0.373 | 0.373 | 0.171 | 0.054 | 0.029 | 0.042 |
| 3 | 0.559 | 0.186 | 0.160 | 0.061 | 0.034 | 0.050 |
| 4 | 0.303 | 0.255 | 0.148 | 0.093 | 0.200 | 0.317 |
| 5 | 0.366 | 0.160 | 0.366 | 0.060 | 0.049 | 0.080 |
| 6 | 0.165 | 0.241 | 0.453 | 0.073 | 0.069 | 0.057 |
| 7 | 0.473 | 0.214 | 0.214 | 0.050 | 0.050 | 0.021 |
| 8 | 0.494 | 0.141 | 0.243 | 0.082 | 0.040 | 0.071 |
| 9 | 0.377 | 0.377 | 0.128 | 0.080 | 0.038 | 0.035 |
| 10 | 0.162 | 0.347 | 0.077 | 0.372 | 0.042 | 0.043 |
| Expert No. | Energy Intensity (Negative Indicator) | Share of Renewable Electricity (Including Hydropower) | Urban Gas Penetration Rate | Per Capita Residential Electricity Consumption | Ratio of Urban Energy Industry Investment to GDP | Number of Smart Energy System Projects | CR |
|---|---|---|---|---|---|---|---|
| 1 | 0.196 | 0.207 | 0.044 | 0.095 | 0.055 | 0.402 | 0.050 |
| 2 | 0.128 | 0.237 | 0.033 | 0.075 | 0.033 | 0.494 | 0.051 |
| 3 | 0.268 | 0.397 | 0.020 | 0.174 | 0.052 | 0.089 | 0.074 |
| 4 | 0.231 | 0.415 | 0.070 | 0.101 | 0.136 | 0.046 | 0.126 |
| 5 | 0.036 | 0.130 | 0.323 | 0.323 | 0.130 | 0.056 | 0.014 |
| 6 | 0.362 | 0.168 | 0.071 | 0.168 | 0.062 | 0.168 | 0.008 |
| 7 | 0.493 | 0.037 | 0.149 | 0.218 | 0.066 | 0.037 | 0.032 |
| 8 | 0.297 | 0.058 | 0.049 | 0.131 | 0.143 | 0.323 | 0.033 |
| 9 | 0.141 | 0.081 | 0.428 | 0.245 | 0.078 | 0.027 | 0.075 |
| 10 | 0.072 | 0.196 | 0.072 | 0.094 | 0.163 | 0.402 | 0.031 |
| n. | 1 | 2 | 3 | 4 | 5 | 6 | 7 |
| RI | 0 | 0 | 0.58 | 0.90 | 1.12 | 1.24 | 1.32 |
Appendix C
| Indicator | GDP per Capita | Share of GDP in Secondary and Tertiary Sectors | Urbanization Rate of Permanent Population | Carbon Emission Intensity (Negative Indicator) | Industrial Waste Gas Emission Intensity (Negative Indicator) |
|---|---|---|---|---|---|
| Weight | 0.342 | 0.259 | 0.205 | 0.131 | 0.063 |
| Indicator | Energy Intensity (Negative Indicator) | Share of Renewable Electricity (Including Hydropower) | Urban Gas Penetration Rate | Per Capita Residential Electricity Consumption | Ratio of Urban Energy Industry Investment to GDP | Number of Smart Energy System Projects |
|---|---|---|---|---|---|---|
| Weight | 0.222 | 0.168 | 0.132 | 0.169 | 0.087 | 0.222 |
| Indicator | GDP per Capita | Share of GDP in Secondary and Tertiary Sectors | Urbanization Rate of Permanent Population | Power Consumption Intensity | Per Capita Domestic Electricity Consumption of Urban Residents | Per Capita Gas Consumption of Urban Residents |
|---|---|---|---|---|---|---|
| Weight | 0.424 | 0.321 | 0.254 | 0.424 | 0.323 | 0.252 |
| Axis | Indicator Name | Beijing-Tianjin-Hebei | Yangtze River Delta | Pearl River Delta | Chengdu-Chongqing |
|---|---|---|---|---|---|
| Indicators for development of urban agglomerations | GDP per capita | 0.4395 | 0.6137 | 0.5491 | 0.3588 |
| Share of GDP in secondary and tertiary sectors | 0.5045 | 0.5074 | 0.5070 | 0.4805 | |
| Urbanization rate of permanent population | 0.5045 | 0.5157 | 0.5400 | 0.4335 | |
| Carbon emission intensity (negative indicator) | 0.3383 | 0.4647 | 0.6608 | 0.4826 | |
| Industrial waste gas emission intensity (negative indicator) | 0.2328 | 0.3794 | 0.7248 | 0.5259 | |
| Indicators for development of energy system integration | Energy intensity (negative indicator) | 0.3335 | 0.5677 | 0.6006 | 0.4537 |
| Share of renewable electricity (including hydropower) | 0.1641 | 0.2305 | 0.4223 | 0.8612 | |
| Urban gas penetration rate | 0.5073 | 0.5069 | 0.4984 | 0.4871 | |
| Per capita residential electricity consumption | 0.4874 | 0.5573 | 0.5586 | 0.3739 | |
| Ratio of urban energy industry investment to GDP | 0.6610 | 0.3398 | 0.2969 | 0.5996 | |
| Number of smart energy system projects | 0.3830 | 0.8755 | 0.2736 | 0.1094 |
References
- The Central People’s Government of the China. Opinions on Establishing a More Effective New Mechanism for Regional Coordinated Development. Available online: http://www.gov.cn/zhengce/2018-11/29/content_5344537.htm (accessed on 19 January 2023).
- China National Energy Administration. The 13th Five Year Plan for Energy Development. Available online: http://www.nea.gov.cn/135989417_14846217874961n.pdf (accessed on 13 December 2022).
- Zhang, L.P.; Zhu, Y.Y.; Fan, L.W. Temporal-Spatial Structure and Influencing Factors of Urban Energy Efficiency in China’s Agglomeration Areas. Sustainability 2021, 13, 10961. [Google Scholar] [CrossRef]
- Guan, R.D.; Tian, L.X.; Li, W.C. Analysis of Influencing Factors on Energy Efficiency of Yangtze River Delta Urban Agglomeration Based on Spatial Heterogeneity. Energy Procedia 2019, 158, 3234–3239. [Google Scholar] [CrossRef]
- Ma, Y.S.; Yao, Q.Y. Impact of Producer Service Agglomeration on Carbon Emission Efficiency and Its Mechanism: A Case Study of Urban Agglomeration in the Yangtze River Delta. Sustainability 2022, 14, 53. [Google Scholar] [CrossRef]
- Tang, L.W.; Li, K. A comparative analysis on energy-saving and emissions-reduction performance of three urban agglomerations in China. J. Clean. Prod. 2019, 220, 953–964. [Google Scholar] [CrossRef]
- Zhang, Y.; Zheng, H.M.; Yang, Z.F.; Li, Y.X.; Liu, G.Y.; Su, M.R.; Yin, X.N. Urban energy flow processes in the Beijing-Tianjin-Hebei (Jing-Jin-Ji) urban agglomeration: Combining multi-regional input-output tables with ecological network analysis. J. Clean. Prod. 2016, 114, 243–256. [Google Scholar] [CrossRef]
- Chong, C.H. Decomposition Method of Regional Energy Consumption Based on Energy Flow Graph and LMDI; Tsinghua University: Beijing, China, 2015. [Google Scholar]
- Wang, Y. Concept and Prospect of Global Energy Interconnection. Electr. Power 2016, 49, 1–5. [Google Scholar] [CrossRef]
- Zheng, M.; Billanes, J.D.; Jorgensen, B.N. The national multi-island smart energy system in Philippines. In Proceedings of the 2016 IEEE International Autumn Meeting on Power, Electronics and Computing (ROPEC), Zihuatanejo, Mexico, 9–11 November 2016; p. 6. [Google Scholar]
- Ceglia, F.; Esposito, P.; Marrasso, E.; Sasso, M. From smart energy community to smart energy municipalities: Literature review, agendas and pathways. J. Clean. Prod. 2020, 254, 120118. [Google Scholar] [CrossRef]
- Jantzen, J.; Kristensen, M.; Christensen, T.H. Sociotechnical transition to smart energy: The case of Samso 1997–2030. Energy 2018, 162, 20–34. [Google Scholar] [CrossRef]
- Carley, S.; Engle, C.; Konisky, D.M. An analysis of energy justice programs across the United States. Energy Policy 2021, 152, 112219. [Google Scholar] [CrossRef]
- Gambarotta, A.; Morini, M.; Rossi, M.; Stonfer, M. A library for the simulation of smart energy systems: The case of the Campus of the University of Parma. Energy Procedia 2017, 105, 1776–1781. [Google Scholar] [CrossRef]
- Fabrizio, E.; Branciforti, V.; Costantino, A.; Filippi, M.; Barbero, S.; Tecco, G.; Mollo, P.; Molino, A. Monitoring and managing of a micro-smart grid for renewable sources exploitation in an agro-industrial site. Sustain. Cities Soc. 2017, 28, 88–100. [Google Scholar] [CrossRef]
- Kang, B.; Jang, K.; Park, S.; Choi, M.I.; Park, S. Energy Storage System Control Algorithm by Operating Target Power to Improve Energy Sustainability of Smart Home. Sustainability 2018, 10, 236. [Google Scholar] [CrossRef] [Green Version]
- Liang, X.S.; Ma, L.W.; Chong, C.H.; Li, Z.; Ni, W.D. Development of smart energy towns in China: Concept and practices. Renew. Sust. Energy Rev. 2020, 119, 109507. [Google Scholar] [CrossRef]
- Mosannenzadeh, F.; Di Nucci, M.R.; Vettorato, D. Identifying and prioritizing barriers to implementation of smart energy city projects in Europe: An empirical approach. Energy Policy 2017, 105, 191–201. [Google Scholar] [CrossRef]
- Connolly, D.; Lund, H.; Mathiesen, B.V. Smart Energy Europe: The technical and economic impact of one potential 100% renewable energy scenario for the European Union. Renew. Sust. Energy Rev. 2016, 60, 1634–1653. [Google Scholar] [CrossRef]
- Serban, A.C.; Lytras, M.D. Artificial Intelligence for Smart Renewable Energy Sector in Europe—Smart Energy Infrastructures for Next Generation Smart Cities. IEEE Access 2020, 8, 77364–77377. [Google Scholar] [CrossRef]
- Feng, Z.; Tang, W.; Niu, Z.; Wu, Q. Bi-level allocation of carbon emission permits based on clustering analysis and weighted voting: A case study in China. Appl. Energy 2018, 228, 1122–1135. [Google Scholar] [CrossRef]
- Niu, F.Q.; Yang, X.Y.; Wang, F. Urban Agglomeration Formation and Its Spatiotemporal Expansion Process in China: From the Perspective of Industrial Evolution. Chin. Geogr. Sci. 2020, 30, 532–543. [Google Scholar] [CrossRef] [Green Version]
- Qin, G.; Zhang, P.Y.; Jiao, B. Formation Mechanism and Spatial Pattern of Urban Agglomeration in Central Jilin of China. Chin. Geogr. Sci. 2006, 16, 154–159. [Google Scholar] [CrossRef]
- China National Energy Administration. Guiding Opinions on the Cultivation and Development of Modern Metropolitan Area. Available online: http://www.gov.cn/xinwen/2019-02/21/content_5367465.htm (accessed on 21 February 2023).
- Sun, X. Research on the Construction of Japanese Metropolitan Area after the War. Ph.D. Thesis, Jinlin University, Changchun, China, 2017. [Google Scholar]
- The Central People’s Government of the China. National New Urbanization Plan (2014–2020). Available online: http://www.gov.cn/zhengce/2014-03/16/content_2640075.htm (accessed on 16 March 2023).
- Wang, Q.; Huang, J. Atmospheric pollution control policies of the Tokyo metropolitan area as a reference for the Beijing-Tianjin-Hebei urban agglomeration. Prog. Geogr. 2018, 37, 790–800. [Google Scholar]
- Dekker, J.; Nthontho, M.; Chowdhury, S.; Chowdhury, S.P. Economic analysis of PV/diesel hybrid power systems in different climatic zones of South Africa. Int. J. Elec Power 2012, 40, 104–112. [Google Scholar] [CrossRef]
- Fang, T.T.; Lahdelma, R. Genetic optimization of multi-plant heat production in district heating networks. Appl. Energy 2015, 159, 610–619. [Google Scholar] [CrossRef]
- Chow, T.T.; Chan, A.L.S.; Song, C.L. Building-mix optimization in district-cooling system implementation. Appl. Energy 2004, 77, 1–13. [Google Scholar] [CrossRef]
- O’Dwyer, E.; Pan, I.; Acha, S.; Shah, N. Smart energy systems for sustainable smart cities: Current developments, trends and future directions. Appl. Energy 2019, 237, 581–597. [Google Scholar] [CrossRef] [Green Version]
- Zhao, Y.L.; Ma, L.W.; Li, Z.; Ni, W.D. The development of regional smart energy systems in the World and China: The concepts, practices, and a new perspective. Wires Data Min. Knowl. 2021, 11, e1409. [Google Scholar] [CrossRef]
- Lund, H. Renewable Energy Systems: A Smart Energy Systems Approach to the Choice and Modeling of 100% Renewable Solutions, 2nd ed.; Academic Press: Cambridge, MA, USA, 2014; pp. 1–362. [Google Scholar]
- Alsarayreh, M.; Mohamed, O.; Matar, M. Modeling a Practical Dual-Fuel Gas Turbine Power Generation System Using Dynamic Neural Network and Deep Learning. Sustainability 2022, 14, 870. [Google Scholar] [CrossRef]
- Moriarty, P.; Honnery, D. Energy Efficiency or Conservation for Mitigating Climate Change? Energies 2019, 12, 3543. [Google Scholar] [CrossRef] [Green Version]
- Theodosiou, G.; Stylos, N.; Koroneos, C. Integration of the environmental management aspect in the optimization of the design and planning of energy systems. J. Clean. Prod. 2015, 106, 576–593. [Google Scholar] [CrossRef]
- Andiappan, V. Optimization of smart energy systems based on response time and energy storage losses. Energy 2022, 258, 124811. [Google Scholar] [CrossRef]
- Naji, N.; Abid, M.R.; Krami, N.; Benhaddou, D. An Energy-Aware Wireless Sensor Network for Data Acquisition in Smart Energy Efficient Building. In Proceedings of the 2019 IEEE 5th World Forum on Internet of Things (Wf-Iot), Limerick, Ireland, 15–18 April 2019; pp. 7–12. [Google Scholar]
- Molina, M.G. Energy Storage and Power Electronics Technologies: A Strong Combination to Empower the Transformation to the Smart Grid. Proc. IEEE 2017, 105, 2191–2219. [Google Scholar] [CrossRef]
- Balta-Ozkan, N.; Watson, T.; Mocca, E. Spatially uneven development and low carbon transitions: Insights from urban and regional planning. Energy Policy 2015, 85, 500–510. [Google Scholar] [CrossRef] [Green Version]
- Lund, H.; Ostergaard, P.A.; Connolly, D.; Mathiesen, B.V. Smart energy and smart energy systems. Energy 2017, 137, 556–565. [Google Scholar] [CrossRef]
- Schweizer, P.-J.; Renn, O.; Köck, W.; Bovet, J.; Benighaus, C.; Scheel, O.; Schröter, R. Public participation for infrastructure planning in the context of the German “Energiewende”. Util. Policy 2016, 43, 206–209. [Google Scholar] [CrossRef]
- Chekland, P.B. Rethinking a systems approach. J. Appl. Syst. Anal. 1981, 8, 3–14. [Google Scholar]
- Mosannenzadeh, F.; Bisello, A.; Vaccaro, R.; D’Alonzo, V.; Hunter, G.W.; Vettorato, D. Smart energy city development: A story told by urban planners. Cities 2017, 64, 54–65. [Google Scholar] [CrossRef]
- Wang, X.; Chen, X. Top-Level Design of Urban Intelligent Energy Systems under Urban Energy Revolution. Electr. Power 2018, 51, 85–91. [Google Scholar] [CrossRef]
- Bellocchi, S.; De Iulio, R.; Guidi, G.; Manno, M.; Nastasi, B.; Noussan, M.; Prina, M.G.; Roberto, R. Analysis of smart energy system approach in local alpine regions—A case study in Northern Italy. Energy 2020, 202, 117748. [Google Scholar] [CrossRef]
- Chisika, S.N.; Yeom, C. Enhancing Sustainable Development and Regional Integration through Electrification by Solar Power: The Case of Six East African States. Sustainability 2021, 13, 3275. [Google Scholar] [CrossRef]
- Fang, R.M.; Zhang, R.H. Preface to the special issue on advances in Hybrid Energy Storage Systems and smart energy grid applications. J. Energy Storage 2022, 55, 105781. [Google Scholar] [CrossRef]
- China National Development and Reform Commission. Strategic Report on Energy Production and Consumption Revolution (2016–2030). Available online: https://www.gov.cn/xinwen/2017-04/25/5230568/files/286514af354e41578c57ca38d5c4935b.pdf (accessed on 15 March 2022).
- Zhang, J.; Gao, F.; Xu, S.; Zhang, X.; Zhang, L.; Sun, Y. Energy Internet Technological Architecture and Case Analysis. Electr. Power 2018, 51, 24–30. [Google Scholar]
- Hu, J.; Yao, J.; Ai, C.; Li, Y.; Zhang, J.; Qiu, Y. Research and Application of Intelligent Centralized Management and Control System for Distributed Combined Cooling, Heating and Power Systems. Electr. Power 2019, 52, 42–47, 62. [Google Scholar]
- Li, L. More than 70% Energy Internet Demonstration Projects Are Difficult to Implement, and” Cross Border “Operations Still Have Barriers. Available online: https://shoudian.bjx.com.cn/html/20190515/980389.shtml (accessed on 15 March 2023).
- Liu, Z.; Uyttenhove, P.; Zheng, X. Moving Urban Sculptures towards Sustainability: The Urban Sculpture Planning System in China. Sustainability 2018, 10, 4802. [Google Scholar] [CrossRef] [Green Version]
- Liu, L. A sustainability index with attention to environmental justice for eco-city classification and assessment. Ecol. Indic. 2018, 85, 904–914. [Google Scholar] [CrossRef]
- Han, Z.W.; Jiao, S.; Zhang, X.; Xie, F.; Ran, J.; Jin, R.; Xu, S. Seeking sustainable development policies at the municipal level based on the triad of city, economy and environment: Evidence from Hunan province, China. J. Environ. Manag. 2021, 290, 112554. [Google Scholar] [CrossRef]
- Abu-Rayash, A.; Dincer, I. Development of integrated sustainability performance indicators for better management of smart cities. Sustain. Cities Soc. 2021, 67, 102704. [Google Scholar] [CrossRef]
- Wu, Y.Z.; Fan, P.L.; Li, B.; Ouyang, Z.T.; Liu, Y.; You, H.Y. The Effectiveness of Planning Control on Urban Growth: Evidence from Hangzhou, China. Sustainability 2017, 9, 855. [Google Scholar] [CrossRef] [Green Version]
- Xu, B.; Wu, S.Y.; Zhao, Q.L.; Tan, X. Benefit Evaluation of Integrated Energy System in China. IOP Conf. Ser. Earth Environ. 2019, 330, 032030. [Google Scholar] [CrossRef]
- Li, S.; Gao, F.; Zhang, J.; Zhang, X.; Zhao, M.; Yue, Y. Study on Urban Energy Strategy Development Index Evaluation System. Eng. Sci. 2018, 20, 117–124. [Google Scholar] [CrossRef]
- Cheng, W.J.; Mo, D.X.; Tian, Y.J.; Xu, W.Q.; Xie, K.C. Research on the Composite Index of the Modern Chinese Energy System. Sustainability 2019, 11, 150. [Google Scholar] [CrossRef] [Green Version]
- Jun, T.; PengLing, L. Research on urban smart energy evaluation index system. E3S Web Conf. 2019, 118, 01042. [Google Scholar] [CrossRef] [Green Version]
- Putra, Z.D.W.; van der Knaap, W. A smart city needs more than just technology: Amsterdam’s Energy Atlas project. Smart City Emerg. Cases Around World 2019, 6, 129–147. [Google Scholar] [CrossRef]
- Barresi, A. Urban densification and energy efficiency in Smart cities—The VerGe project (Switzerland). Techne 2018, 55, 28–32. [Google Scholar] [CrossRef]
- Seneviratne, S.I.; Rogelj, J.; Seferian, R.; Wartenburger, R.; Allen, M.R.; Cain, M.; Millar, R.J.; Ebi, K.L.; Ellis, N.; Hoegh-Guldberg, O.; et al. The many possible climates from the Paris Agreement’s aim of 1.5 degrees C warming. Nature 2018, 558, 41–49. [Google Scholar] [CrossRef] [Green Version]
- Proskuryakova, L.; Kovalev, A. Measuring energy efficiency: Is energy intensity a good evidence base? Appl. Energy 2015, 138, 450–459. [Google Scholar] [CrossRef]
- Lin, B.; Wang, M. What drives energy intensity fall in China? Evidence from a meta-frontier approach. Appl. Energy 2021, 281, 116034. [Google Scholar] [CrossRef]
- Luan, B.J.; Zou, H.; Chen, S.X.; Huang, J.B. The effect of industrial structure adjustment on China’s energy intensity: Evidence from linear and nonlinear analysis. Energy 2021, 218, 119517. [Google Scholar] [CrossRef]
- Cucchiella, F.; D’Adamo, I.; Gastaldi, M.; Koh, S.C.L.; Rosa, P. A comparison of environmental and energetic performance of European countries: A sustainability index. Renew. Sust. Energ. Rev. 2017, 78, 401–413. [Google Scholar] [CrossRef]
- Strantzali, E.; Aravossis, K. Decision making in renewable energy investments: A review. Renew. Sust. Energ. Rev. 2016, 55, 885–898. [Google Scholar] [CrossRef]
- Marinakis, V.; Doukas, H.; Xidonas, P.; Zopounidis, C. Multicriteria decision support in local energy planning: An evaluation of alternative scenarios for the Sustainable Energy Action Plant. Omega 2017, 69, 1–16. [Google Scholar] [CrossRef]
- China National Energy Administration. Guiding Opinions on Promoting the Development of “Internet plus” Smart Energy. Available online: http://www.nea.gov.cn/2016-02/29/c_135141026.htm (accessed on 9 February 2023).
- Zhou, L.; Sun, N.; Miao, Y.; Zhang, S. Polarization Effect and Spread Effect: The Role of the Yangtze River Delta in Regional Balanced Development: Evidence from Urban Agglomerations in the Yangtze River Delta and the Middle Reaches of the Yangtze River. Resour. Environ. Yangtze Basin 2021, 30, 782–795. [Google Scholar]
- the Xinhua News Agency. Outline of the 13th Five Year Plan for National Economic and Social Development of the People’s Republic of China. Available online: http://www.xinhuanet.com/politics/2016lh/2016-03/17/c_1118366322.htm (accessed on 23 March 2023).
- Gilbert, A.Q.; Sovacool, B.K. Better modelling for the energy mix. Nature 2014, 515, 198. [Google Scholar] [CrossRef] [Green Version]
- the Xinhua News Agency. The Fourteenth Five Year Plan for National Economic and Social Development of the People’s Republic of China and the Outline of the Long-term Goals for 2035. Available online: http://www.xinhuanet.com/2021-03/13/c_1127205564.htm (accessed on 13 March 2023).
- Li, W.W.; Yi, P.T.; Yu, H.T.; Lin, W.C.; Wu, X.Y. Assessment on sustainable development of three major urban agglomerations in China based on sustainability-differentiation-combined weighting method. Sustain. Dev. 2023. [Google Scholar] [CrossRef]


| Axis | Indicator Name | Calculation Formula |
|---|---|---|
| Indicators for development of urban agglomerations | GDP per capita | GDP/Permanent population |
| Share of GDP in secondary and tertiary sectors | (GDP of secondary industry + GDP of tertiary industry)/GDP | |
| Urbanization rate of permanent population | Urban permanent population/Permanent population | |
| Carbon emission intensity (negative indicator) | Carbon emissions/GDP | |
| Industrial waste gas emission intensity (negative indicator) | Industrial waste gas emissions/GDP | |
| Indicators for development of energy system integration | Energy intensity (negative indicator) | Total energy consumption/GDP |
| Share of renewable electricity (including hydropower) | Consumption of renewable energy power (including hydropower)/Electricity consumption of the whole society | |
| Urban gas penetration rate | Number of urban gas users/Urban permanent residents | |
| Per capita residential electricity consumption | Household electricity consumption/permanent population | |
| Ratio of urban energy industry investment to GDP | Investment in urban energy industry/GDP | |
| Number of smart energy system projects | Count directly |
| Axis | Indicator Name | Calculation Formula |
|---|---|---|
| Indicators for development of city | GDP per capita | GDP/Permanent population |
| Share of GDP in secondary and tertiary sectors | (GDP of secondary industry + GDP of tertiary industry)/GDP | |
| Urbanization rate of permanent population | Urban permanent population/Permanent population | |
| Indicators for development of energy system integration | Power consumption intensity | Total electricity consumption/GDP |
| Per capita domestic electricity consumption of urban residents | Domestic electricity consumption of residents in municipal districts/Urban permanent population | |
| Per capita gas consumption of urban residents | Domestic gas supply of artificial gas and natural gas in the municipal area/Urban permanent population |
| Internal Driving Forces | External Driving Forces |
|---|---|
| (1) Improve energy efficiency and the share of renewable energy in the region [17,44,45,47]. | (1) Promote the interconnection of transportation networks and energy pipeline networks among cities [26]. |
| (2) Strengthen the cooperation of energy, capital, and human resources among stakeholders in actual operation and production [17,44,46]. | (2) Achieving synergy between the electric, heat and fuel network [24,26,72]. |
| (3) Make cities actively participate in inter-city energy interaction [45,48]. | (3) Integrate the improvement in the share of renewable energy and optimize the synthetical efficiency for energy utilization [2,26,44,49]. |
| (4) Promote the involvement of information technology in the management of energy systems [37,48]. | (4) Develop the distributed energy resources and energy storage technologies [2,44,47]. |
| (5) Build a unified and complete energy market [2,47]. |
| Name of Urban Agglomeration | Beijing- Tianjin-Hebei Urban Agglomeration | Yangtze River Delta Urban Agglomeration | Pearl River Delta Urban Agglomeration | Chengdu and Chongqing Urban Agglomeration |
|---|---|---|---|---|
| Urban development level indicator | 0.443 | 0.532 | 0.562 | 0.432 |
| Energy system integration level indicator | 0.393 | 0.550 | 0.451 | 0.449 |
Disclaimer/Publisher’s Note: The statements, opinions and data contained in all publications are solely those of the individual author(s) and contributor(s) and not of MDPI and/or the editor(s). MDPI and/or the editor(s) disclaim responsibility for any injury to people or property resulting from any ideas, methods, instructions or products referred to in the content. |
© 2023 by the authors. Licensee MDPI, Basel, Switzerland. This article is an open access article distributed under the terms and conditions of the Creative Commons Attribution (CC BY) license (https://creativecommons.org/licenses/by/4.0/).
Share and Cite
Li, Z.; Tang, R.; Qiu, H.; Ma, L. Smart Energy Urban Agglomerations in China: The Driving Mechanism, Basic Concepts, and Indicator Evaluation. Sustainability 2023, 15, 11863. https://doi.org/10.3390/su151511863
Li Z, Tang R, Qiu H, Ma L. Smart Energy Urban Agglomerations in China: The Driving Mechanism, Basic Concepts, and Indicator Evaluation. Sustainability. 2023; 15(15):11863. https://doi.org/10.3390/su151511863
Chicago/Turabian StyleLi, Zheng, Ruoyao Tang, Hanbin Qiu, and Linwei Ma. 2023. "Smart Energy Urban Agglomerations in China: The Driving Mechanism, Basic Concepts, and Indicator Evaluation" Sustainability 15, no. 15: 11863. https://doi.org/10.3390/su151511863
APA StyleLi, Z., Tang, R., Qiu, H., & Ma, L. (2023). Smart Energy Urban Agglomerations in China: The Driving Mechanism, Basic Concepts, and Indicator Evaluation. Sustainability, 15(15), 11863. https://doi.org/10.3390/su151511863