

Study on Surface Deformation and Movement Caused by Deep Continuous Mining of Steeply Inclined Ore Bodies


Abstract
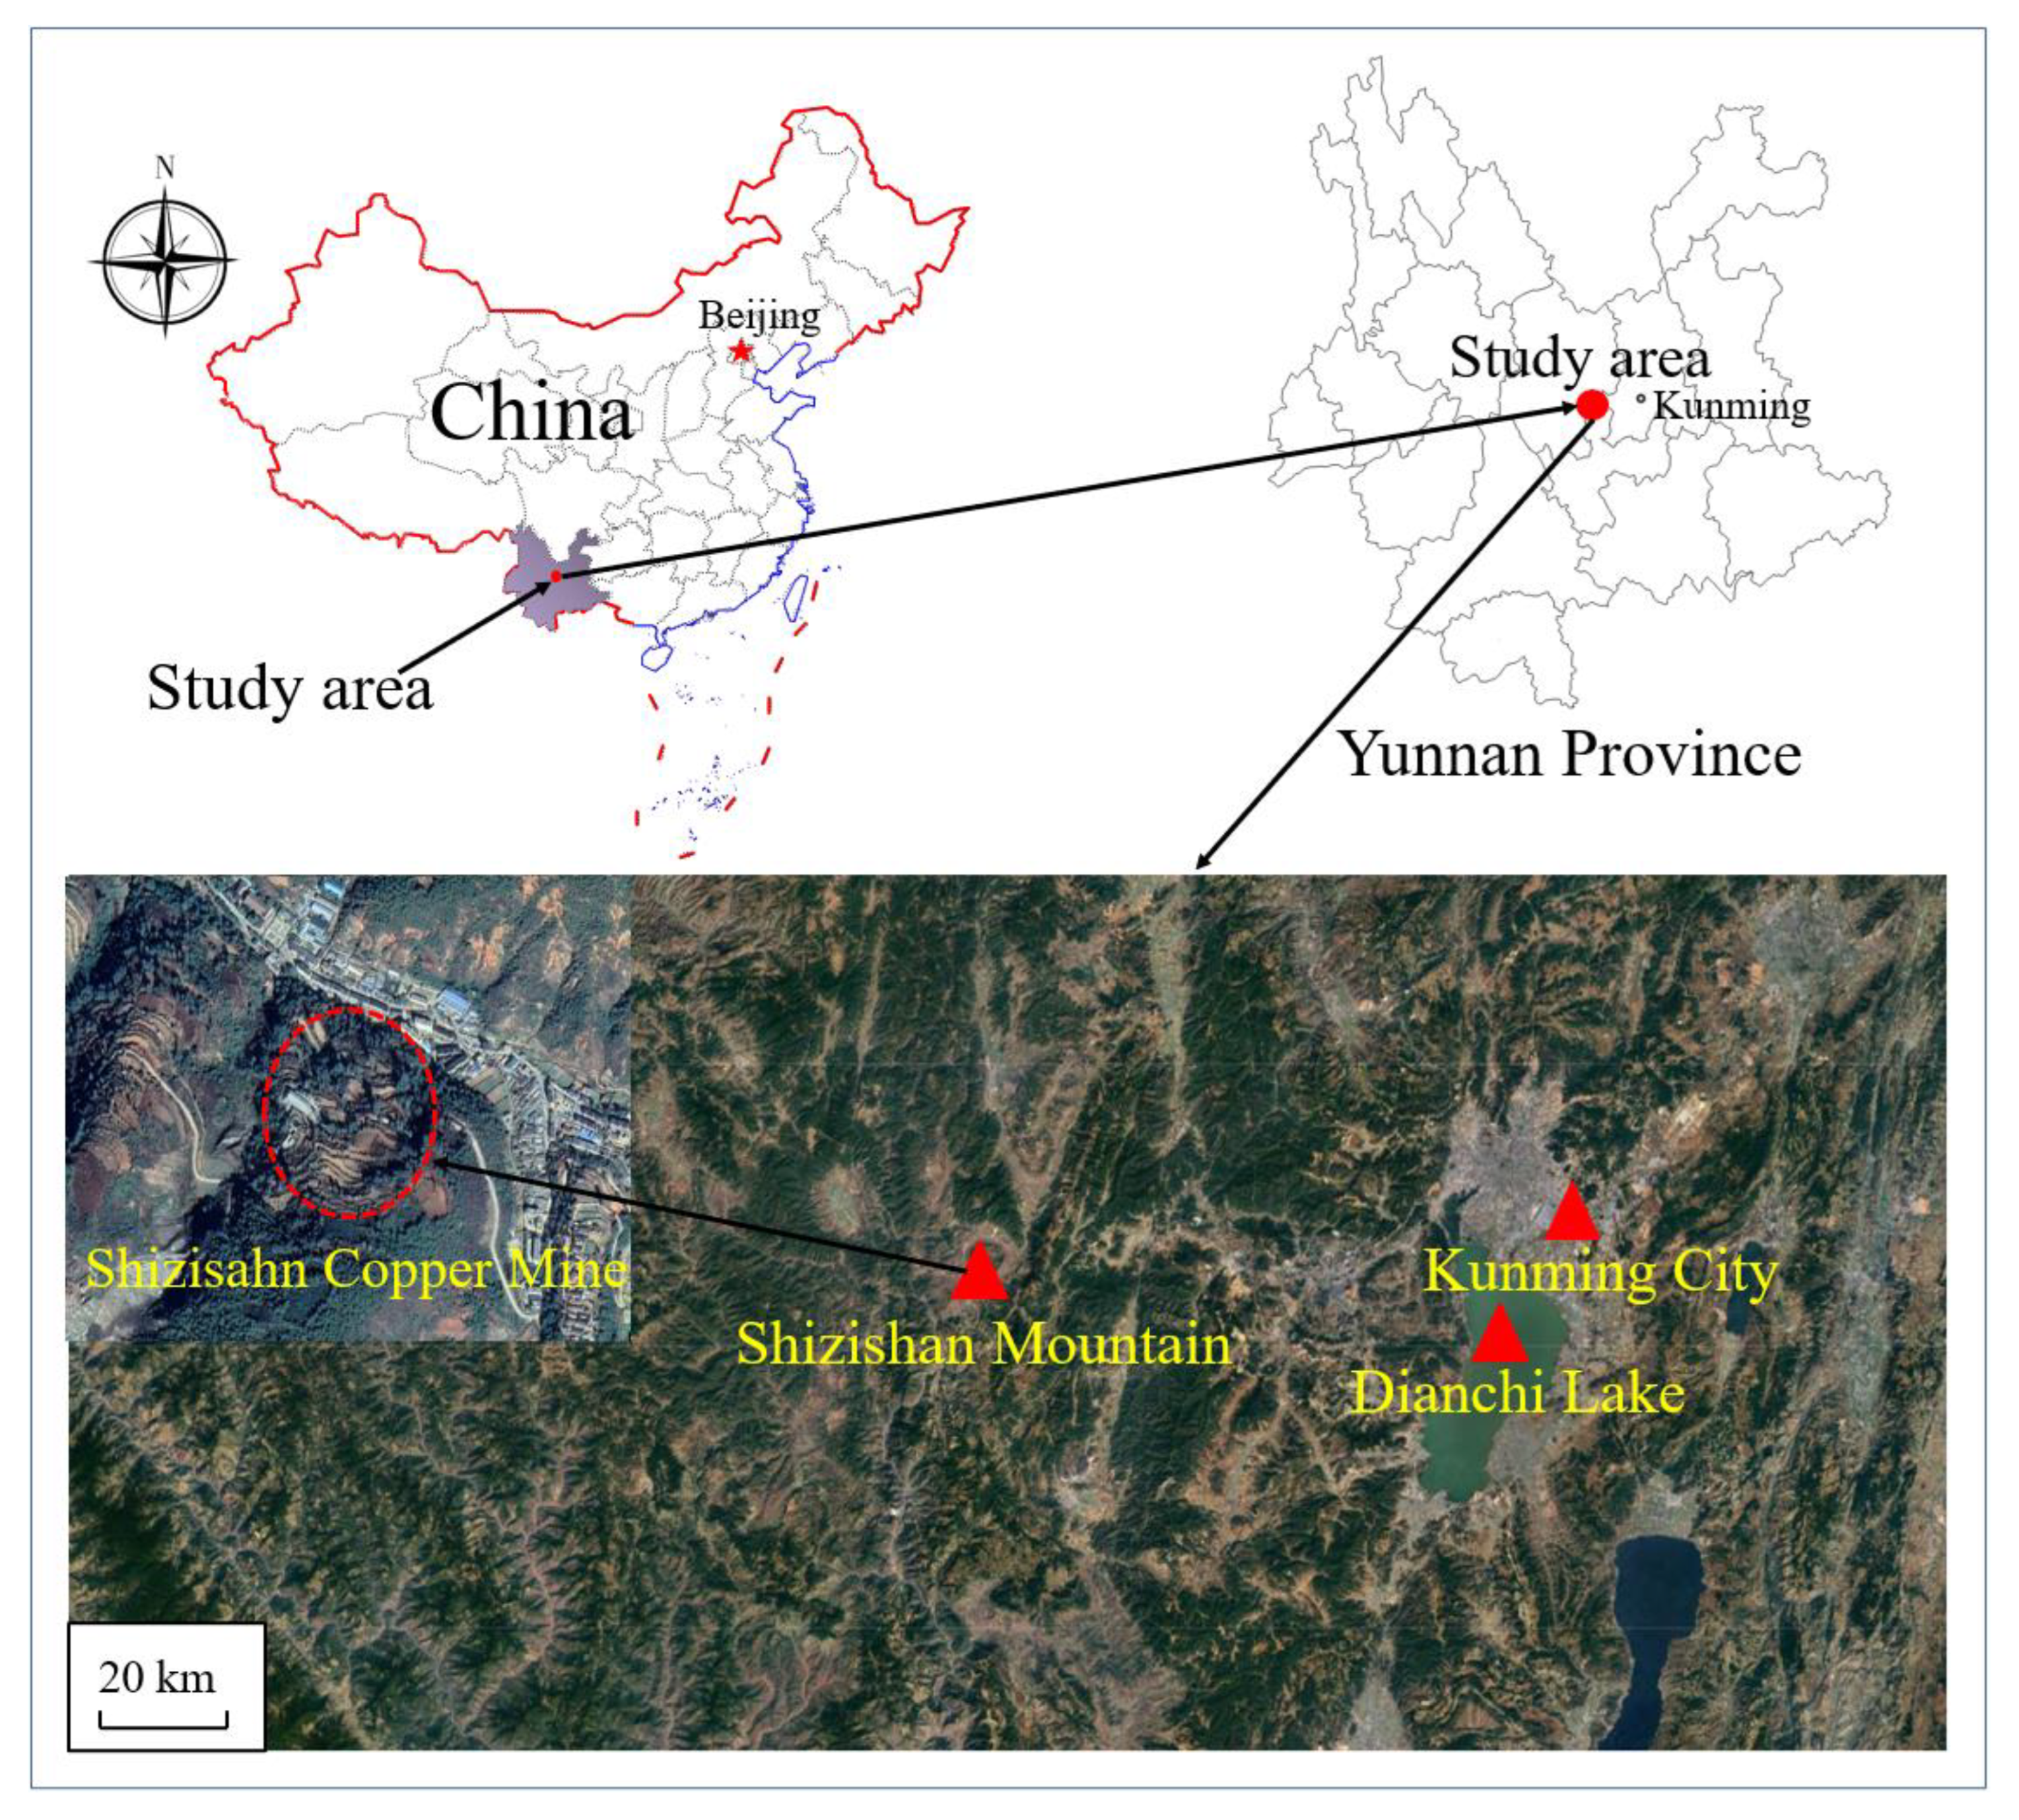
:1. Introduction
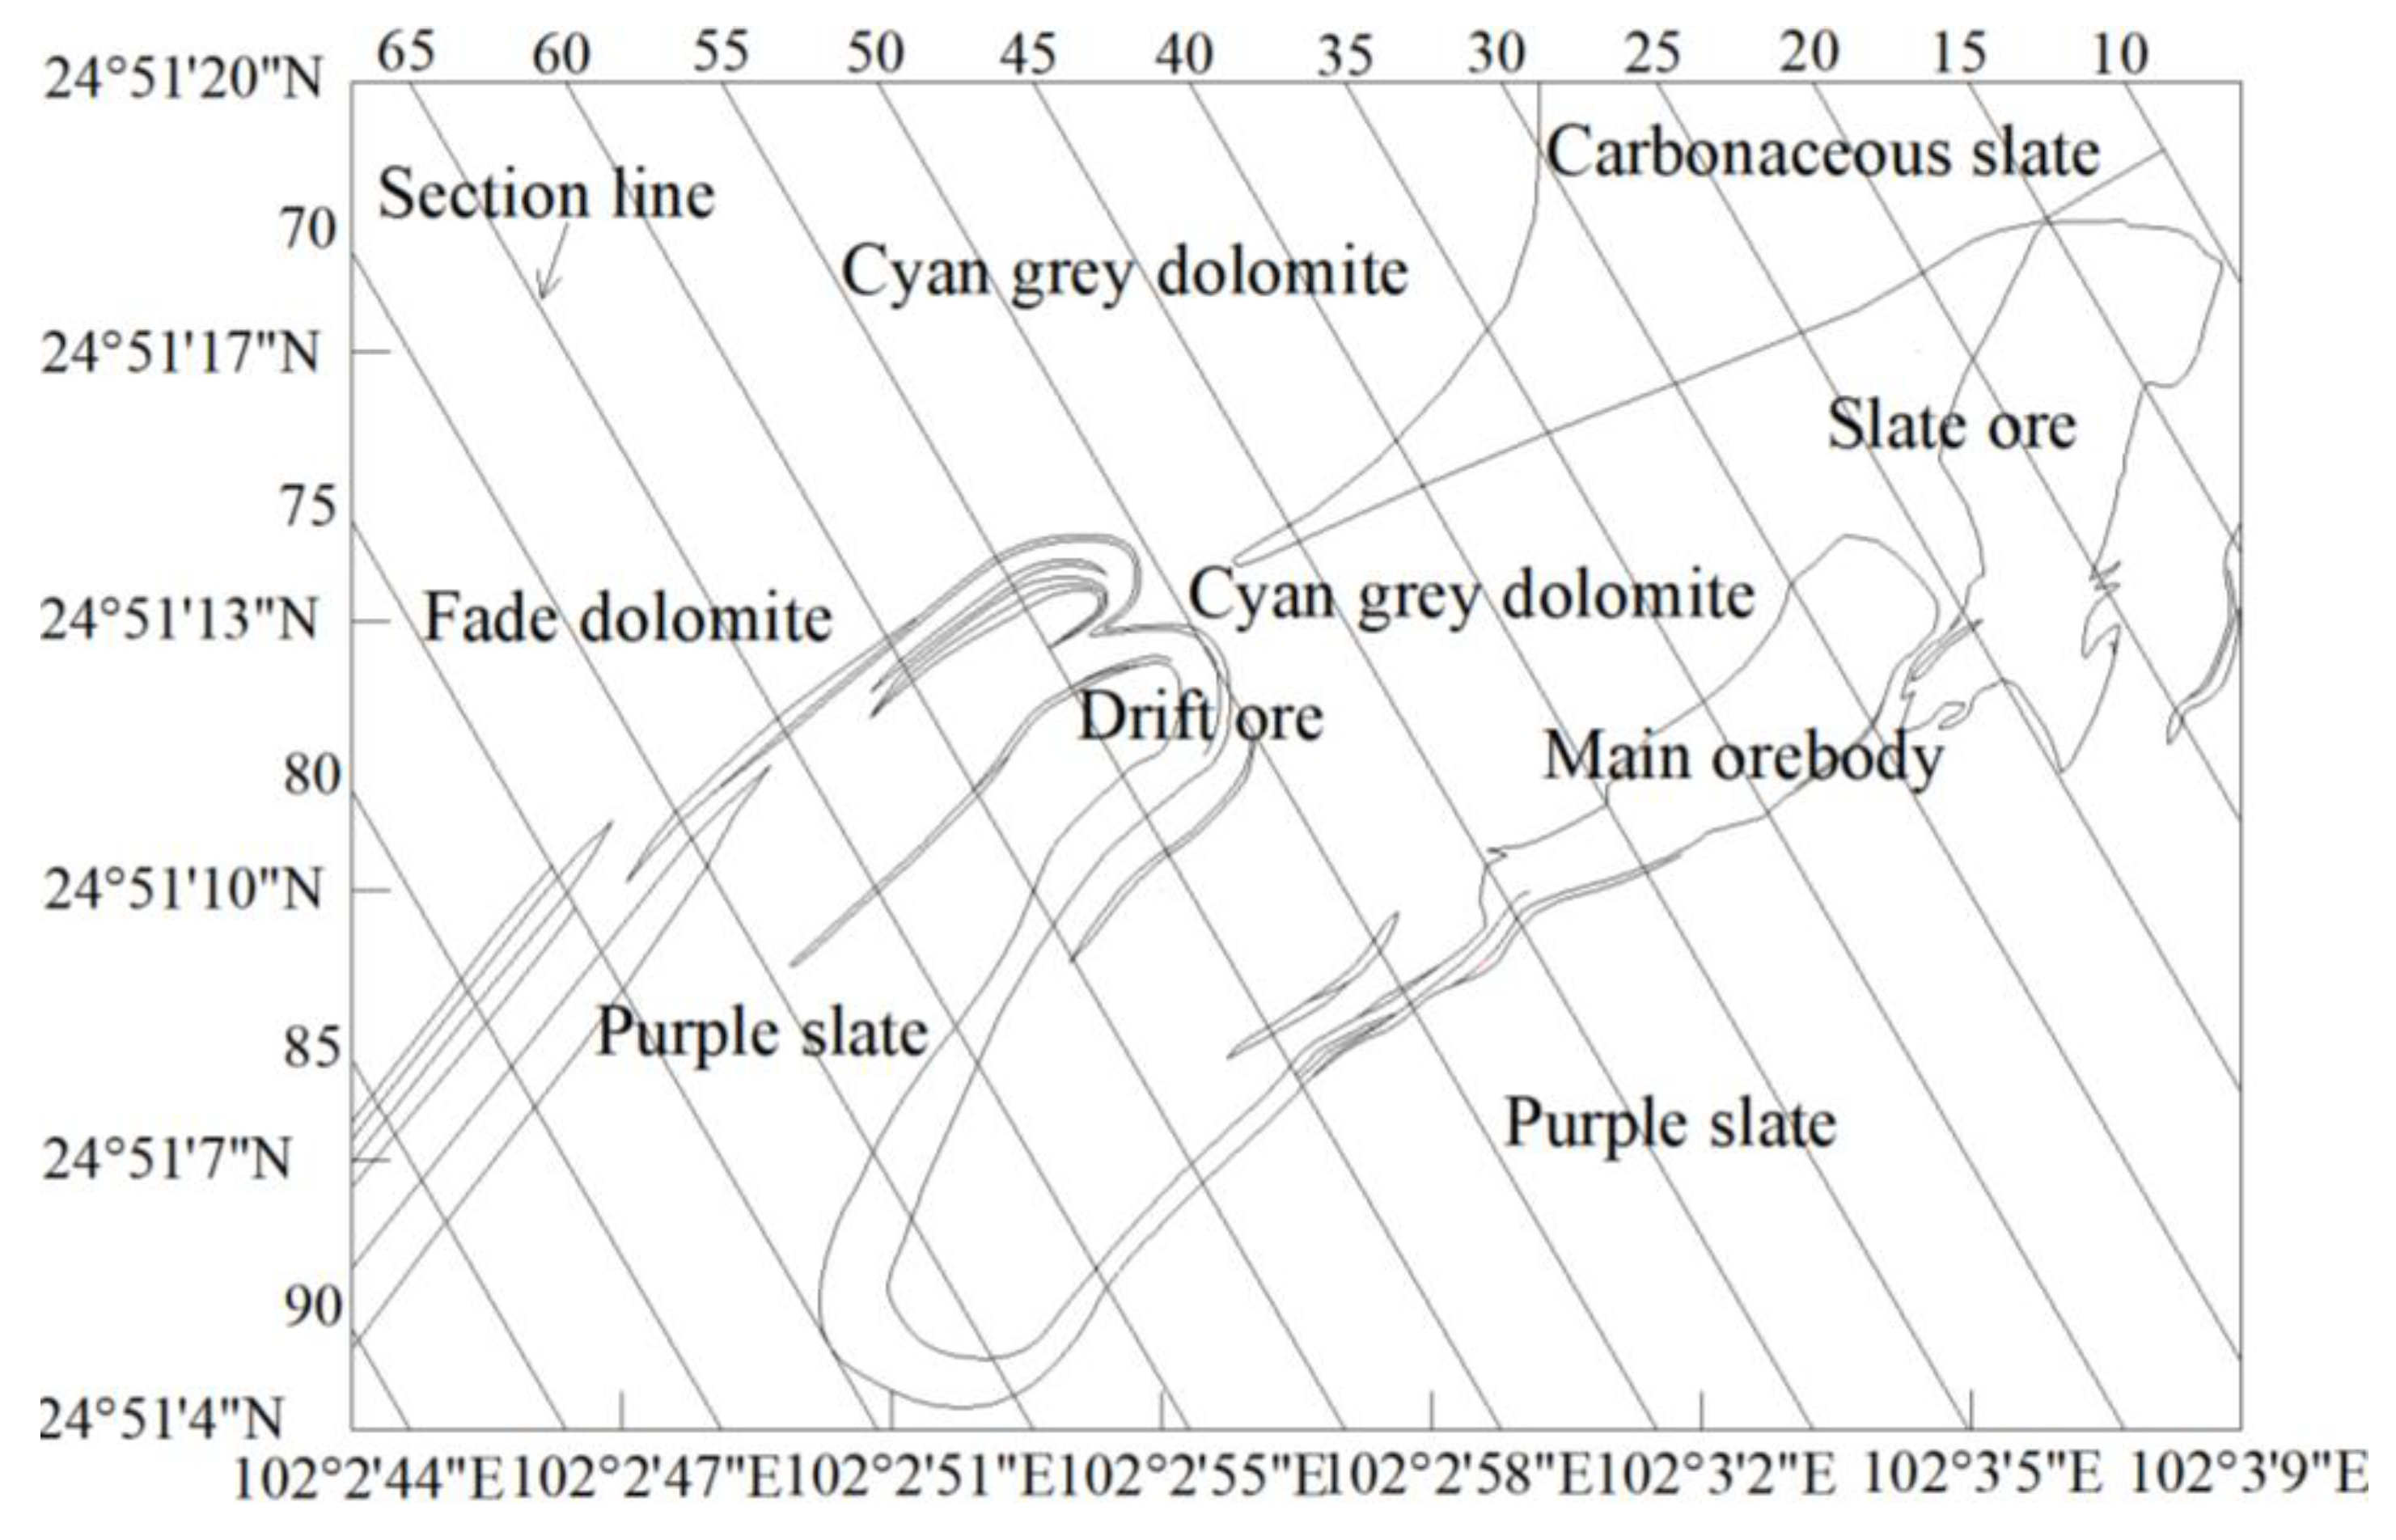
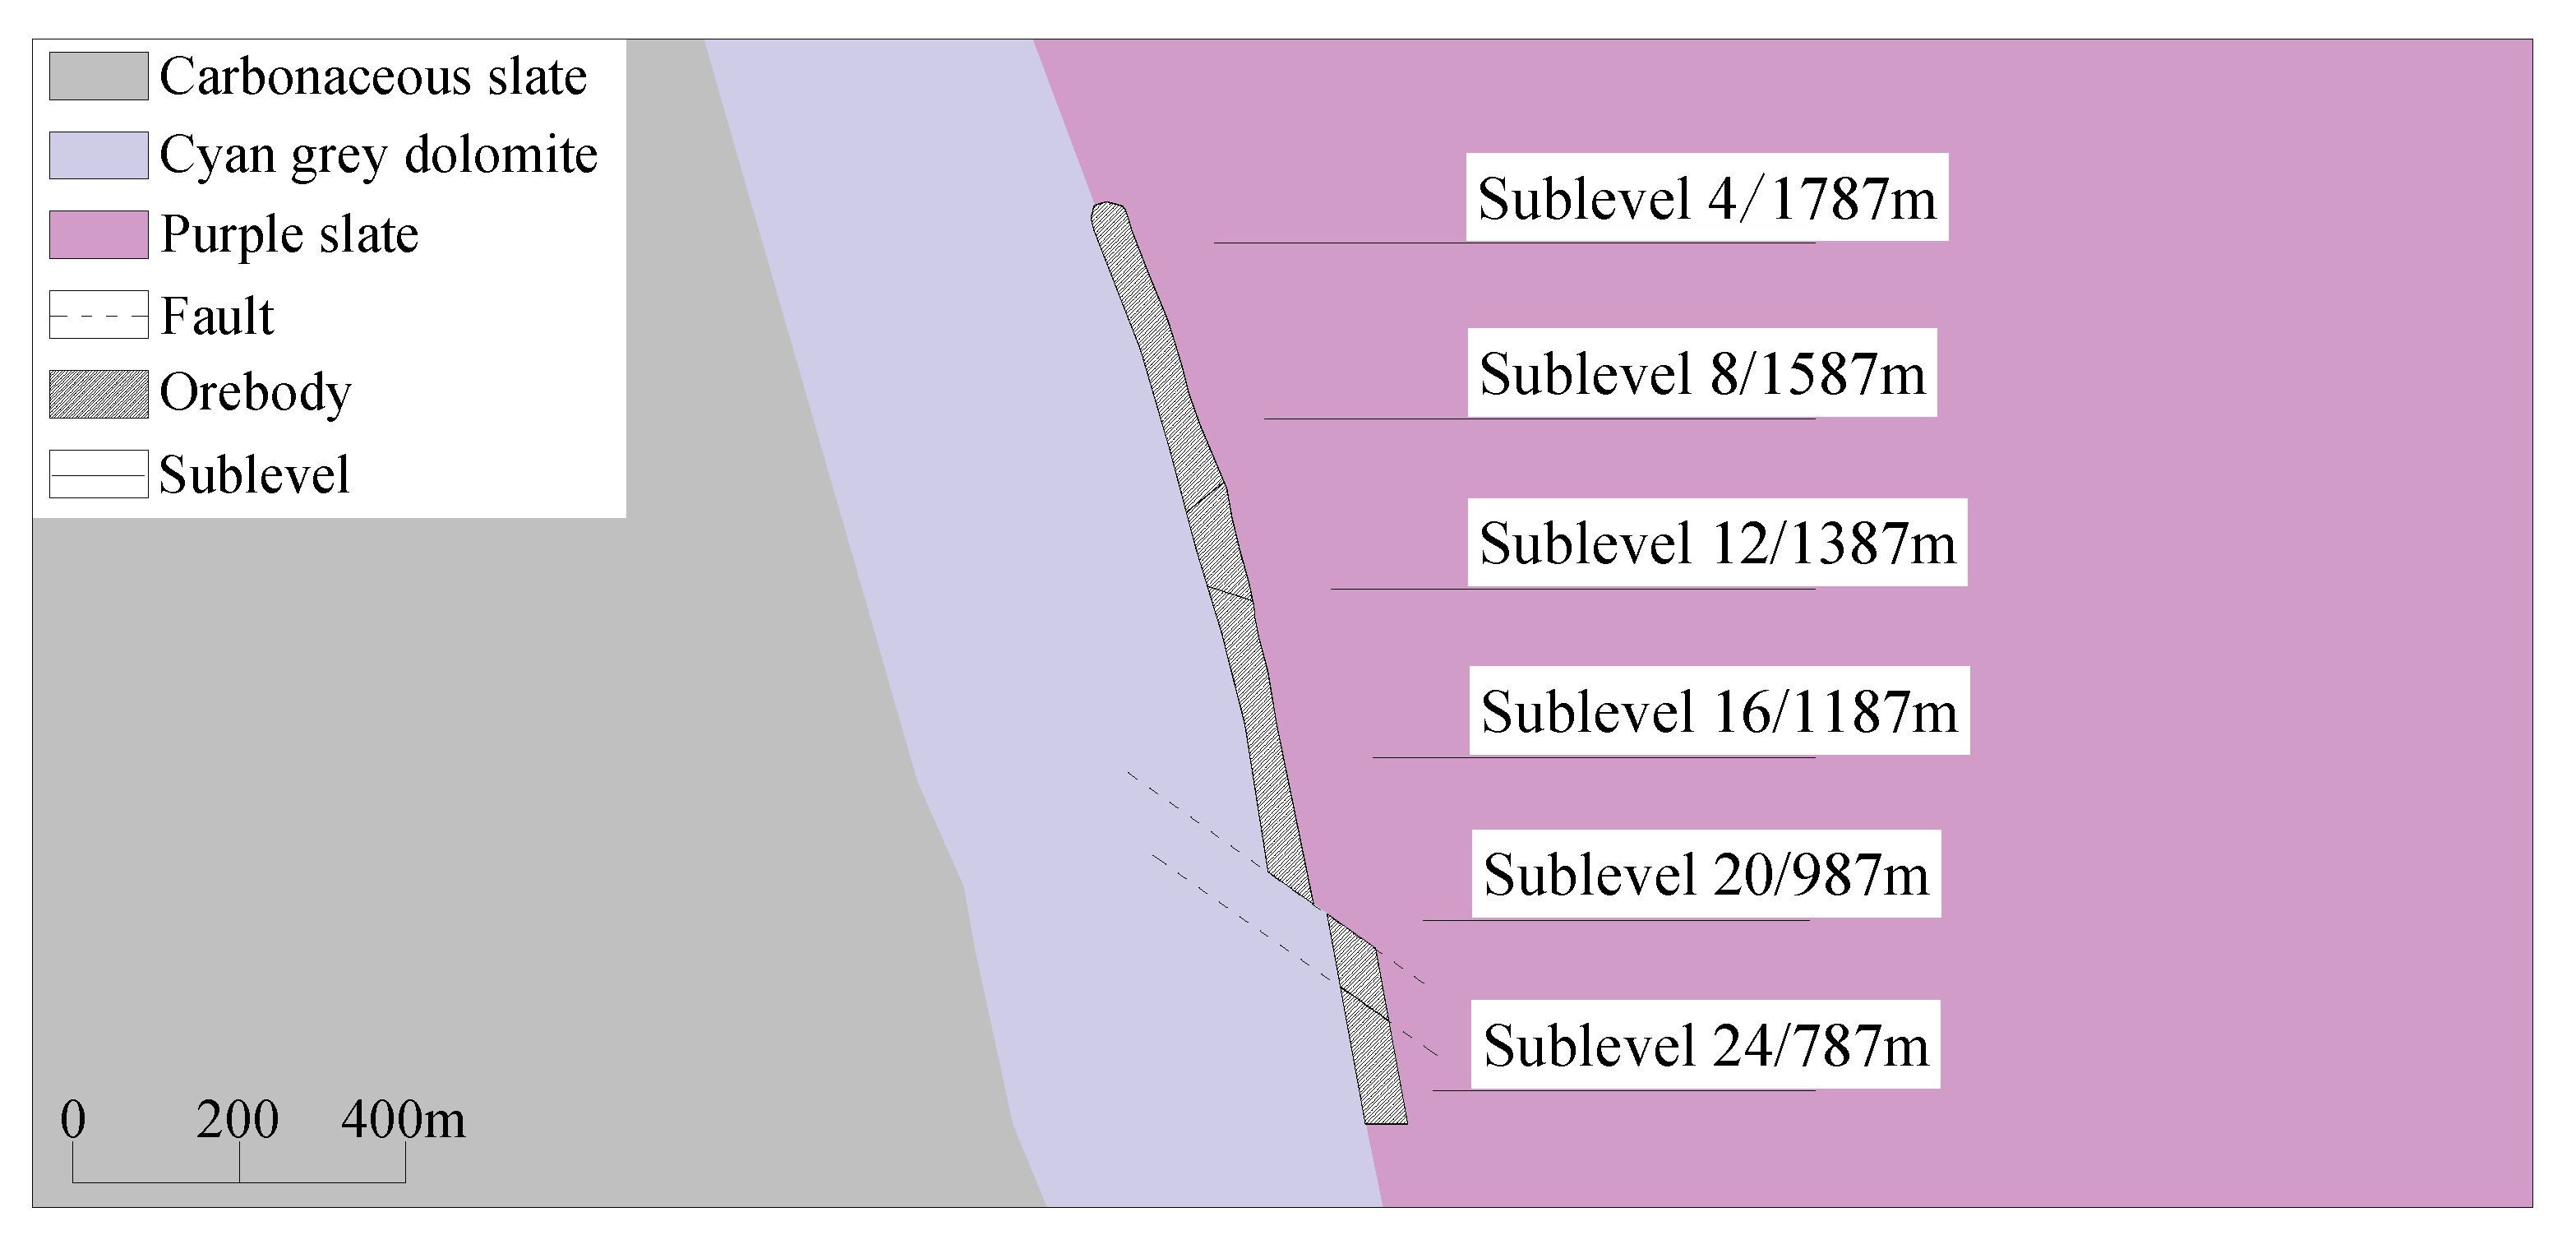
2. Engineering Geology of the Mining Area
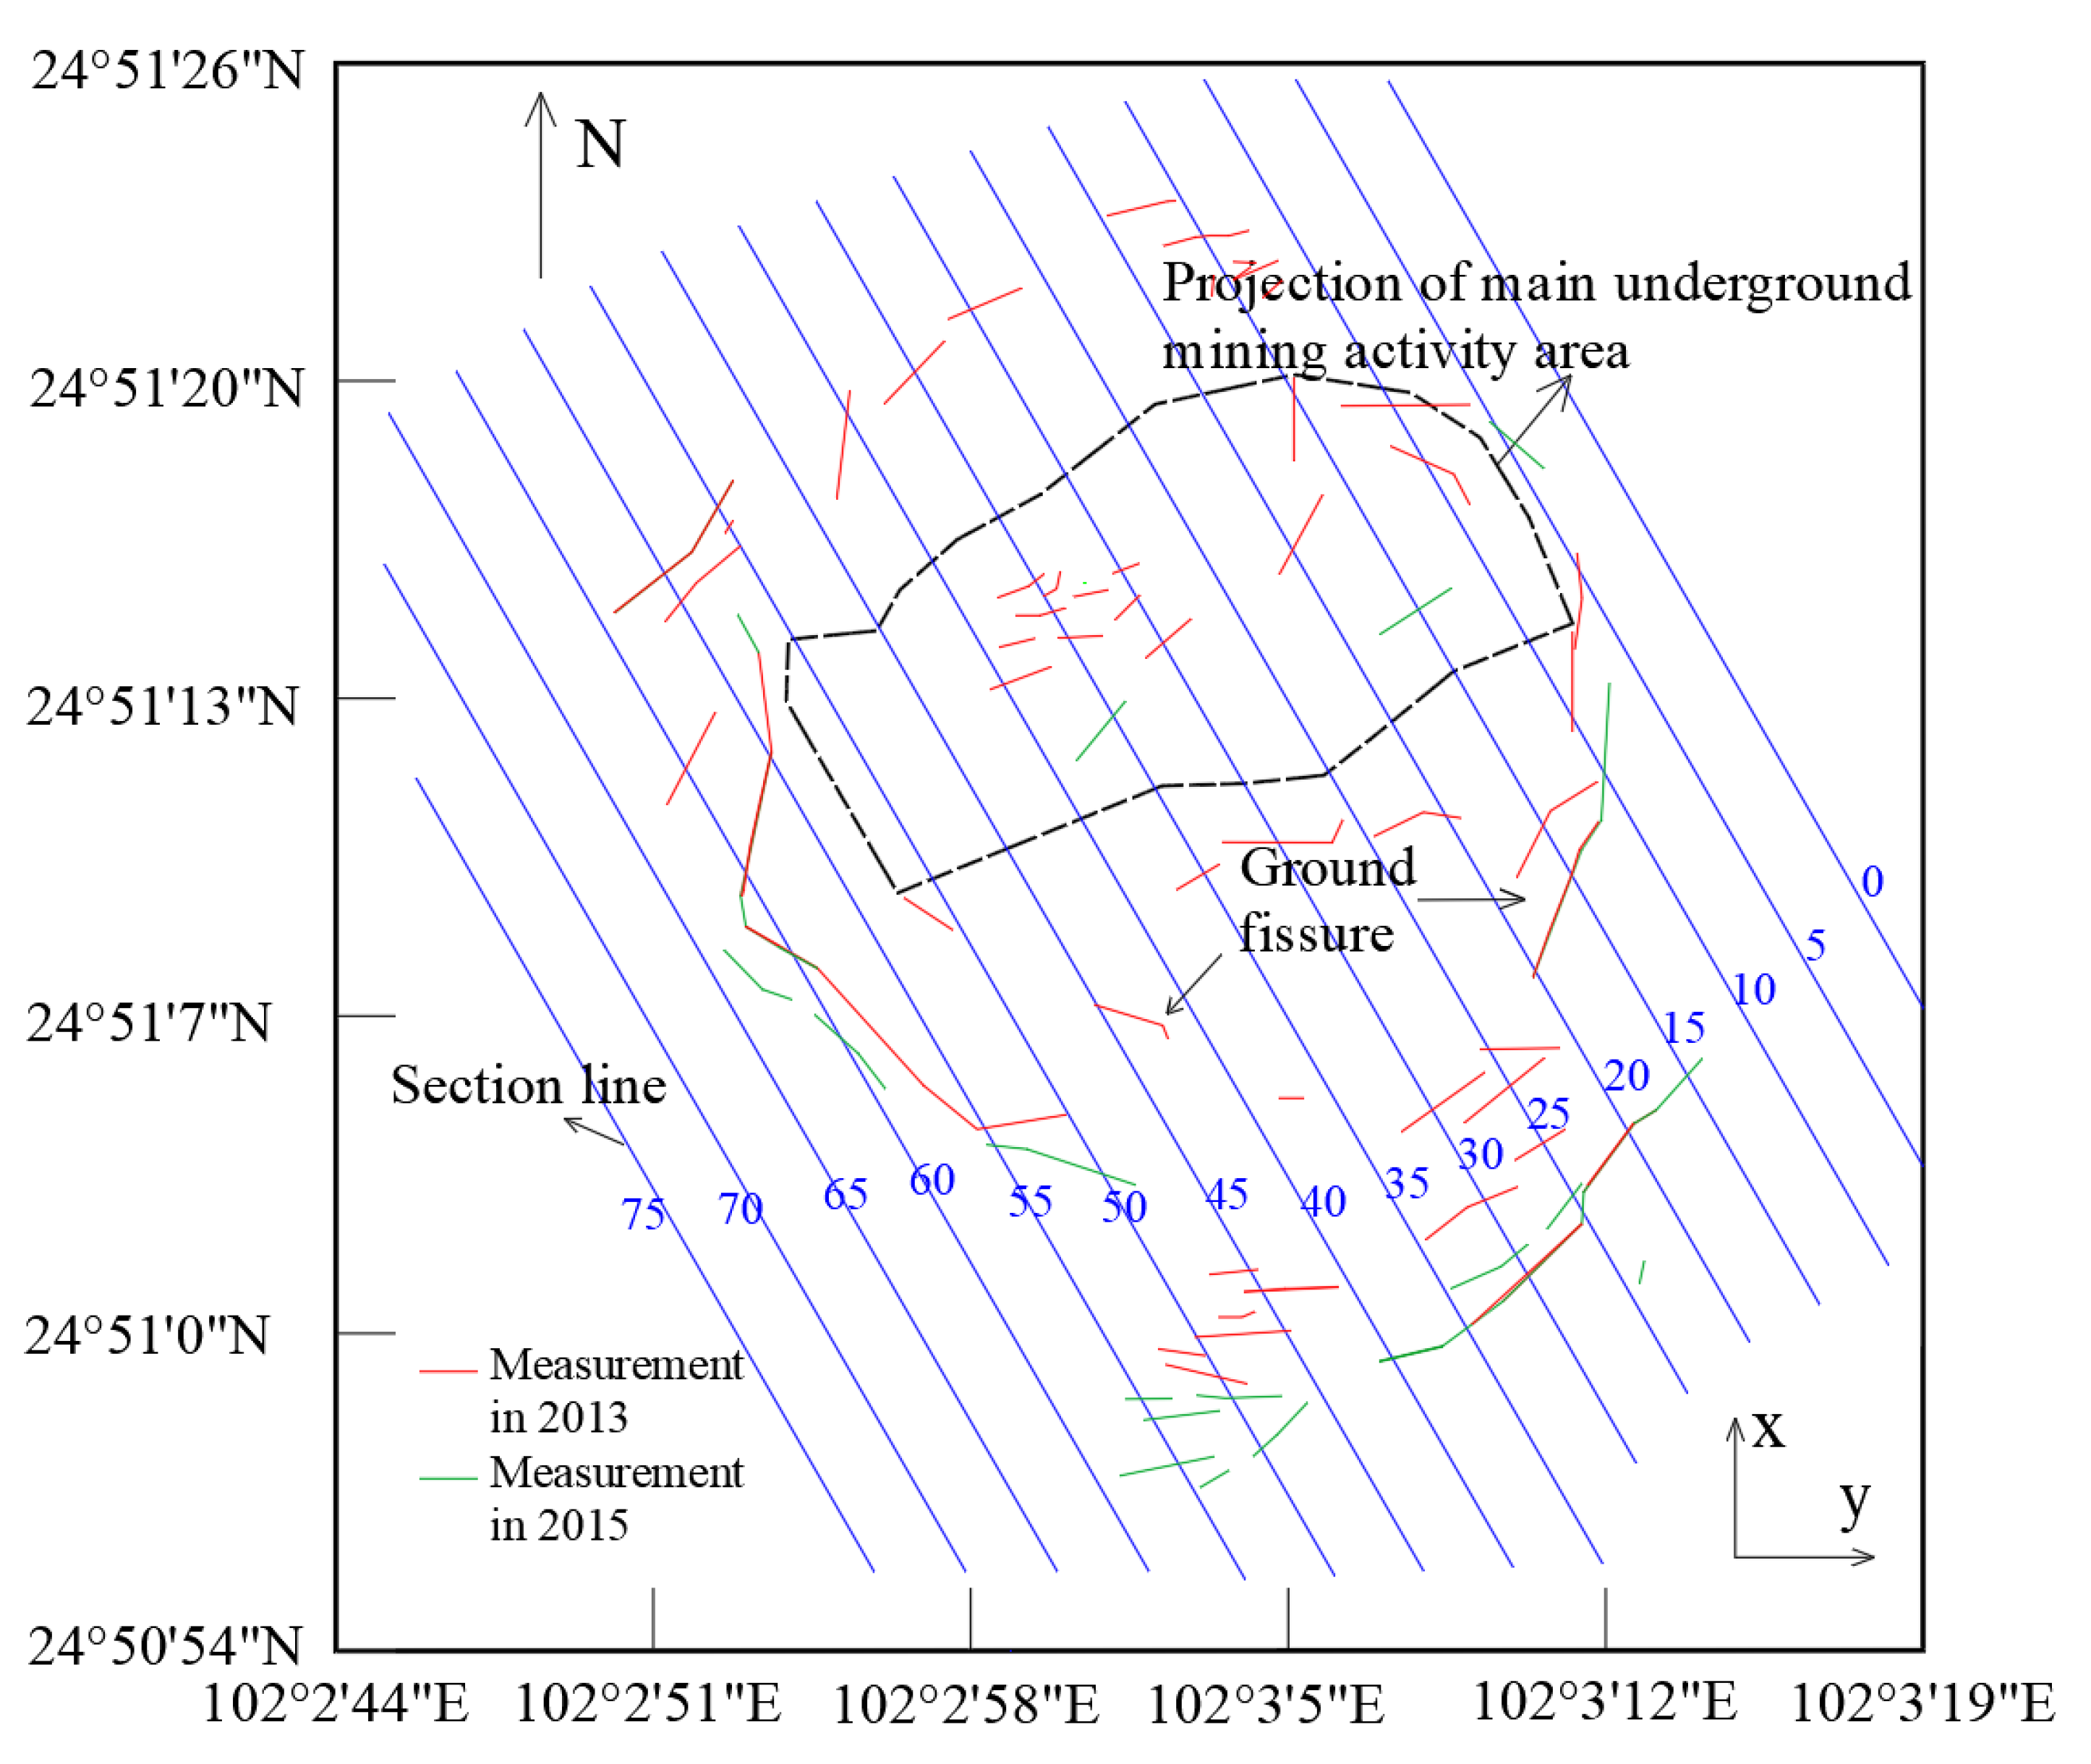
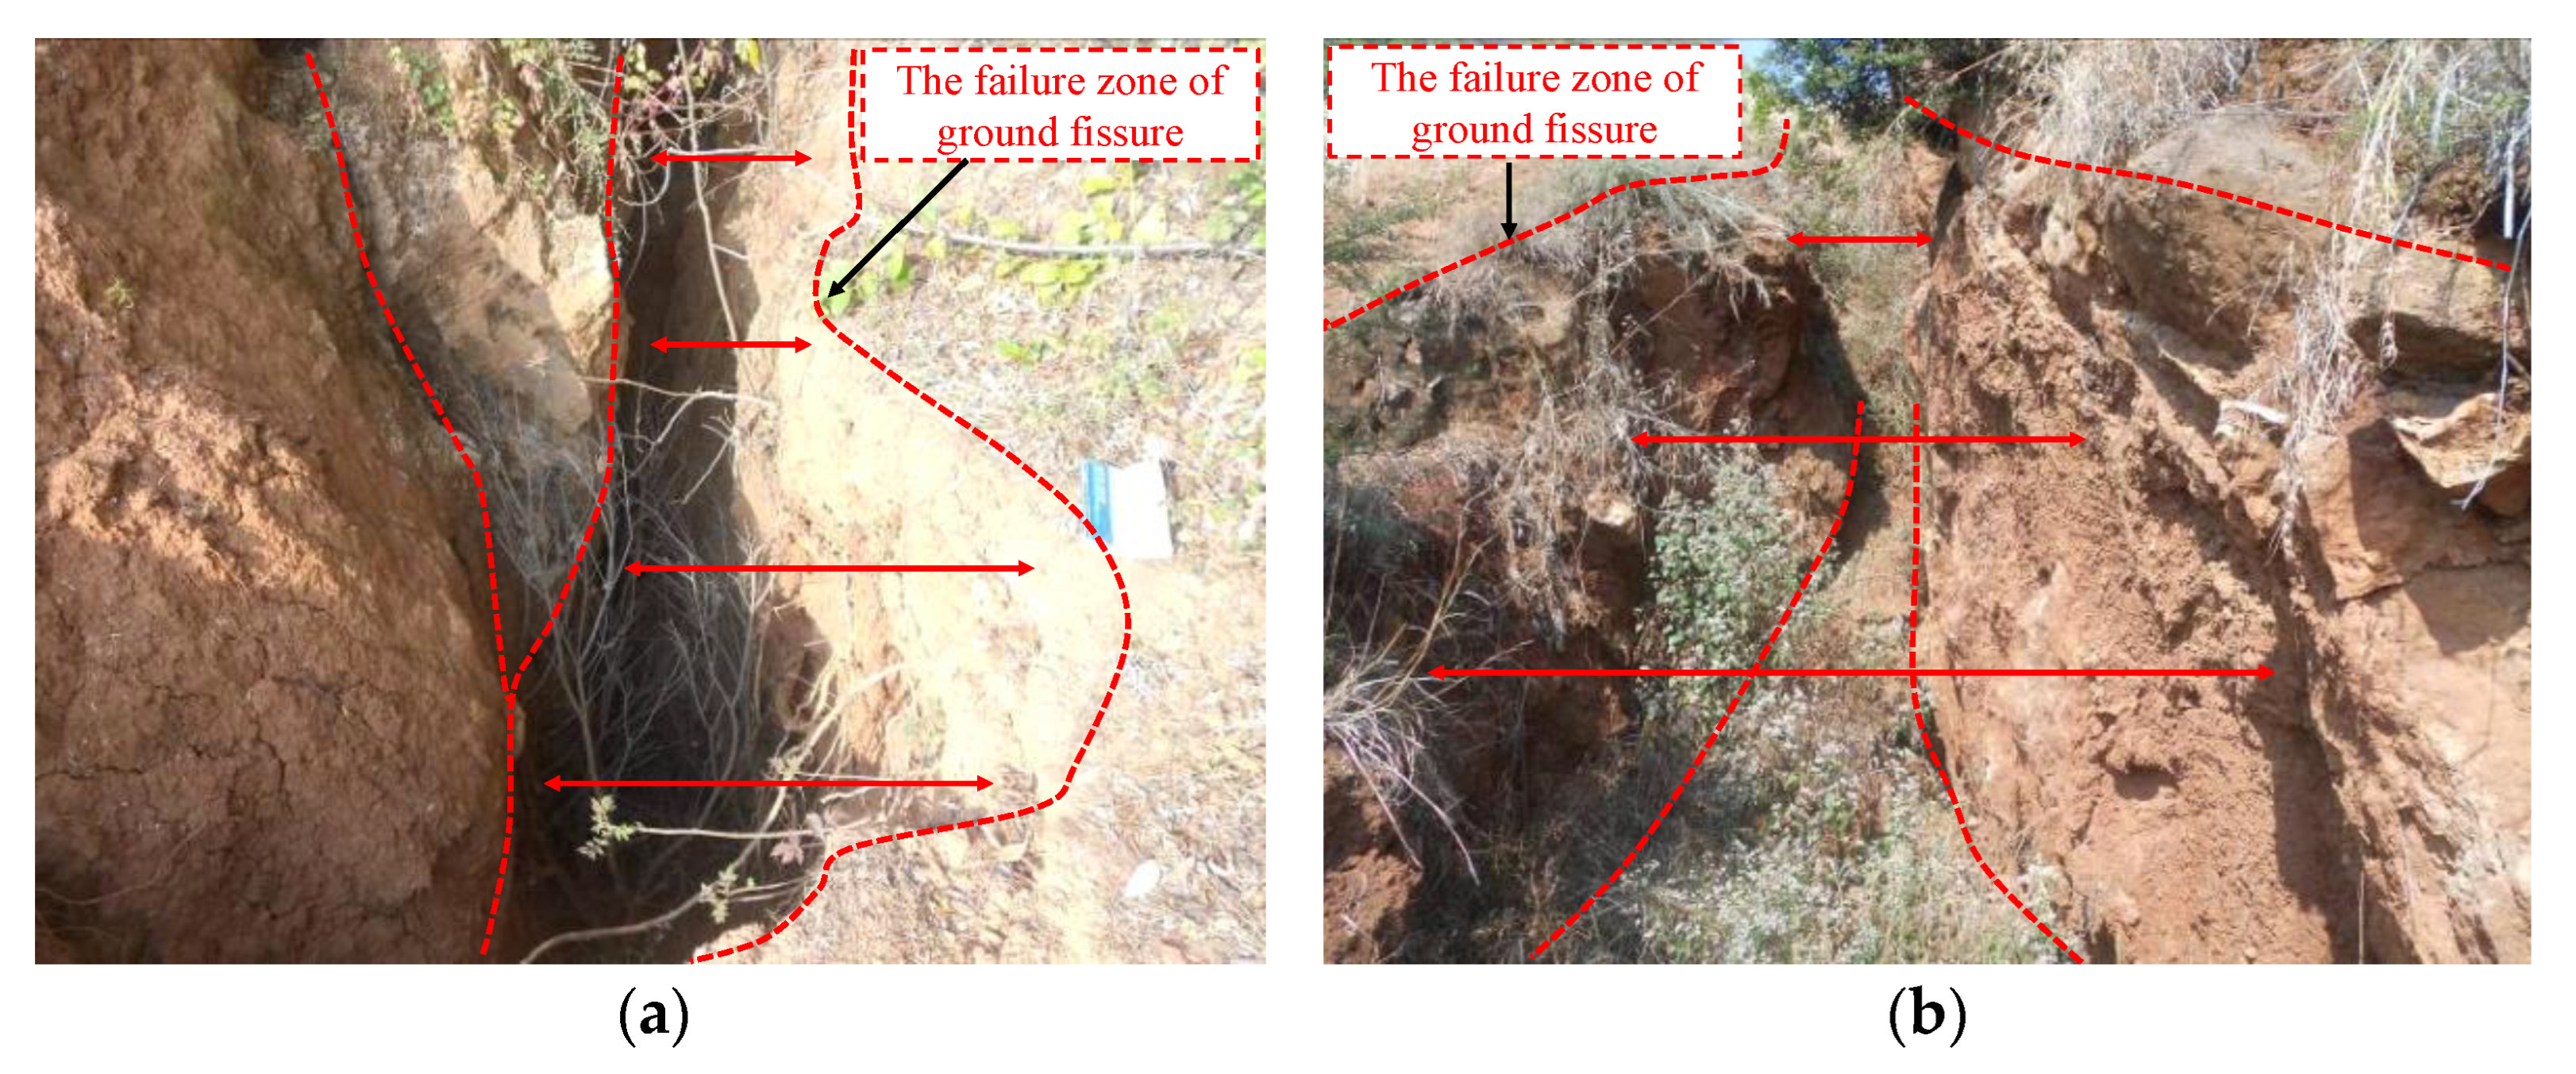
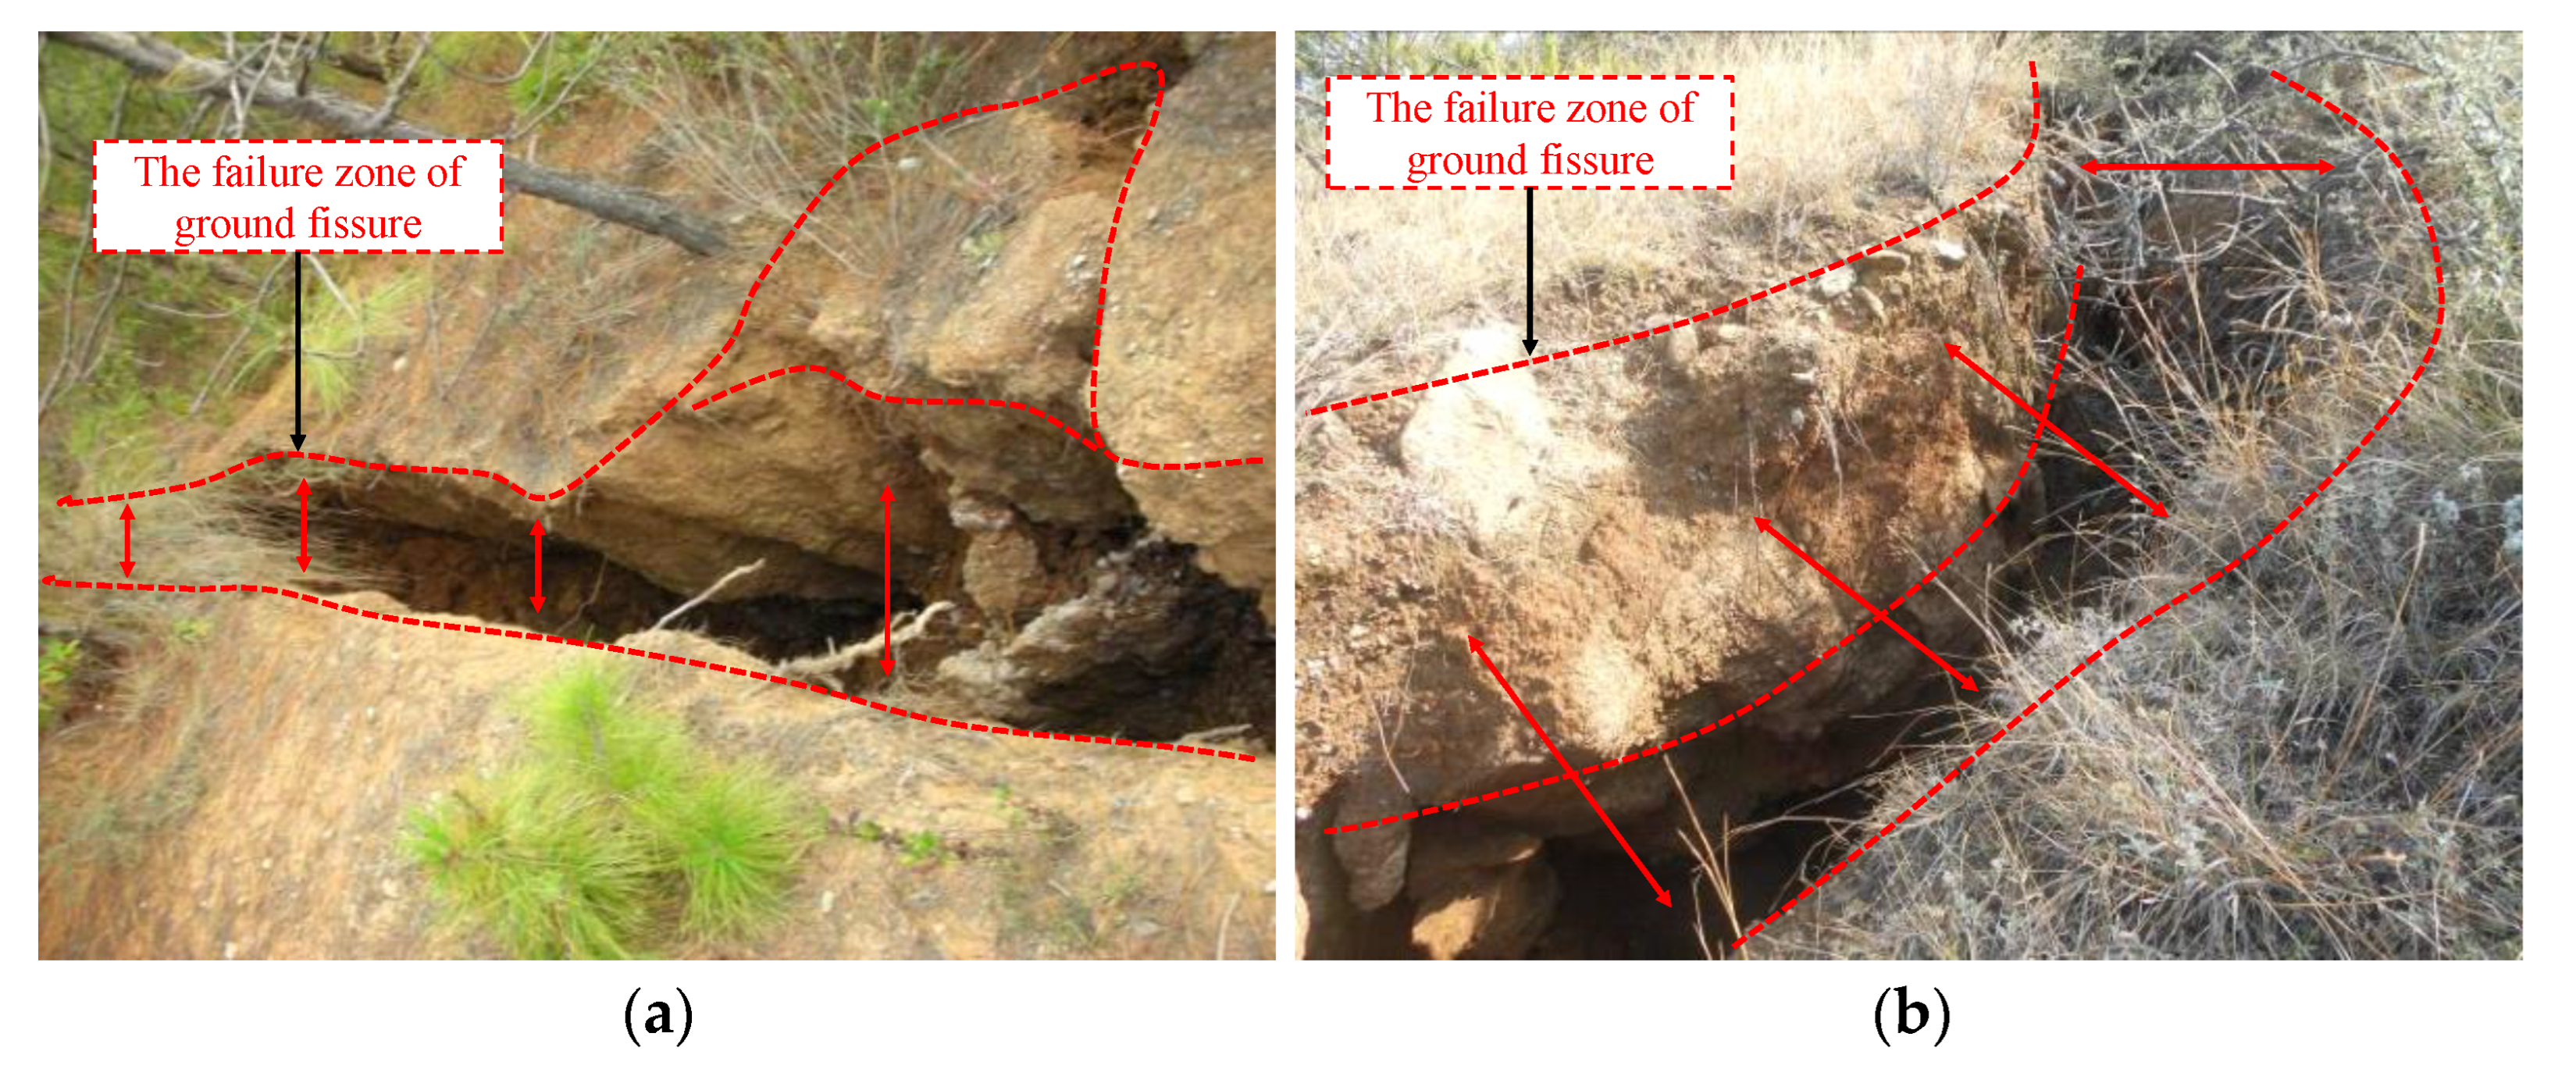
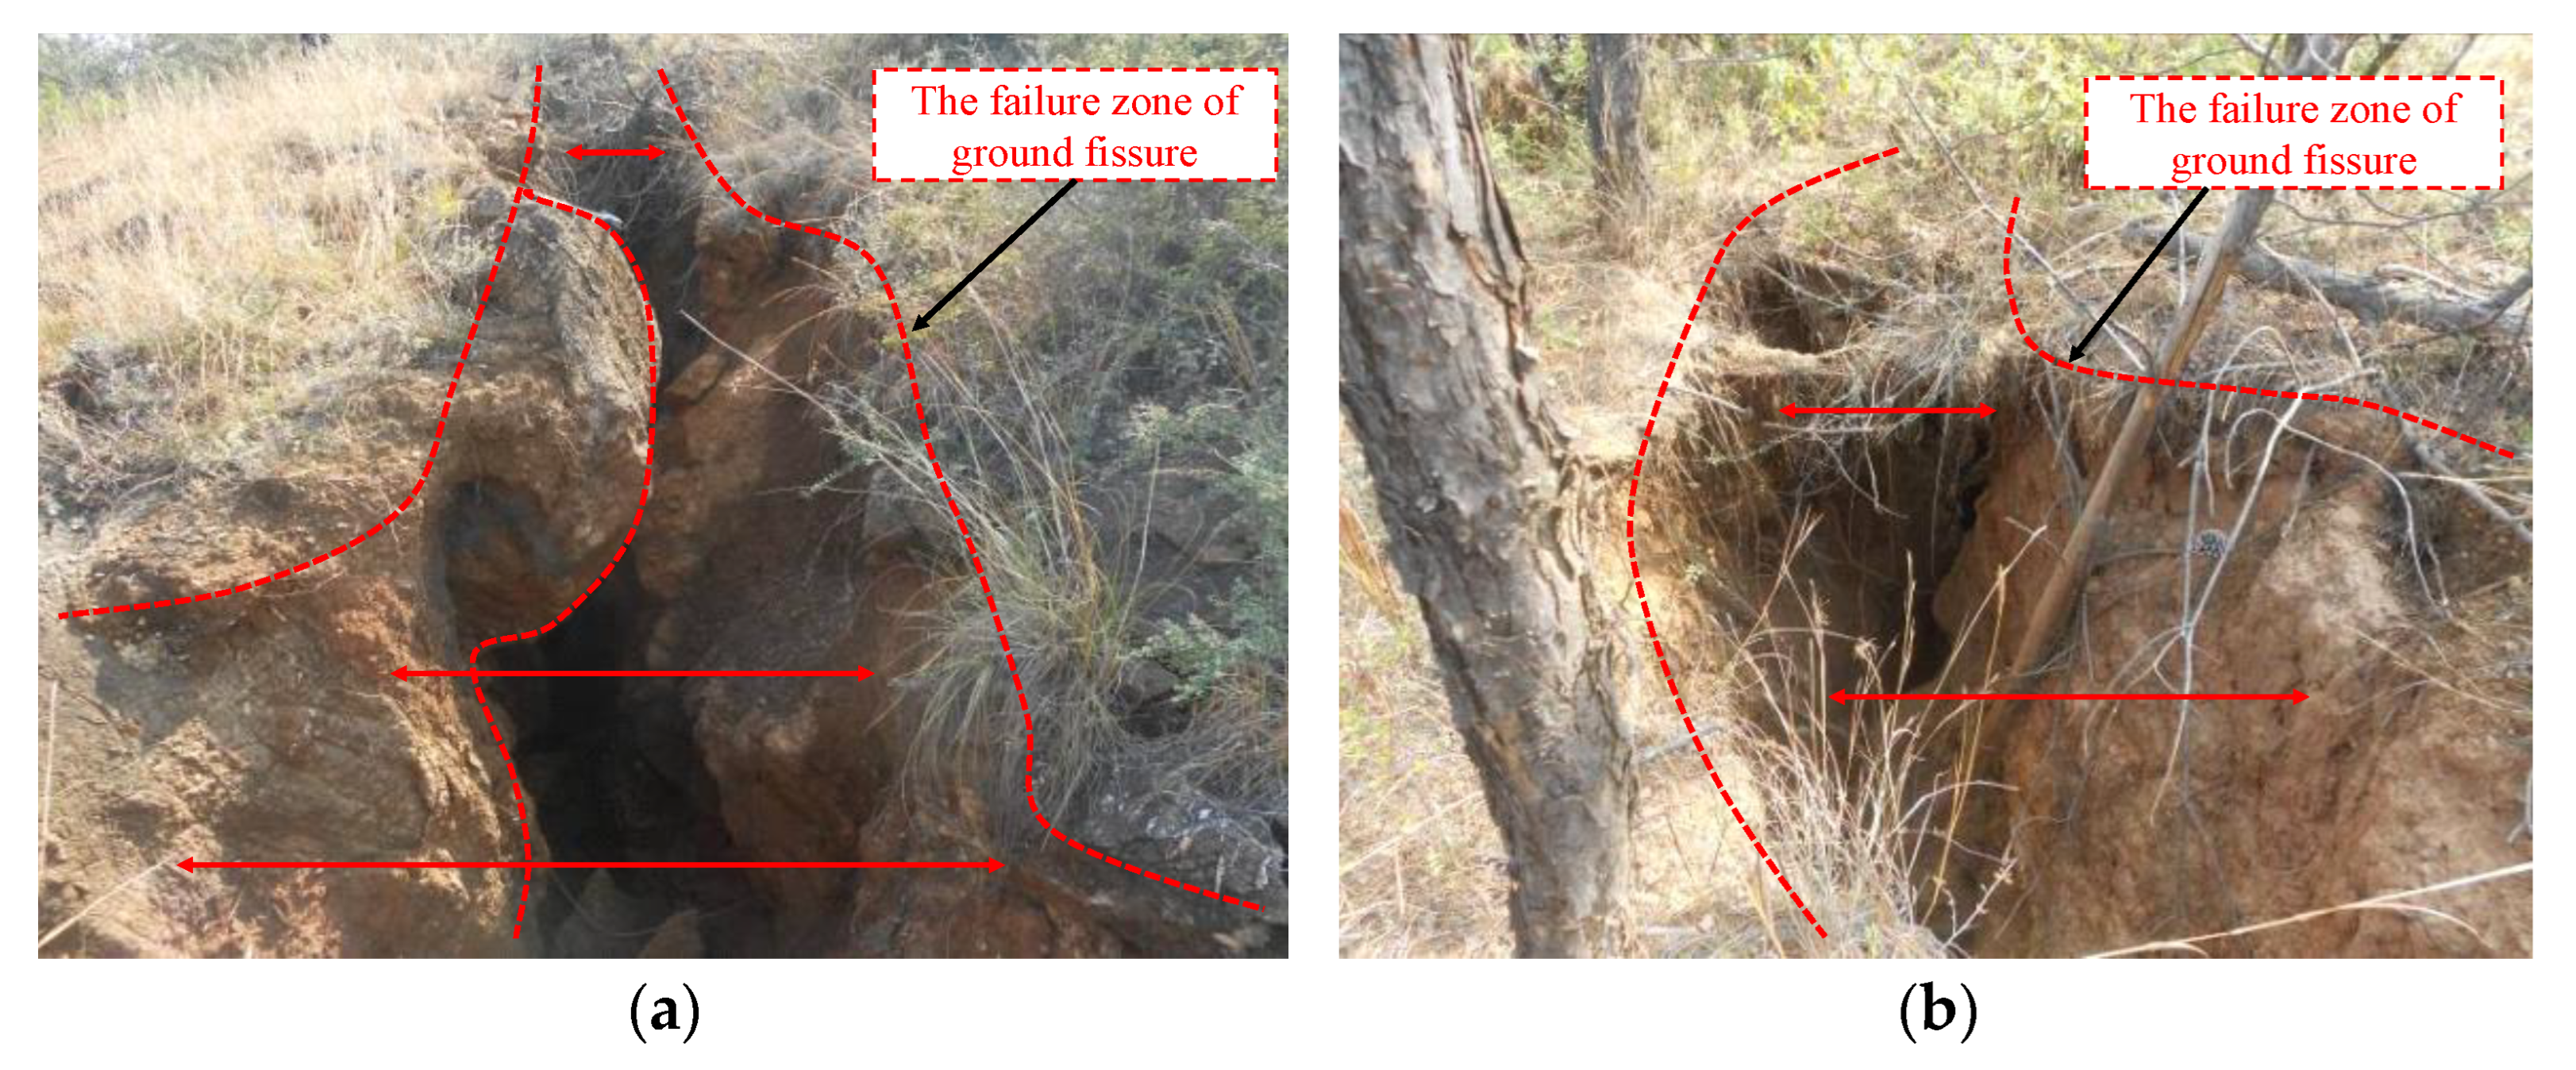
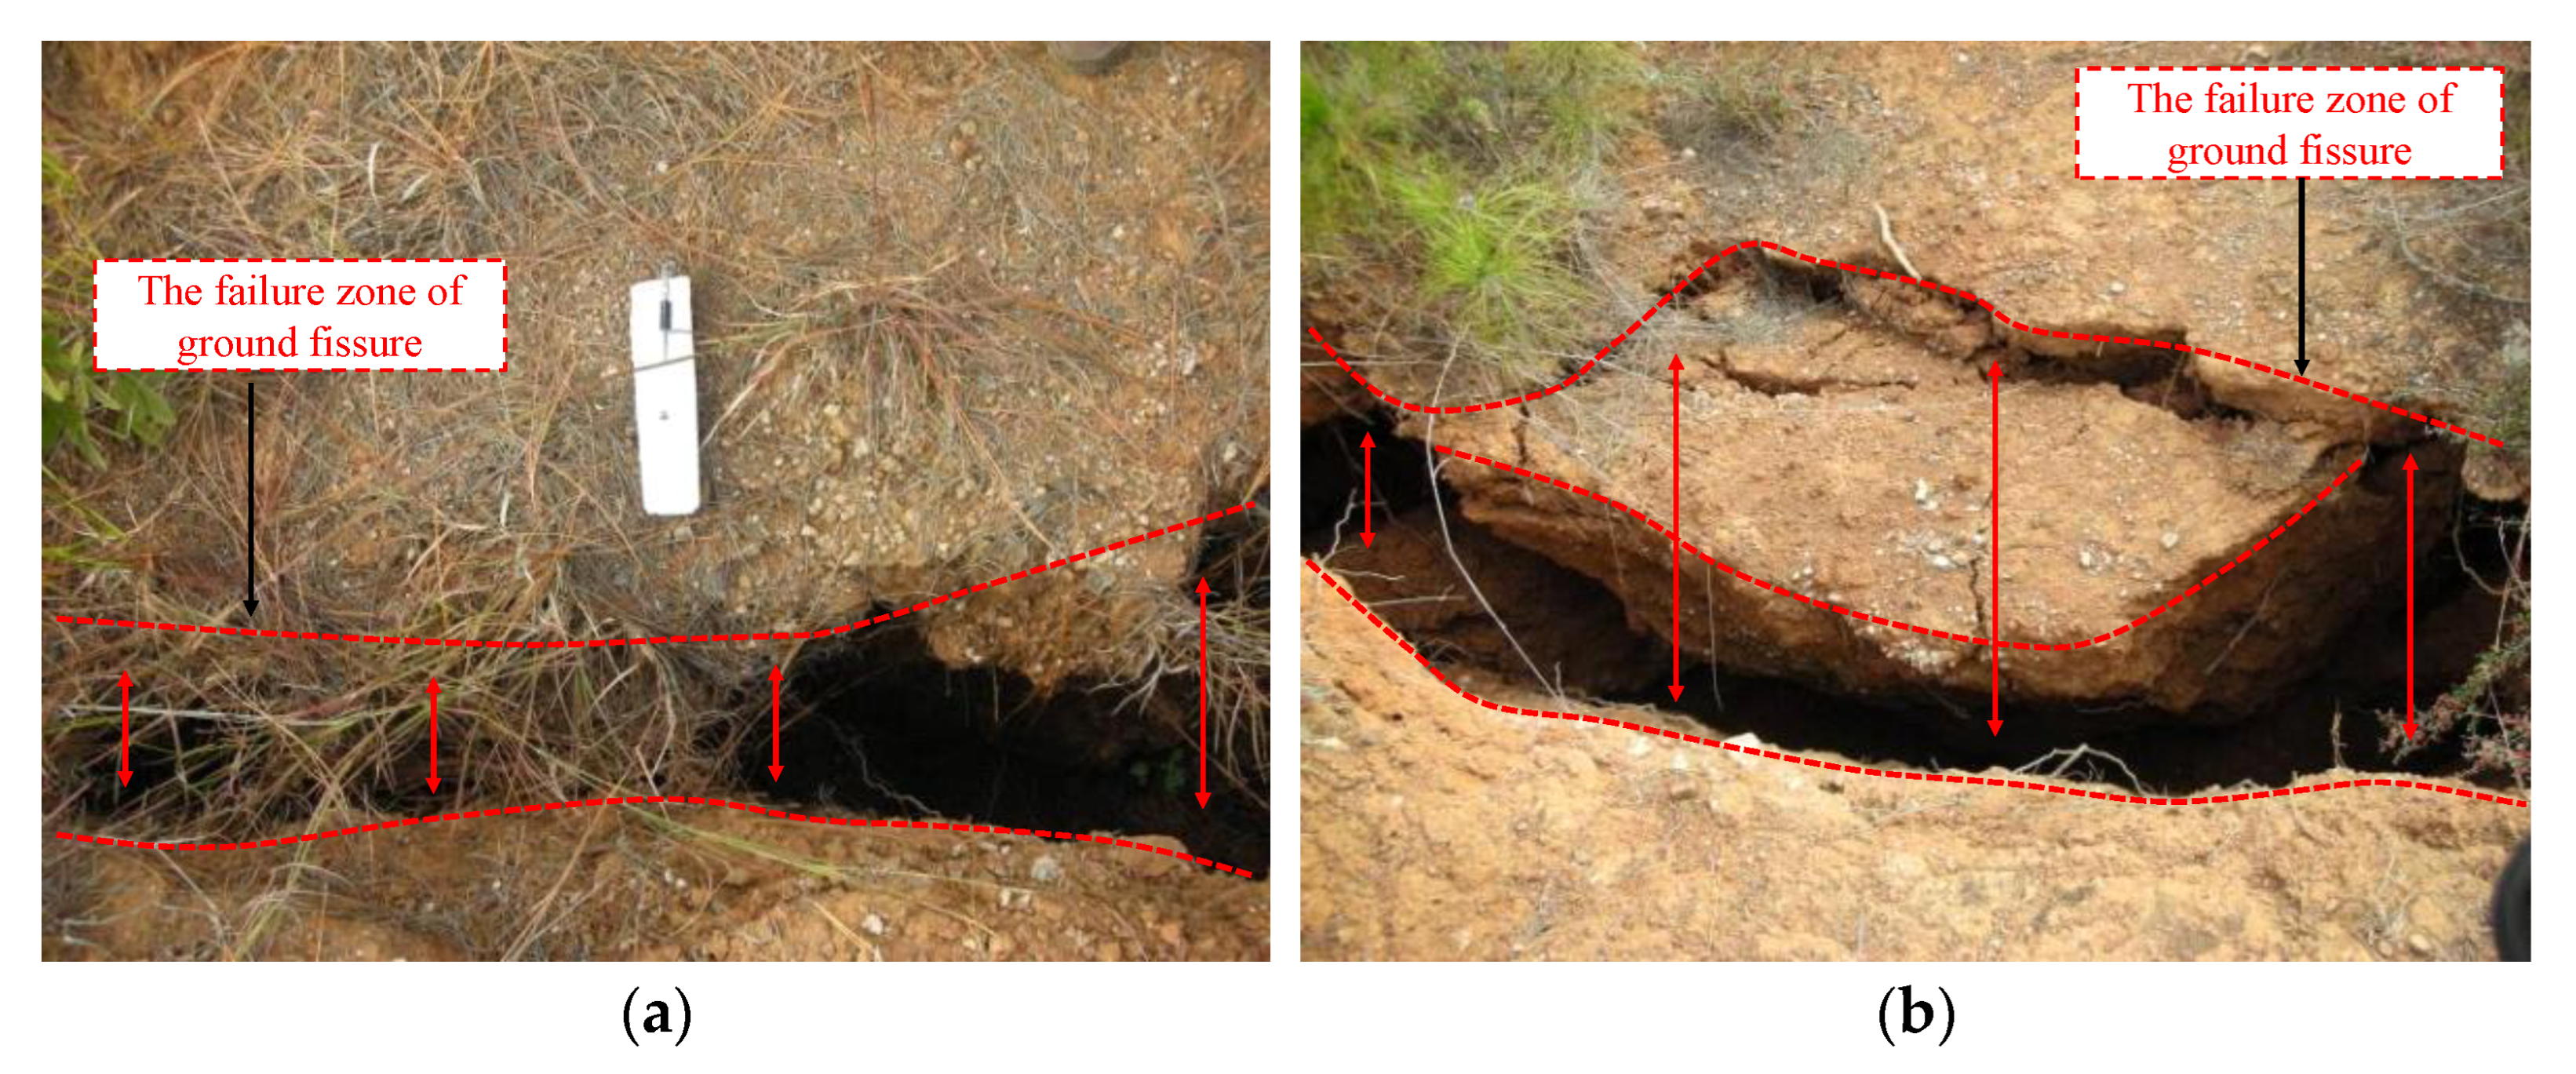
3. The Change Situation of Ground Surface Fissures Disasters in Mining Areas
4. Monitoring of Surface Rock Movement and Analysis of Deformation Characteristics in Mining Area
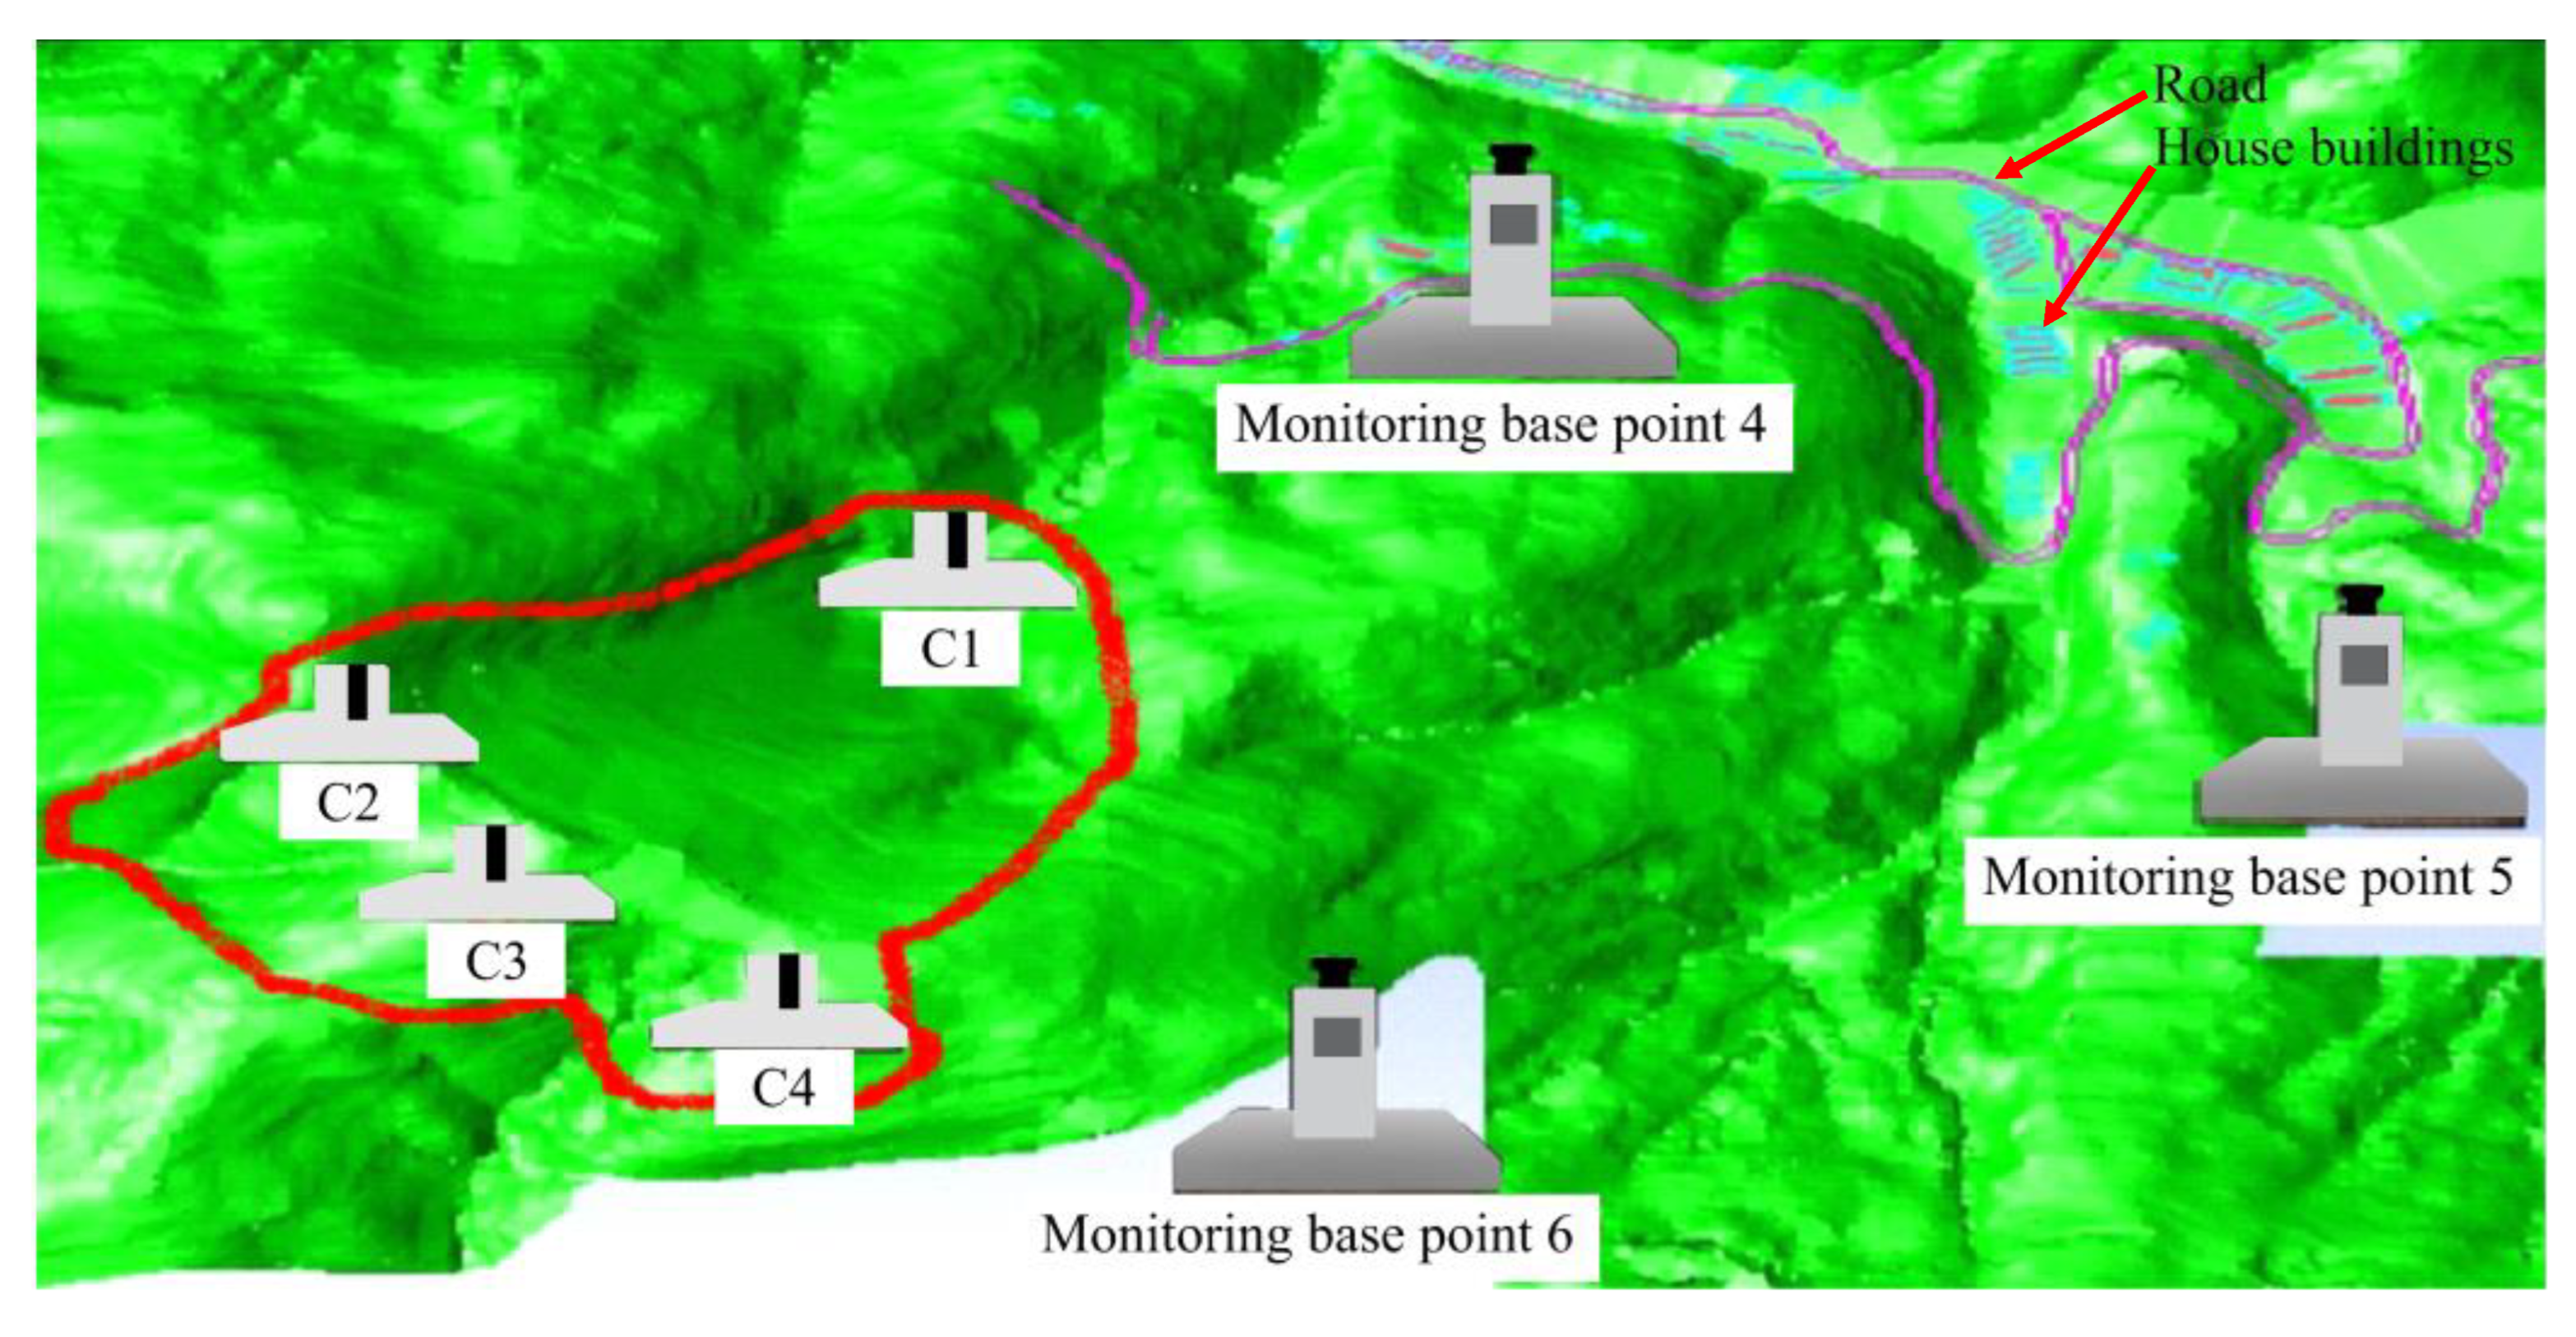
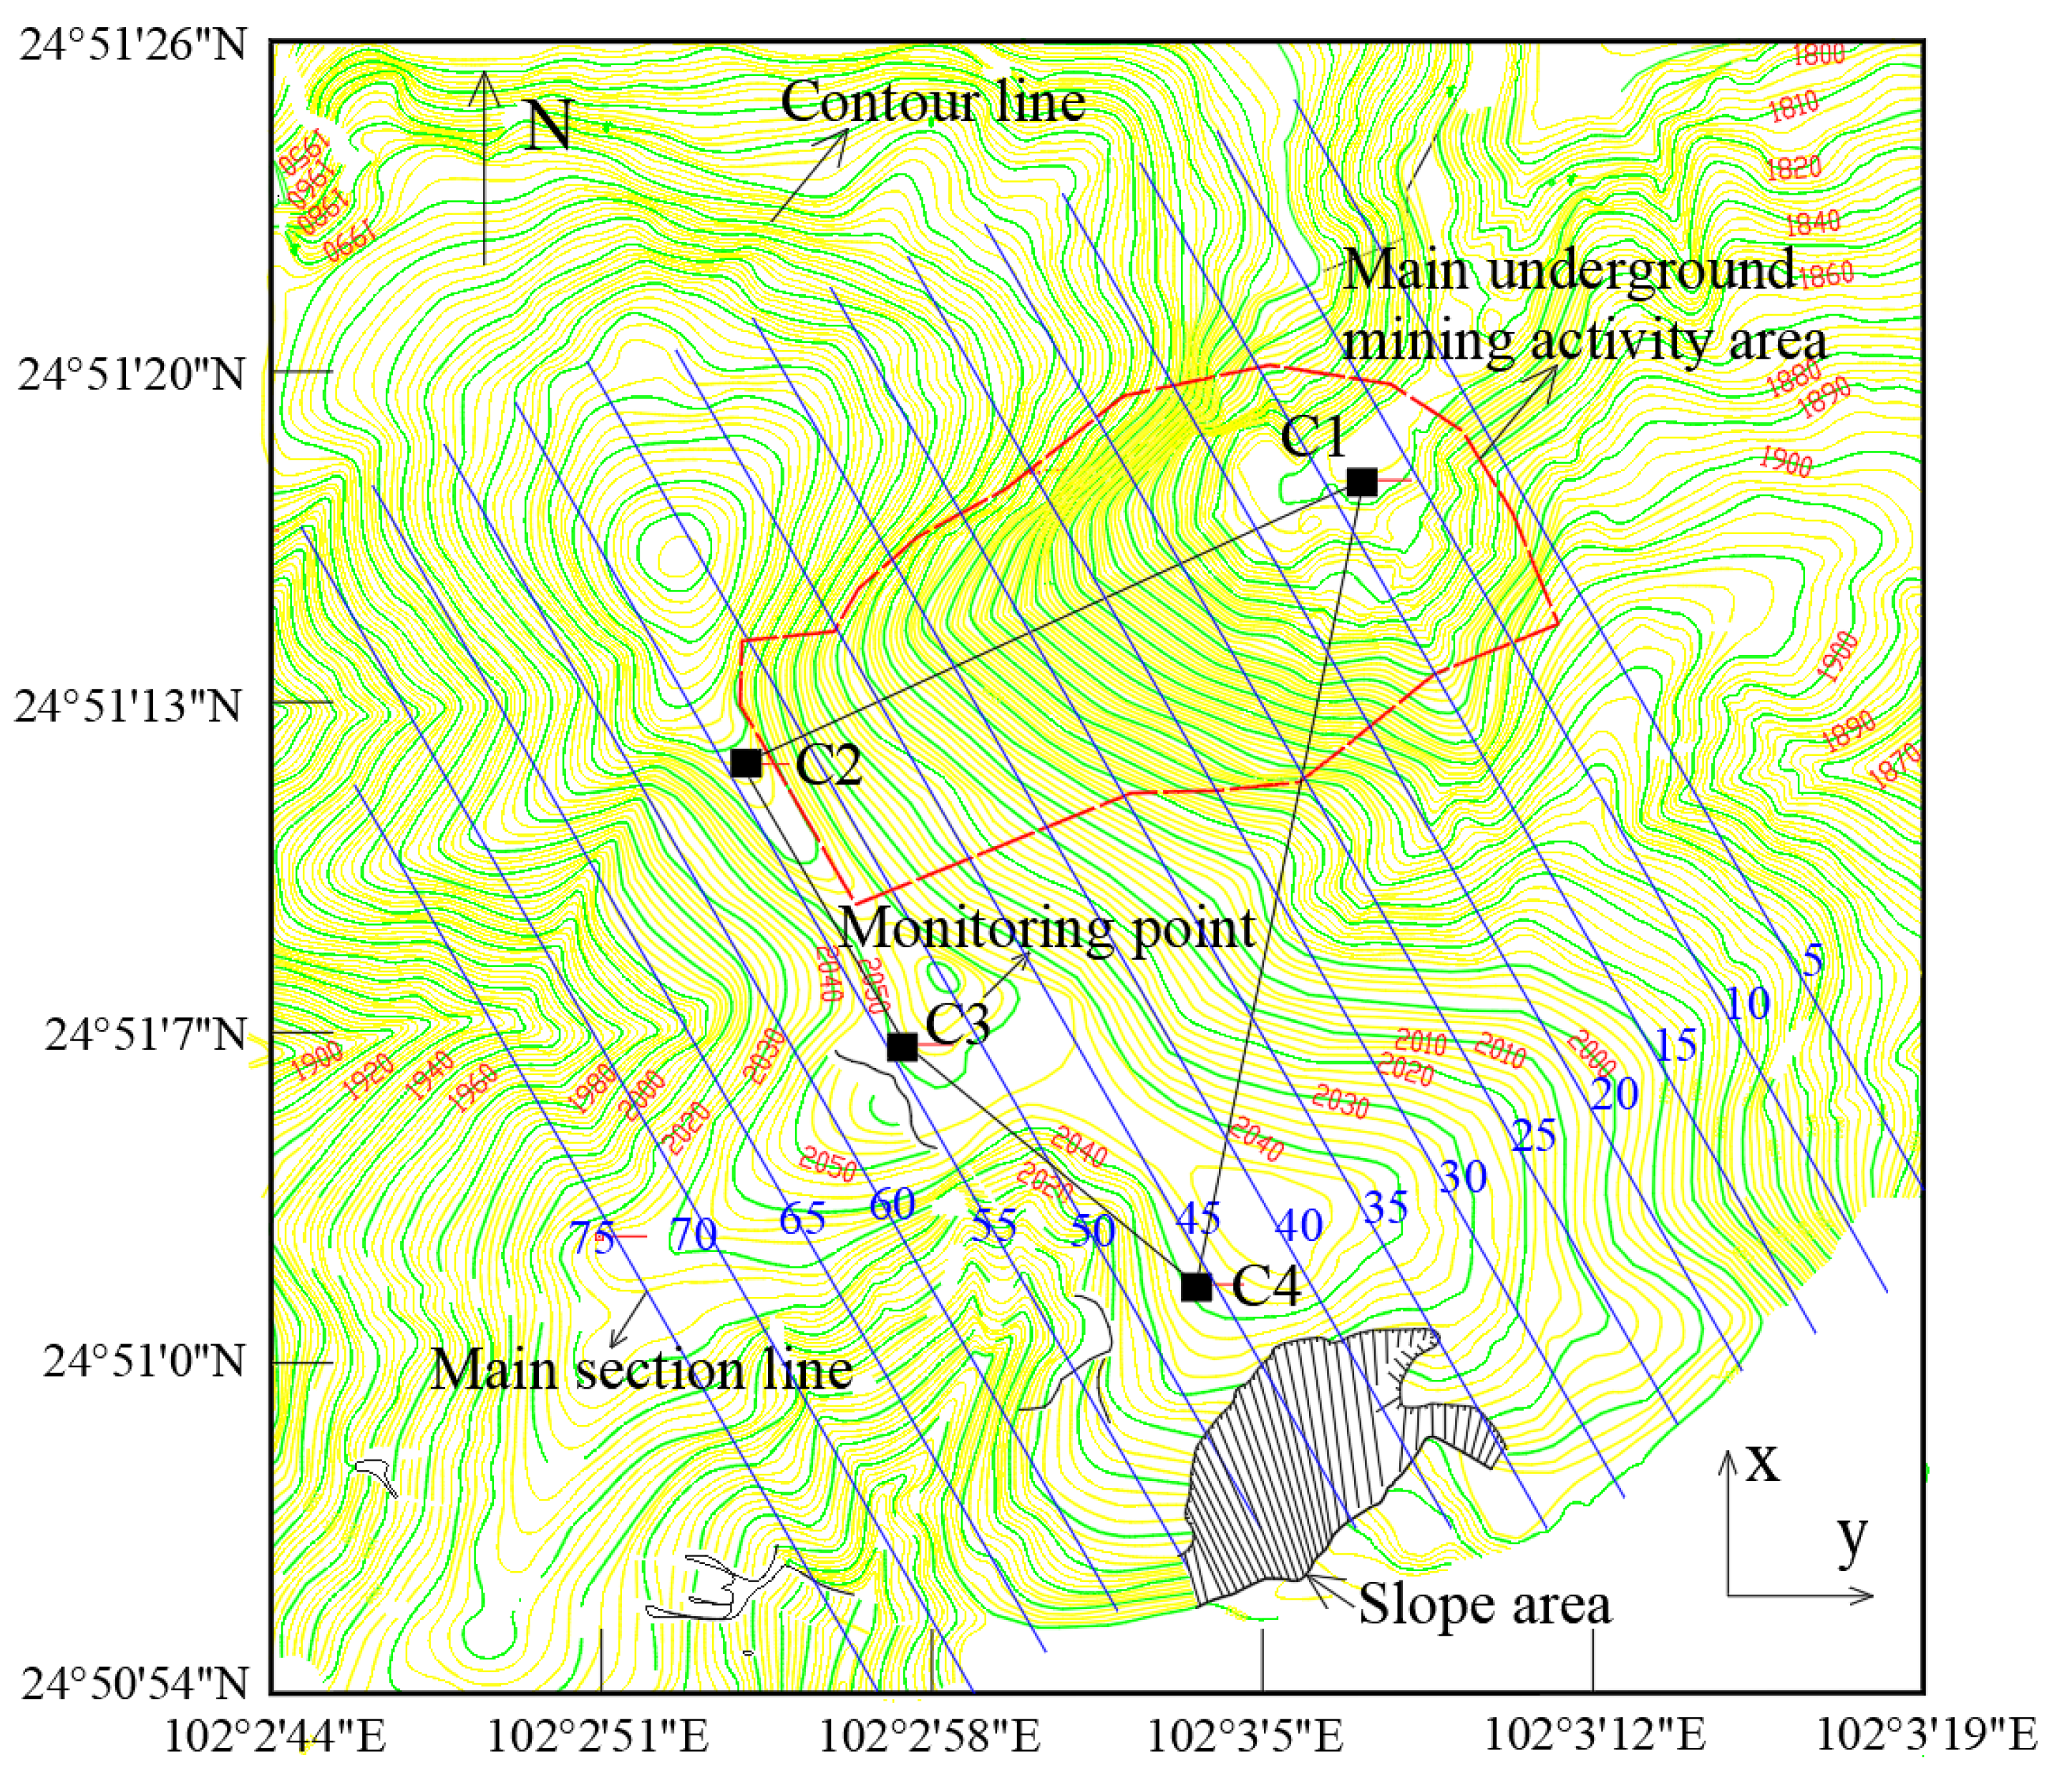
4.1. Design and Implementation of GPS Monitoring of Surface Rock Movement in Mining Area
4.2. Analysis of Surface Rock Movement of Monitoring Results and Deformation Characteristics in Mining Area
4.2.1. Analysis of Horizontal Displacement Change of Monitoring Points
- Analysis of surface horizontal movement and deformation in the X direction
- (1)
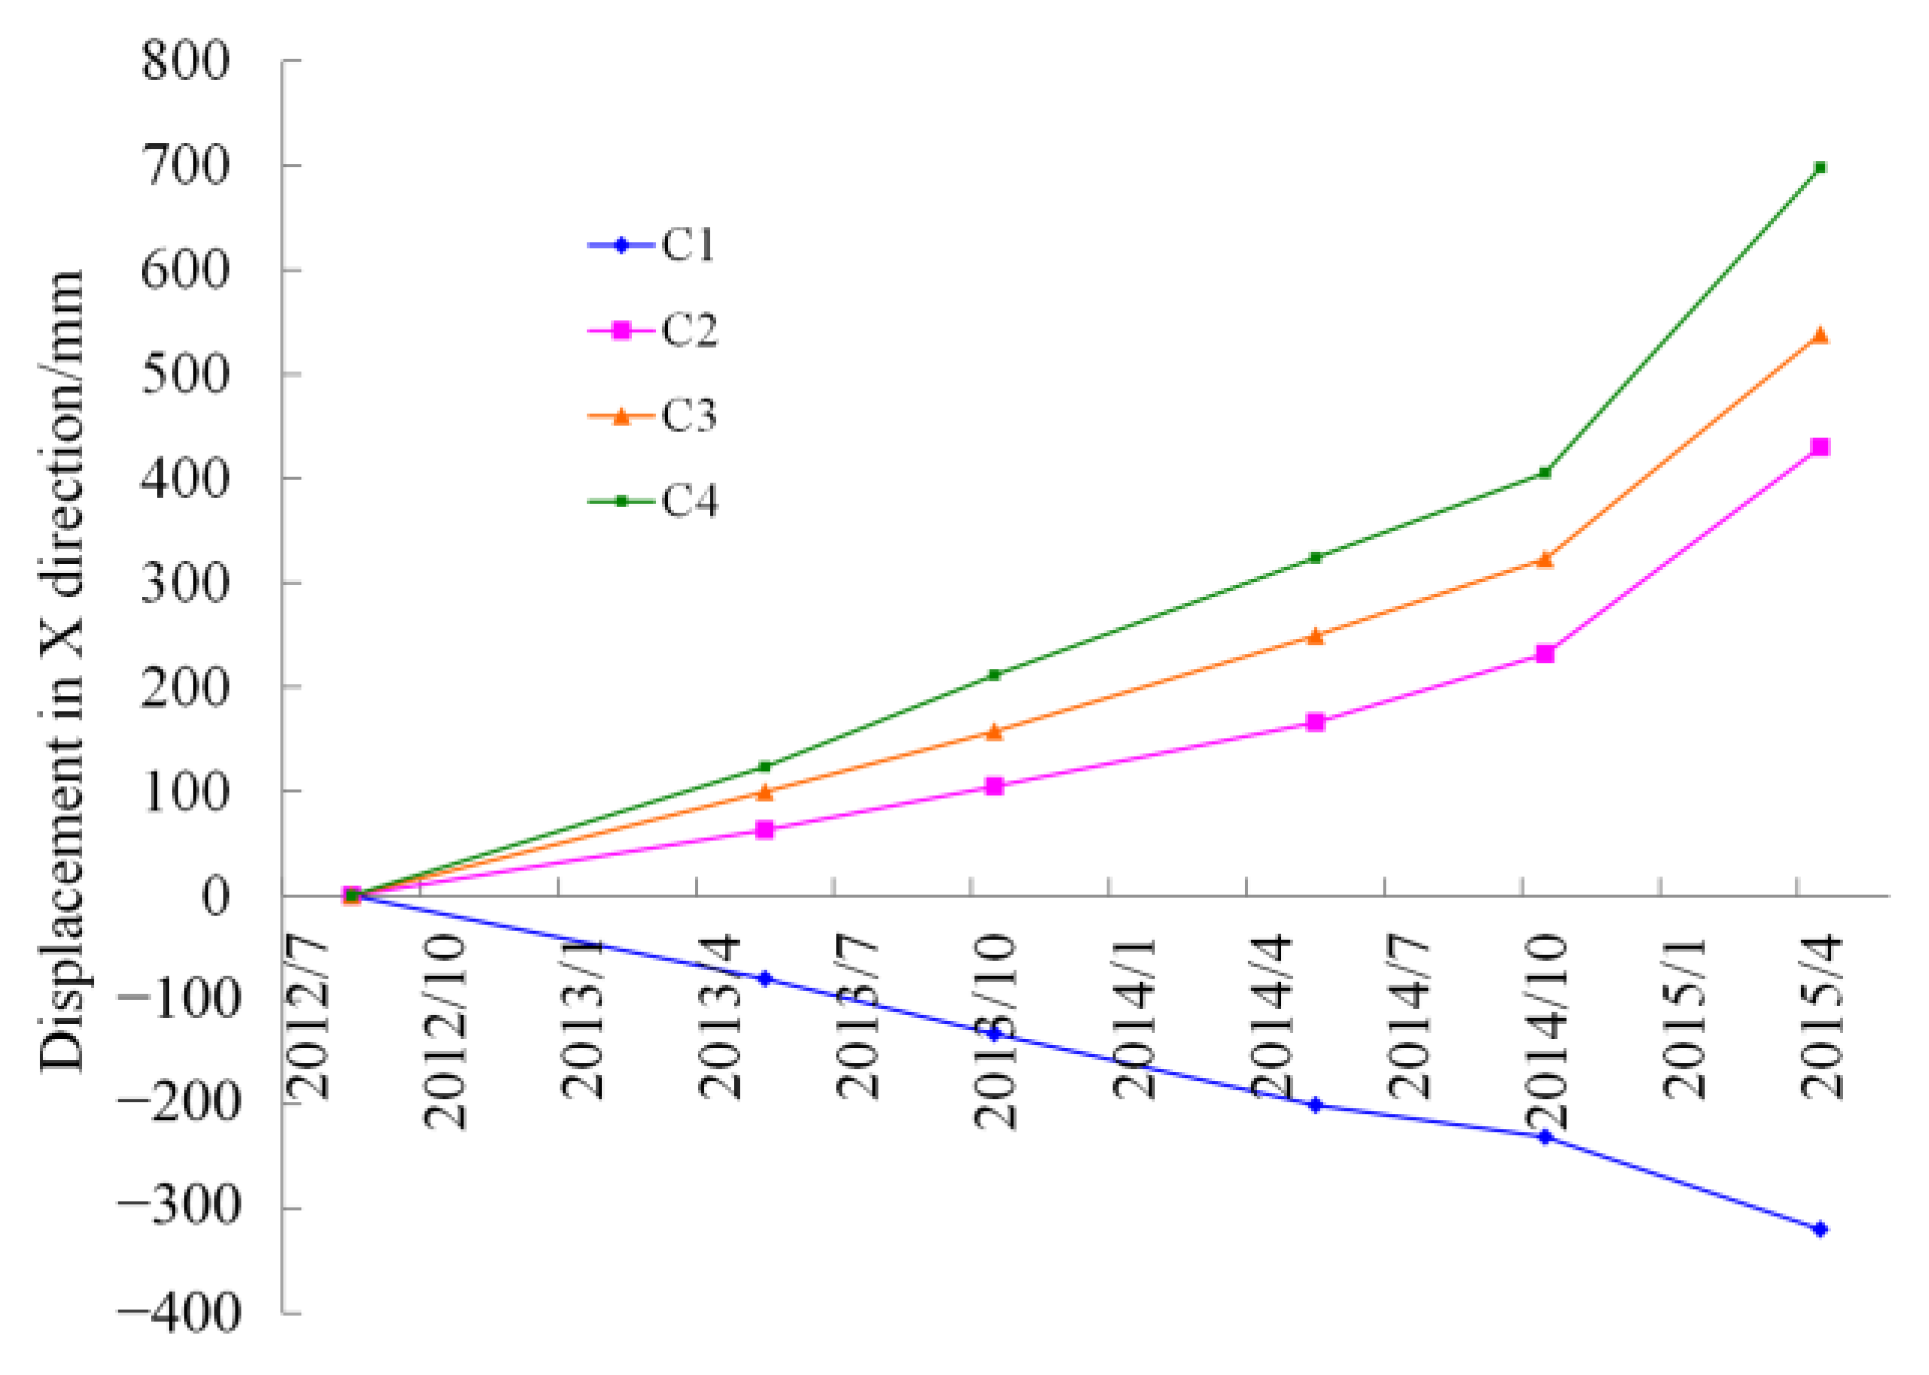
- According to the evolution curve of the displacement in the X direction of each monitoring point over time, it can be observed that the horizontal displacement of the surface in the X direction of the four monitoring points shows an increasing trend over time, and the horizontal movement rate of the surface in the X direction has significantly increased after November 2014.
- (2)
- The maximum cumulative deformation in the X direction is at the measurement point C4. The accumulated displacement of the surface in the X direction at this measurement point reached 695 mm in the last phase of monitoring in April 2015. The second is the measurement point C3 and C2, and the cumulative deformation in the X direction is 538 mm and 430 mm, respectively. The monitoring results of measuring points C4, C3, and C2 in the X direction are all positive, indicating that the three measuring points all have a horizontal displacement component due north; they all have a displacement pointing toward the footwall of the orebody. The cumulative displacement of the measurement point C1 in the X direction during the last phase of monitoring is −320 mm, indicating that the horizontal displacement component in the X direction points south, namely the direction of the hanging wall of the orebody.
- (3)
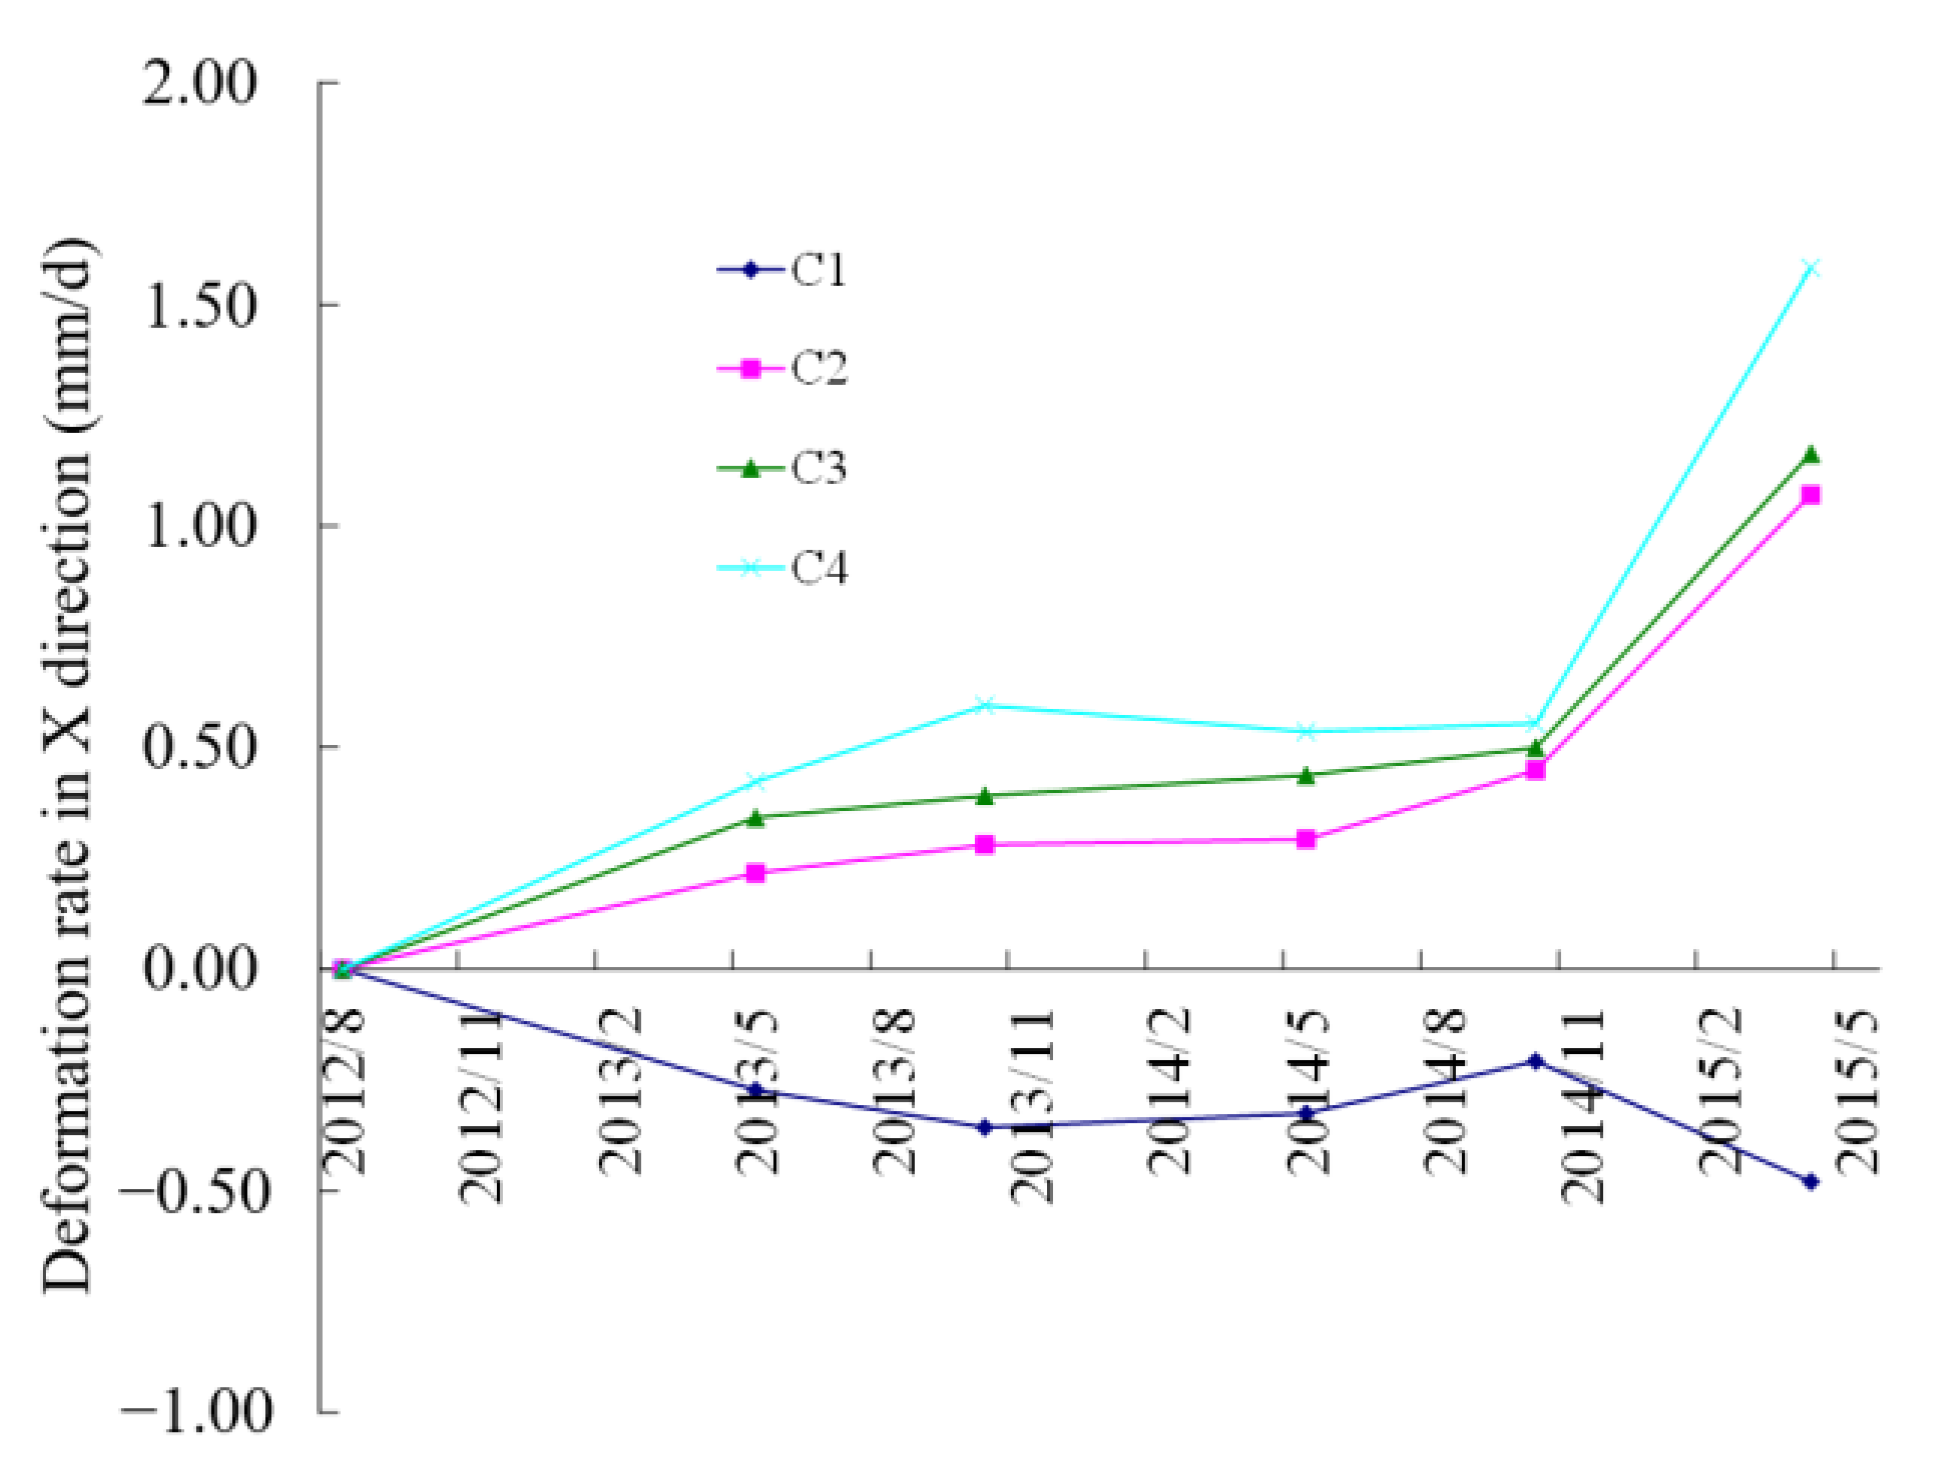
- From the perspective change rate of X-direction displacement, the deformation rate increases with time in the X direction, displaying a smooth change with an increasing trend. Phases 1 to 3 belong to the deformation rate increase, while phases 3 to 5 show a slower change. However, during the monitoring period of phase 6, the overall X-direction rate showed a sudden change. Overall, the horizontal displacement rate of measuring point C4 in the X direction was the highest, reaching 1.58 mm/d on April 14, 2015. The deformation rates of C3 and C2 in the X direction were 1.16 mm/d and 1.07 mm/d, respectively, while C1 was the lowest, at −0.48 mm/d.
- 2.
- Analysis of surface horizontal displacement and deformation in the Y direction
- (1)
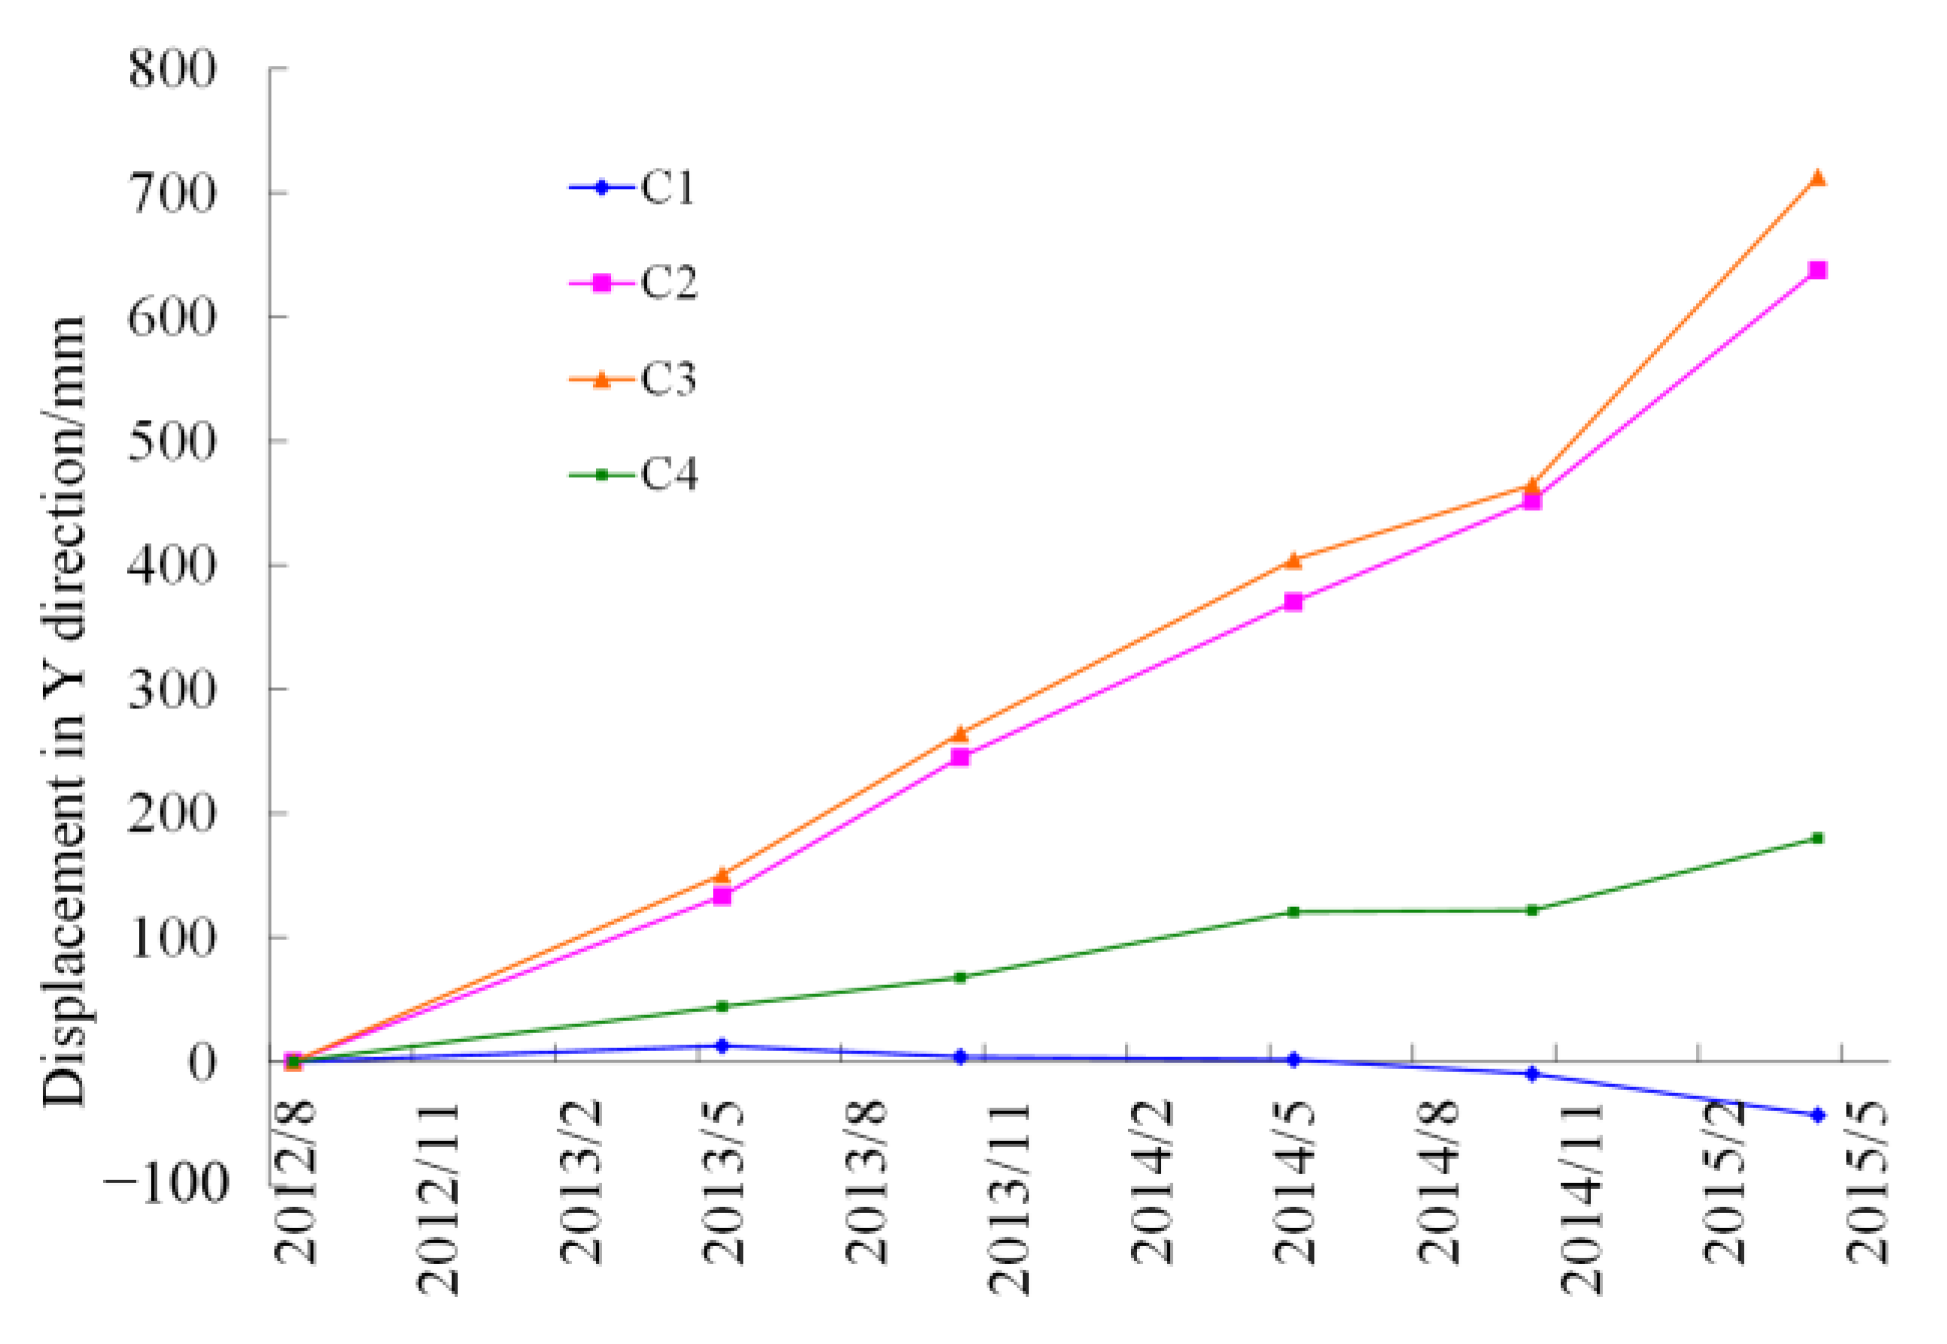
- According to the evolution curve of the displacement in the Y direction of each monitoring point over time, it can be seen that the horizontal surface displacement in the Y direction of monitoring points C2, C3, and C4 all showed an increasing trend over time, while the displacement of monitoring point C1 in the Y direction remained unchanged in the first to fifth periods, but began to increase in the sixth period.
- (2)
- The last phase of monitoring was on 14 April 2015. Measuring point C3, with the largest cumulative deformation in the Y direction, reached 713 mm. This was followed by measuring point C2 and measuring point C4, with a cumulative deformation in the Y direction of 638 mm and 180 mm, respectively. The monitoring results of measuring points C2, C3, and C4 in the Y direction are positive, indicating that the three measuring points have horizontal displacement components in the due east direction, i.e., they all have displacement pointing to the goaf. The cumulative displacement of measuring point C1 in the Y direction monitored in the last phase is −43 mm, indicating that the horizontal displacement component in the Y direction points to the west, but the displacement was small, and the change was not significant.
- (3)
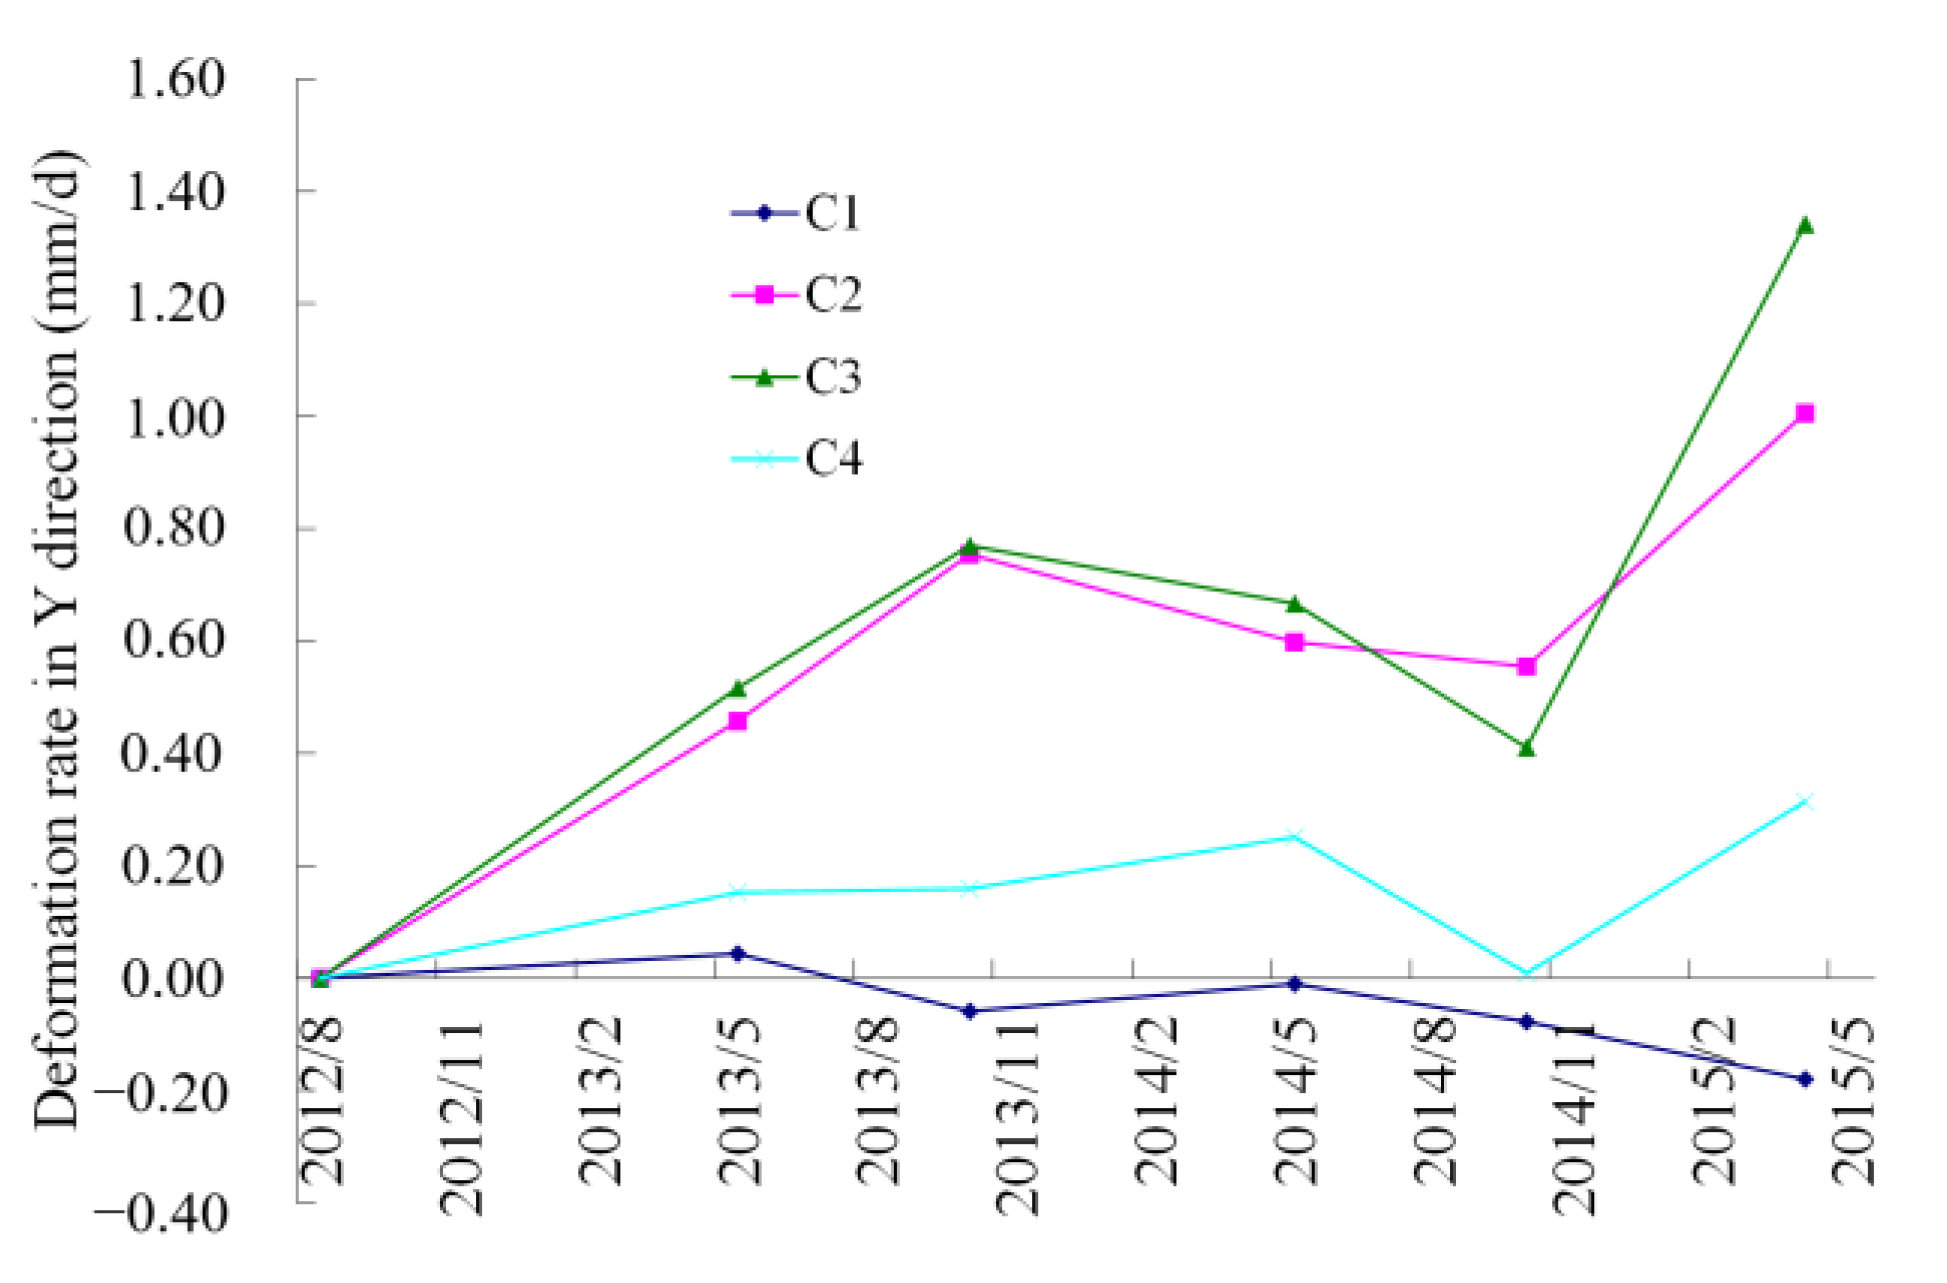
- From the displacement change rate in the Y direction, the deformation rate of measuring points C2 and C3 increased linearly from August 2012 to October 2013, while the deformation rate decreased from October 2013 to October 2014. However, after October 2014, the deformation rate showed a sharp growth trend, in which measurement point C3 increased from 0.41 mm/d in the fifth phase to 1.34 mm/d, and measurement point C2 increased from 0.55 mm/d to 1.00 mm/d. The deformation rate of measuring point C4 was 0 mm/d in October 2014 but increased to 0.31 mm/d in April 2015.
4.2.2. Analysis of Surface Subsidence Change at Monitoring Point
- (1)
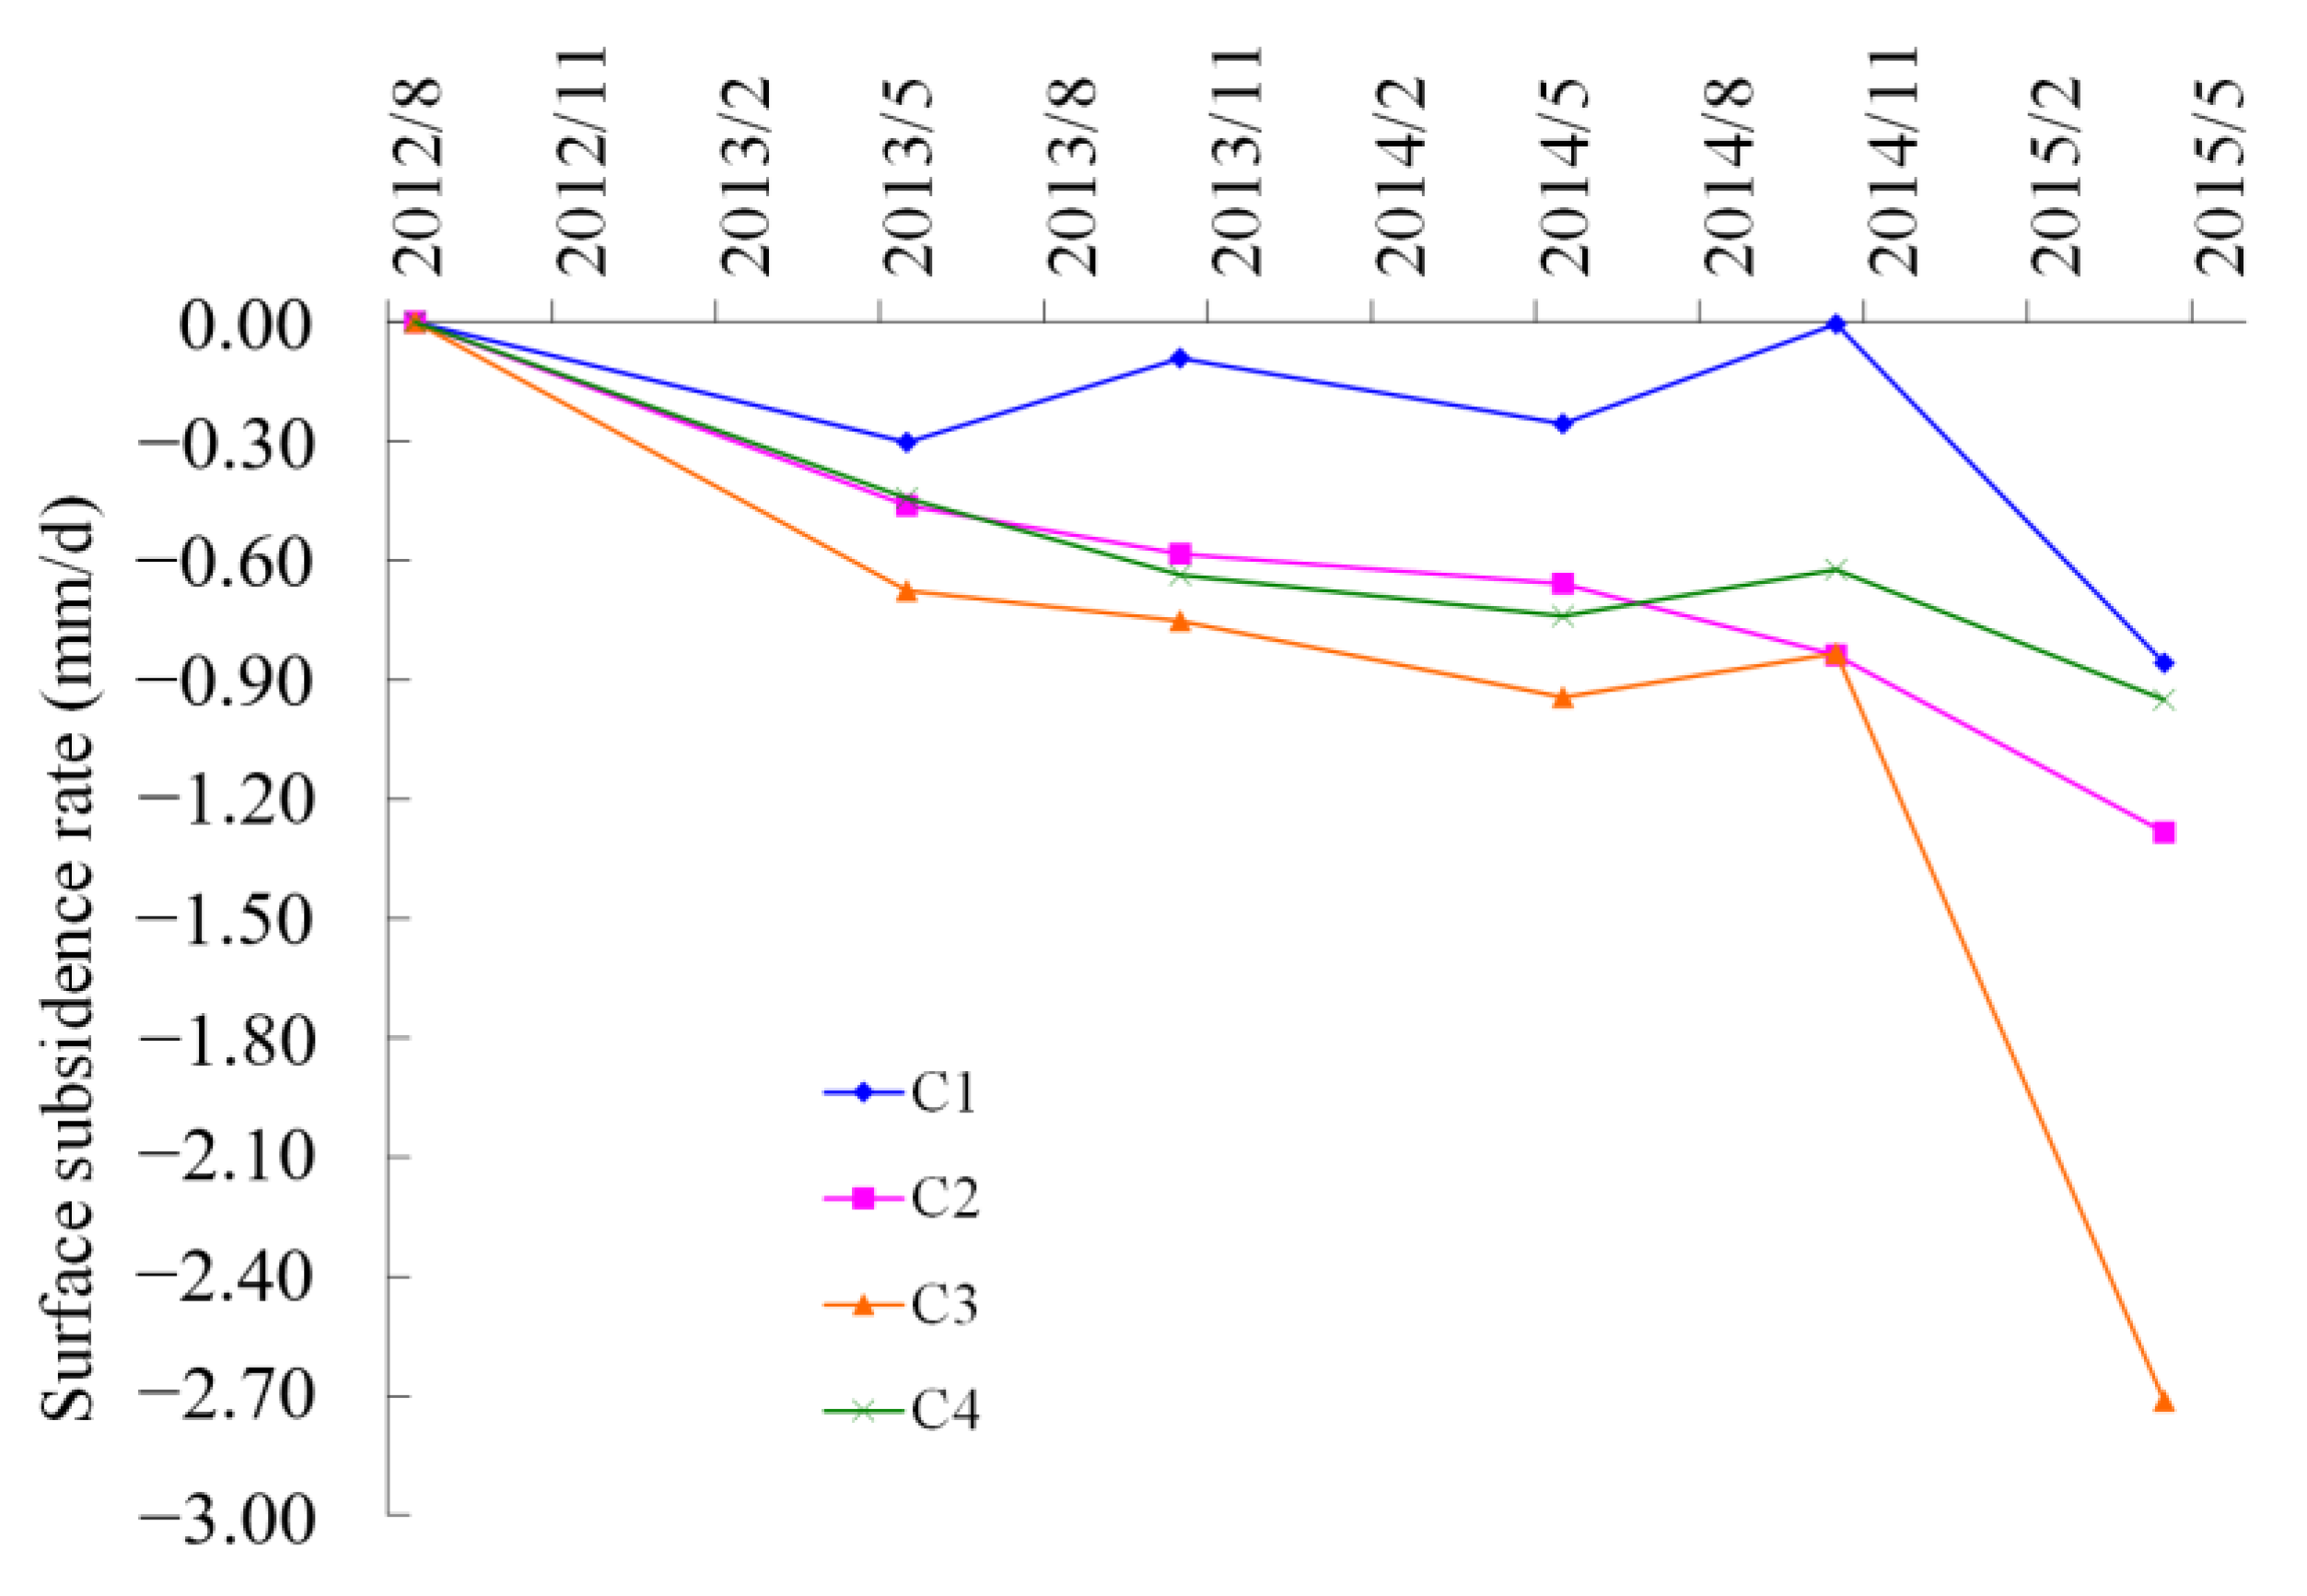
- According to the vertical displacement (Z-direction) of monitoring points C1 to C4 and the evolution curve of the deformation rate with time (Figure 16 and Figure 17), the cumulative displacement of the surface in the vertical direction of the four monitoring points showed an increasing trend with time. The measuring point C3 had the largest cumulative deformation in the vertical direction. As of April 14, 2015, the largest cumulative deformation in the vertical direction is the measuring point C3, and the cumulative displacement has reached -1131 mm. This is followed by the cumulative displacement in the vertical direction, from large to small, of measuring point C2, measuring point C4, and measuring point C1, which are −878 mm, −732 mm, and −461 mm, respectively. The cumulative vertical displacement of each monitoring point increased almost linearly in the first five periods, while the vertical displacement rate increased significantly in the sixth period.
- (2)
- From the vertical displacement change rate, the subsidence rate of measuring points C3 and C4 decreased from August 2012 to May 2014 and then increased from October 2014 to April 2015. The surface settlement rate of measuring point C3 increased from −0.83 mm/d to −2.71 mm/d, and measuring point C2 increased from −0.83 mm/d to −1.28 mm/d. The surface subsidence rate of C4 and C1 increased from −0.62 mm/d and −0.004 mm/d to −0.95 mm/d and 0.86 mm/d in the fourth period.
4.3. Mechanism Analysis of Surface Movement and Deformation Based on Monitoring Results
5. Surface Movement and Deformation Law and Deformation Trend Prediction of Continuous Mining in Deep Mining Area
5.1. Numerical Model
5.2. Development and Evolution Analysis of Surface Rock Movement Trend
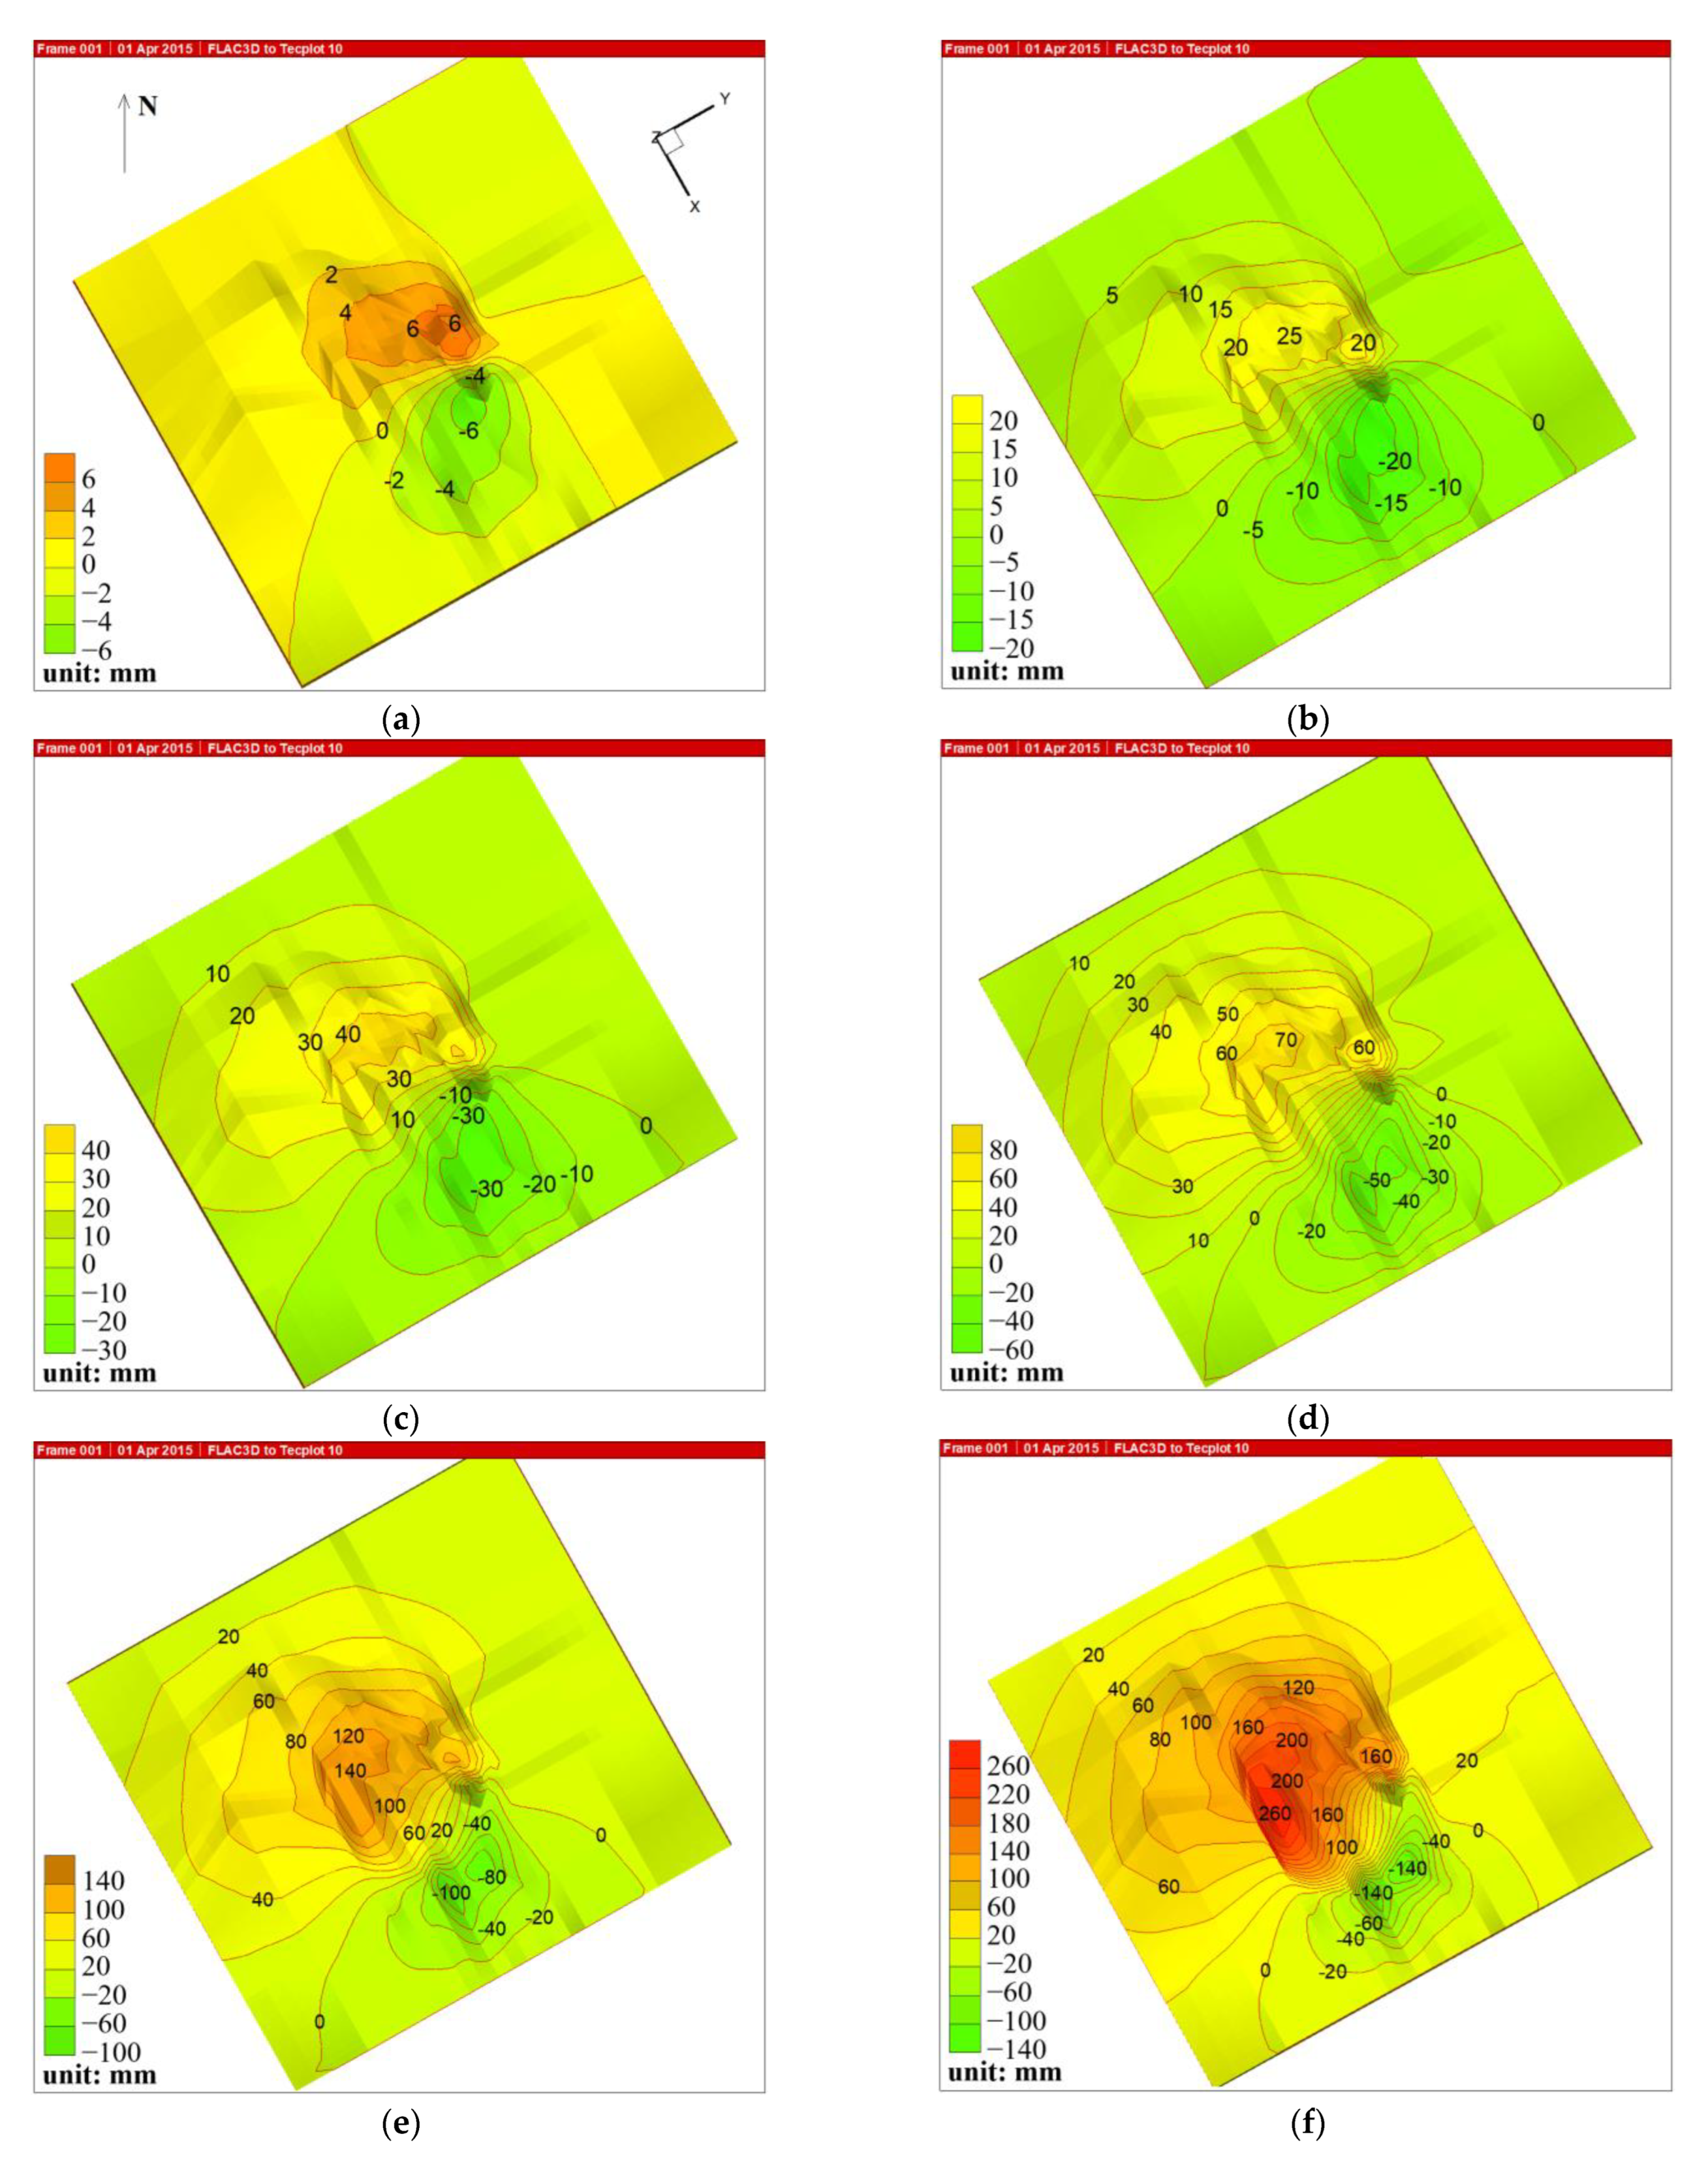
- (1)
- After the conclusion of orebody mining in sublevel 8, a specific surface subsidence range appears directly above the excavation area. The maximum vertical displacement of the surface is 20 mm, the maximum horizontal movement of the surface along the X direction is 6 mm, and the maximum displacement along the opposite direction of X is 6 mm. The subsidence range is approximately circular, and the maximum subsidence point is located near section 25. The range of surface movement is from profiles 60 to 20 along the orebody strike.
- (2)
- After mining sublevel 12, the movement range of the surface was expanded. The influence range of the hanging wall direction of the goaf was greater than that of the footwall direction. The movement range extends to the inclined direction of the orebody. The surface movement boundary moves 87 m in the footwall direction, 400 m in the hanging wall direction, 316 m in the west direction, and 24 m in the east direction. The maximum vertical displacement of the surface is 90 mm. The maximum horizontal displacement of the surface along the X direction is 25 mm, and the maximum displacement along the X opposite direction is 20 mm. The subsidence range changed from circular to elliptical, and the maximum subsidence point was near section 35.
- (3)
- After the stoping of the orebody in sublevel 15, the maximum vertical displacement of the surface is 190 m, the maximum horizontal displacement is 40 mm along the X direction, and the maximum displacement is 30 mm along the opposite direction of X. The movement range of the surface continues to expand, and the moving boundary of the surface moves 133 m toward the footwall direction, and the moving boundary of the hanging wall direction exceeds the range of the model. The strike direction extends 176 m to the west and 24 m to the east. The influence range of the hanging wall direction of the goaf is more significant than that of the footwall direction. With the continuous migration of the mining center, the maximum subsidence point of the surface subsidence basin shifts to the south and east direction, and the maximum subsidence point of the moving basin is located 20 m to the west of section 25.
- (4)
- After excavating the orebody in sublevel 18, the movement range of the surface is further expanded. The maximum vertical displacement of the surface is 320 mm, the maximum horizontal displacement is 70 mm along the X direction, and the maximum displacement is 50 mm along the opposite X direction. The influence range of the footwall direction is small, while the influence range of the goaf hanging wall direction is further expanded outward. The surface movement boundary moves 49 m to the footwall direction, and the strike direction extends to the west to the model boundary and 48 m to the east. The subsidence range is approximately round, and the maximum subsidence point is located 18 m to the west of section 30.
- (5)
- After the stoping of the orebody in sublevel 21, the movement range of the surface is further expanded. The maximum surface settlement increases to 520 mm, the maximum horizontal movement along the X direction is 140 mm, and the maximum displacement along the opposite direction of X is 80 mm. The influence range of the footwall direction is small, while the influence range of the goaf hanging wall direction is further expanded outward. The surface movement boundary moves 107 m to the footwall direction, extending 9 m to the east in the strike direction. The subsidence range is oval, and the maximum subsidence point is located near section 30.
- (6)
- After the stoping of the orebody in sublevel 24, the movement range of the surface is further expanded. The maximum vertical displacement of the surface increases to 800 mm, the maximum horizontal movement along the X direction is 260 mm, and the maximum displacement along the opposite direction of X is 140 mm. The influence range of the footwall direction is small, while the influence range of the goaf hanging wall direction is further expanded outward. The surface movement boundary moves 133 m to the footwall direction and extends 12 m to the east in the strike direction. The subsidence range is oval, and the maximum subsidence point is located near section 35.
- (7)
- In the process of deep continuous mining, due to the extension of the ore body in the south-by-west direction, the surface movement range develops southward. As a result of the expansion of the subsidence range in the south direction, new fissures will be generated. With the generation of new fissures, the existing fissure width and fracture will continue to expand. The results are consistent with the actual investigation of surface fissures.
6. Conclusions
- (1)
- Judging from the site situation of surface fissures in the mining area, from 2013 to 2015, the fissures on the surface were damaged to varying degrees, and obvious three-dimensional features appeared. In terms of displacement changes, there are both opening displacement and horizontal displacement, and the displacements in the three-dimensional direction are of the same magnitude. The horizontal displacement on both sides of the surface fissures in the north and east of the surface is the largest, followed by the vertical subsidence displacement, while the trend of displacement in the west of the surface is just the opposite. In the southern part of the surface, two fissure zones appeared, the first fracture zone developed into the hanging wall more clearly, and the second fracture zone increased significantly compared with the previous period. Especially from the current development of ground fissures, the hanging wall direction of the ore body in the southeast of the surface has a trend of continuous growth or deterioration, which must be paid attention to.
- (2)
- According to the on-site GPS monitoring data, it can be seen that after the formation of a specific scale of goaf, there are subsidence centers in the area of lines 25 to 40, and the surface of the subsidence area is moved to the subsidence center by stretching. The surface monitoring points move slightly to the subsidence center, and the movement direction is different. The surface movement and deformation in the mining area show an upward trend, and the surface subsidence and horizontal movement rate of each measuring point increase rapidly, indicating that the surface subsidence is in an active development period.
- (3)
- From the prediction results of the deformation trend by numerical simulation software FLAC3D, with continuous deep orebody mining in the mining area, there are apparent subsidence centers on the surface, the subsidence contour is concentric oval, and the long axis direction is consistent with the direction of the ore body. With continuous mining, the subsidence area expands, and the position of the subsidence center shifts to the hanging wall of the orebody. The maximum subsidence center is located near section line 30. Meanwhile, the horizontal displacement of the two movement centers on the surface continues to increase. Due to the terrain, the horizontal displacement of the hanging wall is less than that of the footwall because the maximum horizontal movement position of the footwall is a steep mountain, and the horizontal displacement is large after mining.
Author Contributions
Funding
Institutional Review Board Statement
Informed Consent Statement
Data Availability Statement
Conflicts of Interest
References
- Li, S.L. Study on the geological hazard in metal mines and its prevention countermeasures. Chin. J. Geol. Hazard Control 2002, 13, 44–48. [Google Scholar]
- Bazaluk, O.; Petlovanyi, M.; Zubko, S.; Lozynskyi, V.; Sai, K. Instability Assessment of Hanging Wall Rocks during Underground Mining of Iron Ores. Minerals 2021, 11, 858. [Google Scholar] [CrossRef]
- Petlovanyi, M.; Lozynskyi, V.; Zubko, S.; Saik, P.; Sai, K. The influence of geology and ore deposit occurrence conditions on dilution indicators of extracted reserves. Rud. Geol. Naft. Zb. 2019, 34, 83–91. [Google Scholar] [CrossRef] [Green Version]
- Zhao, X.D.; Zhou, X.; Zhao, Y.F. Research status and progress of prevention and control of mining disasters in deep metal mines. J. Cent. South Univ. 2021, 52, 2522–2538. [Google Scholar]
- Zhao, H.J.; Ma, F.S.; Li, G.Q.; Ding, D.M.; Wen, Y.D. Fault effect due to underground excavation in hangingwalls and footwalls of faults. Chin. J. Geotech. Eng. 2008, 30, 1372–1375. [Google Scholar]
- Chen, G.Q.; Li, T.B.; Zhang, G.F.; Yin, H.Y.; Zhang, H. Temperature effect of rock burst for hard rock in deep-buried tunnel. Nat. Hazards 2014, 72, 915–926. [Google Scholar] [CrossRef]
- Fu, H.; Chen, C.X.; Xia, K.Z.; Deng, Y.Y. Analysis for landslide caused by underground mining. J. Rock Mech. Geotech. 2016, 35, 3991–4000. [Google Scholar]
- Guo, Y.H.; Yang, Y.; Kong, Z.J.; He, J. Development of Similar Materials for Liquid-Solid Coupling and Its Application in Water Outburst and Mud Outburst Model Test of Deep Tunnel. Geofluids 2022, 2022, 8784398. [Google Scholar] [CrossRef]
- Murphy, M.M.; Klemetti, T.; Lawson, H.; Mishra, B.; Perry, K.A. Guest editorial–special issue on ground control in mining in 2020. Int. J. Min. Sci. Technol. 2020, 31, 1–2. [Google Scholar] [CrossRef]
- Gao, M.Z. Similarity model test of strata movement with steep seam. J. Rock Mech. Geotech. 2004, 3, 441–445. [Google Scholar]
- Xu, J.M.; Zhu, W.B.; Xu, J.L.; Wu, J.Y.; Li, Y.C. High-intensity longwall mining-induced ground subsidence in Shendong coalfield, China. Int. J. Rock Mech. Min. 2021, 141, 104730. [Google Scholar] [CrossRef]
- Li, W.X.; Wen, L.; Liu, X.M. Ground movements caused by deep underground mining in Guan-Zhuang iron mine, Luzhong, China. Int. J. Appl. Earth Obs. 2010, 12, 175–182. [Google Scholar] [CrossRef]
- Eray, C.; Çetin, M.; Şenol, K.; Hakan, A. Computation of subsidence parameters resulting from layer movements post-operations of underground mining. J. Struct. Geol. 2012, 47, 16–24. [Google Scholar]
- Zhao, H.J.; Ma, F.S.; Xu, J.M.; Guo, J. In situ stress field inversion and its application in mining-induced rock mass movement. Int. J. Rock Mech. Min. 2012, 53, 120–128. [Google Scholar] [CrossRef]
- Chen, B.Q.; Li, Z.H.; Yu, C.; David, F.; Kang, J.R.; Hu, J.S.; Liang, L. Three-dimensional time-varying large surface displacements in coal exploiting areas revealed through integration of SAR pixel offset measurements and mining subsidence model. Remote Sens. Environ. 2020, 240, 111663. [Google Scholar] [CrossRef]
- Malinowska, A.A.; Witkowski, W.T.; Guzy, A.; Hejmanowski, R. Mapping ground movements caused by mining-induced earthquakes applying satellite radar interferometry. Eng. Geol. 2018, 246, 402–411. [Google Scholar] [CrossRef]
- Fan, H.D.; Wang, L.; Wen, B.F.; Du, S. A New Model for three-dimensional Deformation Extraction with Single-track InSAR Based on Mining Subsidence Characteristics. Int. J. Appl. Earth Obs. 2021, 94, 102223. [Google Scholar] [CrossRef]
- Anil, J.; Kumar, K.; Ram, S.; Chatterjee, S.; Gorai, A.K. Monitoring of Subsidence Over a Continuous Miner-Based Coal Mine Caving Panels Using PS-InSAR Technique. Mining Metall. Explor. 2023, 40, 719–736. [Google Scholar] [CrossRef]
- Govil, H.; Chatterjee, R.S.; Bhaumik, P.; VishwakarMa, N. Deformation monitoring of Surakachhar underground coal mines of Korba, India using SAR interferometry. Adv. Space Res. 2022, 70, 3905–3916. [Google Scholar]
- Nduji, N.N.; Madu, C.N.; Okafor, C.C. A Low-Cost Web Application System for Monitoring Geometrical Impacts of Surface Subsidence. Sustainability 2022, 14, 14240. [Google Scholar] [CrossRef]
- Cieślik, K.; Milczarek, W. Application of Machine Learning in Forecasting the Impact of Mining Deformation: A Case Study of Underground Copper Mines in Poland. Remote Sens. 2022, 14, 4755. [Google Scholar] [CrossRef]
- Wang, D.Y.; Li, X.B.; Li, C.J.; Liu, Z.X. Mechanism of Surface Subsidence Caused by Underground Mining. Chin. Min. Metall. Eng. 2020, 40, 16–21. [Google Scholar]
- Guo, Y.H.; Hou, K.P.; Yang, Z.Q.; Yang, Y.; Wang, J.G. Influence of Dip Angle on the Rock Mass Movement Law of Steep Inclined Orebody Mining Under Tectonic Stress Environment. Chin. Min. Res. Dev. 2020, 40, 18–21. [Google Scholar]
- Guo, Y.H.; Luo, L.; Wang, C.Y. Research on Fault Activation and Its Influencing Factors on the Barrier Effect of Rock Mass Movement Induced by Mining. Appl. Sci. 2023, 13, 651. [Google Scholar] [CrossRef]
- Svartsjaern, M.; Saiang, D.; Nordlund, E.; Eitzenberger, A. Conceptual Numerical Modeling of Large-Scale Footwall Behavior at the Kiirunavaara Mine, and Implications for Deformation Monitoring. Rock Mech. Rock Eng. 2016, 49, 943–960. [Google Scholar] [CrossRef] [Green Version]
- Yuan, R.M.; Ma, F.S.; Deng, Q.H.; Lu, Y.J. Mechanism of ground movement induced by underground mining of metal deposit with steep occurrence and large thickness. Chin. J. Geol. Hazard 2008, 19, 62–67. [Google Scholar]
- Mateusz, D.; Krzysztof, T. FEM for prediction of surface deformations induced by flooding of steeply inclined mining seams. Geomech. Energy Environ. 2021, 28, 100254. [Google Scholar]
- Zhao, B.; Guo, Y.; Mao, X.; Zhai, D.; Zhu, D.; Huo, Y.; Wang, J. Prediction method for surface subsidence of coal seam mining in loess donga based on the probability integration model. Energies 2022, 15, 2282. [Google Scholar] [CrossRef]
- Takashi, S.; Hiroshi, T.; Hideki, S.; Jiro, O.; Akihiro, H.; Kikuo, M. Surface subsidence due to underground mining operation under weak geological condition in Indonesia. J. Rock Mech. Geotech. 2015, 7, 337–344. [Google Scholar]
- James, B.; Bruce, H.; Rudrajit, M.; Ken, M. Prediction of horizontal movement and strain at the surface due to longwall coal mining. Int. J. Rock Mech. Min. 2016, 84, 105–118. [Google Scholar]
- Nie, L.; Wang, H.F.; Xu, Y. A new prediction model for mining subsidence deformation: The arc tangent function model. Nat. Hazards 2015, 75, 2185–2198. [Google Scholar] [CrossRef]
- Castro, L.A.M.; Bewick, R.P.; Carter, T.G. An overview of numerical modelling applied to deep mining. In Innovative Numerical Modelling in Geomechanics; Chemical Rubber Company Press: Boca Raton, FL, USA, 2012; pp. 393–414. [Google Scholar]
- Rafiee, R.; Ataei, M.; KhalooKakaie, R.; Jalali, S.E.; Sereshki, F.; Noroozi, M. Numerical modeling of influence parameters in cavabililty of rock mass in block caving mines. Int. J. Rock Mech. Min. 2018, 105, 22–27. [Google Scholar] [CrossRef]
- Guo, Y.H.; Luo, L. Monitoring and Analysis of Deformation Evolution Law of Fault Activation Caused by Deep Mining in Shizishan Copper Mine, China. Appl. Sci. 2022, 12, 6863. [Google Scholar] [CrossRef]
- Rysbekov, K.; Bitimbayev, M.; Akhmetkanov, D.; Yelemessov, K.; Barmenshinova, M.; Toktarov, A.; Baskanbayeva, D. Substantiation of mining systems for steeply dipping low-thickness ore bodies with controlled continuous stope extraction. Min. Miner. Depos. 2022, 16, 64–72. [Google Scholar] [CrossRef]
- Takhanov, D.; Muratuly, B.; Rashid, Z.; Kydrashov, A. Geomechanics substantiation of pillars development parameters in case of combined mining the contiguous steep ore bodies. Min. Miner. Depos. 2021, 15, 50–58. [Google Scholar] [CrossRef]
- Guo, Y.H.; Miao, Y.C. Study on Stope Stability in Continuous Mining of Long-Dip, Thin Orebody by Room–Pillar Method. Sustainability 2022, 14, 9601. [Google Scholar] [CrossRef]
- Stephansson, O.; Brown, E.T. Rock stress and rock stress measurements–A review. In Modelling of Mine Structures: Proceedings of the 10th Plenary Session of the International Bureau of Strata Mechanics, World Mining Congress, Stockholm, Sweden, 4 June 1987; Routledge: Abingdon-on-Thames, UK, 2021; pp. 3–15. [Google Scholar]
- Xie, H.P.; Gao, F.; Ju, Y.; Gao, M.Z.; Zhang, R.; Gao, Y.N.; Liu, J.F.; Xie, L.Z. Quantitative definition and investigation of deep mining. J. Chin. Coal Soc. 2015, 40, 1–10. [Google Scholar]
- Brady, B.H.; Brown, E.T. Rock Mechanics: For Underground Mining; Springer: Berlin/Heidelberg, Germany, 2006. [Google Scholar]
- Chen, G.Q.; Tang, P.; Huang, R.Q.; Wang, D.; Lin, Z.H.; Huang, D. Critical tension crack depth in rockslides that conform to the three-section mechanism. Landslides 2020, 18, 79–88. [Google Scholar] [CrossRef]
- Parwata, I.N.S.; Shinichiro, N.; Norikazu, S.; Takahiro, O. Effect of digital elevation models on monitoring slope displacements in open-pit mine by differential interferometry synthetic aperture radar. J. Rock Mech. Geotech. 2020, 12, 1001–1013. [Google Scholar] [CrossRef]
- Bazanowski, M.; Szostak-Chrzanowski, A.; Chrzanowski, A. Determination of GPS Session Duration in Ground Deformation Surveys in Mining Areas. Sustainability 2019, 11, 6127. [Google Scholar] [CrossRef] [Green Version]
- Zhu, C.; He, M.C.; Zhang, X.H.; Tao, Z.G.; Qian, Y.; Li, L.F. Nonlinear mechanical model of constant resistance and large deformation bolt and influence parameters analysis of constant resistance behavior. Rock Soil Mech. 2021, 42, 1911–1924. [Google Scholar]
- Parmar, H.; Yarahmadi, B.A.; Najafi, M. Impact of ground surface subsidence due to underground mining on surface infrastructure: The case of the Anomaly No. 12 Sechahun, Iran. Environ. Earth. Sci. 2019, 78, 409. [Google Scholar] [CrossRef]
- Zhu, C.; He, M.C.; Jiang, B.; Qin, X.Z.; Yin, Q.; Zhou, Y. Numerical investigation on the fatigue failure characteristics of water-bearing sandstone under cyclic loading. J. Mt. Sci. 2021, 18, 3348–3365. [Google Scholar] [CrossRef]
- Chen, G.Q.; Li, H.; Wei, T.; Zhu, J. Searching for multistage sliding surfaces based on the discontinuous dynamic strength reduction method. Eng. Geol. 2021, 286, 106086. [Google Scholar]
- Guo, Y.H.; Luo, L.; Xu, H.H.; Zhu, C. Analysis of the Regularity and Mechanism of Fault Activation Caused by Deep Continuous Mining of Shizishan Copper Mine, China. Adv. Mater. Sci. Eng. 2022, 2022, 4027231. [Google Scholar] [CrossRef]


| The Lithology | Density (g/cm3) | Elastic Modulus E (GPa) | Poisson’s Ratio | Tensile Strength (MPa) | Cohesion C (MPa) | Angle of Internal Friction Φ (°) |
|---|---|---|---|---|---|---|
| Cyan gray Dolomite | 2.85 | 20.0149 | 0.269 | 2.1966 | 2.6110 | 41.99 |
| Faded Dolomite | 2.84 | 13.0620 | 0.280 | 2.1796 | 2.5504 | 34.05 |
| Orebody | 2.84 | 17.8847 | 0.214 | 2.2577 | 2.9637 | 47.42 |
| Purple Slate | 2.63 | 4.5676 | 0.284 | 1.0431 | 1.5710 | 31.68 |
| Carbonaceous Slate | 2.70 | 2.2416 | 0.350 | 0.9298 | 1.3848 | 35.42 |
Disclaimer/Publisher’s Note: The statements, opinions and data contained in all publications are solely those of the individual author(s) and contributor(s) and not of MDPI and/or the editor(s). MDPI and/or the editor(s) disclaim responsibility for any injury to people or property resulting from any ideas, methods, instructions or products referred to in the content. |
© 2023 by the authors. Licensee MDPI, Basel, Switzerland. This article is an open access article distributed under the terms and conditions of the Creative Commons Attribution (CC BY) license (https://creativecommons.org/licenses/by/4.0/).
Share and Cite
Guo, Y.; Luo, L.; Ma, R.; Li, S.; Zhang, W.; Wang, C. Study on Surface Deformation and Movement Caused by Deep Continuous Mining of Steeply Inclined Ore Bodies. Sustainability 2023, 15, 11815. https://doi.org/10.3390/su151511815
Guo Y, Luo L, Ma R, Li S, Zhang W, Wang C. Study on Surface Deformation and Movement Caused by Deep Continuous Mining of Steeply Inclined Ore Bodies. Sustainability. 2023; 15(15):11815. https://doi.org/10.3390/su151511815
Chicago/Turabian StyleGuo, Yanhui, Luo Luo, Rui Ma, Shunyin Li, Wei Zhang, and Chuangye Wang. 2023. "Study on Surface Deformation and Movement Caused by Deep Continuous Mining of Steeply Inclined Ore Bodies" Sustainability 15, no. 15: 11815. https://doi.org/10.3390/su151511815
APA StyleGuo, Y., Luo, L., Ma, R., Li, S., Zhang, W., & Wang, C. (2023). Study on Surface Deformation and Movement Caused by Deep Continuous Mining of Steeply Inclined Ore Bodies. Sustainability, 15(15), 11815. https://doi.org/10.3390/su151511815