1. Introduction
Variability in climatic conditions adversely impacts the global ecosystem. Precipitation deficit conditions and anomalies in high temperatures are the most dreadful natural events. Precipitation and land surface temperature anomalies are majorly responsible for the occurrences of extreme weather and climatic events like droughts and heat waves. These events adversely affect ecological, environmental, and socio-economic aspects around the world. In recent years, climate change can lead to more dangerous and frequently occurring natural calamities such as droughts, storms, floods, wildfires, and desertification. Out of the total economic damage across the globe, 22% is due to these natural disasters [
1]. Out of all natural hazards, drought is the most dreadful natural hazard [
2,
3]. Due to the multiple climatic and meteorological driving factors [
4] at different spatial or temporal scales, drought has become the most complex phenomenon [
5].
Drought is one of the deadliest natural phenomena that has devastating effects on ecosystems and communities. Drought prediction models are essential for preparing for and mitigating the impacts of drought and, subsequently, contingency planning. Early drought prediction at local as well as global levels is becoming essential. Drought prediction study requires a huge dataset at temporal and spatial scales, a selection of appropriate models based on the available data, and computing resources. Most of the time, data unavailability and the requirement of huge computing resources become key issues in drought prediction research. So, this paper aims to highlight key aspects of drought prediction research.
Drought: A Complex Phenomenon
Wilhite and Glantz [
5] classified droughts into different types, like meteorological, hydrological, agriculture, and socio-economic droughts [
6,
7], which are shown in
Figure 1. Meteorological drought occurs due to deficit rainfall for a longer period, and it becomes a key for the occurrence of other types of droughts [
8]. Less precipitation, the rise in temperature, increase in the evaporation rate, and reduction in soil moisture are key indicators of agriculture drought triggers [
9,
10]. Declination of stream-flow and reduction in water within water bodies causes hydrological droughts [
11], which later impacts the social and economic aspects of society and causes socio-economic drought [
12]. Many studies revealed that drought events lead to reduction in total agriculture productivity, uncontrollable socioeconomic losses, and ecosystem degradation [
13,
14].
Due to the complex nature of drought, its prediction has become a key challenge in front of researchers, planners, and decision and policymakers. The identification and assessment of drought-driving risk factors for planning and mitigation is becoming a vital issue across the globe [
15,
16].
The objective of this article is to offer a comprehensive overview of the key principles and features of drought, highlighting its complex nature, the major driving factors that contribute to its occurrence, and the drought indicators used to measure drought. A thorough examination is conducted on a variety of drought prediction models found in the existing literature, encompassing statistical approaches as well as machine learning and deep learning models.
This critical review article analyzes the technological advancements that have contributed to enhanced drought prediction, evaluates the main challenges and opportunities in this field, and identifies the emerging trends and topics that will shape the future of drought prediction research. It investigates the integration of remote sensing data, meteorological observations, hydrological modeling, and climate indices to improve prediction accuracy. By offering a comprehensive overview, this review serves as a valuable resource for researchers, practitioners, and policymakers involved in drought prediction and management. The review will conclude by summarizing the current state of knowledge, as well as challenging and identifying areas for future research.
2. Methodology
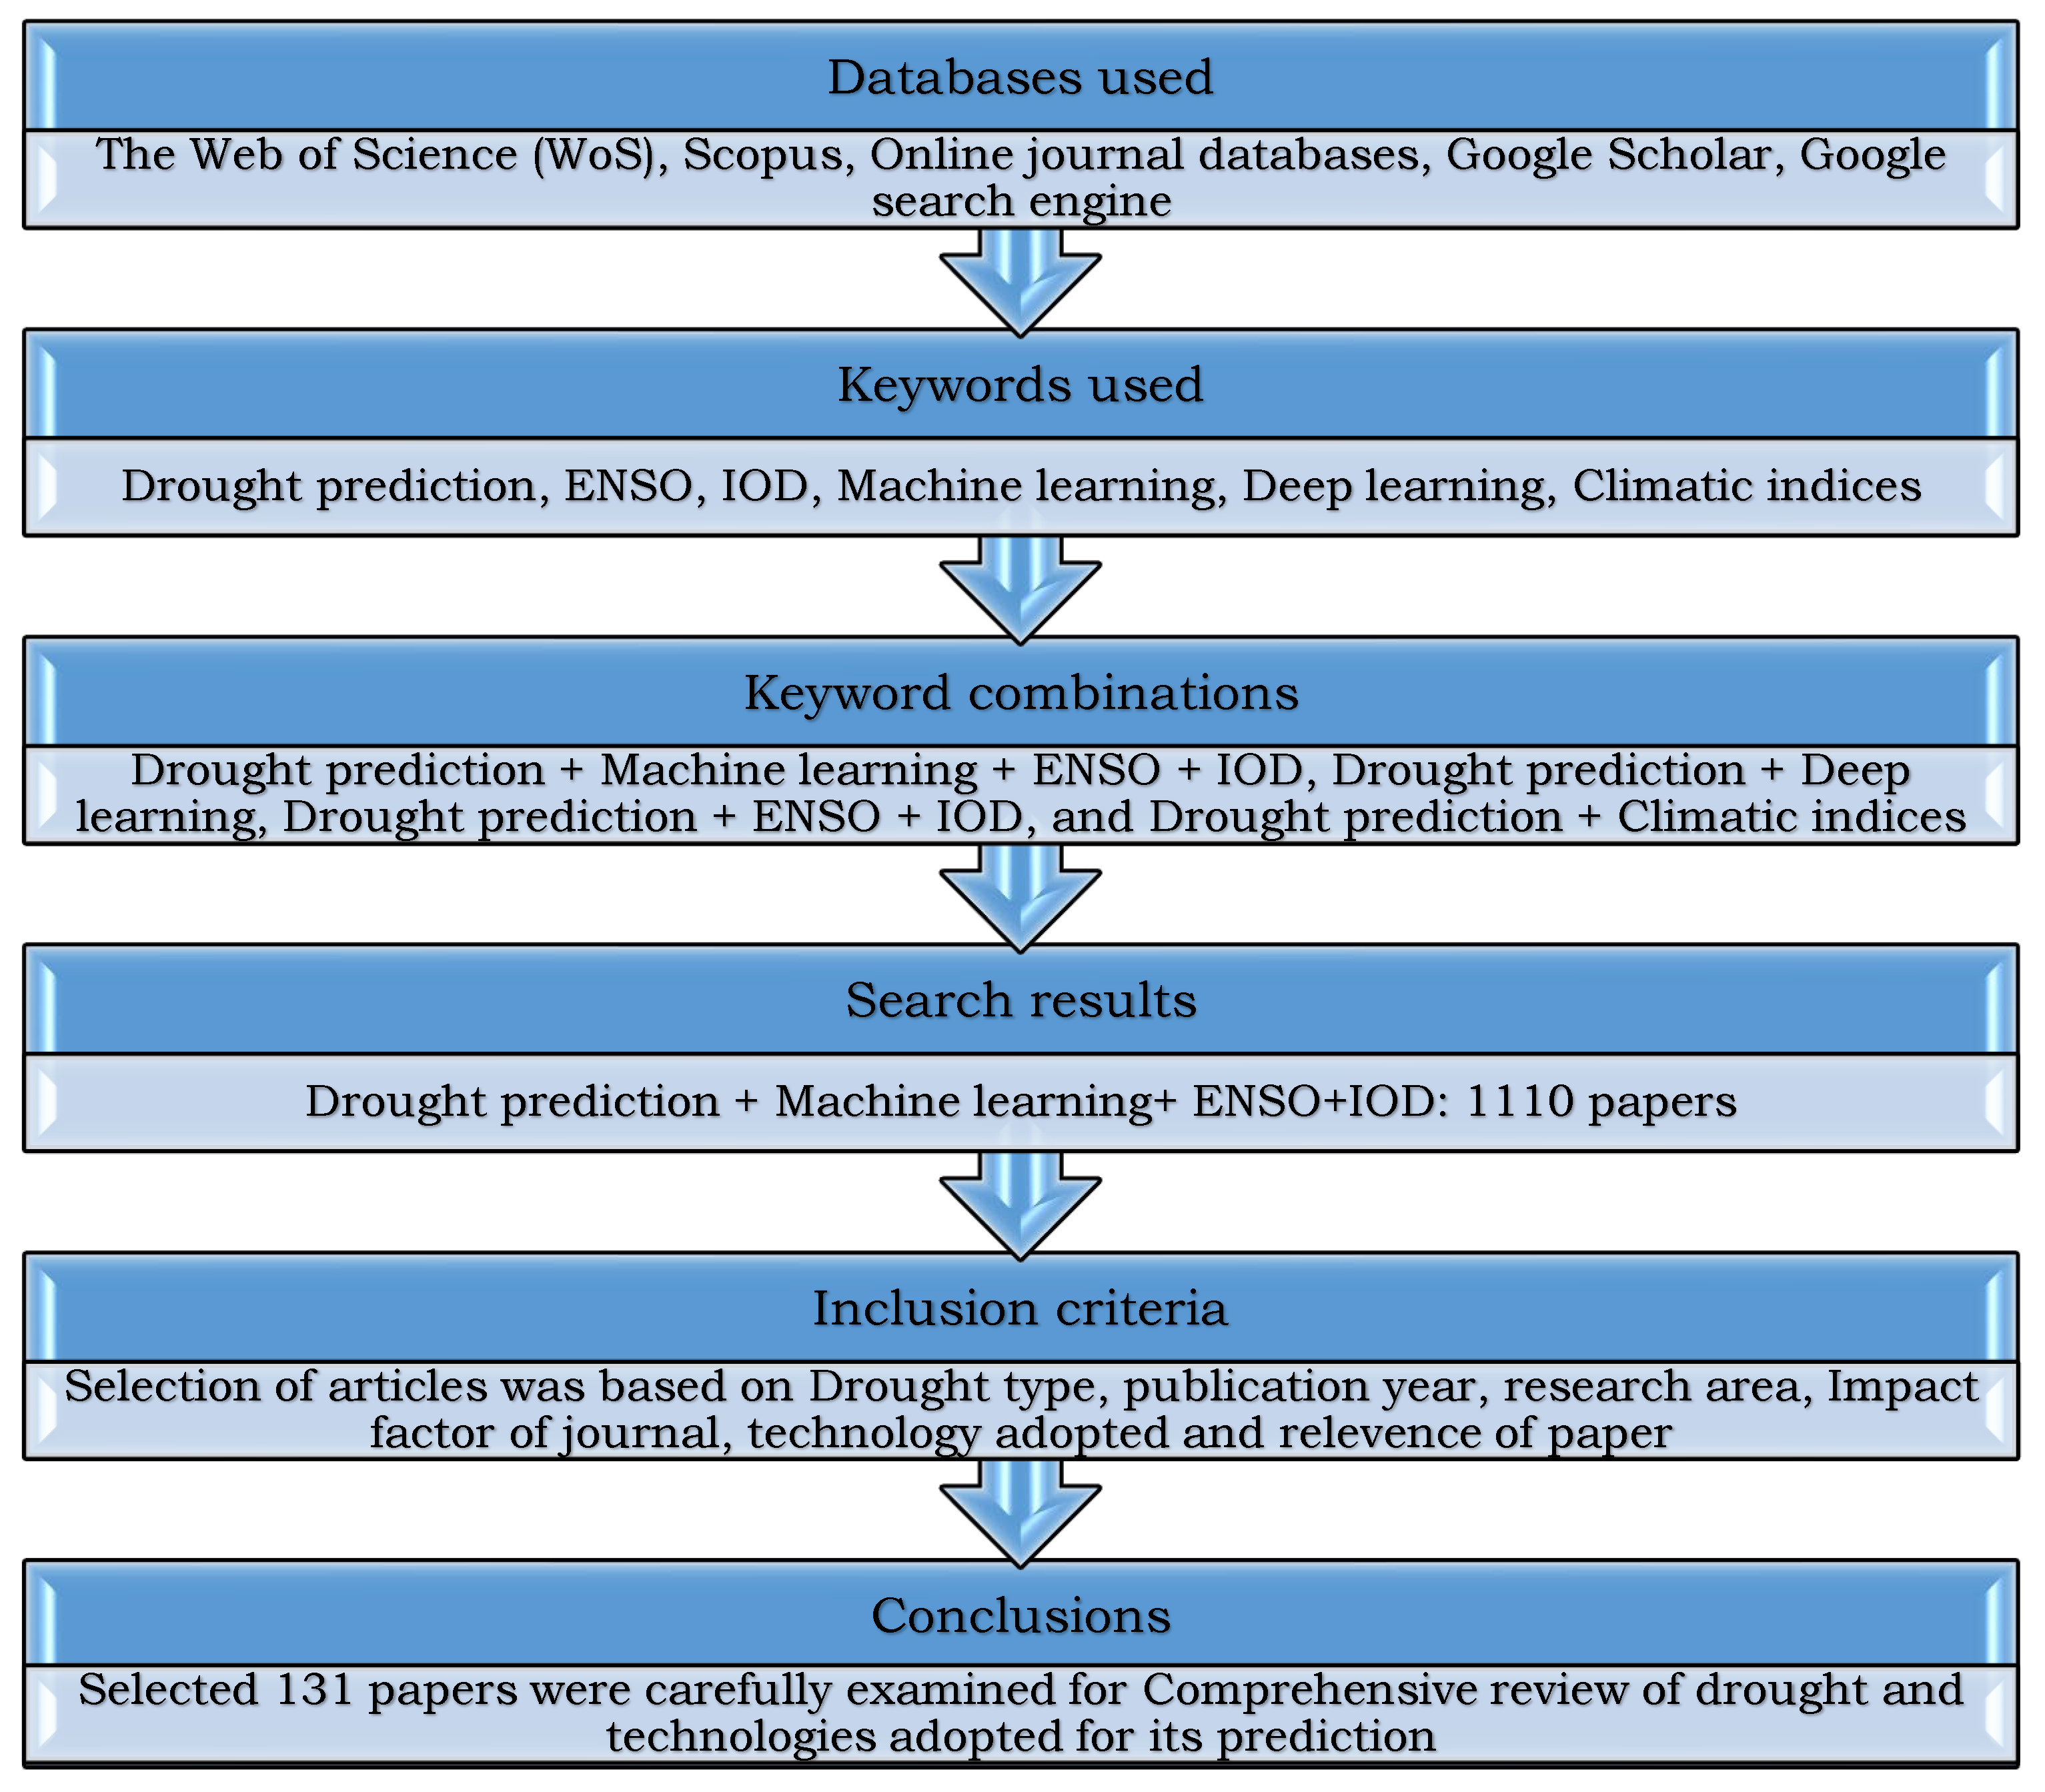
This study provides a comprehensive analysis of the existing literature related to the anticipation of drought through the utilization of advanced drought prediction methods. The detailed methodology adopted for this article is presented in
Figure 2. The research involved an extensive search in various databases, including the Web of Science (WoS) Core Collection Database, online journal databases, Google Scholar, and the Google search engine. Several relevant keywords were employed during the search, such as drought prediction, precipitation, temperature, ENSO, IOD, machine learning, deep learning, climatic indices, and related terms. Various combinations of these keywords were also utilized, including drought prediction + machine learning + ENSO + IOD, drought prediction + deep learning, drought prediction + ENSO + IOD, and drought prediction + climatic indices. Search results listed a total of 1110 research articles based on various keyword combinations. These papers focus on application areas like agriculture, hydrology, climate change, natural hazards, water resources, and the environment. The search was limited to studies published in the last 20 years to ensure comprehensive coverage of recent research.
Research articles were screened based on the titles and abstracts of the identified articles for relevance. The inclusion criteria were studies that focused on various drought prediction approaches, adopted technologies, and prediction accuracy. Discrepancies in study selection were resolved through discussion and consensus. Studies focusing on specific regions or using different methodologies were included to capture the diversity of the perspectives on drought. This paper restricted search results based on the publication year, a journal impact factor above two, the drought type, and the methodology adopted. Based on the above said criteria, a total of 131 papers were selected for this review paper to highlight drought prediction research.
3. Drought Modeling Components
Drought is an environmental catastrophe characterized by an extended period of unusually low precipitation, leading to water scarcity and posing risks to agriculture, livestock, and ecosystems. There are several parameters like precipitation, soil moisture, stream-flow, evapotranspiration, temperature, wind, relative humidity, and vegetation health which can help to gain insights into the severity and duration of drought events.
Drought studies require climatic, remote sensing (RS), hydrologic, and atmospheric data. The data can be acquired from various ground observation stations, earth observation satellites, open linked data, sensors, and the Internet of Things (IoT). So, the data is usually extracted from heterogeneous data sources in a heterogeneous format. It may be continuous, discrete, images, texts, videos, etc. [
17]. As earth observation systems continue to advance rapidly, remote sensing (RS) systems and climate sensing systems offer a wide range of high-resolution earth observations encompassing spatial, temporal, and radiometric measurements [
18,
19,
20]. Numerous efforts have been made to comprehend the connection between drought and its influencing factors and to enhance the precision of drought prediction [
21,
22,
23,
24,
25,
26,
27,
28,
29,
30,
31]. Improving the accuracy of drought forecasting models requires an understanding of the broad range connections, or tele-connections, between climatic indices and variables indicating drought occurrence such as precipitation, vegetation, and temperature.
3.1. Hydro-Meteorological Parameters
Hydrological and meteorological parameters play an important role in predicting drought. The key parameters that are used for drought prediction are: (i) Precipitation: it is the amount of rain or snowfall that occurs in a particular region. Low levels of precipitation can indicate the onset of drought conditions [
7]. (ii)Temperature: Elevated temperatures have the potential to accelerate evapotranspiration, resulting in reduced soil moisture and ultimately leading to the onset of drought conditions [
32]. (iii) Evapotranspiration: It is the mechanism by which water is moved from the surface of the Earth to the atmosphere through evaporation and plant transpiration. High rates of evapotranspiration can cause soil moisture deficits, leading to an increased risk of drought [
33]. (iv) Soil Moisture: Soil moisture is the water content in the soil. A lack of soil moisture can cause drought conditions. Soil moisture is influenced by precipitation, evapotranspiration, and other factors [
34]. (v) Stream-flow: Stream-flow is the amount of water that flows in a stream or river. A decrease in stream-flow over a prolonged period can indicate hydrological drought conditions [
35]. (vi) Groundwater level: The groundwater level is the depth at which water is found below the ground surface. A decrease in the groundwater level over a prolonged period can indicate drought conditions [
36]. (vii) Atmospheric conditions: These include factors that can influence precipitation patterns and the initiation of drought conditions, such as atmospheric pressure, humidity, wind speed, and direction [
37,
38,
39].
In order to anticipate the likelihood and severity of drought conditions, drought prediction models often combine these hydrological and meteorological information. Researchers and decision-makers can create efficient strategies for reducing the effects of drought on agriculture, water resources, and other crucial sectors by tracking these characteristics over time.
3.2. Climatological Parameters
Oceanic atmospheric parameters can significantly affect drought conditions. One of the most important factors is the El Niño–Southern Oscillation (ENSO), which is a natural climate phenomenon characterized by the periodic warming and cooling of the equatorial Pacific Ocean. During El Niño events, the sea surface temperatures in the central and eastern Pacific Ocean rise, resulting in changes in atmospheric circulation patterns that can alter rainfall patterns around the world. The patterns of ENSO phase variation can lead to large variations in precipitation in the tropical Pacific Ocean [
40]. Due to the potential tele-connections, ENSO is considered to be an important driver that can be used to predict climate change at different time scales in regional and global areas [
41,
42]. El Niño events have been linked to severe droughts in various regions, including Southeast Asia [
43,
44], Australia, and South America. The Oceanic Niño Index (ONI) and Niño 3.4 Index are the most commonly used indices to define ENSO (El Niño and La Niña) phases [
45,
46]. Several studies on drought forecasting have indicated the significant role of the Niño 3.4 index in both monitoring [
47,
48] and predicting drought events. Additionally, the Niño 3.4 index is known to exhibit an inverse relationship with rainfall [
49]. The Nino 3.4 index is used to monitor and predict drought conditions in the tropical Pacific Ocean region, including countries such as Australia, Indonesia, India, and parts of Africa and South America that are affected by the El Niño–Southern Oscillation (ENSO) climate phenomenon [
47,
48,
50,
51,
52,
53].
It has been observed [
54] that another important oceanic atmospheric parameter affecting drought is the Indian Ocean Dipole (IOD), which is a climate mode that describes the fluctuations in sea surface temperatures in the Indian Ocean. During positive IOD events, the western Indian Ocean becomes warmer than the eastern Indian Ocean, resulting in changes in atmospheric circulation that can impact rainfall patterns in regions such as East Africa, Southeast Asia [
55,
56], and Australia [
57].
In addition to ENSO and IOD, other oceanic atmospheric parameters, such as the Atlantic Multidecadal Oscillation (AMO) and the Pacific Decadal Oscillation (PDO), can also affect drought conditions. These climate modes describe the variability of sea surface temperatures in the Atlantic and Pacific Oceans, respectively, and can influence atmospheric circulation patterns and precipitation patterns in different regions of the world like Iran [
24,
52]. Overall, oceanic atmospheric parameters play a significant role in drought development, and their monitoring can help in predicting and managing drought conditions.
3.3. Drought Indicators
Drought indices are quantitative representations of drought severity computed using climatic or hydro-meteorological parameters. These indices combine various hydrological and meteorological parameters to assess drought conditions. By analyzing the changing patterns of precipitation, temperature, soil moisture, stream-flow, vegetation health, and snowpack in a region, one can observe the slow onset of drought. Drought indicators always help measure the qualitative state of drought and keep track of the propagation of droughts. These statistical measures are used to characterize the severity and duration of drought conditions.
There have been numerous drought indices developed throughout the years, which utilize different climatic and meteorological variables. Some of the popular representative indices are listed in
Table 1. Wayne Palmer developed the Palmer Drought Severity Index (PDSI) during the 1960s specifically for the United States Department of Agriculture [
8]. The PDSI is widely utilized as a drought index in various applications. It calculates the water balance equation to determine the moisture availability in the study region. This index has the advantage that it incorporates precipitation, temperature, and soil moisture, as well as previous PDSI values. But, it has the drawback of a time lag of 9 months, which is not suitable for rapid drought identification [
58,
59]. It is specifically designed to assess extended periods of abnormal weather conditions, encompassing both excessive rainfall and arid conditions. However, due to its slow responsiveness, the PDSI may not provide timely detection of short-term dry spells that could be detrimental to crops during crucial growth periods. The short-term agricultural drought conditions that impact crop growth can be monitored using the CMI. The CMI is determined by evaluating evapotranspiration deficits [
60]. PDSI and CMI have a limitation of assumption that Land Used Land Cover (LULC) and soil profile of the entire region is the same. In reality, the LULC and soil properties vary from place to place.
Drought assessment can be performed by observing vegetation health and land cover changes using remote sensing data. There exists a significant relationship between soil moisture and the NDVI, so the NDVI is the most popularly used the vegetation index [
61,
62,
63]. Drought stress can also be determined from remotely observed surface brightness temperatures captured by thermal channels from satellites [
64,
65]. The thermal infrared (TIR) band of satellite data can provide important information about surface moisture conditions [
66,
67]. The Temperature State Index (TCI) calculates temperature-related stress in plants based on TIR data. The evaporative stress index (ESI) is also useful for the evaluation and assessment of flash droughts [
68]. The World Meteorological Organization (WMO) is recommending the Standardized Precipitation Index (SPI) [
69] as a standard drought index [
70] that measures precipitation deficits over various time scales and can be used as a good indicator of short-term and long-term meteorological drought events. The SPI focuses solely on precipitation as a drought indicator. It does not consider other drought influential factors such as temperature, soil moisture, or evapotranspiration, which are also important in assessing drought severity.
Unlike the SPI, which only considers precipitation, the Standardized Precipitation Evapotranspiration Index (SPEI) [
71,
72] incorporates evapotranspiration, which is the combined loss of water from the Earth’s surface through evaporation from the soil and transpiration from the plants. By including evapotranspiration, the SPEI provides a more comprehensive measure of drought, considering both water inputs (precipitation) and outputs (evapotranspiration). The SPEI reflects the balance between precipitation and evapotranspiration, capturing the water deficit or surplus experienced in an area. The Crop Moisture Index (CMI) [
60] is specifically designed to assess agricultural drought. It integrates precipitation, soil moisture, and crop-specific evapotranspiration data to estimate crop moisture conditions and potential drought impacts on agriculture. The Soil Moisture Deficit Index (SMDI) and the Evapotranspiration Deficit Index (ETDI) are used as agricultural drought indicators which use soil moisture data from entire soil profile and evapotranspiration data, respectively. These two indices are good indicators of short-term drought events [
73,
74].
All these drought indicators provide meaningful information, but every individual drought index has its own merits and demerits [
75]. So, it will be helpful to use the composite drought index that takes into account region-based impactful drought indicators to build an accurate and powerful drought prediction system. Many studies proved that VCI coupled with TCI provides a powerful tool to monitor drought conditions [
76,
77,
78,
79]. There exists a strong correlation between drought indices such as the TCI, VCI, PCI, NDVI, and the Soil Moisture Condition Index (SMCI). Incorporating knowledge of such indices in drought prediction studies will improve forecast accuracy [
80,
81,
82]. Instead of using a single drought index, the integration of multiple drought indices will improve results in drought forecasting studies [
78,
79,
82].
4. Drought Models
Various drought prediction models are used to forecast drought conditions and the onset and duration of drought events. The commonly used types of drought prediction models are categorized into four categories: statistical, physical, machine learning, and deep learning models, as shown in
Figure 3. Caution should be exercised when choosing the method for forecasting drought, as it depends not only on the data series and regional characteristics [
83], but also on the concepts of the models or the algorithms used. Researchers may face difficulties in selecting the most suitable forecasting model from the vast range of options available. Furthermore, there is a possibility that the ideal model for their research could be overlooked if they are not familiar with the various models that exist.
4.1. Stochastic Models
These models use historical climate and hydrological data to estimate the probability of future drought conditions. Two linear stochastic models for forecasting droughts, the Autoregressive Integrated Moving Average (ARIMA) and the Multiplicative Seasonal Autoregressive Integrated Moving Average (SARIMA), are the most commonly used models. The ARIMA model is the most effective in predicting droughts in lead time [
84,
85,
86].
The ARIMA (Autoregressive Integrated Moving Average) model is a widely utilized method for both modeling and forecasting time series data [
87,
88]. It consists of three main components. Firstly, the autoregressive component captures the relationship between past and current values. Secondly, the integrated component is employed to transform the data into a stationary form. Lastly, the moving average component captures the relationship between past errors and current values.
Durdu [
89] developed the ARIMA and SARIMA models to predict drought in the Büyük Menderes River Basin using the SPI drought index. The results indicated that the ARIMA model outperformed the SARIMA model. However, it is important to note that ARIMA is a linear model that assumes stationarity, meaning it assumes the statistical properties of the data that remain constant over time. Consequently, the ARIMA model may not adequately capture complex nonlinear relationships or time-varying dynamics that can be present in certain drought data [
90].
The SARIMA (Seasonal Autoregressive Integrated Moving Average) model is an extension of ARIMA that is used for time series data that exhibits seasonal patterns [
91]. SARIMA models incorporate additional parameters to account for the periodic and seasonal patterns in the data. The seasonal autoregressive integrated moving average (SARIMA) models by monitoring the Vegetation Temperature Condition Index (VTCI) [
83] and the Standardized Precipitation Index (SPI) [
92], which provides good accuracy to predict droughts using time series data.
The SARIMAX multivariate model is created by adding parameter covariate variables (exogenous variables) to SARIMA. Arjmandi Harat [
93] performed comparative studies on SARIMA and SARIMAX with precipitation and potential evapotranspiration as predictors by monitoring the Reconnaissance Drought Index (RDI). The SARIMAX model yields higher accuracy as compared to SARIMA.
Both the ARIMA and SARIMA models can be used for drought prediction by modeling the historical time series of drought-related variables such as precipitation, temperature, potential evapotranspiration, or stream-flow. These models can then be used to make forecasts of future values of the variable, which can be used to predict drought conditions. However, it is important to note that these models are statistical in nature and cannot account for all the complex factors that influence drought, such as land use change and climate change, and do not provide spatial extent of prevailing drought.
4.2. Physical Models
Through the representation of the intricate connections between numerous hydrological cycle components using mathematical or physical equations, physical models replicate the behavior of drought. The Soil and Water Assessment Tool (SWAT), the Drought Monitoring and Forecasting System (DMFS), and the Variable Infiltration Capacity (VIC) model [
94] are a few examples.
The VIC is a macro-scale hydrologic model that simulates the hydrologic cycle on the land surface by using the responses to the water and energy balance equations. This model is frequently used to predict droughts [
95,
96]. By taking into account variables such as precipitation, evapotranspiration, soil moisture, and runoff, it mimics the water balance of a basin. As a physically based model that takes into consideration geographic variation in the landscape, the VIC is especially helpful for forecasting drought in broad basins. This model has demonstrated its effectiveness in numerous river basins [
97,
98,
99,
100] by simulating intricate relationships among water, energy, and vegetation through the use of soil properties and meteorological datasets for the grid-based discretization of the land surface [
101,
102].
Another well-liked hydrologic model for drought forecasting is SWAT (Soil and Water Assessment Tool). It models the water balance of a basin similarly to the VIC, but it also takes into consideration how changes in land use and land cover affect hydrologic processes [
103]. The SWAT is especially helpful for forecasting how land management techniques, including crop rotation and irrigation, would affect the drought. Using the SWAT and VIC models, Dash [
104] evaluated the accuracy of evapotranspiration data for catchment-scale drought assessment and irrigation planning. The study proved that the SWAT gives consistent results, whereas the VIC-3L gives underestimated or overestimated results. Kang and Sridhar [
105] studied short-term drought forecasting using the SWAT and VIC models in the United States, where both models produced acceptable forecasting accuracy. Under the changing climate scenario, the SWAT model can also be used for analyzing the trend of runoff and predicting future hydrologic drought events [
106]. The SWAT is a surface water model that has some demerits, such as it cannot model groundwater flows [
107]. The power of the SWAT model can be increased by coupling it with other techniques such as Copula (SWAT-Copula) [
104] and Water Evaluation and Planning (SWAT-WEAP) [
108].
4.3. Machine Learning Models
Machine learning (ML) models are increasingly being used for drought forecasting due to their ability to identify complex patterns and relationships in the data. These models use algorithms to learn patterns from historical climate and hydrological data and use this knowledge to predict future drought conditions. Some commonly used ML models for drought forecasting are included in the following: Random Forest (RF), Artificial Neural Networks (ANNs), and Support Vector Machines (SVMs).
4.3.1. Support Vector Machines (SVMs)
SVMs are a type of ML model that can be used for classification or regression tasks. They work by finding the hyperplane that maximally separates the data points into different classes or predicts the values of a dependent variable. SVMs significantly proved accuracy in drought prediction using different kernel functions: the Normalized poly kernel, the Pearson universal kernel, and the Radial basis kernel [
13,
109]. The Least Square Support Vector Machine (LSSVM) also showed an improved performance for the prediction of drought in eastern Australia by forecasting the SPI in eastern Australia [
110]. Achite [
111] used a SVM for forecasting meteorological and hydrological droughts in the Wadi Ouahrane basin located in the northern region of Algeria. They developed four machine learning methods, where the SVM outperform all other techniques with a 0.95 coefficient of determination. SVMs also proved significant accuracy for predicting hydrological droughts [
112].
The SVM performance can be increased by preprocessing the input time series data. Zhu [
113] has shown that using in situ precipitation as input to the SVM gives the best performance for soil moisture prediction as well as predicting the Soil Water Deficit Index (SWDI) as a drought index. Pham [
114] coupled the SVM with a time-series analysis technique, Singular Spectrum Analysis (SSA), to decompose a time series into a set of components that capture different types of variability. The SPI3 and SPI6 drought indices were used as the output in drought forecasting models. This study gives improved results for the SVM by preprocessing the data using a SSA.
4.3.2. Random Forest (RF)
Random Forest (RF) is an ensemble learning technique that utilizes multiple decision trees to generate predictions. The construction of each tree involves using a random subset of the available data, and the final prediction is obtained by aggregating the outputs of all the trees. The RF approach for drought prediction does not impose any constraints on the relationships between the drought index series, and it does not rely on any predefined assumptions regarding the distribution of model errors.
Chen [
115] demonstrated that the random forest algorithm is more consistent and reliable over ARIMA for long- and short-term drought predictions by predicting the SPI as the drought index. Dikshit [
28] conducted a study to forecast drought at short-term scales (1 and 3 months) for the New South Wales (NSW) region of Australia using the SPEI as the drought indicator.
The Random Forest algorithm is ideal for analyzing large datasets, making it a suitable choice for tasks involving satellite imagery. One of the main benefits of this algorithm is that it creates a tree-based regression function, eliminating the need for scale adjustments between different input parameters. This is particularly advantageous when working with multiple input parameters that have different scales. Park [
116] developed a Severe Drought Area Prediction (SDAP) model for short-term drought. They excluded meteorological data and analyzed various parameters that are responsible for changes in the Soil Moisture Index as a drought parameter using the Random Forest (RF) algorithm over the satellite data.
4.3.3. Artificial Neural Networks (ANNs)
ANNs are a type of ML model that can be trained to recognize patterns in time series data and make predictions based on those patterns. Barua [
117] developed the Nonlinear Aggregated Drought Index (NADI) which takes into account overall dryness within the system to identify drought conditions using two ANN forecasting models, namely a Recursive MultiStep Neural Network (RMSNN) and a Direct MultiStep Neural Network (DMSNN), where both models outperformed the ARIMA model by producing improved predictions. Employing advanced input representations in artificial intelligence-based solutions can lead to promising success in predicting drought for hydro-meteorological variables, especially in intricate geographical scenarios.
Machine learning models for drought forecasting typically require large amounts of data to train and validate. They can incorporate a variety of data sources, including meteorological data, remote sensing data, hydrological data, and land-use data. ML models have the potential to provide accurate and timely drought forecasts, but they require careful evaluation and validation to ensure their reliability and accuracy.
4.3.4. Deep Learning Models
Deep learning (DL) is a branch of machine learning (ML) that employs deep artificial neural networks consisting of multiple layers to uncover intricate patterns from the data. The DL models have shown promising results for drought prediction by capturing nonlinear relationships in the data. The effectiveness of DL models in the context of drought prediction arises from their capacity to capture intricate patterns and non-linear connections within the data.
Convolutional Neural Networks (CNNs) are frequently utilized in image recognition applications, but they can also be used to anticipate droughts using time series data such as meteorological data. CNNs use filters to identify spatial and temporal patterns in the data and can automatically learn to extract relevant features. The CNN was found to be the most computationally efficient model for drought prediction using satellite images, requiring less time and computational resources for training and prediction [
118,
119].
Recurrent Neural Networks (RNNs) have been developed to analyze sequential data, making them ideal for time series data such as drought indices. RNNs use a hidden state to maintain information from previous time steps and can learn long-term dependencies in the data.
Long Short-Term Memory (LSTM) Networks are a type of RNN that can recall or forget information from earlier time steps selectively. LSTMs have been demonstrated to be very successful when dealing with time series data with long-term dependencies [
30,
39,
120].
DL models for drought prediction can incorporate a variety of data sources, including meteorological data, remote sensing data, hydrological data, and land-use data. DL models have shown promising results for drought prediction, outperforming traditional statistical models in some cases. However, DL models can be computationally intensive and require large amounts of data for training and validation. Careful evaluation and validation are necessary to ensure the reliability and accuracy of DL models for drought prediction.
4.3.5. Hybrid Models
Hybrid models for drought forecasting combine the strengths of different modeling approaches to improve the accuracy and reliability of drought predictions. Hybrid models typically consist of two or more models that are integrated to provide more robust and accurate predictions than any one model alone.
The ARIMA method is known for its accurate forecasting and versatility in modeling various types of time series data. However, it is limited by its requirement for linear data, which makes it unsuitable for complex non-linear time series modeling [
121]. On the other hand, ANNs are able to effectively address this limitation, although their performance can be variable for time series data that are relatively linear. Khan [
122] developed a Wavelet based hybrid ANN-ARIMA model that combines the strengths of each model to develop a robust model.
Ganguli and Reddy [
123] developed ensemble drought prediction models over Western Rajasthan (India) using a SVM–copula approach. They incorporated large scale climatic indices such as ENSO, IOD, and AMO to predict meteorological droughts using the Standardized Precipitation Index (SPI). Their ensemble model demonstrated superior accuracy compared to individual models such as the adaptive neuro-fuzzy interference system (ANFIS), multilayer perceptron (MLP), artificial neural networks (ANN), support vector machine (SVM), autoregressive integrated moving average (ARIMA), and ANN models [
124].
Hybrid models, such as the Dragonfly Algorithm-SVM [
125] and the Nomadic People Algorithm (NPA) in conjunction with SVM, ANFIS, MLP, and ANN [
126], outperformed the individual models mentioned previously. These hybrid models exhibit an enhanced performance in drought prediction, providing better accuracy and more reliable estimations of uncertainty associated with drought forecasts.
Furthermore, wavelets, which are mathematical functions capable of analyzing signals across time, frequency, and scale domains, can also be employed in drought prediction. The WSVM approach applies a wavelet transform to the input data to decompose it into different frequency components. These components are then used as inputs to an SVM algorithm, which is trained to classify or predict the target variable. The wavelet-support vector machine (WSVM) is a machine learning technique that combines wavelet analysis and support vector machine (SVM) algorithms to improve the accuracy of drought prediction. Komasi [
127] used the WSVM for drought prediction using the Standardized Precipitation Index (SPI).
A hybrid intelligent model called LSTM-ELM combines the power of a long short-term memory (LSTM) neural network with an extreme learning machine (ELM) that can effectively handle the nonlinearity and complexity of meteorological drought forecasting. The hybrid LSTM-ELM model outperforms the LSTM and ELM models in terms of accuracy and robustness [
128].
Hybrid models for drought forecasting can provide more accurate and reliable predictions than any one model alone, but they require careful evaluation and validation to ensure their reliability and accuracy. The choice of models to combine, the weighting of individual models, and the integration method all have important implications for the accuracy and reliability of the final predictions.
5. Result and Discussion
The evolving climate patterns, characterized by the alterations in temperature, precipitation, and extreme weather occurrences, have substantial implications for forecasting droughts. The variability in climate data due to climate change poses challenges for traditional statistical models. Various drought prediction techniques are listed in
Table 2. From
Table 2, it is clear that machine learning and deep learning algorithms are inherently adaptable and can account for non-linear relationships, making them well-suited for capturing and predicting complex climate patterns associated with droughts under the changing climatic conditions. Leveraging machine learning and deep learning methods enables the capture and analysis of intricate connections between the climate variables and the onset of droughts amidst shifting climate conditions.
The incorporation of climatic indices that play a significant role in the changing climate, namely ENSO (El Niño–Southern Oscillation) and IOD (Indian Ocean Dipole), has demonstrated its critical role in enhancing the effectiveness of drought prediction models. By utilizing these indices as predictors, valuable information regarding the macro-scale climate patterns influencing regional and global drought dynamics can be obtained. These strong correlations are observed between ENSO, IOD, and drought occurrences. When these indices were integrated into drought prediction models, it resulted in enhanced accuracy and reliability [
47,
48,
49,
50,
51].
The selection of a suitable model for drought prediction depends on various factors. The availability of the data, desired level of accuracy, and intended use of the predictions play a crucial role in determining the appropriate model. Each model has its own strengths and weaknesses. No single model can be deemed as the best choice for all situations. Ensemble models, a combination of different model types, can be employed to enhance the accuracy and reliability of drought predictions. The complexity of drought, along with its relationship with the input variables and data characteristics, emphasizes the importance of considering periodicity in drought forecasting. Furthermore, the study findings indicate that the accuracy of the models is influenced by geographic and seasonal factors too. These insights highlight the significance of incorporating geographic and seasonal considerations to improve model accuracy in drought prediction [
23,
25,
28].
Challenges in Drought Prediction
Despite advances in drought prediction models and techniques, there are still several challenges in accurately predicting drought events. Drought prediction is a complex task that involves a variety of challenges, including:
Data Availability and Quality: Drought prediction requires the availability of high-quality data on a variety of factors that contribute to drought, such as temperature, precipitation, soil moisture, vegetation health, climatic factors, and groundwater levels. However, data availability can be limited in some regions, and the quality of the data can be affected due to various factors such as manual errors, sensor errors, data gaps, and inconsistencies.
Complexity of Drought Processes: Accurately predicting drought requires an understanding of the underlying processes that contribute to drought and the interactions between them. Drought is the most complex and multifaceted phenomenon that involves a variety of physical, meteorological, climatic, social, and economic factors, which increases the complexity level of drought prediction systems.
Uncertainty and Variability: Drought prediction is inherently uncertain due to the complexity and variability of the underlying processes. Uncertainty can arise from a variety of sources, such as data quality, model uncertainty, natural variability, and climate change. The data available is also on different scales and formats. Integrating the data into a uniform platform is a major hurdle.
Time and Spatial Scales: Droughts can occur at a variety of temporal and spatial scales. It has a wide scope from seasonal to decadal and from local to regional or even to a global scale.
Model Uncertainty: Drought prediction models are inherently uncertain due to the complex and dynamic nature of drought. There are many factors that influence drought, and models may not capture all of these factors. Additionally, the choice of the modeling approach and input data can also impact the accuracy of the drought predictions.
Climate Change: The anticipation of drought events is becoming increasingly challenging in many regions due to the projected rise in frequency and the severity of such events caused by climate change. Climate models may not encompass all the intricate feedback mechanisms that contribute to the occurrence of drought under the evolving climatic conditions.
Addressing these challenges requires a multi-disciplinary approach that incorporates expertise from a variety of fields, including meteorology, hydrology, ecology, sociology, and economics.
Satellite imagery and remote sensing data provide valuable information about climatic and environmental factors affecting drought occurrence. These advanced techniques enable the analysis and mapping of various drought-related parameters, such as rainfall, vegetation indices, evapotranspiration, precipitation patterns, soil moisture content, vegetation health, and land surface temperature. By integrating and analyzing these spatial datasets, researchers can detect and monitor drought conditions over large areas, including remote and inaccessible regions, and also identify areas at a higher risk of drought and assess the severity and spatial extent of drought conditions. Geospatial techniques facilitate downscaling and spatial interpolation of climate data, enabling predictions at finer resolutions. This process improves the representation of fine-scale climate patterns and enhances the accuracy of drought predictions in specific regions. Advanced geospatial techniques leverage spatial data, remote sensing technologies, and geographic information systems (GIS) to improve our understanding and forecasting of drought dynamics.
Considering the influence of changing climate on drought patterns, the integration of advanced geospatial techniques with machine learning and deep learning methods becomes even more crucial in drought prediction research. These techniques offer the potential to capture complex climate relationships, adapt to non-stationarity, and provide reliable predictions in a rapidly evolving climate. This results in enabling more effective drought management and resilience-building strategies. Generating high-resolution climate data from coarse-resolution global climate models plays a crucial role in linking large-scale climate patterns to local-scale drought prediction. Machine learning and deep learning methods can be employed in downscaling to enhance the spatial and temporal resolution of climate data, enabling more accurate and localized drought predictions. Additionally, advancements in geo-spatial techniques and advanced data collection methods can help to improve the accuracy and reliability of drought prediction models.
6. Conclusions
This review paper has provided a comprehensive analysis of various drought prediction models and the technologies utilized in drought prediction. The discussion of a diverse range of models has shed light on the scope, complexity, and challenges associated with accurately forecasting drought events. Each model, from statistical approaches to machine learning algorithms, has demonstrated its unique strengths and limitations in capturing the intricate patterns of drought.
Machine learning and deep learning techniques have emerged as effective tools for drought prediction, enabling the identification of drought impacts more efficiently than traditional methods. These techniques assist in identifying and reducing the effects of drought more quickly than conventional methods. The integration of advanced technologies, such as remote sensing, climate data, and hydrological models, has significantly enhanced the speed and accuracy of drought prediction.
In addition to meteorological or physical parameters, it is important to consider external driving forces for drought occurrence, such as SST anomalies and region-specific climatic indices like the Pacific Decadal Oscillation (PDO), the El Niño–Southern Oscillation (ENSO), and the Indian Ocean Dipole (IOD). Investigating the use of these climatic indices can improve the results of drought forecasting.
In the future research, it should focus on expanding the utilization of advanced geospatial techniques in conjunction with machine learning and deep learning methods to develop more robust and accurate drought prediction models. Machine learning and deep learning models have a drawback that they require a large amount of data, time, and computing resources. Increasing the amount of data subsequently increases model prediction accuracy. Using advanced geospatial techniques, huge amounts of data can be utilized using high temporal as well as spatial resolution.
To mitigate the challenge of computational resources, researchers should explore techniques that reduce computational costs and time in the drought prediction system. Potential approaches to reduce computation time include hardware optimization, data preprocessing, parallel processing, hyper parameter optimization, and transfer learning. Leveraging cloud computing platforms or distributed systems can also provide scalable resources for more efficient drought prediction.
By advancing research in these areas and adopting innovative strategies, the field of drought prediction can make significant progress in improving accuracy, reducing computational requirements, and ultimately enhancing drought management and mitigation efforts.
Author Contributions
Conceptualization, N.N. and T.P.S.; methodology, N.N. and T.P.S.; formal analysis, N.N. and T.P.S.; investigation, N.N., T.P.S., S.N. and M.T.; resources, N.N., T.P.S., S.N. and M.T.; writing—original draft preparation, N.N. and T.P.S.; writing—review and editing, N.N., T.P.S., S.N. and M.T.; supervision, N.N., T.P.S., S.N. and M.T. All authors have read and agreed to the published version of the manuscript.
Funding
This research received no external funding.
Institutional Review Board Statement
This article does not include human or animal studies conducted by any of the authors.
Informed Consent Statement
Not applicable.
Data Availability Statement
Not applicable.
Acknowledgments
N.N. and T.P.S. would like to express their gratitude to the Symbiosis Institute of Geoinformatics, Symbiosis International (deemed) University, Pune for their extensive cooperation during the research work.
Conflicts of Interest
The authors declare that they have no competing interest.
References
- Wilhite, D.A.; Svoboda, M.D.; Hayes, M.J. Understanding the complex impacts of drought: A key to enhancing drought mitigation and preparedness. Water Resour. Manag. 2007, 21, 763–774. [Google Scholar] [CrossRef]
- Bevan, J. Drought risk in the Anthropocene: From the jaws of death to the waters of life. Philos. Trans. R. Soc. A Math. Phys. Eng. Sci. 2022, 380, 20220003. [Google Scholar] [CrossRef]
- Wilhite, D.A.; Pulwarty, R.S. Drought as hazard: Understanding the natural and social context. In Drought and Water Crises: Integrating Science, Management, and Policy, 2nd ed.; CRC Press: Boca Raton, FL, USA, 2017. [Google Scholar] [CrossRef]
- Van Loon, A.F. Hydrological drought explained. WIREs Water 2015, 2, 359–392. [Google Scholar] [CrossRef]
- Kiem, A.S.; Johnson, F.; Westra, S.; van Dijk, A.; Evans, J.P.; O’donnell, A.; Rouillard, A.; Barr, C.; Tyler, J.; Thyer, M.; et al. Natural hazards in Australia: Droughts. Clim. Chang. 2016, 139, 37–54. [Google Scholar] [CrossRef]
- Wilhite, D.A.; Glantz, M.H. Understanding: The Drought Phenomenon: The Role of Definitions. Water Int. 1985, 10, 111–120. [Google Scholar] [CrossRef]
- Mishra, A.K.; Singh, V.P. Drought modeling—A review. J. Hydrol. 2011, 403, 157–175. [Google Scholar] [CrossRef]
- Palmer, W.C. Meteorological Drought; Research Paper No. 45; US Department of Commerce Weather Bureau: Washington, DC, USA, 1965; p. 58. Available online: https://www.ncdc.noaa.gov/temp-and-precip/drought/docs/palmer.pdf (accessed on 10 December 2018).
- Faghmous, J.H.; Kumar, V. A Big Data Guide to Understanding Climate Change: The Case for Theory-Guided Data Science. Big Data 2014, 2, 155–163. [Google Scholar] [CrossRef]
- Luo, L.; Apps, D.; Arcand, S.; Xu, H.; Pan, M.; Hoerling, M. Contribution of temperature and precipitation anomalies to the California drought during 2012–2015. Geophys. Res. Lett. 2017, 44, 3184–3192. [Google Scholar] [CrossRef]
- Dai, A. Drought under global warming: A review. WIREs Clim. Chang. 2011, 2, 45–65. [Google Scholar] [CrossRef]
- Mishra, A.K.; Singh, V.P. A review of drought concepts. J. Hydrol. 2010, 391, 202–216. [Google Scholar] [CrossRef]
- Khan, N.; Sachindra, D.; Shahid, S.; Ahmed, K.; Shiru, M.S.; Nawaz, N. Prediction of droughts over Pakistan using machine learning algorithms. Adv. Water Resour. 2020, 139, 103562. [Google Scholar] [CrossRef]
- Madani, K.; AghaKouchak, A.; Mirchi, A. Iran’s Socio-economic Drought: Challenges of a Water-Bankrupt Nation. Iran. Stud. 2016, 49, 997–1016. [Google Scholar] [CrossRef]
- Mathbout, S.; Lopez-Bustins, J.A.; Martin-Vide, J.; Bech, J.; Rodrigo, F.S. Spatial and temporal analysis of drought variability at several time scales in Syria during 1961–2012. Atmos. Res. 2018, 200, 153–168. [Google Scholar] [CrossRef]
- Wu, J.; Chen, X. Spatiotemporal trends of dryness/wetness duration and severity: The respective contribution of precipitation and temperature. Atmos. Res. 2019, 216, 176–185. [Google Scholar] [CrossRef]
- Kamilaris, A.; Kartakoullis, A.; Prenafeta-Boldú, F.X. A review on the practice of big data analysis in agriculture. Comput. Electron. Agric. 2017, 143, 23–37. [Google Scholar]
- Xia, J.; Yang, C.; Li, Q. Building a spatiotemporal index for Earth Observation Big Data. Int. J. Appl. Earth Obs. Geoinf. 2018, 73, 245–252. [Google Scholar] [CrossRef]
- Lewis, A.; Lymburner, L.; Purss, M.B.J.; Brooke, B.; Evans, B.; Ip, A.; Dekker, A.G.; Irons, J.R.; Minchin, S.; Mueller, N.; et al. Rapid, high-resolution detection of environmental change over continental scales from satellite data—The Earth Observation Data Cube. Int. J. Digit. Earth 2015, 9, 106–111. [Google Scholar] [CrossRef]
- Desconnets, J.-C.; Giuliani, G.; Guigoz, Y.; Lacroix, P.; Mlisa, A.; Noort, M.; Ray, N.; Searby, N.D. GEOCAB Portal: A gateway for discovering and accessing capacity building resources in Earth Observation. Int. J. Appl. Earth Obs. Geoinf. 2017, 54, 95–104. [Google Scholar] [CrossRef]
- Özger, M.; Mishra, A.K.; Singh, V.P. Low frequency drought variability associated with climate indices. J. Hydrol. 2009, 364, 152–162. [Google Scholar] [CrossRef]
- Marj, A.F.; Meijerink, A.M.J. Agricultural drought forecasting using satellite images, climate indices and artificial neural network. Int. J. Remote Sens. 2011, 32, 9707–9719. [Google Scholar] [CrossRef]
- Deo, R.C.; Şahin, M. Application of the Artificial Neural Network model for prediction of monthly Standardized Precipitation and Evapotranspiration Index using hydrometeorological parameters and climate indices in eastern Australia. Atmos. Res. 2015, 161–162, 65–81. [Google Scholar] [CrossRef]
- Choubin, B.; Khalighi-Sigaroodi, S.; Malekian, A.; Ahmad, S.; Attarod, P. Drought forecasting in a semi-arid water-shed using climate signals: A neuro-fuzzy modeling approach. J. Mt. Sci. 2014, 11, 1593–1605. [Google Scholar]
- Deo, R.C.; Salcedo-Sanz, S.; Carro-Calvo, L.; Saavedra-Moreno, B. Drought prediction with standardized precipitation and evapotranspiration index and support vector regression models. In Integrating Disaster Science and Management; Elsevier: Amsterdam, The Netherlands, 2018; pp. 151–174. [Google Scholar]
- Memarian, H.; Bilondi, M.P.; Rezaei, M. Drought prediction using co-active neuro-fuzzy inference system, validation, and uncertainty analysis (case study: Birjand, Iran). Theor. Appl. Clim. 2015, 125, 541–554. [Google Scholar] [CrossRef]
- Tian, Y.; Xu, Y.-P.; Wang, G. Agricultural drought prediction using climate indices based on Support Vector Regression in Xiangjiang River basin. Sci. Total Environ. 2018, 622–623, 710–720. [Google Scholar] [CrossRef]
- Dikshit, A.; Pradhan, B.; Alamri, A.M. Short-Term Spatio-Temporal Drought Forecasting Using Random Forests Model at New South Wales, Australia. Appl. Sci. 2020, 10, 4254. [Google Scholar] [CrossRef]
- Rashid, M.M.; Sharma, A.; Johnson, F. Multi-model drought predictions using temporally aggregated climate indicators. J. Hydrol. 2020, 581, 124419. [Google Scholar] [CrossRef]
- Dikshit, A.; Pradhan, B.; Alamri, A.M. Long lead time drought forecasting using lagged climate variables and a stacked long short-term memory model. Sci. Total Environ. 2021, 755, 142638. [Google Scholar] [CrossRef]
- Başakın, E.E.; Ekmekcioğlu, Ö.; Özger, M. Drought prediction using hybrid soft-computing methods for semi-arid region. Model. Earth Syst. Environ. 2020, 7, 2363–2371. [Google Scholar] [CrossRef]
- Jeong, D.I.; Sushama, L.; Khaliq, M.N. The role of temperature in drought projections over North America. Clim. Chang. 2014, 127, 289–303. [Google Scholar] [CrossRef]
- Teuling, A.J.; Van Loon, A.F.; Seneviratne, S.I.; Lehner, I.; Aubinet, M.; Heinesch, B.; Bernhofer, C.; Grünwald, T.; Prasse, H.; Spank, U. Evapotranspiration amplifies European summer drought. Geophys. Res. Lett. 2013, 40, 2071–2075. [Google Scholar] [CrossRef]
- Cammalleri, C.; Micale, F.; Vogt, J. A novel soil moisture-based drought severity index (DSI) combining water deficit magnitude and frequency. Hydrol. Process. 2015, 30, 289–301. [Google Scholar] [CrossRef]
- Myronidis, D.; Ioannou, K.; Fotakis, D.; Dörflinger, G. Streamflow and Hydrological Drought Trend Analysis and Forecasting in Cyprus. Water Resour. Manag. 2018, 32, 1759–1776. [Google Scholar] [CrossRef]
- Halder, S.; Roy, M.B.; Roy, P.K. Analysis of groundwater level trend and groundwater drought using Standard Groundwater Level Index: A case study of an eastern river basin of West Bengal, India. SN Appl. Sci. 2020, 2, 507. [Google Scholar] [CrossRef]
- McVicar, T.R.; Roderick, M.L.; Donohue, R.J.; Li, L.T.; Van Niel, T.G.; Thomas, A.; Grieser, J.; Jhajharia, D.; Himri, Y.; Mahowald, N.M.; et al. Global review and synthesis of trends in observed terrestrial near-surface wind speeds: Implications for evaporation. J. Hydrol. 2012, 416–417, 182–205. [Google Scholar] [CrossRef]
- Ficklin, D.L.; Maxwell, J.T.; Letsinger, S.L.; Gholizadeh, H. A climatic deconstruction of recent drought trends in the United States. Environ. Res. Lett. 2015, 10, 044009. [Google Scholar] [CrossRef]
- Mokhtar, A.; Jalali, M.; He, H.; Al-Ansari, N.; Elbeltagi, A.; Alsafadi, K.; Abdo, H.G.; Sammen, S.S.; Gyasi-Agyei, Y.; Rodrigo-Comino, J. Estimation of SPEI Meteorological Drought Using Machine Learning Algorithms. IEEE Access 2021, 9, 65503–65523. [Google Scholar] [CrossRef]
- Choi, K.-Y.; Vecchi, G.A.; Wittenberg, A.T. Nonlinear Zonal Wind Response to ENSO in the CMIP5 Models: Roles of the Zonal and Meridional Shift of the ITCZ/SPCZ and the Simulated Climatological Precipitation. J. Clim. 2015, 28, 8556–8573. [Google Scholar] [CrossRef]
- Zhou, P.; Liu, Z.; Cheng, L. An alternative approach for quantitatively estimating climate variability over China under the effects of ENSO events. Atmospheric Res. 2020, 238, 104897. [Google Scholar] [CrossRef]
- Zhou, T.; Yu, R. Twentieth-Century Surface Air Temperature over China and the Globe Simulated by Coupled Climate Models. J. Clim. 2006, 19, 5843–5858. [Google Scholar] [CrossRef]
- Ashok, K.; Guan, Z.; Saji, N.H.; Yamagata, T. Individual and Combined Influences of ENSO and the Indian Ocean Dipole on the Indian Summer Monsoon. J. Clim. 2004, 17, 3141–3155. [Google Scholar] [CrossRef]
- Kripalani, R.H.; Kulkarni, A.; Sabade, S.S.; Khandekar, M.L. Indian Monsoon Variability in a Global Warming Scenario. Nat. Hazards 2003, 29, 189–206. [Google Scholar] [CrossRef]
- Abbot, J.; Marohasy, J. Input selection and optimisation for monthly rainfall forecasting in Queensland, Australia, using artificial neural networks. Atmos. Res. 2014, 138, 166–178. [Google Scholar] [CrossRef]
- Özger, M.; Mishra, A.K.; Singh, V.P. Long Lead Time Drought Forecasting Using a Wavelet and Fuzzy Logic Combination Model: A Case Study in Texas. J. Hydrometeorol. 2012, 13, 284–297. [Google Scholar] [CrossRef]
- Feng, P.; Wang, B.; Luo, J.-J.; Liu, D.L.; Waters, C.; Ji, F.; Ruan, H.; Xiao, D.; Shi, L.; Yu, Q. Using large-scale climate drivers to forecast meteorological drought condition in growing season across the Australian wheatbelt. Sci. Total Environ. 2020, 724, 138162. [Google Scholar] [CrossRef] [PubMed]
- Tamaddun, K.A.; Kalra, A.; Bernardez, M.; Ahmad, S. Effects of ENSO on Temperature, Precipitation, and Potential Evapotranspiration of North India’s Monsoon: An Analysis of Trend and Entropy. Water 2019, 11, 189. [Google Scholar] [CrossRef]
- Azad, S.; Rajeevan, M. Possible shift in the ENSO-Indian monsoon rainfall relationship under future global warming. Sci. Rep. 2016, 6, 20145. [Google Scholar] [CrossRef]
- Surmaini, E.; Hadi, T.W.; Subagyono, K.; Puspito, N.T. Early detection of drought impact on rice paddies in Indonesia by means of Niño 3.4 index. Theor. Appl. Climatol. 2015, 121, 669–684. [Google Scholar] [CrossRef]
- Setiawan, A.M.; Lee, W.-S.; Rhee, J. Spatio-temporal characteristics of Indonesian drought related to El Niño events and its predictability using the multi-model ensemble. Int. J. Clim. 2017, 37, 4700–4719. [Google Scholar] [CrossRef]
- Mohammadrezaei, M.; Soltani, S.; Modarres, R. Evaluating the effect of ocean-atmospheric indices on drought in Iran. Theor. Appl. Clim. 2020, 140, 219–230. [Google Scholar] [CrossRef]
- Araneda-Cabrera, R.J.; Bermúdez, M.; Puertas, J. Benchmarking of drought and climate indices for agricultural drought monitoring in Argentina. Sci. Total Environ. 2021, 790, 148090. [Google Scholar] [CrossRef]
- Saji, N.H.; Goswami, B.N.; Vinayachandran, P.N.; Yamagata, T. A dipole mode in the tropical Indian Ocean. Nature 1999, 401, 360–363. [Google Scholar] [CrossRef] [PubMed]
- Saha, K.; Guha, A.; Banik, T. Indian summer monsoon variability over North-East India: Impact of ENSO and IOD. J. Atmos. Sol.-Terr. Phys. 2021, 221, 105705. [Google Scholar] [CrossRef]
- Todmal, R.S. Link between monsoon rainfall variability and agricultural drought in the semi-arid region of Maharashtra, India. Curr. Sci. 2022, 122, 934. [Google Scholar] [CrossRef]
- Min, S.-K.; Cai, W.; Whetton, P. Influence of climate variability on seasonal extremes over Australia. J. Geophys. Res. Atmos. 2013, 118, 643–654. [Google Scholar] [CrossRef]
- Kangas, R.S.; Brown, T.J. Characteristics of US drought and pluvials from a high-resolution spatial dataset. Int. J. Climatol. A J. R. Meteorol. Soc. 2007, 27, 1303–1325. [Google Scholar] [CrossRef]
- Guttman, N.B. Comparing the palmer drought index and the standardized precipitation index. JAWRA J. Am. Water Resour. Assoc. 1998, 34, 113–121. [Google Scholar] [CrossRef]
- Palmer, W.C. Keeping Track of Crop Moisture Conditions, Nationwide: The New Crop Moisture Index. Weatherwise 1968, 21, 156–161. [Google Scholar] [CrossRef]
- Funk, C.; Budde, M.E. Phenologically-tuned MODIS NDVI-based production anomaly estimates for Zimbabwe. Remote Sens. Environ. 2009, 113, 115–125. [Google Scholar] [CrossRef]
- Karnieli, A.; Agam, N.; Pinker, R.T.; Anderson, M.; Imhoff, M.L.; Gutman, G.G.; Panov, N.; Goldberg, A. Use of NDVI and Land Surface Temperature for Drought Assessment: Merits and Limitations. J. Clim. 2010, 23, 618–633. [Google Scholar] [CrossRef]
- Felegari, S.; Sharifi, A.; Moravej, K.; Golchin, A.; Tariq, A. Investigation of the Relationship between NDVI Index, Soil Moisture, and Precipitation Data Using Satellite Images. In Sustainable Agriculture Systems and Technologies; John Wiley & Sons Ltd.: Hoboken, NJ, USA, 2022; pp. 314–325. [Google Scholar] [CrossRef]
- Bhuiyan, C.; Singh, R.; Kogan, F. Monitoring drought dynamics in the Aravalli region (India) using different indices based on ground and remote sensing data. Int. J. Appl. Earth Obs. Geoinf. 2006, 8, 289–302. [Google Scholar] [CrossRef]
- AghaKouchak, A.; Farahmand, A.; Melton, F.S.; Teixeira, J.; Anderson, M.C.; Wardlow, B.D.; Hain, C.R. Remote sensing of drought: Progress, challenges and opportunities. Rev. Geophys. 2015, 53, 452–480. [Google Scholar] [CrossRef]
- Gokmen, M.; Vekerdy, Z.; Verhoef, A.; Verhoef, W.; Batelaan, O.; van der Tol, C. Integration of soil moisture in SEBS for improving evapotranspiration estimation under water stress conditions. Remote Sens. Environ. 2012, 121, 261–274. [Google Scholar] [CrossRef]
- Sandholt, I.; Rasmussen, K.; Andersen, J. A simple interpretation of the surface temperature/vegetation index space for assessment of surface moisture status. Remote Sens. Environ. 2002, 79, 213–224. [Google Scholar] [CrossRef]
- Nguyen, H.; Wheeler, M.C.; Otkin, J.A.; Cowan, T.; Frost, A.J.; Stone, R.C. Using the evaporative stress index to monitor flash drought in Australia. Environ. Res. Lett. 2019, 14, 064016. [Google Scholar] [CrossRef]
- McKee, T.B.; Doesken, N.J.; Kleist, J. The Relationship of Drought Frequency and Duration to Time Scales. In Proceedings of the 8th Conference on Applied Climatology, Anaheim, CA, USA, 17–22 January 1993. [Google Scholar]
- Hayes, M.J.; Svoboda, M.; Wall, N.A.; Widhalm, M. The Lincoln Declaration on Drought Indices: Universal Meteorological Drought Index Recommended. Bull. Am. Meteorol. Soc. 2011, 92, 485–488. [Google Scholar] [CrossRef]
- Vicente-Serrano, S.M.; Beguería, S.; López-Moreno, J.I. A Multiscalar Drought Index Sensitive to Global Warming: The Standardized Precipitation Evapotranspiration Index. J. Clim. 2010, 23, 1696–1718. [Google Scholar] [CrossRef]
- Beguería, S.; Vicente-Serrano, S.M.; Reig, F.; Latorre, B. Standardized precipitation evapotranspiration index (SPEI) revisited: Parameter fitting, evapotranspiration models, tools, datasets and drought monitoring. Int. J. Clim. 2013, 34, 3001–3023. [Google Scholar] [CrossRef]
- Narasimhan, B.; Srinivasan, R. Development and evaluation of Soil Moisture Deficit Index (SMDI) and Evapotran-spiration Deficit Index (ETDI) for agricultural drought monitoring. Agric. For. Meteorol. 2005, 133, 69–88. [Google Scholar] [CrossRef]
- Wu, R.; Li, Q. Assessing the soil moisture drought index for agricultural drought monitoring based on green vegetation fraction retrieval methods. Nat. Hazards 2021, 108, 499–518. [Google Scholar] [CrossRef]
- Yihdego, Y.; Vaheddoost, B.; Al-Weshah, R.A. Drought indices and indicators revisited. Arab. J. Geosci. 2019, 12, 69. [Google Scholar] [CrossRef]
- Singh, R.P.; Roy, S.; Kogan, F. Vegetation and temperature condition indices from NOAA AVHRR data for drought monitoring over India. Int. J. Remote Sens. 2003, 24, 4393–4402. [Google Scholar] [CrossRef]
- Kogan, F. Application of vegetation index and brightness temperature for drought detection. Adv. Space Res. 1995, 15, 91–100. [Google Scholar] [CrossRef]
- Jiao, W.; Tian, C.; Chang, Q.; Novick, K.A.; Wang, L. A new multi-sensor integrated index for drought monitoring. Agric. For. Meteorol. 2019, 268, 74–85. [Google Scholar] [CrossRef]
- Jiao, W.; Wang, L.; Novick, K.A.; Chang, Q. A new station-enabled multi-sensor integrated index for drought mon-itoring. J. Hydrol. 2019, 574, 169–180. [Google Scholar] [CrossRef]
- Henchiri, M.; Liu, Q.; Essifi, B.; Javed, T.; Zhang, S.; Bai, Y.; Zhang, J. Spatio-Temporal Patterns of Drought and Impact on Vegetation in North and West Africa Based on Multi-Satellite Data. Remote Sens. 2020, 12, 3869. [Google Scholar] [CrossRef]
- Singh, T.P.; Deshpande, M.; Das, S.; Kumbhar, V. Drought pattern assessment over marathwada, india through the development of multivariate advance drought response index. Int. Arch. Photogramm. Remote Sens. Spat. Inf. Sci. 2022, 43, 1173–1180. [Google Scholar] [CrossRef]
- Zhang, Q.; Miao, C.; Gou, J.; Wu, J.; Jiao, W.; Song, Y.; Xu, D. Spatiotemporal characteristics of meteorological to hydrological drought propagation under natural conditions in China. Weather. Clim. Extrem. 2022, 38, 100505. [Google Scholar] [CrossRef]
- Tian, M.; Wang, P.; Han, P.; Zhang, S. Drought forecasts based on SARIMA models and vegetation temperature condition index. Nongye Jixie Xuebao Trans. Chin. Soc. Agric. Mach. 2013, 44, 109–116. [Google Scholar]
- Mishra, A.K.; Desai, V.R. Drought forecasting using stochastic models. Stoch. Environ. Res. Risk Assess. 2005, 19, 326–339. [Google Scholar] [CrossRef]
- Mossad, A.; Alazba, A.A. Drought Forecasting Using Stochastic Models in a Hyper-Arid Climate. Atmosphere 2015, 6, 410–430. [Google Scholar] [CrossRef]
- Steinemann, A. Drought indicators and triggers: A stochastic approach to evaluation. JAWRA J. Am. Water Resour. Assoc. 2003, 39, 1217–1233. [Google Scholar] [CrossRef]
- Han, P.; Wang, P.; Tian, M.; Zhang, S.; Liu, J.; Zhu, D. Application of the ARIMA Models in Drought Forecasting Using the Standardized Precipitation Index. In Proceedings of the Computer and Computing Technologies in Agriculture VI: 6th IFIP WG 5.14 International Conference, CCTA 2012, Zhangjiajie, China, 19–21 October 2012; pp. 352–358. [Google Scholar] [CrossRef]
- Karthika, K.; Thirunavukkarasu, V. Forecasting of meteorological drought using ARIMA model. Indian J. Agric. Res. 2017, 51, 103–111. [Google Scholar] [CrossRef]
- Durdu, Ö.F. Application of linear stochastic models for drought forecasting in the Büyük Menderes river basin, western Turkey. Stoch. Environ. Res. Risk Assess. 2010, 24, 1145–1162. [Google Scholar] [CrossRef]
- Khozani, Z.S.; Banadkooki, F.B.; Ehteram, M.; Ahmed, A.N.; El-Shafie, A. Combining autoregressive integrated moving average with Long Short-Term Memory neural network and optimisation algorithms for predicting ground water level. J. Clean. Prod. 2022, 348, 131224. [Google Scholar] [CrossRef]
- Ghorbani, H.; Vali, A.; Zarepour, H. Prediction and Investigation of Meteorological Drought Using SARIMA Time Series and SPI Index In Isfahan Province. J. Water Soil Sci. 2020, 23, 313–328. [Google Scholar] [CrossRef]
- Helmi, M.; Bakhtiari, B.; Qaderi, K. Meteorological drought modeling and forecasting using SARIMA time series at different climates of Iran. Iran. J. Irrig. Drain. 2020, 14, 1079–1090. [Google Scholar]
- Arjmandi Harat, Z.; Asadi Zarch, M.A. Comparison of SARIMA and SARIMAX for Long-Term Drought Prediction. Desert Manag. 2022, 10, 1–16. [Google Scholar]
- Liang, X.; Lettenmaier, D.P.; Wood, E.F.; Burges, S.J. A simple hydrologically based model of land surface water and energy fluxes for general circulation models. J. Geophys. Res. Atmos. 1994, 99, 14415–14428. [Google Scholar] [CrossRef]
- Shukla, S.; Steinemann, A.C.; Lettenmaier, D.P. Drought monitoring for Washington State: Indicators and applications. J. Hydrometeorol. 2011, 12, 66–83. [Google Scholar] [CrossRef]
- Nijssen, B.; Shukla, S.; Lin, C.; Gao, H.; Zhou, T.; Ishottama; Sheffield, J.; Wood, E.F.; Lettenmaier, D.P. A prototype global drought information system based on multiple land surface models. J. Hydrometeorol. 2014, 15, 1661–1676. [Google Scholar] [CrossRef]
- Cherkauer, K.A.; Lettenmaier, D.P. Hydrologic effects of frozen soils in the upper Mississippi River basin. J. Geophys. Res. Atmos. 1999, 104, 19599–19610. [Google Scholar] [CrossRef]
- Maurer, E.P.; Wood, A.W.; Adam, J.C.; Lettenmaier, D.P.; Nijssen, B. A long-term hydrologically based dataset of land surface fluxes and states for the conterminous United States. J. Clim. 2002, 15, 3237–3251. [Google Scholar] [CrossRef]
- Maurer, E.P.; O’Donnell, G.M.; Lettenmaier, D.P.; Roads, J.O. Evaluation of NCEP/NCAR Reanalysis Water and Energy Budgets using Macroscale Hydrologic Model Simulations. In Land Surface Hydrology, Meteorology, and Climate: Observations and Modeling; Lakshmi, V., Albertson, J., Schaake, J., Eds.; American Geophysical Union: Washington, DC, USA, 2001; pp. 137–158. [Google Scholar]
- Maurer, E.P.; O’Donnell, G.M.; Lettenmaier, D.P.; Roads, J.O. Evaluation of the land surface water budget in NCEP/NCAR and NCEP/DOE reanalyses using an off-line hydrologic model. J. Geophys. Res. Atmos. 2001, 106, 17841–17862. [Google Scholar] [CrossRef]
- Liang, X.; Wood, E.F.; Lettenmaier, D.P. Surface soil moisture parameterization of the VIC-2L model: Evaluation and modification. Glob. Planet. Chang. 1996, 13, 195–206. [Google Scholar] [CrossRef]
- Pradhan, A.; Indu, J. Uncertainty in Calibration of Variable Infiltration Capacity Model. Hydrology in a Changing World: Challenges in Modeling; Springer: Berlin/Heidelberg, Germany, 2019; pp. 89–108. [Google Scholar] [CrossRef]
- Arnold, J.G.; Srinivasan, R.; Muttiah, R.S.; Williams, J.R. Large area hydrologic modeling and assessment part i: Model development. JAWRA J. Am. Water Resour. Assoc. 1998, 34, 73–89. [Google Scholar] [CrossRef]
- Dash, S.S.; Sahoo, B.; Raghuwanshi, N.S. How reliable are the evapotranspiration estimates by Soil and Water Assessment Tool (SWAT) and Variable Infiltration Capacity (VIC) models for catchment-scale drought assessment and irrigation planning? J. Hydrol. 2021, 592, 125838. [Google Scholar] [CrossRef]
- Kang, H.; Sridhar, V. Improved Drought Prediction Using Near Real-Time Climate Forecasts and Simulated Hydrologic Conditions. Sustainability 2018, 10, 1799. [Google Scholar] [CrossRef]
- Samavati, A.; Babamiri, O.; Rezai, Y.; Heidarimozaffar, M. Investigating the effects of climate change on future hydrological drought in mountainous basins using SWAT model based on CMIP5 model. Stoch. Environ. Res. Risk Assess. 2023, 37, 849–875. [Google Scholar] [CrossRef]
- Priya, R.Y.; Manjula, R. A review for comparing SWAT and SWAT coupled models and its applications. Mater. Today Proc. 2021, 45, 7190–7194. [Google Scholar] [CrossRef]
- Maliehe, M.; Mulungu, D.M. Assessment of water availability for competing uses using SWAT and WEAP in South Phuthiatsana catchment, Lesotho. Phys. Chem. Earth Parts A/B/C 2017, 100, 305–316. [Google Scholar] [CrossRef]
- Pande, C.B.; Kushwaha, N.L.; Orimoloye, I.R.; Kumar, R.; Abdo, H.G.; Tolche, A.D.; Elbeltagi, A. Comparative Assessment of Improved SVM Method under Different Kernel Functions for Predicting Multi-scale Drought Index. Water Resour. Manag. 2023, 37, 1367–1399. [Google Scholar] [CrossRef]
- Deo, R.C.; Kisi, O.; Singh, V.P. Drought forecasting in eastern Australia using multivariate adaptive regression spline, least square support vector machine and M5Tree model. Atmos. Res. 2017, 184, 149–175. [Google Scholar] [CrossRef]
- Achite, M.; Jehanzaib, M.; Elshaboury, N.; Kim, T.-W. Evaluation of Machine Learning Techniques for Hydrological Drought Modeling: A Case Study of the Wadi Ouahrane Basin in Algeria. Water 2022, 14, 431. [Google Scholar] [CrossRef]
- Almikaeel, W.; Čubanová, L.; Šoltész, A. Hydrological drought forecasting using machine learning—Gidra river case study. Water 2022, 14, 387. [Google Scholar] [CrossRef]
- Zhu, Q.; Luo, Y.; Zhou, D.; Xu, Y.-P.; Wang, G.; Tian, Y. Drought prediction using in situ and remote sensing products with SVM over the Xiang River Basin, China. Nat. Hazards 2020, 105, 2161–2185. [Google Scholar] [CrossRef]
- Pham, Q.B.; Yang, T.-C.; Kuo, C.-M.; Tseng, H.-W.; Yu, P.-S. Coupling Singular Spectrum Analysis with Least Square Support Vector Machine to Improve Accuracy of SPI Drought Forecasting. Water Resour. Manag. 2021, 35, 847–868. [Google Scholar] [CrossRef]
- Chen, J.; Li, M.; Wang, W. Statistical Uncertainty Estimation Using Random Forests and Its Application to Drought Forecast. Math. Probl. Eng. 2012, 2012, 915053. [Google Scholar] [CrossRef]
- Park, H.; Kim, K.; Lee, D.K. Prediction of Severe Drought Area Based on Random Forest: Using Satellite Image and Topography Data. Water 2019, 11, 705. [Google Scholar] [CrossRef]
- Barua, S.; Ng, A.W.M.; Perera, B.J.C. Artificial neural network–based drought forecasting using a nonlinear aggregated drought index. J. Hydrol. Eng. 2012, 17, 1408–1413. [Google Scholar] [CrossRef]
- Chaudhari, S.; Sardar, V.; Rahul, D.; Chandan, M.; Shivakale, M.S.; Harini, K. Performance Analysis of CNN, AlexNet and VGGNet Models for Drought Prediction using Satellite Images. In Proceedings of the 2021 Asian Conference on Innovation in Technology (ASIANCON), PUNE, India, 27–29 August 2021; pp. 1–6. [Google Scholar] [CrossRef]
- Sardar, V.S.; Yindumathi, K.M.; Chaudhari, S.S.; Ghosh, P. Convolution Neural Network-based Agriculture Drought Prediction using Satellite Images. In Proceedings of the 2021 IEEE Mysore Sub Section International Conference (MysuruCon), Hassan, India, 24–25 October 2021; pp. 601–607. [Google Scholar] [CrossRef]
- Poornima, S.; Pushpalatha, M. Drought prediction based on SPI and SPEI with varying timescales using LSTM recurrent neural network. Soft Comput. 2019, 23, 8399–8412. [Google Scholar] [CrossRef]
- Zhang, G.P. Time series forecasting using a hybrid ARIMA and neural network model. Neurocomputing 2003, 50, 159–175. [Google Scholar] [CrossRef]
- Khan, M.H.; Muhammad, N.S.; El-Shafie, A. Wavelet based hybrid ANN-ARIMA models for meteorological drought forecasting. J. Hydrol. 2020, 590, 125380. [Google Scholar] [CrossRef]
- Ganguli, P.; Reddy, M.J. Ensemble prediction of regional droughts using climate inputs and the SVM–copula approach. Hydrol. Process. 2014, 28, 4989–5009. [Google Scholar] [CrossRef]
- Zhang, Y.; Li, W.; Chen, Q.; Pu, X.; Xiang, L. Multi-models for SPI drought forecasting in the north of Haihe River Basin, China. Stoch. Environ. Res. Risk Assess. 2017, 31, 2471–2481. [Google Scholar] [CrossRef]
- Aghelpour, P.; Mohammadi, B.; Mehdizadeh, S.; Bahrami-Pichaghchi, H.; Duan, Z. A novel hybrid dragonfly optimization algorithm for agricultural drought prediction. Stoch. Environ. Res. Risk Assess. 2021, 35, 2459–2477. [Google Scholar] [CrossRef]
- Mohamadi, S.; Sammen, S.S.; Panahi, F.; Ehteram, M.; Kisi, O.; Mosavi, A.; Ahmed, A.N.; El-Shafie, A.; Al-Ansari, N. Zoning map for drought prediction using integrated machine learning models with a nomadic people optimization algorithm. Nat. Hazards 2020, 104, 537–579. [Google Scholar] [CrossRef]
- Komasi, M.; Sharghi, S.; Safavi, H.R. Wavelet and cuckoo search-support vector machine conjugation for drought forecasting using Standardized Precipitation Index (case study: Urmia Lake, Iran). J. Hydroinform. 2018, 20, 975–988. [Google Scholar] [CrossRef]
- Mehr, A.D.; Ghiasi, A.R.; Yaseen, Z.M.; Sorman, A.U.; Abualigah, L. A novel intelligent deep learning predictive model for meteorological drought forecasting. J. Ambient. Intell. Humaniz. Comput. 2022, 14, 10441–10455. [Google Scholar] [CrossRef]
| Disclaimer/Publisher’s Note: The statements, opinions and data contained in all publications are solely those of the individual author(s) and contributor(s) and not of MDPI and/or the editor(s). MDPI and/or the editor(s) disclaim responsibility for any injury to people or property resulting from any ideas, methods, instructions or products referred to in the content. |
© 2023 by the authors. Licensee MDPI, Basel, Switzerland. This article is an open access article distributed under the terms and conditions of the Creative Commons Attribution (CC BY) license (https://creativecommons.org/licenses/by/4.0/).


