
The Restorative and Contingent Value of Biophilic Indoor Environments in Healthcare Settings

Abstract
:1. Introduction
2. Materials and Methods
2.1. Study Design
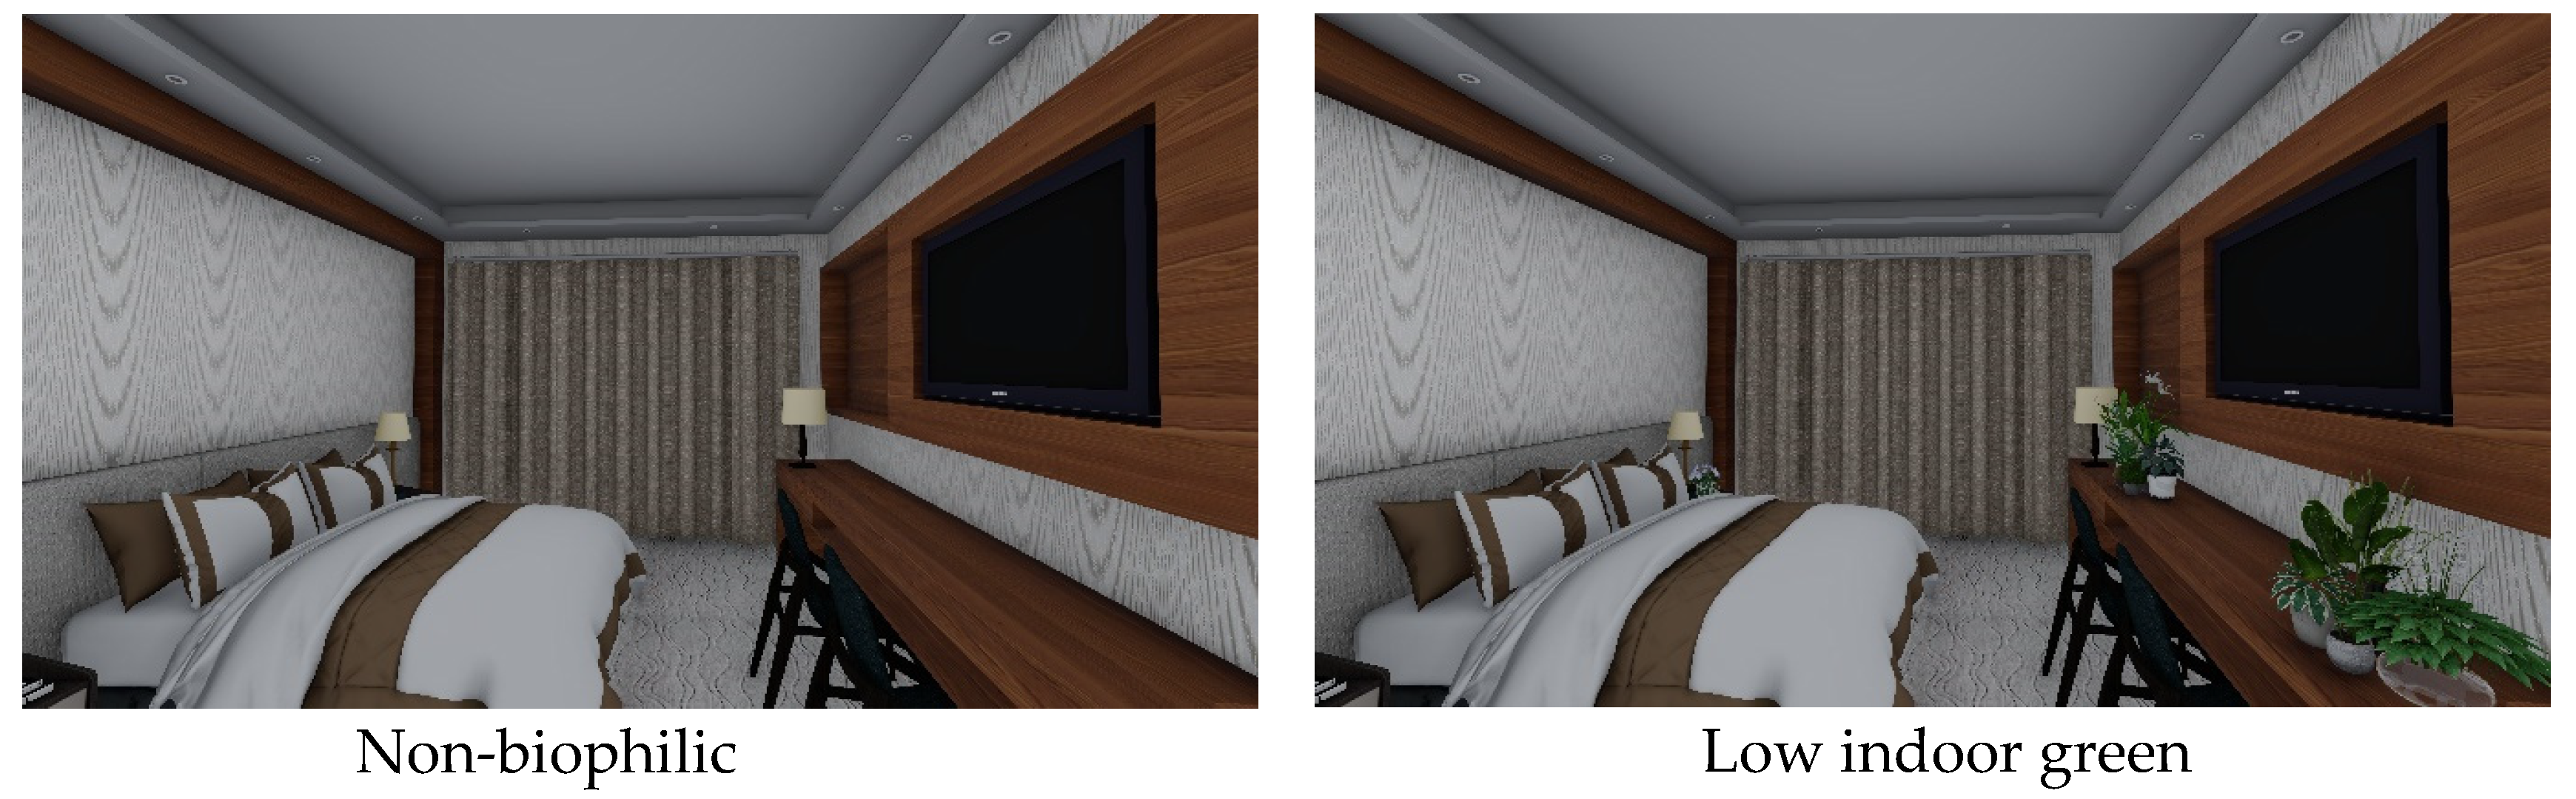
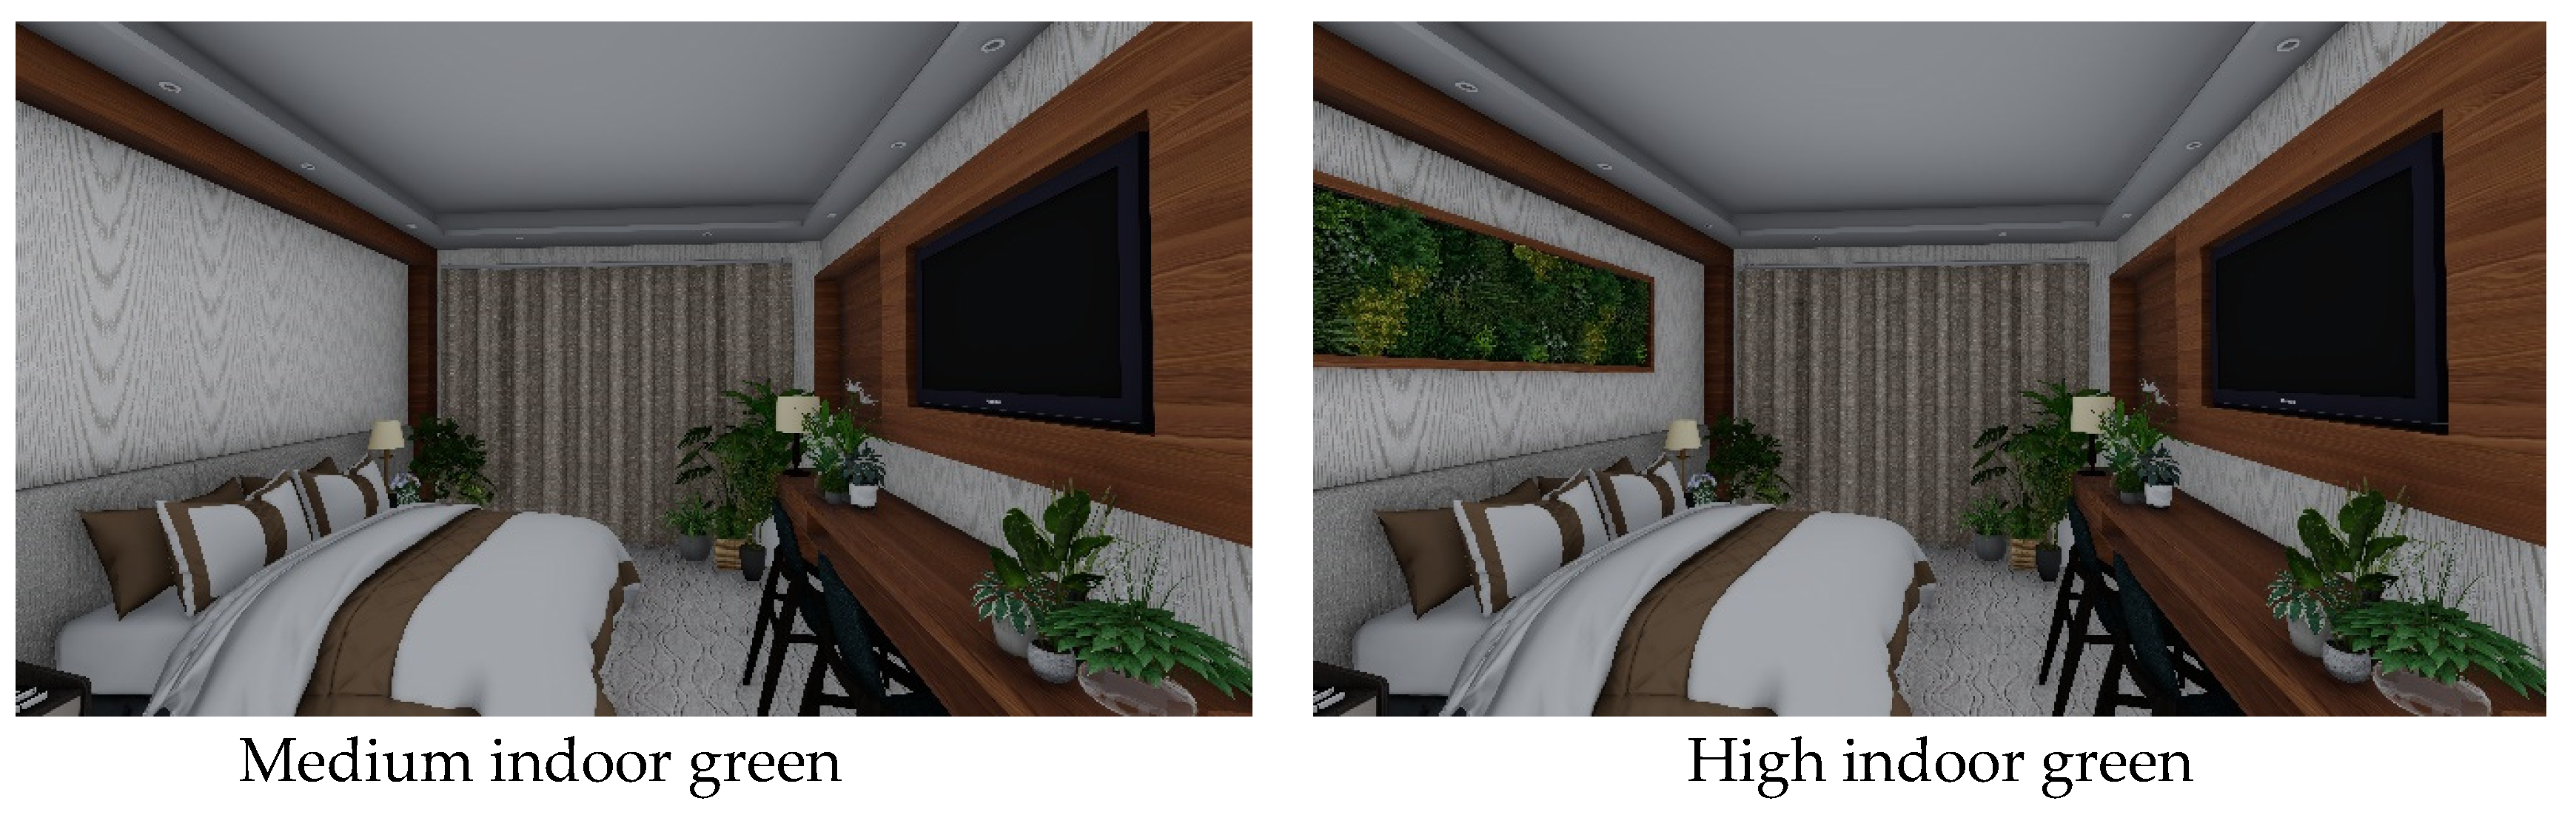
2.2. Stimuli
2.3. Measure
2.4. Survey Procedure and Participants
2.5. Data Processing
3. Results
3.1. Comparison of Preference, Perceived Restorativeness, and Satisfaction among Different Biophilic Design Interventions
3.2. Marginal Effects of Biophilic Design Intensity on Preference, Restorativeness, and Satisfaction
3.3. Comparison of WTP for Different Design Intensities
3.4. Factors Affecting the Willingness-to-Pay for Biophilic Indoor Design
4. Discussion
4.1. Biophilic Indoor Intervention in Relation to Perceived Outcomes and WTP
4.2. Perceived Outcome Variables in Relation to WTP
4.3. Practical Application
4.4. Limitations and Future Work
5. Conclusions
Author Contributions
Funding
Informed Consent Statement
Data Availability Statement
Conflicts of Interest
References
- Dong, E.; Du, H.; Gardner, L. An interactive web-based dashboard to track COVID-19 in real time. Lancet Infect. Dis. 2020, 20, 533–534. [Google Scholar] [CrossRef] [PubMed]
- Rajkumar, R.P. COVID-19 and mental health: A review of the existing literature. Asian J. Psychiatry 2020, 52, 102066. [Google Scholar] [CrossRef] [PubMed]
- Brooks, S.K.; Webster, R.K.; Smith, L.E.; Woodland, L.; Wessely, S.; Greenberg, N.; Rubin, G.J. The psychological impact of quarantine and how to reduce it: Rapid review of the evidence. Lancet 2020, 395, 912–920. [Google Scholar] [CrossRef] [PubMed] [Green Version]
- Burke, T.; Berry, A.; Taylor, L.K.; Stafford, O.; Murphy, E.; Shevlin, M.; McHugh, L.; Carr, A. Increased psychological distress during COVID-19 and quarantine in Ireland: A national survey. J. Clin. Med. 2020, 9, 3481. [Google Scholar]
- Hartig, T.; Kahn, P.H. Living in cities, naturally. Science 2016, 352, 938. [Google Scholar] [CrossRef]
- Hartig, T.; Mitchell, R.; De Vries, S.; Frumkin, H. Nature and health. Annu. Rev. Publ. Health 2014, 35, 207–228. [Google Scholar] [CrossRef] [Green Version]
- Markevych, I.; Schoierer, J.; Hartig, T.; Chudnovsky, A.; Hystad, P.; Dzhambov, A.M.; Vries, D.S.; Triguero-Mas, M.; Brauer, M.; Nieuwenhuijsen, M.J.; et al. Exploring pathways linking greenspace to health: Theoretical and methodological guidance. Environ. Res. 2017, 158, 301–317. [Google Scholar]
- Tyrväinen, L.; Ojala, A.; Korpela, K.; Lanki, T.; Tsunetsugu, Y.; Kagawa, T. The influence of urban green environments on stress relief measures: A field experiment. J. Environ. Psychol. 2014, 38, 1–9. [Google Scholar] [CrossRef]
- Bezerra, A.C.V.; Silva, C.E.M.D.; Soares, F.R.G.; Silva, J.A.M.D. Factors associated with people’s behavior in social isolation during the COVID-19 pandemic. Cienc. Saude Coletiva 2020, 25, 2411–2421. [Google Scholar] [CrossRef]
- United Nations. World Population Prospects; United Nations: New York, NY, USA, 2018. [Google Scholar]
- Aerts, R.; Honnay, O.; Van Nieuwenhuyse, A. Biodiversity and human health: Mechanisms and evidence of the positive health effects of diversity in nature and green spaces. Br. Med. Bull. 2018, 127, 5–22. [Google Scholar] [CrossRef] [Green Version]
- Mouratidis, K. Urban planning and quality of life: A review of pathways linking the built environment to subjective well-being. Cities 2021, 115, 103229. [Google Scholar]
- Xiao, H.; Zhang, Y.; Kong, D.; Li, S.; Yang, N. Social capital and sleep quality in individuals who self-isolated for 14 days during the coronavirus disease 2019 (COVID-19) outbreak in January 2020 in China. Med. Sci. Monit. 2020, 26, e923921. [Google Scholar] [CrossRef] [PubMed]
- Yin, J.; Yuan, J.; Arfaei, N.; Catalano, P.J.; Allen, J.G.; Spengler, J.D. Effects of biophilic indoor environment on stress and anxiety recovery: A between-subjects experiment in virtual reality. Environ. Int. 2020, 136, 105427. [Google Scholar] [PubMed]
- Martin, L.; White, M.P.; Hunt, A.; Richardson, M.; Pahl, S.; Burt, J. Nature contact, nature connectedness and associations with health, wellbeing and pro-environmental behaviours. J. Environ. Psychol. 2020, 68, 101389. [Google Scholar] [CrossRef]
- Zhong, W.; Schröder, T.; Bekkering, J. Biophilic design in architecture and its contributions to health, well-being, and sustainability: A critical review. Front. Archit. Res. 2022, 11, 114–141. [Google Scholar] [CrossRef]
- Kim, J.; Cha, S.H.; Koo, C.; Tang, S.K. The effects of indoor plants and articial windows in an underground environment. Build. Environ. 2018, 138, 53–62. [Google Scholar] [CrossRef]
- Nyrud, A.Q.; Bringslimark, T.; Bysheim, K. Benefits from wood interior in a hospital room: A preference study. Archit. Sci. Rev. 2013, 57, 125–131. [Google Scholar] [CrossRef]
- Kellert, S.R. Dimensions, elements, and attributes of biophilic design. In Biophilic Design: The Theory, Science, and Practice of Bringing Buildings to Life; John Wiley: Hoboken, NJ, USA, 2008; pp. 3–19. [Google Scholar]
- Kellert, S.R. Nature by Design: The Practice of Biophilic Design; Yale University Press: New Haven, CT, USA; London, UK, 2018. [Google Scholar]
- Wilson, E.O. Biophilia; Harvard University Press: Cambridge, MA, USA, 1984. [Google Scholar]
- Wilson, E.O. Biophilia and the conservation ethic. In The Biophilia Hypothesis; Kellert, S.R., Wilson, E.O., Eds.; Island Press, Shearwater Books: Washington, DC, USA, 1993; pp. 31–32. [Google Scholar]
- Ulrich, R.S. Biophilia, biophobia, and natural landscapes. In The Biophilia Hypothesis; Kellert, S.R., Wilson, E.O., Eds.; Island Press, Shearwater Books: Washington, DC, USA, 1993; pp. 73–137. [Google Scholar]
- Yin, J.; Spengler, J.D. Going biophilic: Living and working in biophilic buildings. In Urban Health; Galea, S., Ettman, C.K., Vlahov, D., Eds.; Oxford University Press: New York, NY, USA, 2019. [Google Scholar]
- Sanchez, J.A.; Ikaga, T.; Sanchez, S.V. Quantitative improvement in workplace performance through biophilic design: A pilot experiment case study. Energ. Build. 2018, 177, 316–328. [Google Scholar] [CrossRef]
- Gillis, K.; Gatersleben, B. A Review of Psychological Literature on the Health and Wellbeing Benefits of Biophilic Design. Buildings 2015, 5, 948–963. [Google Scholar] [CrossRef] [Green Version]
- Ryan, C.; Browning, W.; Clancy, J.; Andrews, S.; Kallianpurkar, N. Biophilic design patterns: Emerging nature-based parameters for health and well-being in the built environment. ArchNet-IJAR 2014, 8, 62–76. [Google Scholar] [CrossRef]
- Lee, K.T.; Im, J.B.; Park, S.J.; Kim, J.H. Conceptual Framework to Support Personalized Indoor Space Design Decision-Making: A Systematic Literature Review. Buildings 2022, 12, 716. [Google Scholar] [CrossRef]
- Taylor, R.P. The potential of biophilic fractal designs to promote health and performance: A review of experiments and applications. Sustainability 2021, 13, 823. [Google Scholar] [CrossRef]
- Lavdas, A.A.; Schirpke, U. Aesthetic preference is related to organized complexity. PLoS ONE 2020, 15, e0235257. [Google Scholar] [CrossRef] [PubMed]
- Carmody, J.; Sterling, R. Underground Building Design: Commercial and Institutional Structures; Van Nostrand Reinhold Co.: New York, NY, USA, 1983. [Google Scholar]
- Han, K.T.; Ruan, L.W. Effects of Indoor Plants on Self-reported Perceptions: A Systemic Review. Sustainability 2019, 11, 4506. [Google Scholar] [CrossRef] [Green Version]
- Burchett, M.; Torpy, F.; Tarran, J. Interior plants for sustainable facility ecology and workplace productivity. In Proceedings of HMAA Conference; Faculty of Science, Queensland University of Technology: Brisbane, Australia, 2008; Volume 7, pp. 1–12. [Google Scholar]
- Park, S.Y.; Song, J.S.; Kim, H.D.; Yamane, K.; Son, K.C. Effects of interior plantscapes on indoor environments and stress level of high school students. J. Jpn. Soc. Hortic. Sci. 2008, 77, 447–454. [Google Scholar] [CrossRef] [Green Version]
- Thomsen, J.D.; Sønderstrup-Andersen, H.K.H.; Müller, R. People–plant relationships in an office workplace: Perceived benefits for the workplace and employees. HortScience Horts 2011, 46, 744–752. [Google Scholar] [CrossRef]
- Pérez-Urrestarazu, L.; Kaltsidi, M.P.; Nektarios, P.A.; Markakis, G.; Loges, V.; Perini, K.; Fernández-Cañero, R. Particularities of having plants at home during the confinement due to the COVID-19 pandemic. Urban. Urban. Gree 2021, 59, 126919. [Google Scholar] [CrossRef]
- Dravigne, A.; Waliczek, T.M.; Lineberger, R.D.; Zajicek, J.M. The Effect of Live Plants and Window Views of Green Spaces on Employee Perceptions of Job Satisfaction. Hortscience 2008, 43, 183–187. [Google Scholar] [CrossRef] [Green Version]
- Qin, J.; Sun, C.; Zhou, X.; Leng, H.; Lian, Z. The effect of indoor plants on human comfort. Indoor Built Environ. 2014, 23, 709–723. [Google Scholar] [CrossRef]
- Dzhambov, A.M.; Lercher, P.; Browning, M.H.; Stoyanov, D.; Petrova, N.; Novakov, S.; Dimitrova, D.D. Does greenery experienced indoors and outdoors provide an escape and support mental health during the COVID-19 quarantine? Environ. Res. 2021, 196, 110420. [Google Scholar] [CrossRef]
- Chen, B.; Qi, X. Protest response and contingent valuation of an urban forest park in Fuzhou City, China. Urban. Urban. Gree 2018, 29, 68–76. [Google Scholar] [CrossRef]
- Lo, A.Y.; Jim, C.Y. Willingness of residents to pay and motives for conservation of urban green spaces in the compact city of Hong Kong. Urban. Urban. Gree 2010, 9, 113–120. [Google Scholar] [CrossRef] [Green Version]
- Majumdar, S.; Deng, J.; Zhang, Y.; Pierskalla, C. Using contingent valuation to estimate the willingness of tourists to pay for urban forests: A study in Savannah, Georgia. Urban. Urban. Gree 2011, 10, 275–280. [Google Scholar] [CrossRef]
- Venkatachalam, L. The contingent valuation method: A review. Environ. Impact Asses 2004, 24, 89–124. [Google Scholar] [CrossRef]
- Latinopoulos, D.; Mallios, Z.; Latinopoulos, P. Valuing the benefits of an urban park project: A contingent valuation study in Thessaloniki, Greece. Land Use Policy 2016, 55, 130–141. [Google Scholar] [CrossRef]
- Spangenberg, J.H.; Settele, J. Value pluralism and economic valuation—Defendable if well done. Ecosyst. Serv. 2016, 18, 100–109. [Google Scholar] [CrossRef]
- Sabyrbekov, R.; Dallimer, M.; Navrud, S. Nature affinity and willingness to pay for urban green spaces in a developing country. Landsc. Urban. Plan. 2020, 194, 103700. [Google Scholar] [CrossRef]
- Raymond, C.M.; Kenter, J.O. Transcendental values and the valuation and management of ecosystem services. Ecosyst. Serv. 2016, 21, 241–257. [Google Scholar] [CrossRef]
- Hoyos, D.; Mariel, P. Contingent valuation: Past, present and future. Prague Econ. Pap. 2010, 4, 329–343. [Google Scholar] [CrossRef]
- Andrade, C.C.; Devlin, A.S. Stress reduction in the hospital room: Applying Ulrich’s theory of supportive design. J. Environ. Psychol. J. Environ. Psychol. 2015, 41, 125–134. [Google Scholar] [CrossRef] [Green Version]
- Felsten, G. Where to take a study break on the college campus: An attention restoration theory perspective. J. Environ. Psychol. 2009, 29, 160–167. [Google Scholar] [CrossRef] [Green Version]
- Staats, H.; Kieviet, A.; Hartig, T. Where to recover from attentional fatigue: An expectancy-value analysis of environmental preference. J. Environ. Psychol. 2003, 23, 147–157. [Google Scholar]
- Bateson, J.E.; Hui, M.K. The ecological validity of photographic slides and videotapes in simulating the service setting. J. Consum. Res. 1992, 19, 271–281. [Google Scholar] [CrossRef]
- Stamps, A.E. Simulation effects on environmental preference. J. Environ. Manag. 1993, 38, 115–132. [Google Scholar] [CrossRef]
- Wang, R.; Zhao, J.; Meitner, M.J.; Hu, Y.; Xu, X. Characteristics of urban green spaces in relation to aesthetic preference and stress recovery. Urban For. Urban Green. 2019, 41, 6–13. [Google Scholar] [CrossRef]
- Zhang, Y.; van den Berg, A.E.; van Dijk, T.; Weitkamp, G. Quality over quantity: Contribution of urban green space to neighborhood satisfaction. Int. J. Environ. Res. Public Health 2017, 14, 535. [Google Scholar] [CrossRef] [PubMed] [Green Version]
- Johnston, R.J.; Boyle, K.J.; Adamowicz, W.; Bennett, J.; Brouwer, R.; Cameron, T.A.; Hanemann, W.M.; Hanley, N.; Ryan, M.; Scarpa, R.; et al. Contemporary guidance for stated preference studies. J. Assoc. Environ. Resour. Econ. 2017, 4, 319–405. [Google Scholar]
- Xu, W.; Zhao, J.; Huang, Y.; Hu, B. Design intensities in relation to visual aesthetic preference. Urban For. Urban Green. 2018, 34, 305–310. [Google Scholar] [CrossRef]
- Roth, M. Validating the use of Internet survey techniques in visual landscape assessment—An empirical study from Germany. Landsc. Urban Plan. 2006, 78, 179–192. [Google Scholar] [CrossRef]
- Carson, R.T. Contingent valuation: A user’s guide. Environ. Sci. Technol. 2000, 34, 1413–1418. [Google Scholar] [CrossRef] [Green Version]
- Dijkstra, K.; Pieterse, M.E.; Pruyn, A. Stress-reducing effects of indoor plants in the built healthcare environment: The mediating role of perceived attractiveness. Prev. Med. 2008, 47, 279–283. [Google Scholar] [CrossRef] [PubMed]
- McSweeney, J.; Johnson, S.; Sherry, S.; Singleton, J.; Rainham, D. Indoor nature exposure and influence on physiological stress markers. Int. J. Environ. Health R. 2021, 31, 636–650. [Google Scholar] [CrossRef] [PubMed]
- Tonia, G.; Carol, B. Are biophilic-designed site office buildings linked to health benefits and high performing occupants? Int. J. Environ. Res. Public Health 2014, 11, 12204–12222. [Google Scholar]
- Nejati, A.; Rodiek, S.; Shepley, M. Using visual simulation to evaluate restorative qualities of access to nature in hospital staff break areas. Landsc. Urban Plan. 2016, 148, 132–138. [Google Scholar] [CrossRef]
- Yin, J.; Arfaei, N.; MacNaughton, P.; Catalano, P.J.; Allen, J.G.; Spengler, J.D. Effects of biophilic interventions in office on stress reaction and cognitive function: A randomized crossover study in virtual reality. Indoor Air 2019, 29, 1028–1039. [Google Scholar] [PubMed]
- Suppakittpaisarn, P.; Jiang, B.; Slavenas, M.; Sullivan, W.C. Does Density of Green Infrastructure Predict Preference? Urban For. Urban Green. 2019, 40, 236–244. [Google Scholar] [CrossRef]
- Jiang, B.; Chang, C.Y.S.; Ullivan, W.C. A dose of nature: Tree cover, stress reduction, and gender differences. Landsc. Urban. Plan. 2014, 132, 26–36. [Google Scholar] [CrossRef]
- Chiang, Y.; Li, D.; Jane, H. Wild or tended nature? The effects of landscape location and vegetation density on physiological and psychological responses. Landsc. Urban Plan. 2017, 167, 72–83. [Google Scholar] [CrossRef]
- Bao, R. Excessive design of city landscape environment (in Chinese). Anhui Archit. 2006, 13, 24–25. [Google Scholar]
- Kim, U.; Wineman, J. Are Windows and Views Really Better? A Quantitative Analysis of the Economic and Psychological Value of Windows; Working Paper; Taubman College of Architecture and Urban Planning, University of Michigan: Ann Arbor, MI, USA, 2005. [Google Scholar]
- Huang, T.L. Restorative experiences and online tourists’ willingness to pay a price premium in an augmented reality environment. J. Retail. Consum. Serv. 2021, 58, 102256. [Google Scholar] [CrossRef]
- Barbiero, G.; Berto, R. From biophilia to naturalist intelligence passing through perceived restorativeness and connection to nature. Ann. Rev. Res. 2018, 3, 555604. [Google Scholar]
- Hartig, T.; Kaiser, F.G.; Bowler, P.A. Psychological restoration in nature as a positive motivation for ecological behavior. Environ. Behav. 2001, 33, 590–607. [Google Scholar] [CrossRef]
- Marselle, M.R.; Irvine, K.N.; Lorenzo-Arribas, A.; Warberdf, S.L. Does perceived restorativeness mediate the effects of perceived biodiversity and perceived naturalness on emotional well-being following group walks in nature? J. Environ. Psychol. 2016, 46, 217–232. [Google Scholar] [CrossRef] [Green Version]
- O’ Donnell, M.; Evers, E.R.K. Preference Reversals in Willingness to Pay and Choice. J. Consum. Res. 2019, 45, 1315–1330. [Google Scholar] [CrossRef]
- Jorgensen, B.S.; Wilson, M.A.; Heberlein, T.A. Fairness in the contingent valuation of environmental public goods: Attitude toward paying for environmental improvements at two levels of scope. Ecol. Econ. 2001, 36, 133–148. [Google Scholar]
- Kotchen, M.J.; Reiling, S.D. Environmental attitudes, motivations, and contingent valuation of nonuse values: A case study involving endangered species. Ecol. Econ. 2000, 32, 93–107. [Google Scholar] [CrossRef]


| Preference | Perceived Restorativeness | Satisfaction | |||||||
|---|---|---|---|---|---|---|---|---|---|
| Mean | SD | 95% CI | Mean | SD | 95% CI | Mean | SD | 95% CI | |
| Original | 4.02 | 1.14 | 3.92 to 4.12 | 3.99 | 1.34 | 3.88 to 4.11 | 4.00 | 1.13 | 3.90 to 4.10 |
| Low indoor green | 4.53 | 1.02 | 4.44 to 4.62 | 4.61 | 1.15 | 4.51 to 4.71 | 4.42 | 1.06 | 4.33 to 4.52 |
| Medium indoor green | 4.83 | 1.12 | 4.73 to 4.93 | 4.86 | 1.20 | 4.76 to 4.97 | 4.85 | 1.10 | 4.75 to 4.95 |
| High indoor green | 4.98 | 1.31 | 4.87 to 5.10 | 5.05 | 1.27 | 4.94 to 5.17 | 4.98 | 1.30 | 4.86 to 5.09 |
| F (3,1988) = 68.281, p < 0.001 | F (3,1988) = 68.513, p < 0.001 | F (3,1988) = 74.299, p < 0.001 | |||||||
| I | J | Preference | Perceived Restorativeness | Satisfaction | |||
|---|---|---|---|---|---|---|---|
| MD | 95% CI | MD | 95% CI | MD | 95% CI | ||
| High indoor green | Non-biophilic | 0.97 *** | 0.78 to 1.15 | 1.06 *** | 0.86 to 1.26 | 0.98 *** | 0.79 to 1.17 |
| Low indoor green | 0.45 *** | 0.26 to 0.64 | 0.44 *** | 0.24 to 0.65 | 0.55 *** | 0.37 to 0.74 | |
| Medium indoor green | 0.15 | −0.04 to 0.34 | 0.19 | −0.01 to 0.39 | 0.13 | −0.06 to 0.32 | |
| Medium indoor green | Non-biophilic | 0.82 *** | 0.63 to 1.00 | 0.87 *** | 0.67 to 1.07 | 0.85 *** | 0.66 to 1.04 |
| Low indoor green | 0.30 *** | 0.12 to 0.49 | 0.25 ** | 0.05 to 0.46 | 0.43 *** | 0.24 to 0.61 | |
| Low indoor green | Non-biophilic | 0.51 *** | 0.33 to 0.70 | 0.62 *** | 0.41 to 0.82 | 0.43 *** | 0.24 to 0.61 |
| Low Indoor Green (%) | Medium Indoor Green (%) | High Indoor Green (%) | |
|---|---|---|---|
| Number of respondents with WTP > 0 (percentage of the total sample) | 425 (85.34) | 446 (89.56) | 438 (87.95) |
| Number of the total zeros (percentage of the total sample) | 73 (14.66) | 52 (10.44) | 60 (12.05) |
| Number of protest zeros (percentage of the total zeroes) | 14 (19.18) | 12 (23.08) | 18 (30) |
| Number of real zeroes (percentage of the total zeroes) | 59 (80.82) | 40 (76.92) | 42 (70) |
| Mean Rank | p | Real Mean Values | ||||||||
|---|---|---|---|---|---|---|---|---|---|---|
| Respondents | N | Chi-Square | df | Low | Medium | High | Low | Medium | High | |
| Total | 1450 | 38.347 | 2 | 634.96 | 746.19 | 795.85 | <0.001 | 25.68 | 32.14 | 36.21 |
| Low Indoor Green (N = 484) | Medium Indoor Green (N = 486) | High Indoor Green (N = 480) | ||||
|---|---|---|---|---|---|---|
| Variable | Coef. | Std. Err | Coef. | Std. Err | Coef. | Std. Err |
| Preference | 2.60 | 1.38 | 3.06 | 1.60 | 3.05 | 1.71 |
| Satisfaction | 2.48 | 1.41 | 1.41 | 1.54 | 3.82 * | 1.76 |
| Restorativeness | 2.23 * | 1.10 | 4.85 *** | 1.41 | 3.67 ** | 1.39 |
| Gender | 0.45 | 1.95 | 1.63 | 2.11 | 1.10 | 2.28 |
| Age_dum1 | −2.06 | 3.54 | −0.42 | 3.82 | −2.66 | 4.15 |
| Age_dum2 | 0.64 | 3.48 | 0.35 | 3.78 | 0.49 | 4.07 |
| Age_dum3 | - | - | - | - | - | - |
| Edu_dum | −5.44 * | 2.42 | −4.57 | 2.61 | −3.76 | 2.83 |
| Income_dum1 | −7.89 ** | 2.97 | −5.69 | 3.28 | −7.44 ** | 3.59 |
| Income_dum2 | −4.74 | 3.16 | −6.24 | 3.46 | −7.21 | 3.77 |
| Income_dum3 | −0.29 | 3.08 | 0.05 | 3.33 | −0.35 | 3.63 |
| Income_dum4 | - | - | - | - | - | - |
| Constant | 6.06 | 6.73 | −2.09 | 7.52 | −4.32 | 7.61 |
| Sigma | 20.94 | 0.69 | 22.79 | 0.74 | 24.54 | 0.80 |
| Log likelihood | −1048.83 | −1093.81 | −1115.36 | |||
Disclaimer/Publisher’s Note: The statements, opinions and data contained in all publications are solely those of the individual author(s) and contributor(s) and not of MDPI and/or the editor(s). MDPI and/or the editor(s) disclaim responsibility for any injury to people or property resulting from any ideas, methods, instructions or products referred to in the content. |
© 2023 by the authors. Licensee MDPI, Basel, Switzerland. This article is an open access article distributed under the terms and conditions of the Creative Commons Attribution (CC BY) license (https://creativecommons.org/licenses/by/4.0/).
Share and Cite
Lan, Y.; Liu, Q. The Restorative and Contingent Value of Biophilic Indoor Environments in Healthcare Settings. Sustainability 2023, 15, 11676. https://doi.org/10.3390/su151511676
Lan Y, Liu Q. The Restorative and Contingent Value of Biophilic Indoor Environments in Healthcare Settings. Sustainability. 2023; 15(15):11676. https://doi.org/10.3390/su151511676
Chicago/Turabian StyleLan, Yuxiang, and Qunyue Liu. 2023. "The Restorative and Contingent Value of Biophilic Indoor Environments in Healthcare Settings" Sustainability 15, no. 15: 11676. https://doi.org/10.3390/su151511676
APA StyleLan, Y., & Liu, Q. (2023). The Restorative and Contingent Value of Biophilic Indoor Environments in Healthcare Settings. Sustainability, 15(15), 11676. https://doi.org/10.3390/su151511676