Article

All-for-One Tourism Demonstration Zones and High-Quality Development of Tourism: Evidence from the Quasi-Natural Experiment in China

School of Business Administration, Shandong University of Finance and Economics, Jinan 250014, China
*
Author to whom correspondence should be addressed.
Sustainability 2023, 15(15), 11626; https://doi.org/10.3390/su151511626
Submission received: 8 May 2023 / Revised: 7 July 2023 / Accepted: 21 July 2023 / Published: 27 July 2023

Abstract

:
The all-for-one tourism guides the development of the tourism industry in China and promotes coordinated development of the economy and society. Existing studies emphasize the significance of all-for-one tourism but pay limited attention to the impact and mechanism of all-for-one tourism on the high-quality development of tourism. By employing the all-for-one tourism demonstration zones as a quasi-natural experiment, this research uses the time-varying difference-in-differences (DID) model to empirically investigate the relationship between all-for-one tourism demonstration zones and the high-quality development of tourism. In particular, under the guidance of the new development philosophy, this research constructs a measurement and evaluation indicator system for the high-quality development of tourism from five dimensions, including innovative, coordinated, green, open, and shared development. The results show that the all-for-one tourism demonstration zones positively impact the high-quality development of tourism, and the result is robust to a series of robustness checks, including the placebo test and the propensity score matching (PSM) procedures. Network infrastructure construction and tourism talent agglomeration are mechanisms channelling through all-for-one tourism demonstration zones and high-quality tourism development. Heterogeneity analysis reveals positive impacts of all-for-one tourism demonstration zones on central and western regions and provinces with a low proportion of tertiary sector.

1. Introduction

As China’s economy has been transitioning from a stage of rapid growth to high-quality development, the unbalanced and inadequate development of society and the people’s ever-growing needs for a better life has been a contradiction to resolve. China’s tourism, a way for people to gain a more comprehensive understanding of the world and discover themselves, is one of the five happiness industries closely related to people’s living quality and well-being. Recent decades have witnessed dramatic progress in the tourism industry in China, and its added value accounted for 4.56% of GDP in 2019. It cannot be denied that tourism industry has profoundly integrated into the national economic system, which promotes economic growth by generating foreign currency earnings (Balaguer and Cantavella–Jorda, 2002) [1], increasing employment (Kadiyali and Kosová, 2013) [2], and driving investment (Zhou et al., 2017) [3]. In the high-quality development stage, the tourism industry in China is expected to follow the development philosophy featuring innovation, coordination, green, openness, and sharing. However, the deterioration of the ecological environment, waste of natural resources, and short-sighted profit-seeking behavior have locked the tourism industry at the bottom of the value curve, leaving a limited value creation space. The high-quality development of the tourism industry remains an under-researched question.
As a significant guide to the development of the tourism industry in the future, the concept of all-for-one tourism was initially proposed by the National Tourism Administration in 2015. Then, it was officially proposed in the Report on the Work of the Government of 2017 and gained wide attention. Afterwards, the Guidance of Promotion the Development of All-for-one Tourism by the State Council was implemented in 2018, making detailed guidance and requirements for the development of all-for-one tourism, such as institutional support, public services support, and financing support. In recent years, all-for-one tourism has been an instructive tourism development strategy in China. As comprehensive tourism with overall planning, all-for-one tourism breaks through regional restrictions and limitations. It forms new economic development channels and patterns (Su, 2021) [4], which could promote the development of tourist destinations inclusively by considering all tourism elements, all relevant industries, the whole tourism process, all possible tourism time and places, all direct and indirect related tourism sectors, and all relational groups of people (Li et al., 2013) [5].
Existing literature has investigated the association between all-for-one tourism and social and economic development, such as urban development (Xu, 2017) [6], poverty alleviation (Su, 2021) [4], industrial integration (Hou et al., 2021; Gao et al., 2023) [7,8], rural governance (Dai and Yang, 2021) [9], and green development (Zhang, 2023; Hu et al., 2023) [10,11]. However, there still have two primary deficiencies. First, a quantitative analysis of the impact of all-for-one tourism on the high-quality development of tourism is lacking. Even though Dai and Yang (2022) [12] analyzed the feasible paths of all-for-one tourism leading to high-quality tourism development qualitatively, its quantitative analysis is still scarce. Second, due to the rich connotation of high-quality development, the measurement and evaluation of high-quality tourism development have not reached a consensus. Some studies emphasize efficiency as the measure of high-quality development (Assaf and Tsionas, 2015; Cuccia et al., 2016) [13,14], whereas others hold a multi-dimensional perspective and construct an evaluation indicator system to obtain a well-rounded evaluation of the development quality of tourism (He et al., 2023; Lu, 2022) [15,16].
By the end of 2018, the National Tourism Administration had announced two batches of more than 500 all-for-one tourism demonstration zones at the provincial, city (state), and county levels, providing valuable experience to the intensive development of the tourism industry. Taking the provincial-level demonstration zone as an example, since provinces are unlikely to know the accurate time when they will be demonstration zones, establishing all-for-one tourism demonstration zones can be considered a policy experiment. Thus, a quasi-natural experiment would be performed to address the issues mentioned above. By constructing an evaluation indicator system for the high-quality development of tourism in China and employing a time-varying difference-in-differences (DID) model, first, this research clarifies the impact of all-for-one tourism demonstration zones on the high-quality development of tourism. Second, this research further investigates the mechanisms channelling through all-for-one tourism demonstration zones and the high-quality development of tourism. Third, this research compares the effect of all-for-one tourism demonstration zones in regions with different geographical situations and industrial structures.
The main findings are as follows: first, all-for-one tourism demonstration zones significantly improve the high-quality development of tourism. The propensity score matching (PSM) procedure mitigates the potential endogeneity of reverse causality in robustness tests, and the placebo test examines that there have not been any omitted variables that influenced the result. Second, network infrastructure construction and tourism talent agglomeration play mediating roles in the relationship between all-for-one tourism demonstration zones and the high-quality development of tourism. Third, heterogeneity analysis reveals that all-for-one tourism demonstration zones have a statistically significant effect on central and western regions of China, whereas the eastern region has not. All-for-one tourism demonstration zones have a statistically significant effect on the provinces with a low proportion of tertiary sector, whereas provinces with a high proportion have not.
The underlying contributions of this research are as follows: First, current studies either overemphasize theoretical analysis or concentrate on single-dimensional outcomes of all-for-one tourism, such as urban development (Xu, 2017) [6], poverty alleviation (Su, 2021) [4], industrial integration (Hou et al., 2021; Gao et al., 2023) [7,8], rural governance (Dai and Yang, 2021) [9], and green development (Zhang, 2023; Hu et al., 2023) [10,11]. However, they pay limited attention to quantitative analysis of all-for-one tourism on high-quality tourism development from a multi-dimensional perspective. By taking the establishment of all-for-one tourism demonstration zones as a quasi-natural experiment, this research employs a time-varying DID model to test the relationship between all-for-one tourism demonstration zones and the high-quality development of tourism, which provides a multi-dimensional lens and quantitative approach to investigate the effectiveness of all-for-one tourism. Second, drawing on the new development philosophy, this research designs a measurement and evaluation indicator system for the high-quality development of tourism and employs the entropy weight method to obtain a comprehensive index, suggesting an objective and multi-dimensional perspective to have a deeper understanding of high-quality development. Third, this research further makes a detailed comparison of the effect of all-for-one tourism demonstration zones in terms of different geographical situations and industrial structures, indicating empirical evidence for realizing high-quality tourism development.
The remaining sections arrange as follows: This research reviews the literature in Section 2 and develops hypotheses in Section 3. Then, Section 4 is the research design, and Section 5 presents the estimation results, including the DID estimation and robustness tests. Mechanism analysis and heterogeneity analysis are in Section 6 and Section 7, respectively. Section 8 is the discussion, and Section 9 is the conclusions.

2. Literature Review

2.1. All-for-One Tourism

Existing literature has provided mixed results of all-for-one tourism on economic and social development. Since all-for-one tourism could improve the scale development of the tourism industry and accelerate the formation of a tourism industry chain, Xu (2017) [6] held the view that all-for-one tourism was an opportunity for ethnic regions with relatively weak economic foundations but rich tourism resources. The synergistic development of all-for-one ecotourism would create more ecotourism resources and products, promoting the socioeconomic development of the Chengdu-Chongqing Urban Cluster in China (Cheng and Wang, 2019) [17]. Dai and Yang (2021) [9] took Liyang (a city in Jiangsu province of China) as an example and supposed that all-for-one tourism was a starting point for coordinating social and economic development in the country’s governance of China. Su (2021) [4] further took all-for-one tourism as a new research horizon to point out the direction of improving regional economic levels since tourism poverty alleviation is the most typical type of industrial poverty alleviation.
Moreover, there was a close relationship between all-for-one tourism and ecological civilization. Their coupling coordination value rose in a high coupling coordination set from 2015 to 2019 in Guizhou province of China (Hu et al., 2023) [11]. By population agglomeration and industry convergence effect, all-for-one tourism could reduce the tourism carbon footprint (Zhang, 2023) [10]. In addition, all-for-one tourism enhanced the initiative and complementarity of industrial integration to achieve collaborative innovation of related industries and tourism (Hou et al., 2021) [7]. The closed self-loop tourism model transformed into the multi-dimensional “tourism +” development model, promoting the close integration of tourism and related support (Gao et al., 2023) [8]. However, since all-for-one tourism is in the initial stage, some scholars have also considered the underlying deficiencies of all-for-one tourism. For example, some regions either exaggerated the advantages of all-for-one tourism or overemphasized a rush for quick results, leading to haphazard investment in land and other tourism resources (Li and Jiang, 2020) [18]. A lack of unified instruction and assessment standards may exacerbate a one-sided and short-sighted perspective, which harms the sustainable development of all-for-one tourism (Zou, 2019) [19]. While these studies focused on the social and economic impact of all-for-one tourism, its relationship with the development quality of the tourism industry and its mechanisms have not been thoroughly discussed.

2.2. High-Quality Development of Tourism

China’s economy is transitioning from a rapid growth stage to a high-quality development stage. High-quality development covers the development of industries and firms, constructing a comprehensive development system that integrates macro and micro levels (Huang et al., 2018) [20]. Compared with the rapid growth stage considering speed and scale as primary measures of development, the high-quality development stage takes quality, structure, stability, and sustainability aspects of all-round, multi-dimensional measurement of development. In addition to the difference in evaluation standards, the rapid growth stage considers the pursuit of amount and scale as the primary target. In contrast, the high-quality development stage pursues the satisfaction of people’s ever-growing needs for a better life under the guidance of the new development philosophy.
Consistent with the characteristics of high-quality development of the economy, the connotation of high-quality development of tourism emphasizes the growth efficiency, rationalization of the industrial structure, and sustainability of the development, which is closely associated with the tourism operation quality, product quality, growth pattern, and ecological environment quality (Liu and Han, 2020) [21]. Under the guidance of high-quality tourism development, measurement and evaluation of high-quality tourism development show two research trends. Some literature focuses on efficiency and uses various models, such as DEA and Super-SBM, to measure development quality (Assaf and Tsionas, 2015; Cuccia et al., 2016; Gao et al., 2022) [13,14,22], whereas others construct indicator systems to measure and evaluate the high-quality development of tourism. For example, from the supply side perspective, He et al. (2023) [15] constructed a high-quality tourism evaluation system including five dimensions of tourism economic scale, development speed, supply quality, industrial tourism structure, and tourism industry benefits. Drawing on the new development philosophy, Li et al. (2022) [23] constructed an evaluation index system of the tourism economy’s high-quality development from five dimensions: innovation, coordination, green, openness, and sharing. Lu (2022) [16] measured the high-quality development level of tourism from the four dimensions of the tourism industry economy, structure, integration, and performance. Zhao et al. (2022) [24] took a multi-dimensional method, which was composed of four indicators, the quality of the tourism environment, the quality of tourism resources, the quality of tourism services, and tourism attraction, to measure the high-quality tourism development level of Xinjiang in China. Shi et al. (2021) [25] constructed a comprehensive evaluation system from six dimensions of high-quality resources, facilities, economy, environment, innovation, and integration to evaluate the high-quality development of cultural tourism.

3. Theoretical Analysis and Hypotheses Development

With institutional and financing support, all-for-one tourism demonstration zones have the priority to improve tourism public service facilities, transportation, and communication infrastructure construction, effectively promoting tourism’s high-quality development. For example, traditional infrastructure construction, such as traffic infrastructure, helps break down barriers and promotes transferring talents, technology, capital, and other tourism resources (Huang and Wang, 2020) [26]. More importantly, since static and single tourism products can not satisfy tourists with dynamic and rich tourism experiences, rapid updates of technologies, such as augmented reality technology, provides tourists with better information and enhanced experience (Cranmer et al., 2020) [27]. New kinds of infrastructure, such as communication facilities and other network infrastructure, play a role of great significance in the high-quality development of the tourism industry. On the one hand, communication among regions and industries accelerates knowledge and technology spillovers, making knowledge and skills flow efficiently and boosting innovation (Li et al., 2022) [28]. On the other hand, communication, and digital technologies could accelerate the speed and breadth of information dissemination (Zou and Pan, 2023) [29] and alleviate the information asymmetry issue, which helps break the border of tourism and other related industries and promote the reconstruction of industry (Yoo et al., 2012) [30]. During this process, the closed and vertical value chain of the tourism industry decomposes into modular, enhancing openness and promoting the horizontal modular system to reconfigure into a large, multifunctional, and integrated tourism-centered industry (Gao et al., 2023; Xiao and Zheng, 2012) [8,31].
Human capital is one of the essential factors for economic growth (Schultz, 1962) [32]. Well-educated talents endowed with higher human capital are critical in transforming and upgrading the tourism industry. Firstly, all-for-one tourism demonstration zones attract tourism talents by improving the environment for employment and entrepreneurship, such as financial subsidies and tax preference. As a carrier of advanced knowledge and cutting-edge technology, tourism talents spill over human capital in inter-industry and inter-regional transfers, conducive to improving labor productivity and human capital stock in the tourism industry. Second, transforming and upgrading the traditional tourism industry would generate new positions. The downward compatibility of advanced human capital would substitute for low human capital (Liu et al., 2018) [33], which is beneficial to optimizing the tourism workforce and advancing the human capital structure in the tourism industry. Third, drawing on agglomeration theory, talent concentration in the demonstration zones promotes cluster effect with supporting facilities and development platform, further improving the demonstration zones’ attractiveness and attracting more tourism talents to gather there (Yang et al., 2022) [34].
Based on the above analysis, the following hypotheses are proposed.
Hypothesis 1:
All-for-one tourism demonstration zones are positively associated with the high-quality development of tourism.
Hypothesis 2:
All-for-one tourism demonstration zones promote network infrastructure construction, thereby positively affecting the high-quality development of tourism.
Hypothesis 3:
All-for-one tourism demonstration zones promote tourism talent agglomeration, thereby positively affecting the high-quality development of tourism.

4. Research Design

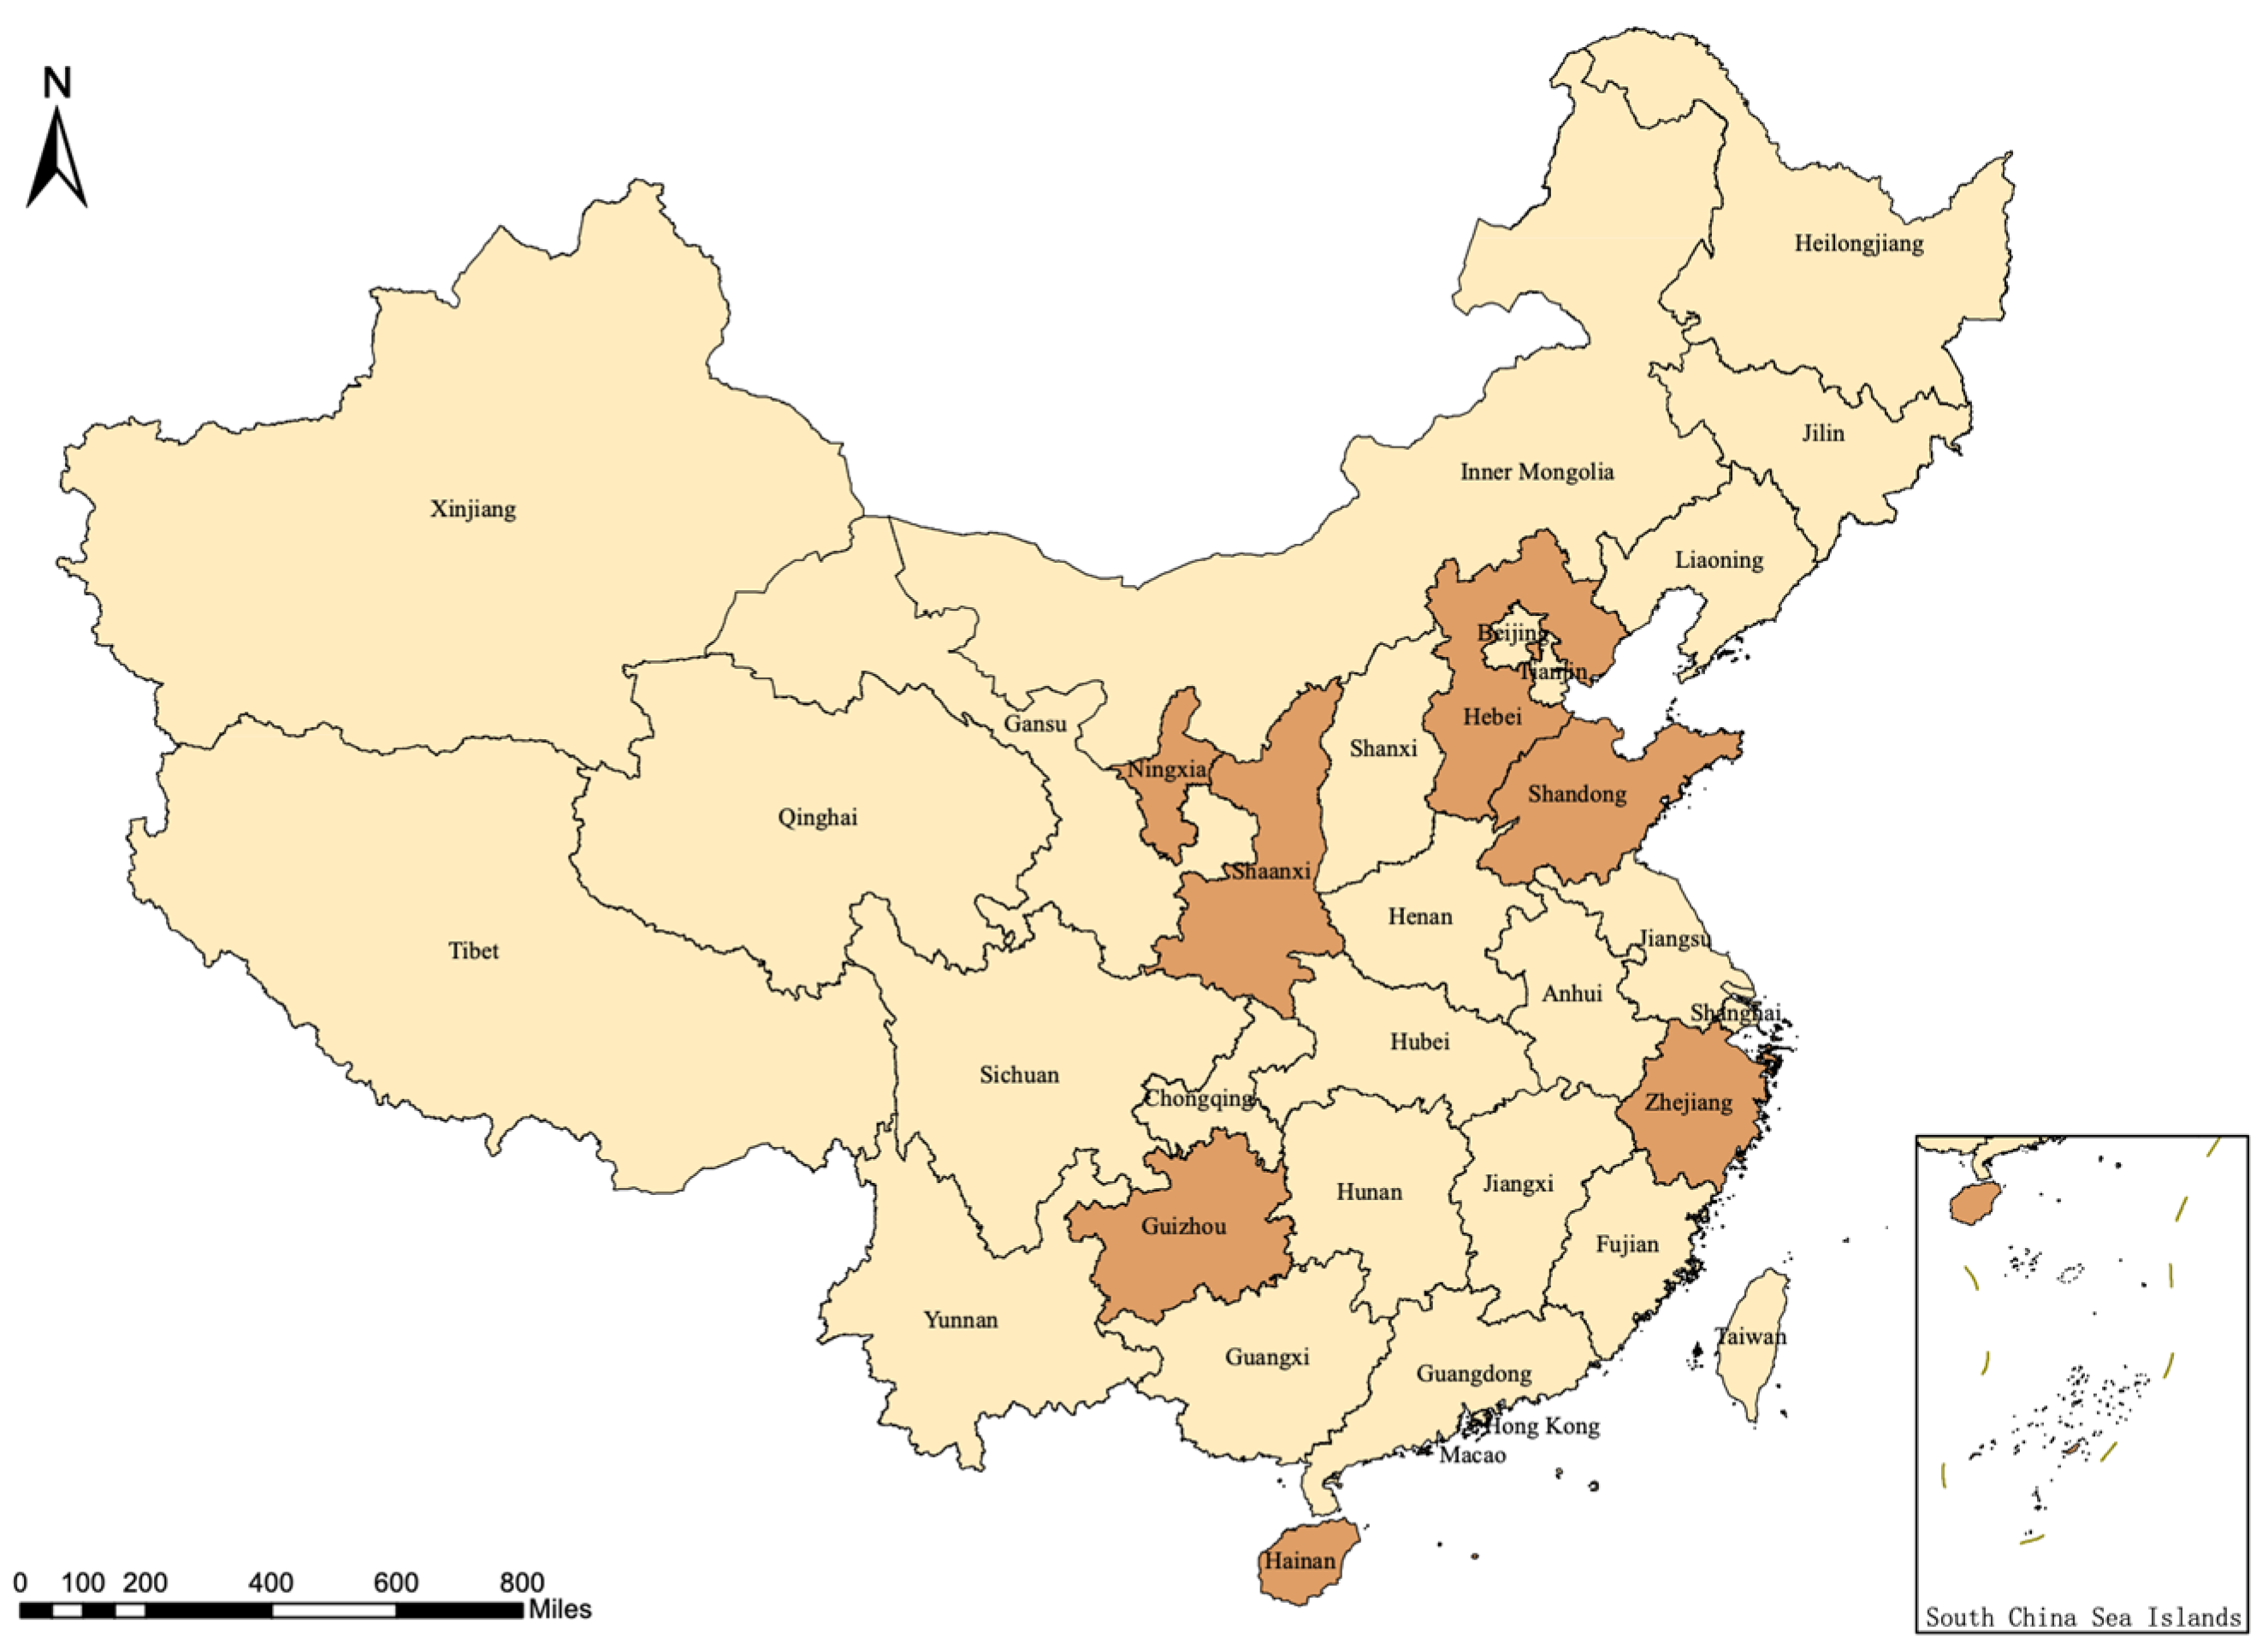
4.1. Sample Selection and Data Source

This research employs the panel data of 31 provinces (municipalities and autonomous regions included) as samples. Due to the unfeasibility of the data, Hong Kong, Macao, and Taiwan have been excluded. By 2019, eight provinces had been approved as all-for-one tourism demonstration zones, including Hainan (in January 2016), Ningxia (in September 2016), Shaanxi (in August 2017), Guizhou (in August 2017), Shandong (in August 2017), Hebei (in August 2017), Zhejiang (in August 2017), and Shanxi (in November 2019). In addition, since the tourism industry in China was seriously affected by COVID-19 in 2020, the research period is set from 2010 to 2019, avoiding the negative impact of exogenous issues. By considering the establishing time of demonstration zones and the research period, this research assigns Hainan, Ningxia, Shaanxi, Guizhou, Shandong, Hebei, and Zhejiang into the treatment group. The remaining 24 provinces are in the control group. Figure 1 presents the geographical distribution of sample regions by the end of 2018.
Data in research samples collected from the EPS (Express, Professional, and Superior) database (a statistical database covering multi-disciplines and fields in China, source: https://www.epsnet.com.cn/index.html#/Index, accessed on 19 May 2022) and statistical yearbooks, including China Statistical Yearbook, China Province Statistical Yearbook, China Statistical Yearbook on Tourism, and China Statistical Yearbook on Technology. In addition, some official websites, such as the National Bureau of Statistics website, the Ministry of Ecology and Environment website, and the Ministry of Culture and Tourism website, fill the missing values in research samples.

4.2. Model Design

DID model employs twice differences to resolve the endogeneity issues in the research, which is the most popular research design to evaluate the causal effects of policy interventions (Callaway and Sant’Anna, 2021) [35]. The first difference eliminates the individual differences between regions before establishing all-for-one tourism demonstration zones, and the second difference eliminates the time effect. Thus, the net effect of all-for-one tourism demonstration zones on the high-quality development of tourism would be calculated. In addition, because all seven all-for-one demonstration zones were not set simultaneously, the time-varying DID model is employed (Beck et al., 2010) [36].
H Q D i t = α 0 + β 1 A T i t + θ C V i t + γ t + δ i + ε i t
where the dependent variable H Q D i t denotes high-quality development of tourism. The dummy variable A T i t indicates whether or not province i is an all-for-one tourism demonstration zone in year t. C V i t represents control variables. In addition, the year ( γ t ) and region ( δ i ) dummies mitigate macroeconomic and dynamic changes incurred by time transition and regional differences. ε i t is the error term.
Following Baron and Kenny [37], the causal steps approach examines the mediating effect of network infrastructure construction and tourism talent agglomeration. The first step is as same as Equation (1), the second and third steps are as follows.
M e d i a t e r s i t = α 0 + β 2 A T i t + θ C V i t + γ t + δ i + ε i t
H Q D i t = α 0 + β 3 A T i t + β 4 M e d i a t e r s i t + θ C V i t + γ t + δ i + ε i t
The mediating effect exists if β 2 and β 4 are statistically significant. Otherwise, the Sobel test further verifies the significance of the mediating effect.

4.3. Variables

4.3.1. All-for-One Tourism Demonstration Zones (AT)

AT is the interaction term of du*dt. du is the between-group dummy variable, which equals one if the province is an all-for-one tourism demonstration zone and zero otherwise during the research period. dt is a time dummy variable, which sets to zero before and to one after the establishing time. AT is the impact of all-for-one tourism demonstration zones in the treatment group.

4.3.2. High-Quality Development of Tourism (HQD)

As China’s development has entered a new era, society’s principal contradiction is the contradiction between unbalanced and inadequate development and the people’s ever-growing need for a better life. The new philosophy of innovative, coordinated, green, open, and shared development indicates the direction, idea, and focus underpinning China’s high-quality development. Following Li et al. (2022) [23] and Chen and Huo (2022) [38], this research constructs a five-dimension indicator system to explain the affluent connotation of high-quality tourism development under the instruction of the new development philosophy.

Innovative Development Dimension

The rapid update of communication and information technologies has brought tourists a rich travel experience and changed their consumption habits, which calls for product innovation and business model innovation to realize the upgrade and transformation of the tourism industry. As an essential source of innovation, formal education for human capital investment is conducive to increasing human capital stock and upgrading human capital structure (Schultz, 1962) [32], thus improving tourism development quality. This research measures innovative development from two aspects of human capital and educational investment.

Coordinated Development Dimension

Due to vast geographical territory, there is a distinct difference in social and economic development among regions and industries in China. Coordinative tourism development would alleviate market fragmentation, accelerating the free flow of resources and promoting the integration of related industries. This research measures the coordinated development dimension from three aspects: urban development, urban-rural coordination, and consumption structure.

Green Development Dimension

High-quality development emphasizes respect for the laws of nature as a guideline, sustainable development as an essential requirement, and harmonious coexistence between man and nature. However, the carbon emission of tourism accounts for 8% of global CO2-e emissions with a 3% growth rate annually, contributing to the greenhouse effect directly and indirectly (Sun and Higham, 2021) [39]. Low resource consumption and environmental pollution are new values of the tourism industry. Ecological protection and environmental management measure and evaluate green development dimension.

Open Development Dimension

The global economy has created a favorable climate for tourism to actively participate in the global value chain and achieve competitive advantages. For example, the Chinese government proposed a “One Belt, One Road” development strategy in 2013, which refers to the New Silk Road Economic Belt and will link China with Europe through Central and Western Asia. After several years of work, the trade volume between China and countries along the “One Belt, One Road” exceeded 13.83 trillion yuan in 2022. Significant projects, such as China–Laos Railway and the Jakarta–Bandung high-speed railway, promote tourism cooperation and cultural communication extensively, which provides benefits to obtaining advanced knowledge and cutting-edge technologies to achieve structural improvement and transformation. The reception service and market scale measure the open development dimension in the indicator system.

Shared Development Dimension

Only if people enjoy the opportunities and merits of the development of society will their enthusiasm and creativity be fully mobilized. As one of the happiness industries, tourism is closely related to people’s sense of fulfillment and happiness, which creates an opportunity for people to enjoy the benefits of the development of society. This research measures the shared development dimension from infrastructure construction and public services, which provides essential services for the tourism industry.
From a holistic perspective, the five dimensions of innovative, coordinated, green, open, and shared development are interconnected, indicating that they are mutually constrained and promoted. If one dimension has not been achieved, the development quality of the tourism industry will be negatively influenced.
Considering the data’s availability, comparability, dynamism, and scientificity, this research has constructed the measurement and evaluation indicator system of high-quality tourism development from innovation, coordination, green, openness, and sharing dimensions with eleven secondary and fifteen tertiary indicators. Table 1 presents the measurement and evaluation indicator system of high-quality tourism development.
Following Wang et al. (2022) [40] and Guo (2017) [41], the entropy weight method is employed to obtain a comprehensive index of high-quality tourism development for each province. The entropy weight method relies on the dispersion of the data to obtain the entropy weight. The greater the data dispersion, the richer the information provided and, thus, the larger weight of the indicator. Compared to subjective weighing methods, the entropy weight method has fully considered the amount of information of the indicators and reflected the variation of the data, which has a broader scope of application (Zhu et al., 2020) [42]. The specific steps of the entropy weight method are as follows:
First, standardized forms of indicators eliminate the dimensions and units of indicators. Equations (4) and (5) are set for positive and negative indicators, respectively. In addition, plus 0.001 avoids the insignificance of logarithm calculation in the following steps.
X i j = a ij - min ( a j ) max ( a j ) - min ( a j ) + 0.001
X i j = max ( a j ) - a ij max ( a j ) - min ( a j ) + 0.001
where Xij is the standardized form, min(aj) and max(aj) represent the minimum and maximum values of the indicators, respectively.
Second, based on the standardized indicators, the indicator matrix A is constructed by m number of regions and n number of evaluation indicators.
A = ( X i j ) m n ,   i   =   ( 1 , 2 , m ) ,   j =   ( 1 , 2 , n )
Third, as an important factor in measuring the weight of evaluation metrics, the greater entropy of information, the larger the weight, and vice versa. Equations (7) and (8) indicate how to calculate the entropy of the j-th indicator.
p ij = X ij i = 1 m X i j
E j = 1 ln ( m ) i = 1 m p i j ln ( p i j )
Forth, Equation (9) shows how to calculate the indicator’s weight with the entropy of information.
W j = 1 - E j j = 1 n ( 1 E j )
Finally, using the linear weighting method in Equation (10) to calculate the comprehensive index of high-quality development of tourism with the weight Wj and the standardized indicator Xij.
I n d e x i = j = 1 n W j X i j
Table 2 represents the comprehensive index of the high-quality development of the tourism industry for 31 provinces in China from 2010 to 2019, and Figure 2 presents the comprehensive index in 2010 and 2019. Even though there is an upward trend in high-quality tourism development for most provinces, distinct differences among provinces demonstrate unbalanced development of the tourism industry. For example, with strong economic foundations and high industry agglomeration, Beijing, Guangdong, Jiangsu, Zhejiang, and Shandong have high values in the high-quality development of tourism, suggesting the synergistic effect of innovation, coordination, sustainability, openness, and sharing. In contrast, even though Ningxia, Shanxi, and Anhui are endowed with attractive scenic spots and rich cultural heritage, under-developed infrastructure construction and a lack of tourism talents constrain the further development of the tourism industry, which needs practical measures to alleviate.

4.3.3. Control Variables

The following seven variables are control variables: (1) Foreign trade (Trade) is the logarithm of total export and import. (2) Inbound tourism (Foreign) is the logarithm of the number of inbound tourists, indicating the openness of the tourism industry. (3) Level of tourism development (Tourism) refers to the proportion of total tourism revenue to GDP. (4) Development of information technology (Cable) is the logarithm of the length of long-distance fiber optic cable lines. (5) Government expenditure (Govern) is the proportion of regional general public service expenditure to GDP. (6) Road-person ratio (Road) is the average road area per inhabitant in the urban area. (7) Urban population density (Density) is the proportion of urban population to urban area.

4.3.4. Mediating Variables

(1) Network infrastructure construction (Infras): Communication infrastructure, fiber optic cable construction, Internet penetration rate, and share of net Internet users are essential factors influencing network infrastructure construction (Sun and Xu, 2021) [43]. This research selects four indicators, including total fixed assets investment in information transmission and computer industry, the ratio of the length of long-distance fiber optic cable to land area, the ratio of the number of Internet users to the permanent resident population, and the ratio of the number of Internet users to the population to measure network infrastructure construction. Then, the entropy weight method is employed to obtain a comprehensive index for evaluation.
(2) Tourism talent agglomeration (Human): Talent agglomeration is the proportion of urban science and education professionals in the total population (Yang et al., 2022) [44]. Similarly, tourism talent agglomeration refers to the proportion of tourism professionals in the population. Following Liu et al. (2018) [45] and Liu et al. (2017) [46], the number of employees in scenic spots, star-rated hotels, and travel agencies is a proxy indicator of tourism talents in China. Tourism talent agglomeration refers to the ratio of tourism talents to the local population.

4.4. Descriptive Statistics of Main Variables

Table 3 reveals that the mean HQD is 0.236, and the standard deviation is 0.070, indicating geographical differences in the development quality of the tourism industry. In our research samples, 7.4% of the observations are all-for-one demonstration zones during the research period.

5. Empirical Results

5.1. Baseline Regression Results

Table 4 reports the impact of the all-for-one tourism demonstration zones on the high-quality development of the tourism industry with the gradual inclusion of control variables. It is found that the coefficients of the all-for-one tourism demonstration zones are statistically significant regardless of whether control variables are included or not. In particular, the coefficient of the all-for-one tourism demonstration zone 0.016 in column (8) is statistically significant, indicating a positive association between all-for-one tourism demonstration zones and the high-quality development of tourism. Hypothesis 1 has been verified.

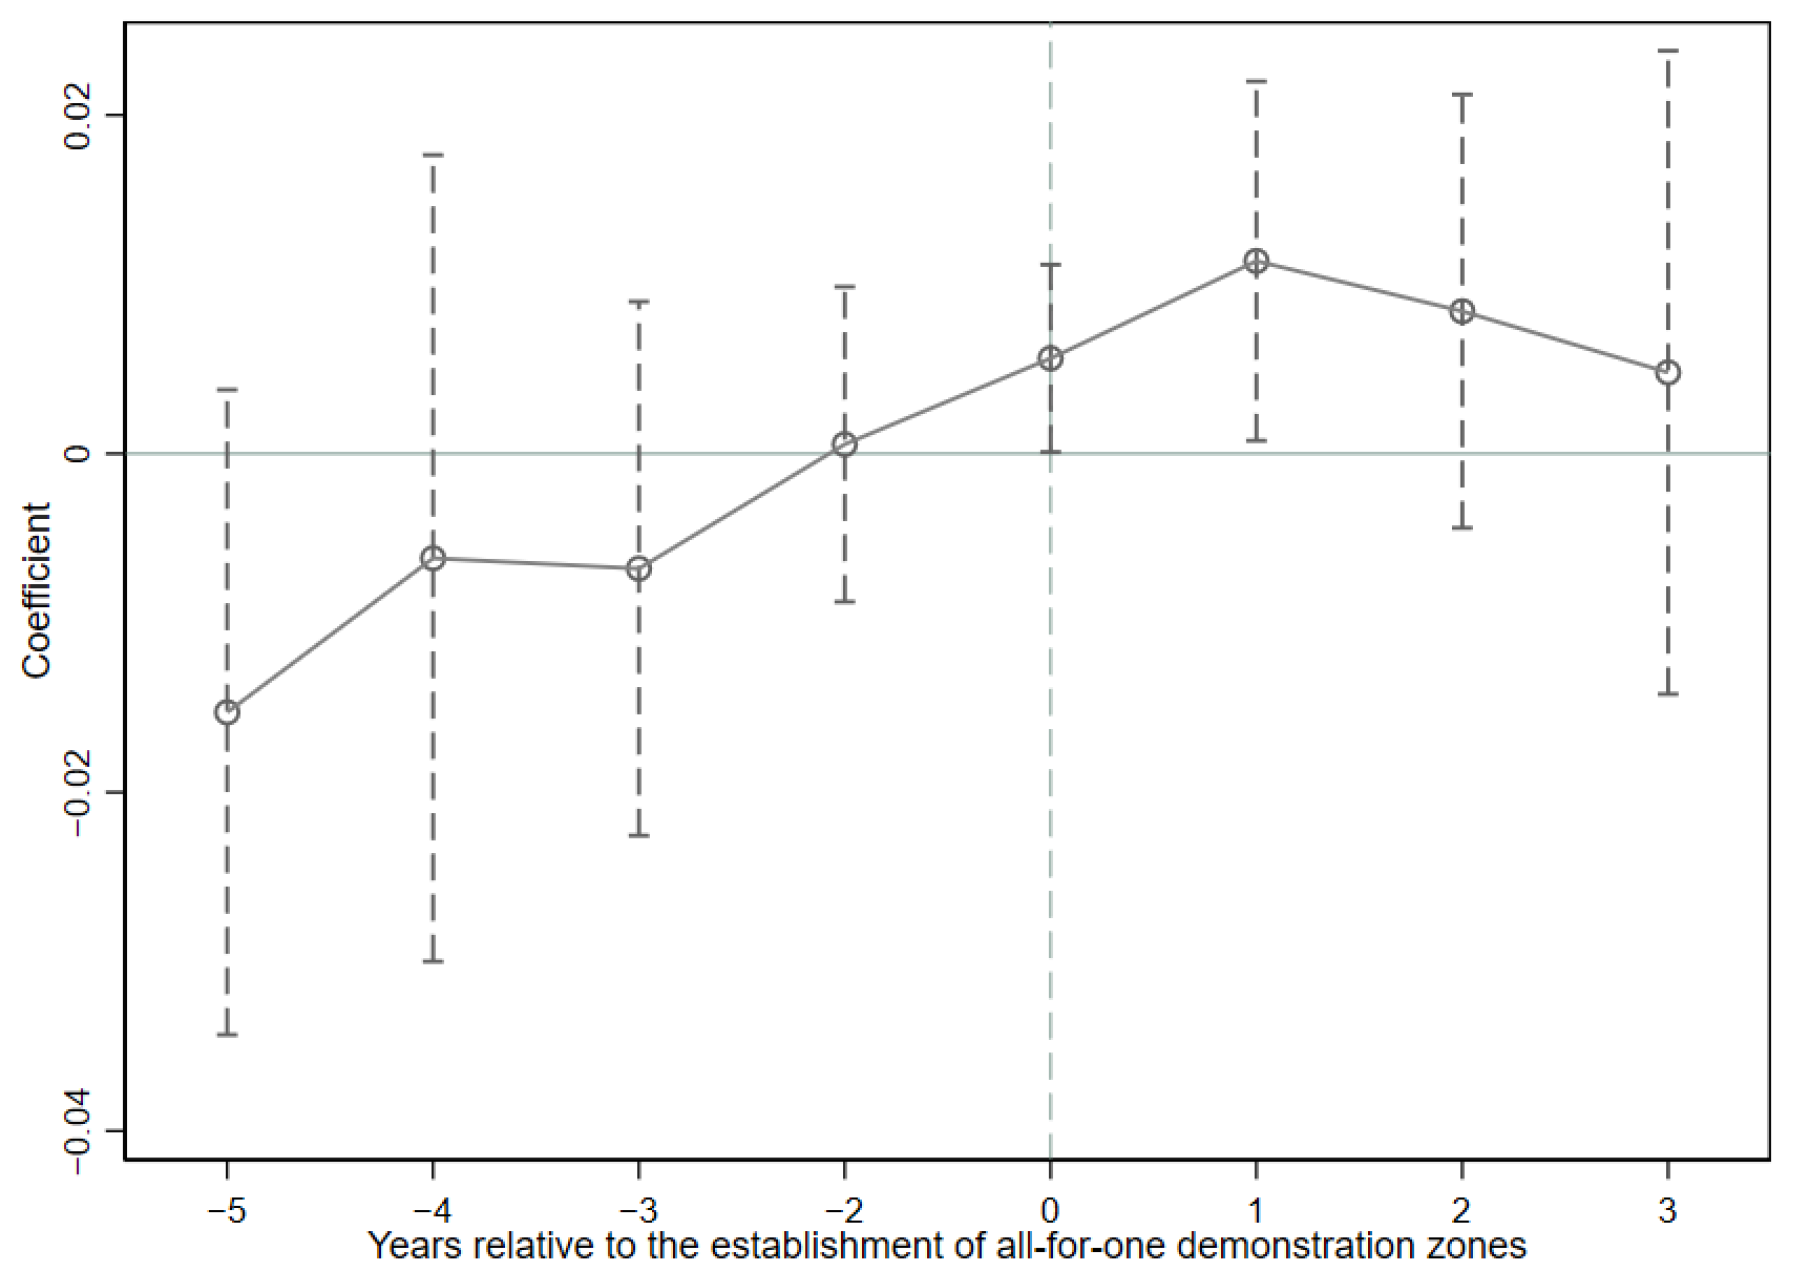
5.2. Parallel Trend Test

That research samples satisfy the parallel trends is an essential prerequisite for DID model, which means that the development quality of the tourism industry in the treatment and control group have the same trend before the establishment of all-for-one tourism demonstration zones. Five-time points (−5, −4, −3, −2, and −1) before the establishment, three-time points after the establishment (1, 2, and 3), and the establishing time (0) are set. In particular, time = −1 is selected as a baseline to alleviate collinearity issues (Chi and Han, 2023) [47]. As is shown in Figure 3, coefficients are not significantly different from 0 before the establishment of demonstration zones, indicating no significant difference between the treatment and control group samples before the establishment of all-for-one demonstration zones. This means that the evolutionary time trend is consistent with the parallel trend.

5.3. Robustness Tests

5.3.1. Placebo Test

The placebo test randomly assigns the establishing time of all-for-one tourism demonstration zones and examines whether any omitted variables influence the result. Figure 4 reports the distribution of coefficients and p-value from 500 runs. Compared with the coefficient of baseline estimation of 0.016 in column (8) of Table 4, most coefficients in the placebo test are distributed far from 0.016 and not statistically significant (p > 0.1), indicating the insignificant effect of the random assignment of establishing time of all-for-one tourism demonstration zones on high-quality development of tourism industry. The aforementioned results are reliable.

5.3.2. PSM Procedure

The observed effect of high-quality tourism development should attribute to all-for-one tourism rather than the effect of other macro-level characteristics associated with all-for-one tourism. In order to mitigate the potential endogeneity, this research employs PSM procedures. GDP per capita, foreign trade, information technology development, government expenditure, and industrial structure coordination are selected as covariates. The logit model of binary outcome is employed to calculate the propensity score, which indicates the prediction of establishing all-for-one tourism demonstration zones. 1:2 nearest neighbor matching and radius matching are employed to match observations in the treatment group with those in the control group. Column (1) and (2) in Table 5 reports the re-estimation results of model (1). The coefficients of independent variable are significantly positive at the 5% level, indicating the robustness of the estimation results.

6. Mechanism Analysis

Column (3) of Table 5 reports the estimation results of model (2), where the coefficient of the all-for-one tourism demonstration zones is insignificant. Column (4) reports the results of model (3). The mediator Infras is statistically significant. The Sobel test is employed to verify whether the mediating effect of network infrastructure construction exists. The result of the Sobel test shows that the p-value is lower than 0.1, indicating that network infrastructure construction is the mechanism channelling through all-for-one tourism demonstration zones and high-quality development of the tourism industry. Hypothesis 2 has been verified.
Following the above analysis, the coefficient of AT in column (5) is significant at the 10% level (coef. = 2.526, p < 0.1), indicating that all-for-one tourism demonstration zones is positively associated with tourism talent agglomeration. Moreover, the coefficient of Human is statistically positive in column (6), suggesting that tourism talent agglomeration is the mechanism channelling through all-for-one tourism demonstration zones and high-quality tourism development. The mediating effect accounts for approximately 15.8% of the total effect. Hypothesis 3 has been verified.

7. Heterogeneity Analysis

Due to the vast territory, it is undeniable that there is a distinct difference between the eastern region, central and western regions in China. The effect of all-for-one tourism may vary to a certain extent. Therefore, it is essential to consider the regional heterogeneity. Following Chen and Huo [38], the research samples have been divided into two groups: the eastern region, the central and western regions, to further clarify whether there is a difference in the effect of all-for-one tourism demonstration zones on high-quality development.
The estimated coefficient of the central and western regions is statistically significant at the 5% level in Table 6. In contrast, the coefficient in the eastern region is not statistically significant, suggesting that the all-for-one tourism demonstration zones positively impact the high-quality development of the tourism industry in central and western regions but has no significant influence on the eastern region.
In addition, since industrial integration is an essential means to implement all-for-one tourism, the tertiary industry’s development level would also influence the efficiency and effectiveness of all-for-one tourism. Columns (3) and (4) in Table 6 present the estimation results of provinces with a low and high proportion of tertiary industry to GDP, respectively. The coefficient in the low proportion of the tertiary industry is significantly positive, whereas the coefficient in the high proportion is not.

8. Discussion

All-for-one tourism provides a valuable lens for supply-side structural reform and high-quality development of the tourism industry. This research employs 31 provinces during 2010–2019 as panel data and constructs a time-varying DID model to examine the impact of all-for-one tourism demonstration zones on the high-quality development of tourism. There are some similarities and differences between this study and related studies.
First, all-for-one tourism demonstration zones are positively associated with the high-quality development of tourism. Previous studies have also shown that all-for-one tourism promotes social or economic development, such as poverty alleviation (Su, 2021) [4], industrial integration (Hou et al., 2021) [7], rural governance (Dai and Yang, 2021) [9], and green development (Zhang, 2023; Hu et al., 2023) [10,11]. Further, drawing on the new development philosophy, this research holds a multi-facet perspective, including social, economic, and other dimensions to measure and evaluate the effect of all-for-one tourism demonstration zones on the development quality of tourism. In addition, network infrastructure construction and tourism talent agglomeration play mediating roles in the relationship between all-for-one tourism demonstration zones and the high-quality development of tourism.
Second, having fully considered the heterogeneity of regions in terms of the geographical situations, estimation results reveal that all-for-one tourism profoundly impacts the high-quality development of the tourism industry in the central and western regions but has insignificant influence in the eastern region of China. This result is inconsistent with the study that the eastern region with high innovation capabilities and solid industry has advantages in improving the development quality of the tourism industry (Yan and Hu, 2021) [48]. The difference can be explained as follows: compared with the eastern region, which has diverse approaches to realize the upgrade and transformation of the tourism industry, the central and western regions have fewer approaches to optimize the allocation of tourism resources and alleviate resource scarcity due to low market development level and geographical disadvantage. Thus, infrastructure construction, talent agglomeration, government support, and public attention brought by all-for-one tourism would dramatically promote the development quality of tourism in central and western regions with a higher “marginal” impact (Xu et al., 2021) [49]. This means the lagging regions have seized the policy opportunity to improve tourism development quality and narrow the gap with the eastern region (He et al., 2023) [15].
In addition, the coefficient of all-for-one tourism demonstration zones is significantly positive in regions with low tertiary industry foundations but is insignificant in regions with high proportions of tertiary industry. Industrial integration is an essential means to implement all-for-one tourism. It is found that the fusion of all-for-one tourism with tertiary industry presents the distribution pattern of “high in the east and low in the west” in China since the solid development of tertiary industry lays a foundation to further development of the tourism industry (Zhao, 2019) [50]. However, the rapid growth of the tertiary industry may lead to a stagnant stage, indicating a limited effect of all-for-one tourism on the development quality of the tourism industry. All-for-one tourism with institutional, financial, and organizational guarantees for provinces with backward tertiary industries would help tourism to integrate with other industries, which is beneficial for the high-quality development of the tourism industry.

9. Conclusions

9.1. Research Conclusions

The main findings of this research are as follows:
First, by employing the establishment of all-for-one tourism demonstration zones as a quasi-natural experiment, the research shows that all-for-one tourism demonstration zones are positively associated with the high-quality development of tourism, and the result is robust to a series of robustness checks, including the placebo test and PSM procedures. Second, network infrastructure construction and tourism talent agglomeration are mechanisms channelling through all-for-one tourism demonstration zones and high-quality tourism development. Third, having fully considered the heterogeneity of regions in terms of the geographical situations and tertiary sector development, estimation results reveal that all-for-one tourism demonstration zones profoundly impact the high-quality development of the tourism industry in central and western regions but have insignificant influence in the eastern region. The coefficient of all-for-one tourism demonstration zones is significantly positive in regions with low tertiary industry foundations but is insignificant in regions with a high tertiary industry.

9.2. Practical Implications

Given that all-for-one tourism demonstration zones positively impact the high-quality development of tourism, there are practical implications as follows:
First, government and official authorities, as dominant instructors of all-for-one tourism, are supposed to use the leading role of the tourism industry in development. Combining tourism development with economic and social development planning and with urban and rural construction is beneficial to enhance the whole region’s competitive advantage comprehensively. In particular, local governments in central and western regions should actively participate in all-for-one tourism, which would narrow the economic development gap with the eastern region.
Second, it is essential to fully use the advantages and development opportunities brought by all-for-one tourism. On the one hand, governments and other public services sectors are expected to improve transportation and communication infrastructure construction, which helps optimize the allocation of tourism factors and resources. On the other hand, governments should formulate attractive policies such as tax breaks, subsidized grants and loans, and digital training to provide a favorable environment to attract more talents with cutting-edge knowledge and advanced management skills.
Third, since there are distinct spatial and temporal differences in the high-quality development of tourism among regions, it is significant to strengthen inter-regional cooperation to narrow the development gap. Governments should not only formulate tourism policies following local natural conditions and factor endowments to boost competitiveness and obtain sustainable advantages but also promote inter-regional communications and cooperation in talents, capital, and other dimensions.

9.3. Limitations and Future Research

This research has clarified a positive association between the all-for-one tourism demonstration zones and high-quality tourism development by constructing a quasi-natural experiment with the time-varying DID method. However, several limitations remain to explore. First, this research has only investigated the province-level all-for-one tourism demonstration zones, and future research is expected to examine the effectiveness of all-for-one demonstration zones on the municipal and country level. Second, network infrastructure construction and tourism talent agglomeration effectively channel all-for-one demonstration zones and high-quality tourism development. Other mechanisms and their synergistic effect await further research. Qualitative Comparative Analysis (QCA) has the advantage of clarifying the conditions and their synergistic effect from the holistic perspective, providing a more valuable lens to figure out diverse approaches of all-for-one tourism demonstration zones leading to the high-quality development of the tourism industry.

Author Contributions

Conceptualization, Z.W., C.L and J.L.; methodology, Z.W. and C.L; software, Z.W.; validation, Z.W.; formal analysis, Z.W. and C.L; resources, Z.W. and C.L; data curation, Z.W. and C.L; writing—original draft preparation, Z.W.; writing—review and editing, C.L; visualization, Z.W. and C.L.; supervision, J.L.; project administration, J.L. All authors have read and agreed to the published version of the manuscript.

Funding

This research is funded by the Postgraduate Innovation Project of Shandong University of Finance and Economics, Grant No. 2022cxxm013.

Institutional Review Board Statement

Not applicable.

Informed Consent Statement

Not applicable.

Data Availability Statement

All the data analyzed has been included in the paper.

Acknowledgments

We thank the editors and reviewers for the constructive comments and suggestions concerning our manuscript.

Conflicts of Interest

The authors declare no conflict of interest.

References

  1. Balaguer, J.; Cantavella-Jorda, M. Tourism as a Long-Run Economic Growth Factor: The Spanish Case. Appl. Econ. 2002, 34, 877–884. [Google Scholar] [CrossRef] [Green Version]
  2. Kadiyali, V.; Kosová, R. Inter-Industry Employment Spillovers from Tourism Inflows. Reg. Sci. Urban Econ. 2013, 43, 272–281. [Google Scholar] [CrossRef]
  3. Zhou, M.; Liu, X.Q.; Pan, B.; Yang, X.; Wen, F.H.; Xia, X.H. Effect of Tourism Building Investments on Tourist Revenues in China: A Spatial Panel Econometric Analysis. Emerg. Mark. Financ. Trade 2017, 53, 1973–1987. [Google Scholar] [CrossRef]
  4. Su, D. Research on the (Establishment of) Path of Realizing the Targeted Poverty Alleviation Through Tourism under the Perspective of All-for-One Tourism. In Proceedings of the International Conference on Tourism, Economy and Environmental Sustainability, Xiamen, China, 5–7 March 2021; Volume 251, p. 03024. [Google Scholar]
  5. Li, X.J.; Zhang, L.Y.; Cui, L. Comprehensive Tourism: Idea Innovation on Building a World-Class Tourism Destination. Hum. Geogr. 2013, 28, 130–134. (In Chinese) [Google Scholar]
  6. Xu, L.J. Study on the “All-for-One Tourism” and Tourism Development in Ethnic Regions—Take Weixi Lisu Autonomous County as an Example. Int. J. New Dev. Eng. Soc. 2017, 1, 119–123. [Google Scholar]
  7. Hou, Y.T.; Peng, G.Q.; Lu, Y.Z.; Zhang, X.L. Collaborative Effect and Innovative Approaches of Integrated Development of Sports and Tourism in China under the Background of All-Area-Advancing Tourism. Sport. Cult. Guide 2021, 10, 29–35+42. (In Chinese) [Google Scholar]
  8. Gao, N.; Zhang, M.; Gu, Z.; Wan, Z. Study on the Route Optimization of the All-for-One Tourism Demonstration Area Construction Based on the "Four-Domain and Nine-Tactic" Framework. Highlights Bus. Econ. Manag. 2023, 3, 56–63. [Google Scholar] [CrossRef]
  9. Dai, X.F.; Yang, M.Y. A Practical Study of Al-Area-Advancing Tourism for Helping the County-Level Governance: The Case of Liyang City in Jiangsu Province. J. Yunnan Minzu Univ. 2021, 38, 91–99. (In Chinese) [Google Scholar]
  10. Zhang, M. The Impact Mechanism of All-for-One Tourism on Carbon Emissions in China. Acad. J. Manag. Soc. Sci. 2023, 2, 50–52. [Google Scholar] [CrossRef]
  11. Hu, Z.L.; Kumar, J.; Qin, Q. Assessing the Coupling Coordination Degree between All-for-One Tourism and Tcological Civilization; Case of Guizhou, China. Environ. Sustain. Indic. 2023, 19, 100272. [Google Scholar]
  12. Dai, X.F.; Yang, M.Y. All-for-One Tourism Drives the High-Quality Development of Tourism. Tour. Trib. 2022, 37, 6–8. (In Chinese) [Google Scholar]
  13. Assaf, A.G.; Tsionas, E.G. Incorporating Destination Quality into the Measurement of Tourism Performance: A Bayesian Approach. Tour. Manag. 2015, 49, 58–71. [Google Scholar] [CrossRef]
  14. Cuccia, T.; Guccio, C.; Rizzo, I. The Effects of UNESCO World Heritage List Inscription on Tourism Destinations Performance in Italian Regions. Econ. Model. 2016, 53, 494–508. [Google Scholar] [CrossRef]
  15. He, H.; Tuo, S.H.; Lei, K.W.; Gao, A.X. Assessing Quality Tourism Development in China: An Analysis Based on the Degree of Mismatch and Its Influencing Factors. Environ. Dev. Sustain. 2023. [Google Scholar] [CrossRef]
  16. Lu, Y. The Measurement of High-Quality Development Level of Tourism: Based on the Perspective of Industrial Integration. Sustainability 2022, 14, 3355. [Google Scholar] [CrossRef]
  17. Cheng, Z.B.; Wang, C.D. A Study on Synergistic Development of All-for-One Ecotourism of Chengdu-Chongqing Urban Cluster. Open Access Libr. J. 2019, 6, e5379. [Google Scholar] [CrossRef]
  18. Li, D.H.; Jiang, L.X. Analysis on the Focus and Non-focus of All-for-One Tourism—Reflection Based on the Practice of All-for-One Tourism Development. Tour. Trib. 2020, 35, 6–8. (In Chinese) [Google Scholar]
  19. Zou, Y.Y. Theoretical Analysis of All-for-One Tourism Development Policy. Master’s Thesis, Qingdao University, Qingdao, China, 2019. (In Chinese). [Google Scholar]
  20. Huang, S.J.; Xiao, H.J.; Wang, X. Study on High-Quality Development of the State-Owned Enterprises. China Ind. Econ. 2018, 36, 19–41. (In Chinese) [Google Scholar]
  21. Liu, Y.J.; Han, Y.J. Factor Structure, Institutional Environment and High-Quality Development of the Tourism Economy in China. Tour. Trib. 2020, 35, 28–38. (In Chinese) [Google Scholar]
  22. Gao, J.L.; Shao, C.F.; Chen, S.H. Evolution and Driving Factors of the Spatiotemporal Pattern of Tourism Efficiency at the Provincial Level in China Based on SBM–DEA Model. Int. J. Environ. Res. Public Health 2022, 19, 10118. [Google Scholar] [CrossRef]
  23. Li, S.X.; Cheng, Z.H.; Tong, Y.; He, B. The Interaction Mechanism of Tourism Carbon Emission Efficiency and Tourism Economy High-Quality Development in the Yellow River Basin. Energies 2022, 15, 6975. [Google Scholar] [CrossRef]
  24. Zhao, X.N.; Mei, X.H.; Xiao, Z.Q. Impact of the Digital Economy in the High-Quality Development of Tourism—An Empirical Study of Xinjiang in China. Sustainability 2022, 14, 12972. [Google Scholar] [CrossRef]
  25. Shi, Z.Y.; Xu, D.H.; Xu, L.D. Spatiotemporal Characteristics and Impact Mechanism of High-Quality Development of Cultural Tourism in the Yangtze River Delta Urban Agglomeration. PLoS ONE 2021, 16, e0252842. [Google Scholar] [CrossRef] [PubMed]
  26. Huang, Y.; Wang, Y.B. How Does High-Speed Railway Affect Green Innovation Efficiency? A Perspective of Innovation Factor Mobility. J. Clean Prod. 2020, 265, 121623. [Google Scholar] [CrossRef]
  27. Cranmer, E.E.; tom Dieck, M.C.; Fountoulaki, P. Exploring the Value of Augmented Reality for Tourism. Tour. Manag. Perspect. 2020, 35, 100672. [Google Scholar] [CrossRef]
  28. Li, B.; Liu, J.; Liu, Q.; Mohiuddin, M. The Effects of Broadband Infrastructure on Carbon Emission Efficiency of Resource-Based Cities in China: A Quasi-Natural Experiment from the “Broadband China” Pilot Policy. Int. J. Environ. Res. Public Health 2022, 19, 6734. [Google Scholar] [CrossRef]
  29. Zou, W.Y.; Pan, M.J. Does the Construction of Network Infrastructure Reduce Environmental Pollution?—Evidence from a Quasi-Natural Experiment in “Broadband China”. Environ. Sci. Pollut. Res. 2023, 30, 242–258. [Google Scholar] [CrossRef]
  30. Yoo, Y.; Majchrzak, A.; Lyytinen, K.; Boland, R.J., Jr. Organizing for Innovation in the Digitized World. Organ Sci. 2012, 23, 1398–1408. [Google Scholar] [CrossRef]
  31. Xiao, J.Y.; Zheng, X.M. Modularity and Industrial Convergence: Coupling, Mechanism and Effects. Sci. Technol. Manag. Res. 2012, 32, 13–15+30. (In Chinese) [Google Scholar]
  32. Schultz, T.W. Reflections on Investment in Man. J. Polit. Econ. 1962, 70, 1–8. [Google Scholar] [CrossRef]
  33. Liu, Z.Y.; Li, H.Z.; Hu, Y.Y.; Li, C.H. Human Capital Structure Upgrading and Economic Growth: A Reconsideration of Disparities among China’s Eastern, Central and Western Regions. Econ. Res. J. 2018, 53, 50–63. (In Chinese) [Google Scholar]
  34. Yang, J.P.; Wang, S.J.; Sun, S.; Zhu, J.H. Influence Mechanism of High-Tech Industrial Agglomeration on Green Innovation Performance: Evidence from China. Sustainability 2022, 14, 3187. [Google Scholar] [CrossRef]
  35. Callaway, B.; Sant’Anna, P.H.C. Difference-in-Differences with Multiple Time Periods. J. Econom. 2021, 225, 200–230. [Google Scholar] [CrossRef]
  36. Beck, T.; Levine, R.; Levkov, A. Big Bad Banks? The Winners and Losers from Bank Deregulation in the United States. J. Financ. 2010, 65, 1637–1667. [Google Scholar] [CrossRef] [Green Version]
  37. Baron, R.M.; Kenny, D.A. The Moderator–Mediator Variable Distinction in Social Psychological Research: Conceptual, Strategic, and Statistical Considerations. J. Pers. Soc. Psychol. 1986, 51, 1173–1182. [Google Scholar] [CrossRef]
  38. Chen, L.M.; Huo, C.J. The Measurement and Influencing Factors of High-Quality Economic Development in China. Sustainability 2022, 14, 9293. [Google Scholar] [CrossRef]
  39. Sun, Y.Y.; Higham, J. Overcoming Information Asymmetry in Tourism Carbon Management: The Application of a New Reporting Architecture to Aotearoa New Zealand. Tour. Manag. 2021, 83, 104231. [Google Scholar] [CrossRef]
  40. Wang, X.L.; Dong, F.; Pan, Y.L.; Liu, Y.J. Transport Infrastructure, High-Quality Development and Industrial Pollution: Fresh Evidence from China. Int. J. Environ. Res. Public Health 2022, 19, 9494. [Google Scholar] [CrossRef]
  41. Guo, S.Y. Application of Entropy Weight Method in the Evaluation of the Road Capacity of Open Area. In Proceedings of the 1st International Conference on Materials Science, Energy Technology, Power Engineering, Hangzhou, China, 15–16 April 2017; Volume 1839, p. 020120. [Google Scholar]
  42. Zhu, Y.X.; Tian, D.Z.; Yan, F. Effectiveness of Entropy Weight Method in Decision-Making. Math. Probl. Eng. 2020, 2020, 3564835. [Google Scholar] [CrossRef]
  43. Sun, L.; Xu, W.C. The Impact of Economy Trade on Regional GVC Embeddedness: A Analysis from the Perspective of Spatial Spillover. Bus. Manag. J. 2021, 43, 16–34. (In Chinese) [Google Scholar]
  44. Yang, S.Y.; Liu, W.; Zhang, Z. The Dynamic Value of China’s High-Tech Zones: Direct and Indirect Influence on Urban Ecological Innovation. Land 2022, 11, 59. [Google Scholar] [CrossRef]
  45. Liu, J.; Li, Q.J.; Liu, X.Z. Research on the Effect of Tourism Talent Structure on Regional Tourism Economic Growth. Rev. Econ. Manag. 2018, 34, 151–160. (In Chinese) [Google Scholar]
  46. Liu, J.; Du, Y.N.; Li, Y.Y. Research on the Function of Tourism Talents Structure Evolution and Its Effect on the Economic Growth of Tourism. J. Qingdao Univ. Sci. Technol. 2017, 33, 36–41. (In Chinese) [Google Scholar]
  47. Chi, F.T.; Han, H.Y. The Impact of High-Speed Rail on Economic Development: A County-Level Analysis. Land 2023, 12, 874. [Google Scholar]
  48. Yan, Y.B.; Hu, H.H. Analysis on the Measurement of China’s Inter-Provincial High-Quality Development Tourism Level and Spatial-Temporal Evolution. J. Hunan Univ. Financ. Econ. 2021, 37, 5–18. (In Chinese) [Google Scholar]
  49. Xu, K.; Wang, Y.; Tang, Y. Analysis of the Economic Effect of the National All-for-One Tourism Demonstration Zone: Quasi-Natural Experimental Data from Prefecture-Level Cities. J. Chongqing Univ. 2021, 27, 216–230. (In Chinese) [Google Scholar]
  50. Zhao, C.S. The Integration of China’s Tourism Industry and Three Industries and It’s Spatio-Temporal Evolution. Inq. Into Econ. Issues 2019, 2019, 165–174. (In Chinese) [Google Scholar]
Figure 1. Geographical distribution of provincial-level all-for-one tourism demonstration zones (by the end of 2018).
Sustainability 15 11626 g001
Figure 2. Comprehensive index of high-quality tourism development of research samples in 2010 and 2019.
Sustainability 15 11626 g002
Figure 3. Parallel trend test.
Sustainability 15 11626 g003
Figure 4. Placebo test.
Sustainability 15 11626 g004
Table 1. Measurement and evaluation indicator system of high-quality development of tourism.
Primary IndicatorsSecondary IndicatorsTertiary IndicatorsWeightPositive/Negative Indicator
Innovative
Development
Human CapitalNumber of students in tourism higher education institutions (persons)0.0773Positive
Educational InvestmentNumber of students in higher education per 100,000 persons (persons)0.0400Positive
Coordinated
Development
Urban DevelopmentUrban population density (persons/km2)0.0344Moderate
Urban-Rural CoordinationDisposable income of urban residents/disposable income of rural residents (%)0.0144Negative
Consumption StructureConsumption expenditure of urban residents/consumption
expenditure of rural residents (%)
0.0178Negative
Green
Development
Environmental ManagementForest coverage rate (%)0.0623Positive
Ecological ProtectionNumber of local natural reserves (number)0.1050Positive
Open
Development
Reception ServiceNumber of beds in local star-rated hotels (sheets)0.0558Positive
Number of employees in local star-rated hotels (persons)0.0746Positive
Market ScaleNumber of visits received by local destinations and attractions (billion persons)0.1013Positive
Shared
Development
Infrastructure ConstructionWater, land, and air passenger volume (10,000 persons)0.0960Positive
Public transportation vehicles per 10,000 persons (vehicles)0.0338Positive
Number of museums per 10,000 persons (number)0.0513Positive
Public ServicesNumber of public libraries per 10,000 persons (number)0.1679Positive
Number of art performance venues per 10,000 persons (number)0.0681Positive
Table 2. High-quality development of tourism for 31 provinces from 2010 to 2019.
Province2010201120122013201420152016201720182019
Beijing0.3078 0.3189 0.3305 0.2771 0.2655 0.2815 0.2789 0.3188 0.2799 0.2734
Tianjin0.1465 0.1715 0.1585 0.1511 0.1558 0.1699 0.1693 0.1938 0.2016 0.2025
Hebei0.1535 0.1879 0.1951 0.2292 0.1775 0.1935 0.1932 0.1997 0.2040 0.2115
Shanxi0.2171 0.2259 0.2362 0.1870 0.1871 0.1961 0.1894 0.1912 0.1987 0.2096
Inner Mongolia0.1585 0.1607 0.1717 0.1748 0.1842 0.1937 0.1922 0.2049 0.2124 0.2162
Liaoning0.2373 0.2314 0.2253 0.2112 0.2143 0.2473 0.2363 0.2438 0.2410 0.2347
Jilin0.1530 0.1638 0.1762 0.1779 0.1729 0.1938 0.1796 0.1902 0.1904 0.1957
Heilongjiang0.2535 0.2503 0.2562 0.2479 0.2657 0.2712 0.2784 0.2845 0.2874 0.2992
Shanghai0.1837 0.1826 0.2139 0.1806 0.1764 0.1880 0.1845 0.1908 0.1830 0.1928
Jiangsu0.3088 0.3147 0.3199 0.3015 0.2841 0.3262 0.3273 0.3429 0.3504 0.3332
Zhejiang0.3345 0.3436 0.3943 0.3175 0.3233 0.3825 0.3746 0.3911 0.3824 0.4002
Anhui0.2476 0.2692 0.2903 0.2156 0.2205 0.2452 0.2307 0.2392 0.2415 0.2523
Fujian0.2298 0.2395 0.2586 0.2580 0.2637 0.2699 0.2681 0.2762 0.2880 0.3212
Jiangxi0.2546 0.2571 0.2759 0.2702 0.2756 0.2866 0.2888 0.2949 0.2866 0.3034
Shandong0.2877 0.3074 0.2989 0.2675 0.2724 0.2822 0.2951 0.3136 0.3310 0.3202
Henan0.2241 0.2262 0.2323 0.2124 0.2200 0.2363 0.2384 0.2499 0.2567 0.2664
Hubei0.1941 0.2070 0.2185 0.2294 0.2350 0.2496 0.2398 0.2516 0.2540 0.2565
Hunan0.2477 0.2610 0.2575 0.2495 0.2558 0.2685 0.2675 0.2776 0.2811 0.2912
Guangdong0.4515 0.4847 0.4905 0.4379 0.4293 0.4161 0.4198 0.4195 0.4332 0.4294
Guangxi0.1923 0.1862 0.1926 0.1986 0.1976 0.2304 0.2190 0.2270 0.2437 0.2472
Hainan0.1779 0.1816 0.1835 0.1771 0.1795 0.1786 0.1887 0.1952 0.1961 0.2178
Chongqing0.1558 0.1710 0.1753 0.1746 0.1859 0.1993 0.1870 0.1932 0.2074 0.2123
Sichuan0.2555 0.2792 0.3030 0.2828 0.2733 0.2791 0.2882 0.3086 0.3206 0.3223
Guizhou0.1399 0.1501 0.1580 0.1760 0.1770 0.1887 0.1945 0.2089 0.2259 0.2199
Yunnan0.2209 0.2232 0.2337 0.2231 0.2366 0.2475 0.2380 0.2459 0.2506 0.3273
Tibet0.1264 0.1065 0.2826 0.2582 0.2642 0.2720 0.2749 0.2679 0.2601 0.2558
Shaanxi0.2216 0.2452 0.2667 0.2708 0.2742 0.2870 0.2784 0.2953 0.3015 0.3065
Gansu0.1551 0.1607 0.1699 0.1674 0.1662 0.1738 0.1890 0.2054 0.2074 0.2183
Qinghai0.1514 0.1684 0.1803 0.1610 0.1632 0.1595 0.1661 0.1718 0.1891 0.2052
Ningxia0.0823 0.0798 0.0931 0.0941 0.0974 0.0967 0.1016 0.1419 0.1459 0.1509
Xinjiang0.1474 0.1530 0.1551 0.1583 0.1617 0.1566 0.1518 0.1517 0.1529 0.1583
Table 3. Descriptive statistics.
VariablesMeanStdMinMedianMax
HQD0.2360.0700.0800.2300.491
AT0.0740.2630.0000.0001.000
Tourism0.1680.0940.0400.1450.735
Trade15.1591.71310.71515.15418.668
Foreign5.0271.4320.5885.2548.229
Cable10.0790.8396.81910.35511.715
Govern0.0280.0310.0100.0210.224
Road15.3254.6454.04014.74026.196
Density2818.8071172.555515.0002631.5005821.000
Infras0.2000.0830.0670.1880.581
Human0.0320.0230.0010.0280.120
Table 4. Baseline regression results.
(1)(2)(3)(4)(5)(6)(7)(8)
AT0.012 **0.012 **0.011 **0.011 **0.013 ***0.015 **0.016 **0.016 **
(2.212)(2.232)(2.061)(2.104)(2.885)(2.568)(2.671)(2.641)
Tourism 0.0660.0590.0600.0520.0560.0470.052
(1.559)(1.399)(1.573)(1.449)(1.261)(1.147)(1.224)
Trade 0.012 **0.009 **0.010 **0.011 **0.011 *0.011 **
(2.548)(2.222)(2.316)(2.066)(2.026)(2.050)
Foreign 0.013 **0.013 **0.013 **0.013 *0.013 *
(2.263)(2.268)(2.133)(1.965)(1.909)
Cable 0.0240.016 *0.0150.014
(1.566)(1.825)(1.657)(1.575)
Govern 1.227 **1.249 **1.190 **
(2.410)(2.646)(2.560)
Road 0.0010.001
(1.074)(1.430)
Density 0.000
(1.139)
RegionControlControlControlControlControlControlControlControl
YearControlControlControlControlControlControlControlControl
Constant0.235 ***0.224 ***0.0450.018−0.237−0.196−0.205−0.214 *
(559.928)(31.666)(0.638)(0.250)(−1.228)(−1.678)(−1.686)(−1.735)
Observations310310310310310310310310
R-sq0.0200.0460.0650.0990.1200.2310.2380.246
Note: Numbers reported are regression coefficients with t statistics in parentheses. *, **, and *** indicate significance at the 0.10, 0.05, and 0.01 levels.
Table 5. PSM Procedures and mechanism analysis.
(1) Neighbor Matching(2) Radius Matching(3) Infras(4) HQD(5) Human(6) HQD
AT0.012 **0.013 **0.0110.012 **2.526 *0.013 **
(2.688)(2.541)(1.657)(2.178)(1.804)(2.276)
Infras 0.308 ***
(8.955)
Human 0.001 **
(2.398)
Tourism−0.0030.035−0.0300.06222.058 **0.034
(−0.134)(1.024)(−0.853)(1.578)(2.149)(0.815)
Trade0.011 *0.0050.025 **0.0040.2240.011 **
(2.011)(0.617)(2.211)(0.448)(0.108)(2.278)
Foreign0.0060.015 **−0.0030.013 **2.3520.010 *
(1.185)(2.515)(−0.519)(2.106)(1.667)(1.765)
Cable0.018 *0.0080.049−0.0016.321 ***0.008
(1.995)(0.420)(1.597)(−0.146)(2.834)(0.959)
Govern−0.975 **−0.7242.673 ***0.32888.4521.078 **
(−2.434)(−1.424)(10.125)(0.919)(1.382)(2.605)
Road0.001−0.0000.004 ***0.000−0.1170.001
(0.488)(−0.136)(3.679)(0.271)(−0.494)(1.571)
Density0.0000.0000.000 ***−0.000−0.0010.000 *
(1.020)(1.187)(7.040)(−0.787)(−1.059)(1.751)
Region ControlControlControlControlControlControl
YearControlControlControlControlControlControl
Constant−0.1410.006−0.866 *0.052−60.285−0.165
(−0.906)(0.024)(−1.950)(0.312)(−1.405)(−1.287)
Observations188279310310310310
R-sq0.1920.1600.5330.3630.1210.289
Note: Numbers reported are regression coefficients with t statistics in parentheses. *, **, and *** indicate significance at the 0.10, 0.05, and 0.01 levels.
Table 6. Heterogeneity analysis.
(1) Eastern Region(2) Central and Western Regions(3) Low Proportion of the Tertiary Sector(4) High Proportion of the Tertiary Sector
AT0.0140.024 **0.016 **0.016
(1.727)(2.362)(2.238)(1.120)
Tourism0.0350.0290.069−0.022
(0.558)(0.658)(1.189)(−0.398)
Trade0.094 **0.0060.014 **0.016
(2.898)(1.197)(2.471)(0.963)
Foreign−0.0120.0110.0140.014 *
(−0.846)(1.224)(1.320)(1.840)
Cable0.014 *0.0050.025 *−0.018
(1.826)(0.336)(2.107)(−0.875)
Govern−1.7251.302 ***1.183 ***0.588
(−1.074)(2.912)(2.972)(0.335)
Road0.0010.0000.0010.003
(0.698)(0.118)(1.169)(1.257)
Density0.0000.0000.0000.000
(1.168)(0.876)(0.915)(1.652)
RegionControlControlControlControl
YearControlControlControlControl
Constant−1.401 **−0.038−0.382 ***0.049
(−2.237)(−0.196)(−3.066)(0.146)
Observations110200155155
R-sq0.2010.3070.3800.120
Note: Numbers reported are regression coefficients with t statistics in parentheses. *, **, and *** indicate significance at the 0.10, 0.05, and 0.01 levels.
Disclaimer/Publisher’s Note: The statements, opinions and data contained in all publications are solely those of the individual author(s) and contributor(s) and not of MDPI and/or the editor(s). MDPI and/or the editor(s) disclaim responsibility for any injury to people or property resulting from any ideas, methods, instructions or products referred to in the content.

