Article

Simulation and Optimization Study on the Performance of Fin-and-Tube Heat Exchanger

1
Institute of Refrigeration & Cryogen, Zhejiang University, Hangzhou 310027, China
2
Institute of Energy Utilization and Automation, Hangzhou Dianzi University, Hangzhou 310018, China
3
Ningbo Hicon Industry Co., Ltd., Yuyao 315470, China
*
Author to whom correspondence should be addressed.
Sustainability 2023, 15(15), 11587; https://doi.org/10.3390/su151511587
Submission received: 17 June 2023 / Revised: 15 July 2023 / Accepted: 24 July 2023 / Published: 27 July 2023
(This article belongs to the Section Social Ecology and Sustainability)

Abstract

:
Heat exchangers (HX) are often utilized in industry, and the optimization of the performance of HX is a key area of research. In this study, EVAP-COND software 4.0 and genetic algorithm (GA) based optimization methods were proposed to optimize the circuitry and fin pitch of a finned tube heat exchanger for an air conditioner. A simulation model for a multi-circuit finned-tube evaporator used in an air conditioning unit was developed using the EVAP-COND software, and further validated based on the experimental data. Considering the refrigerant flow maldistribution of the original HX, four different circuit arrangements, i.e., types A, B, C, and D, were designed and optimized circuitry obtained. Based on both simulation and experimental results, D-type HX with 1.8 mm fin pitch was selected as 10% tubes could be saved with no significant loss of heat transfer capacity. Then the fin pitch was further optimized using the multi-objective GA method, with both Colburn factor j and friction factor f being considered. Optimization results showed that, in Pareto front, points 1 to 4 showed the increase in the Colburn factor j was negative, while the decrease in the friction factor f was positive. The friction factor decreased by 3.5% as one moved from Point 1 to Point 4, but the Colburn factor rose by 1.02%. Points 5 to 10 demonstrated that, while the decrease in the friction factor was negative, the increase in the Colburn factor was positive. The friction factor decreased by 5.31%, but the Colburn factor increased by 1.51% when going from Point 5 to Point 10. The results of optimization demonstrated that the objective function performed at its optimum when the fin pitch was around 1.77 mm.

1. Introduction

Fin-and-tube heat exchangers (FTHXs) are prominent components and widely adopted in air-conditioning and heat pump systems [1,2,3], which are commonly used to realize heat transfer between air and a coolant. The performance of FTHXs is greatly affected by its geometry, such as a large number of structural parameters (fin pitch, fin thickness, tube diameter, tube length, etc.), and therefore, conducting optimization on such parameters can significantly improve its performance [4].
Additionally, due to the poor heat transfer properties of the air side, the thermal resistance of the air-to-coolant HX is relatively high. Nearly 80% of the overall thermal resistance in heat exchangers comes from the thermal resistance on the air side [4,5]. This reduces the heat exchanger’s total thermal performance, thus it is necessary to increase the air side’s heat transfer coefficient using standard methods [6]. Finned surfaces on the air side are typically utilized among them to improve the overall thermal performance of heat exchangers by increasing the Colburn j factor and lowering the friction f factor.
Even though evaluating FTHX performance in a lab setting is typically preferred, performing this study that way would be incredibly tedious, time-consuming, and expensive. Simulated results could be used to achieve the study’s objective. Relative trends can be reasonably predicted with a comprehensive simulation model. In light of this, the starting point for this investigation was a constructed tube-by-tube evaporator and condenser model, EVAP-COND [7]. Zhao et al. [8] adopted the EVAP-COND to study the impacts of the circuit number on the functionality of an outdoor FTHX in an air-source heat pump. A circuitry with reverse variables was suggested. The findings indicate that four circuits gave the evaporator its maximum capacity. Comparative experiments revealed that the reversely variable FTHX has a 6.1% higher cooling capacity than the four-circuit reversely fixed exchanger in the air source heat pump (ASHP). Song et al. [9] investigated the impact of non-uniform air velocity distribution on the operation of a multi-circuit evaporator in a numerical study using EVAP-COND. According to the findings, the evaporator capacity was 7.78% lower under non-uniform air distribution than it was under uniform air distribution. Domanski [10] et al. combined the ISHED1 scheme with a non-Darwinian learnable evolution model for circuitry optimization and relied on a detailed evaporator model obtained from NIST’s EVAP-COND simulation software.
The goal of this study was to obtain an appropriate design of refrigerant circuitry for R410a finned-tube evaporators by analyzing the effect of circuitry on evaporator performance. Studies focusing on FTHX optimization frequently involve comparing coils with various pre-selected refrigerant circuits. The multi-objective optimization of FTHXs has embraced the genetic algorithm (GA), which offers powerful auto-search capabilities in the optimization design of FTHXs [11,12,13,14,15,16,17,18,19].
The geometrical optimization of heat exchangers has so far been performed using the GA technique in order to achieve the best outcomes under the predetermined design objectives. Tang et al. [20] proposed a brand-new H-type finned elliptical tube HX with longitudinal vortex generators. The multi-objective evolutionary algorithm was used to optimize the design parameters in order to achieve the maximum enhancement of heat transmission with the least augmentation of the friction factor. The ideal combination was found by thoroughly contrasting the Nusselt number, friction factor, and performance evaluation standards of Pareto optimal solutions. Sadeghzadeh et al. [21] used a non-dominated sorting genetic algorithm (NSGA-II) in order to optimize the shell and tube heat exchangers. The findings demonstrated that the minimal and maximum objective functions were given, enabling the designer to pick the best features among these solutions in accordance with specifications.
Zhang et al. [22] investigated a GA-based technique for heat exchanger multi-objective optimization. The input air velocity and tube ellipticity are used as the optimization variables with the tube fin heat exchanger (TFHE) as the study subject. According to the optimization results, the pressure drop of the TFHE reduced by 20% when the Reynolds number was 541 and the ellipticity was 0.34, while the heat transfer coefficient, whose j/f was 1.28 times greater than that of the original HX, remained almost unaltered. Zeeshan et al. [23] used the MOORA (multi-objective optimization on the basis of ratio analysis) method to determine the order of performance. According to the findings, the heat transfer coefficient increased by 13.99% at a Reynolds number of 400 on the airside and by 4.99% at a Reynolds number of 900 on the airside. A higher Reynolds number (Re = 900) also resulted in a 39.94% reduction in the pressure drop.
Therefore, the purpose of this work, given the current situation, is to suggest a suitable and flexible architecture of various circuitries for FTHXs to improve their thermal performance. The tube arrangement model of FTHX is created using EVAP-COND, and the change trend of the heat transfer efficiency of HX is also examined. The original FTHX is then contrasted with six more varieties of HXs that have various circuit configurations. The HX’s multi-objective optimization fin pitch and heat transfer capacity are built using the multi-objective genetic algorithm (NSGA-II). The Colburn factor (j) and friction factor (f) are set as the optimization objective function, while the structural parameters are specified as the variable. Finally, the structure optimization problem’s Pareto optimum frontier is then discovered.

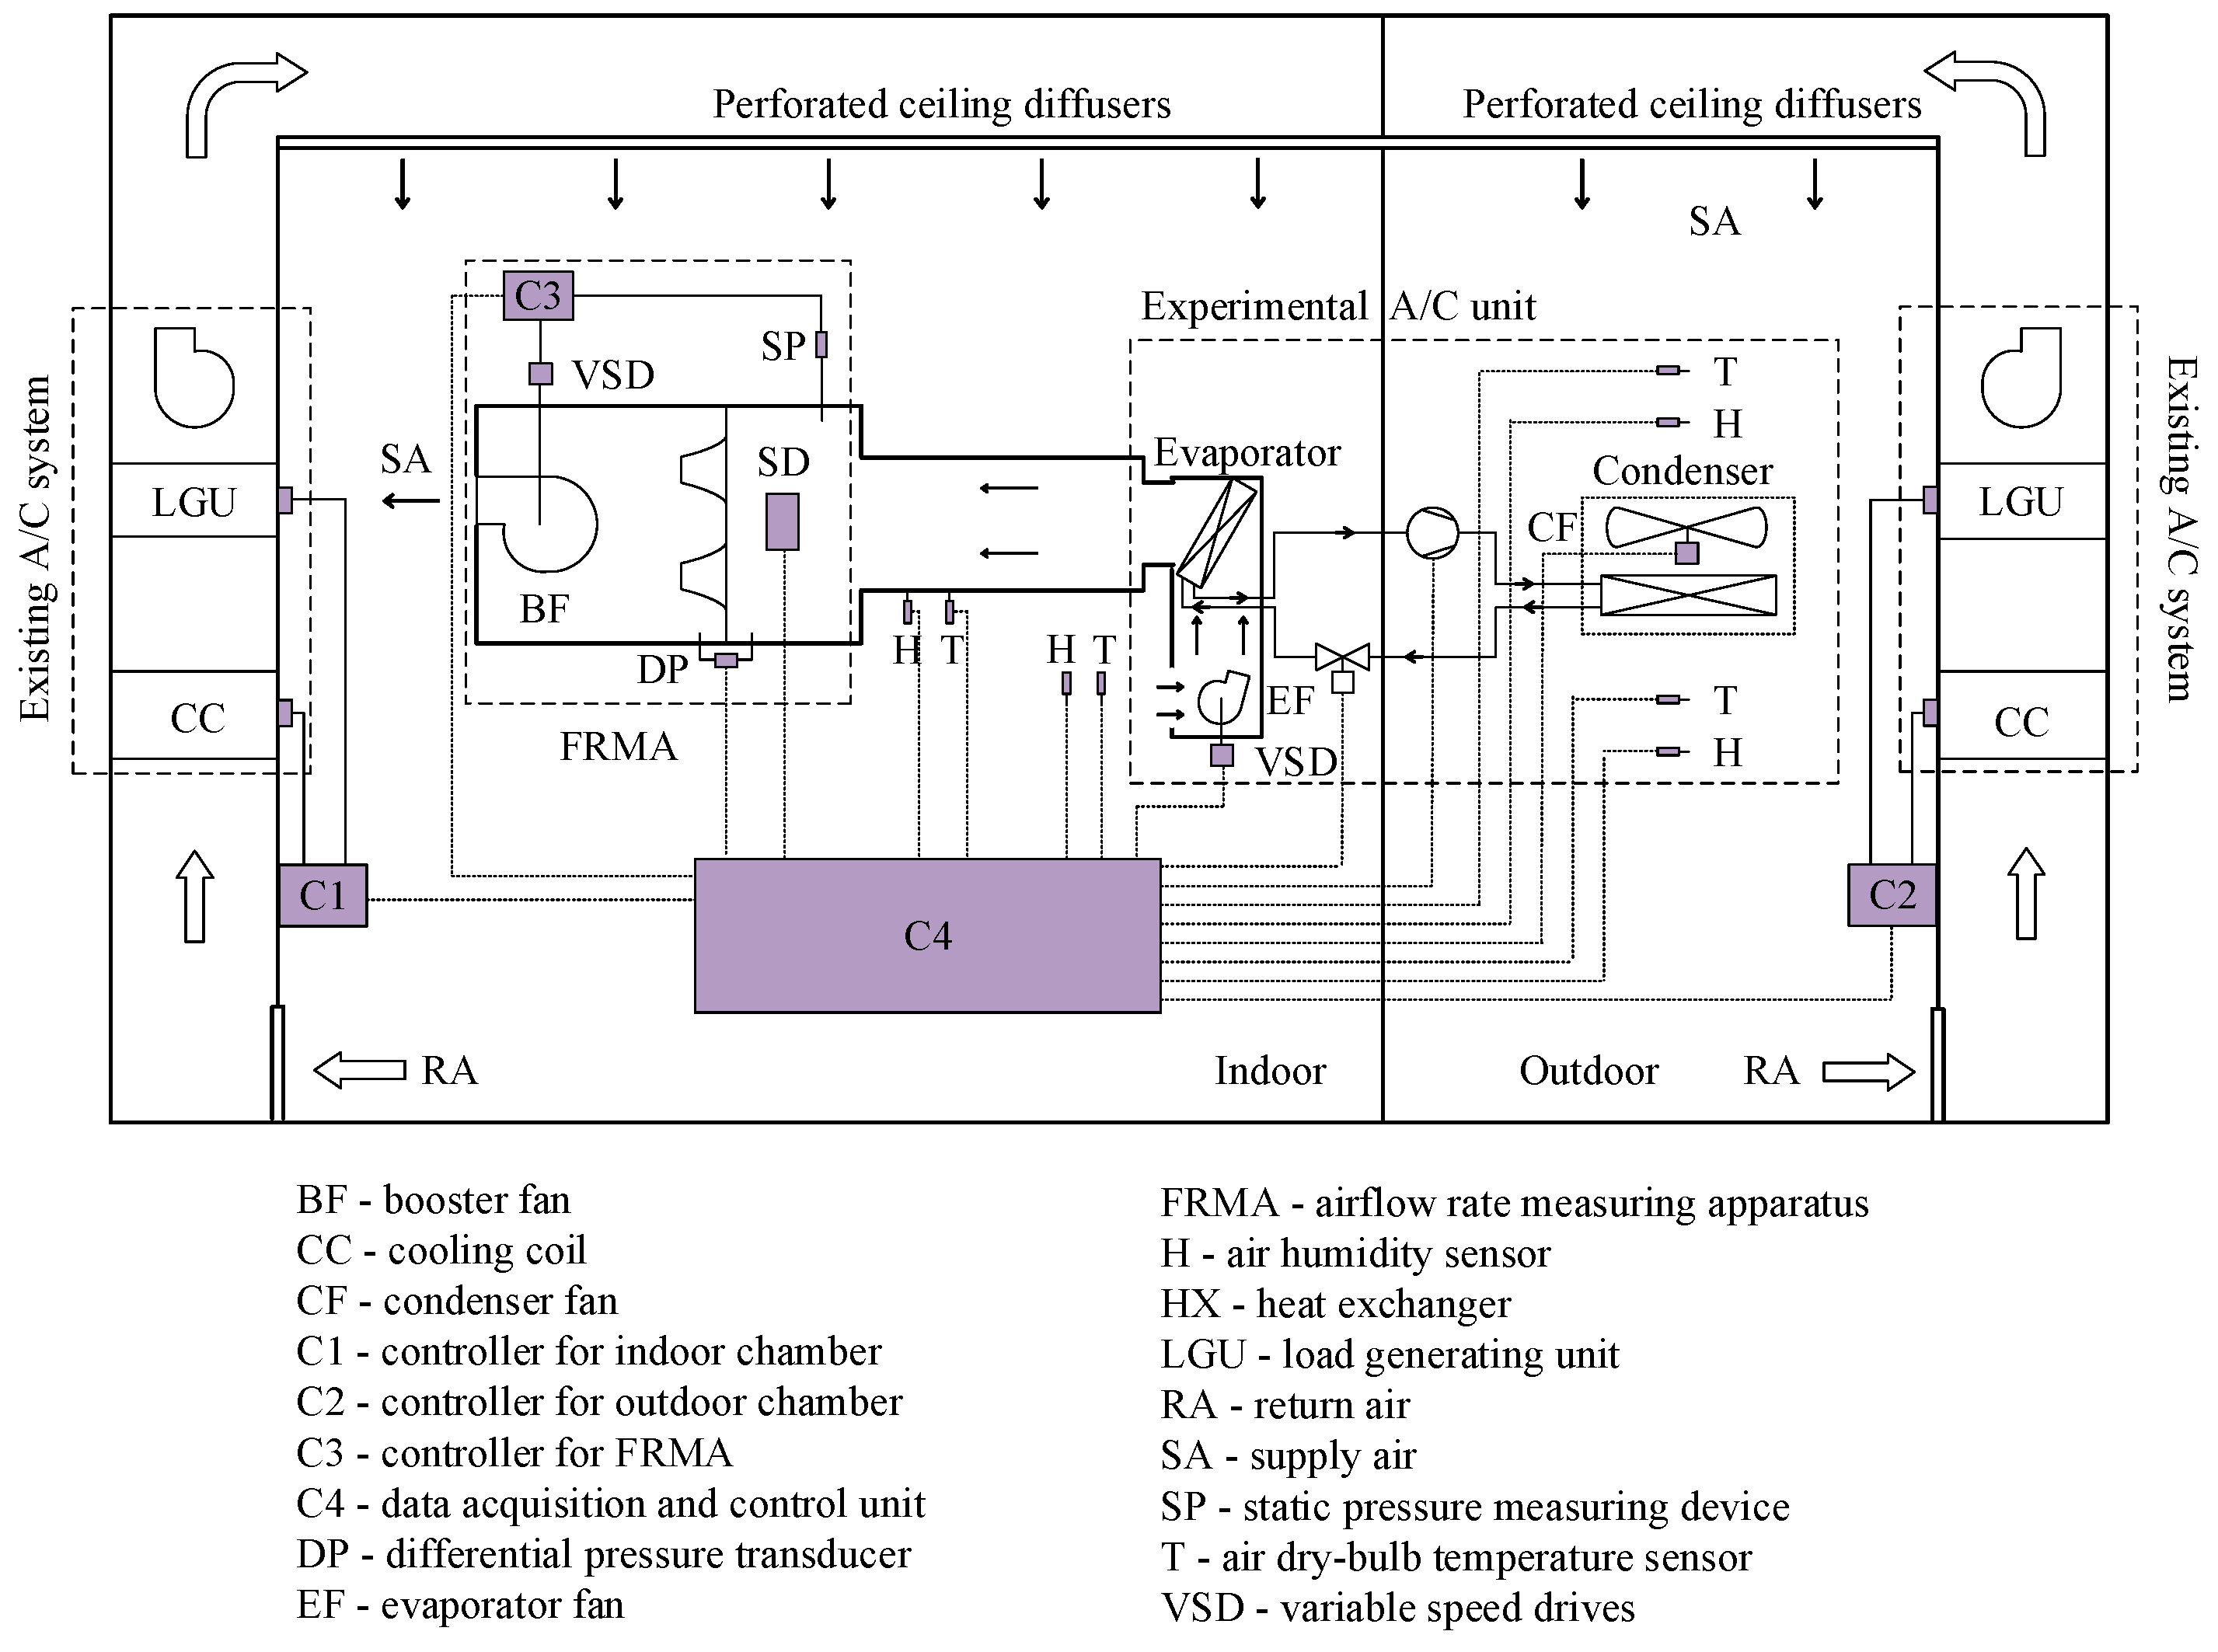
2. Experimental System Descriptions

For investigating the heat transfer characteristics of multi-circuit finned-tube evaporators, an experimental setup shown in Figure 1 was established. As seen, a typical vapor compression cycle-based A/C unit where the testing evaporator was installed in a laboratory with two environmental chambers. A simulated indoor space was created in one of the chambers, and a simulated outdoor space was created in the other. As seen in Figure 1, two existing air conditioning systems were used to condition the two compartments. A load generation unit (LGU) and a cooling coil made up each existing air conditioning system [24]. The LGU was equipped with a heater and a humidifier, and both could be controlled to generate sensible and latent loads. Thus, the required air temperature and humidity for both indoor and outdoor chambers could be regulated and maintained.The finned-tube evaporator is shown in Figure 2.
The details of the experimental A/C unit are schematically shown in Figure 3. As seen, the A/C unit was mainly composed of a compressor, an electronic expansion valve (EEV), a slit-fin condenser, and a slit-fin evaporator. The evaporator in the experimental unit can be changed, so that the cooling capacity for the A/C unit with different evaporators could be evaluated. The operating frequency of the compressor could be modulated using the variable speed drives (VSD), and its nominal output cooling capacity was about 7.2 kW. The evaporator fan could also be variable speed controlled, and thus the sending air flow rate could be varied. The air-cooled condenser together with the compressor was placed in the outdoor chamber, and the evaporator placed in an air duct was installed inside the indoor chamber. The detailed specifications of the experimental A/C unit are listed in Table 1.
The experimental system was completely equipped with high-precision sensors and transducers to measure operating parameters such as temperatures, air and refrigerant flow rates, and other variables. In the A/C unit, the refrigerant temperatures at the inlet and outlet of each loop of the evaporator were measured using type K thermocouples with a reported uncertainty of ±0.5 °C. A Coriolis mass flow meter was used to monitor the refrigerant mass flow rate that was flowing through the vapor compression refrigeration system. Its claimed uncertainty was within 0.2% of the full-scale value. The air dry-bulb temperature and wet-bulb temperature in the environmental chambers where the A/C unit was installed were measured using sampling equipment with an ANSI/ASHRAE Standard 41.1 [25] prescribed tree and aspirating psychrometer. The wet and dry bulb temperatures were measured using PT 100 with the accuracy level A and a reported uncertainty of ±0.1 °C. An airflow rate measuring apparatus (FRMA) built in accordance with ANSI/ASHRAE Standard 41.2 [26], consisting of a set of nozzles of various sizes, diffusion baffles, and a differential pressure transducer with a measuring accuracy of 0.1% of the full-scale reading, was used to measure the sending air flow rate for the A/C unit.
Based on the Chinese Standard (GB/T 7725-2022) [27], the split-type domestic air conditioner underwent testing. In the cooling cycle, the input air temperatures for dry and wet bulbs were 27 °C and 19 °C for interior coils, and 35 °C and 24 °C for outdoor coils, respectively. The primary performance statistics, including cooling capacity, energy efficiency ratio (EER), and power, were the arithmetic averages produced from three iterative tests in order to acquire trustworthy and precise experimental results. R410A served as the air conditioner’s operating fluid, and the 3500 g charge was established by a number of experimental findings.

3. FTHX Model Development

3.1. Modeling Approach

A common and extremely precise simulation tool for the FTHXs is called EVAP-COND. References [9,28] contain further in-depth information about the EVAP-COND series. The National Institute of Standards and Technology (NIST) built the simulation program [29]. The National Institute of Standards and Technology and the US Department of Energy provided funding for the development of EVAP-COND. The development of previous versions was also supported by the Air-Conditioning and Refrigeration Technology Institute [30]. It includes simulation models for forecasting the performance of finned-tube evaporators and condensers that transfer the heat of air to refrigeration.
The user can specify various refrigerant circuit topologies and a one-dimensional distribution of the inlet air using the tube-by-tube organization of EVAP-COND. Based on the qualities of the inlet air and refrigerant, the HX parameters, and the mass flow rates, it determines the heat transfer for each tube separately. The performance of each tube in a HX tube assembly determines the HX’s overall capacity [31].
In this paper, the simulations were explored with EVAP-COND 4.0 software. First, the various parameters of the heat exchanger should be input. Second, after inputting the complete parameters of the heat exchanger, the pipeline layout should be designed. At last, evaporator outlet refrigerant quality, evaporator outlet refrigerant saturation temperature, and refrigerant flow rate were used to simulate the heat exchanger. The EVAP-COND software provided two wind speed setting methods. The method of uniform wind speed was adopted in the simulation to set the wind speed. On the premise of ensuring that the air volume is basically consistent with the measured air volume of the internal fan in the experiment, the air speed was set to a trapezoidal layout with a large middle and small sides. The equations to calculate the heat transfer coefficients and pressure drops for the air and refrigerant sides were applied before the simulations. For the air side, however, the pressure drop was not calculated by the software, and the heat transfer coefficient was obtained with empirical correlation.

3.2. Validation Results

The original circuit arrangement is shown in Figure 4. As seen, the original HX has three rows with 20 tubes in each row. The refrigerant is divided into four circuits. The windward region also has dimensions of 478 mm in length and 500 mm in height. Longitude tube pitch is 21.65 mm, while transverse tube pitch is 25 mm. 1.8 mm is the original fin pitch. The tube has an inner diameter of 8.96 mm and an exterior diameter of 9.52 mm. The evaporator consists of three rows of 9.52-mm-diameter tubes with lanced fins. According to a 90% confidence range, the measurement uncertainty for tests is roughly 10%. The uncertainties of measured quantities are listed in Table 2.
The evaporator’s and condenser’s capacities for R410A were calculated by the simulation model. The evaporator capacity was determined using the evaporator tube configuration, fin configuration, inlet air temperature, humidity and pressure, airflow rate, exit saturation temperature of the refrigerant, level of superheat, and mass flow rate of the refrigerant. For all test settings, the evaporator’s airflow rate was constant. Atmospheric pressure and a uniform axial velocity were assumed for the air entering both HXs [31]. The temperature distributions of the refrigerant and the air, the refrigerant pressure fluctuation, and the refrigerant pressure drop serve as the evaluation criteria for both HXs.
In the simulation, the structure parameters of the heat exchanger were first input. Second, the circuitry was designed and also the operating parameters, including the sending air flow rate, air state parameters, refrigerant mass flow rate, and evaporating pressure, were set accordingly. Then, the simulation was conducted through a tube-by-tube modeling scheme. That is, the program recognized each tube as a separate entity for which it calculated heat transfer. These calculations were based on inlet refrigerant and air parameters, properties, and mass flow rates. The simulation began with the inlet refrigerant tubes and proceeded to successive tubes along the refrigerant path. A successful run required several iterations through the refrigerant circuitry, each time updating the inlet air and refrigerant parameters for each tube. Finally, evaporator outlet refrigerant quality, evaporator outlet refrigerant temperature, and cooling capacity could be estimated.
Based on the FTHX model developed, its output capacity could be obtained. Using the experimental data, the developed model could be validated. The validation results are listed in Table 3. As seen, the evaporator capacity was 9.909 kW in the simulation and 9.258 kW in the experiment, with a deviation of 6.57%. It can be seen that the error between the simulation results and the experimental results is not significant and is within the allowable range, less than 10%, which is acceptable in practical applications. This indicated that the simulation results by EVAP-COND were close to the experimental values. The accuracy of the simulation model was validated by the general restricted variances in the evaporator capacity shown by the numerical and experimental data. The outcomes of the simulation can then be extensively exploited.
Moreover, for further examining the flow maldistribution of the original FTHX, the superheat and mass fraction for each circuit were also evaluated using the developed model. Table 4 shows the outlet quality, temperature, superheat, and mass fraction of different outlet tubes. It demonstrated that the refrigerant was unevenly distributed. As seen, the overall mass fraction of Loop 1 was 0.254, 2.8% larger than that of Loop 3, leading to a smaller outlet superheat in Loop 1. In addition, for the last two tubes in each loop, the refrigerant was also unevenly distributed. For example, in Loop 1, the refrigerant at the outlet of tube #1 was superheated, but that of tube #21 was saturated. The refrigerant quality of the evaporator outlet is shown in Figure 5. Hence, it can be concluded that the inner HX area was not maximally utilized, and thus circuitry optimization was required.

4. Multi-Circuit Finned-Tube Evaporator Optimization

For obtaining the best structure of the finned-tube evaporator, the arrangement of the circuits as well as the fin pitch, which can be easily changed in practical applications, were optimized, and the optimized results are reported in this section. It is important to note that the circuitry was optimized using the model developed by EVAP-COND software. The fin pitch was optimized using a GA-based multi-objective optimization method.

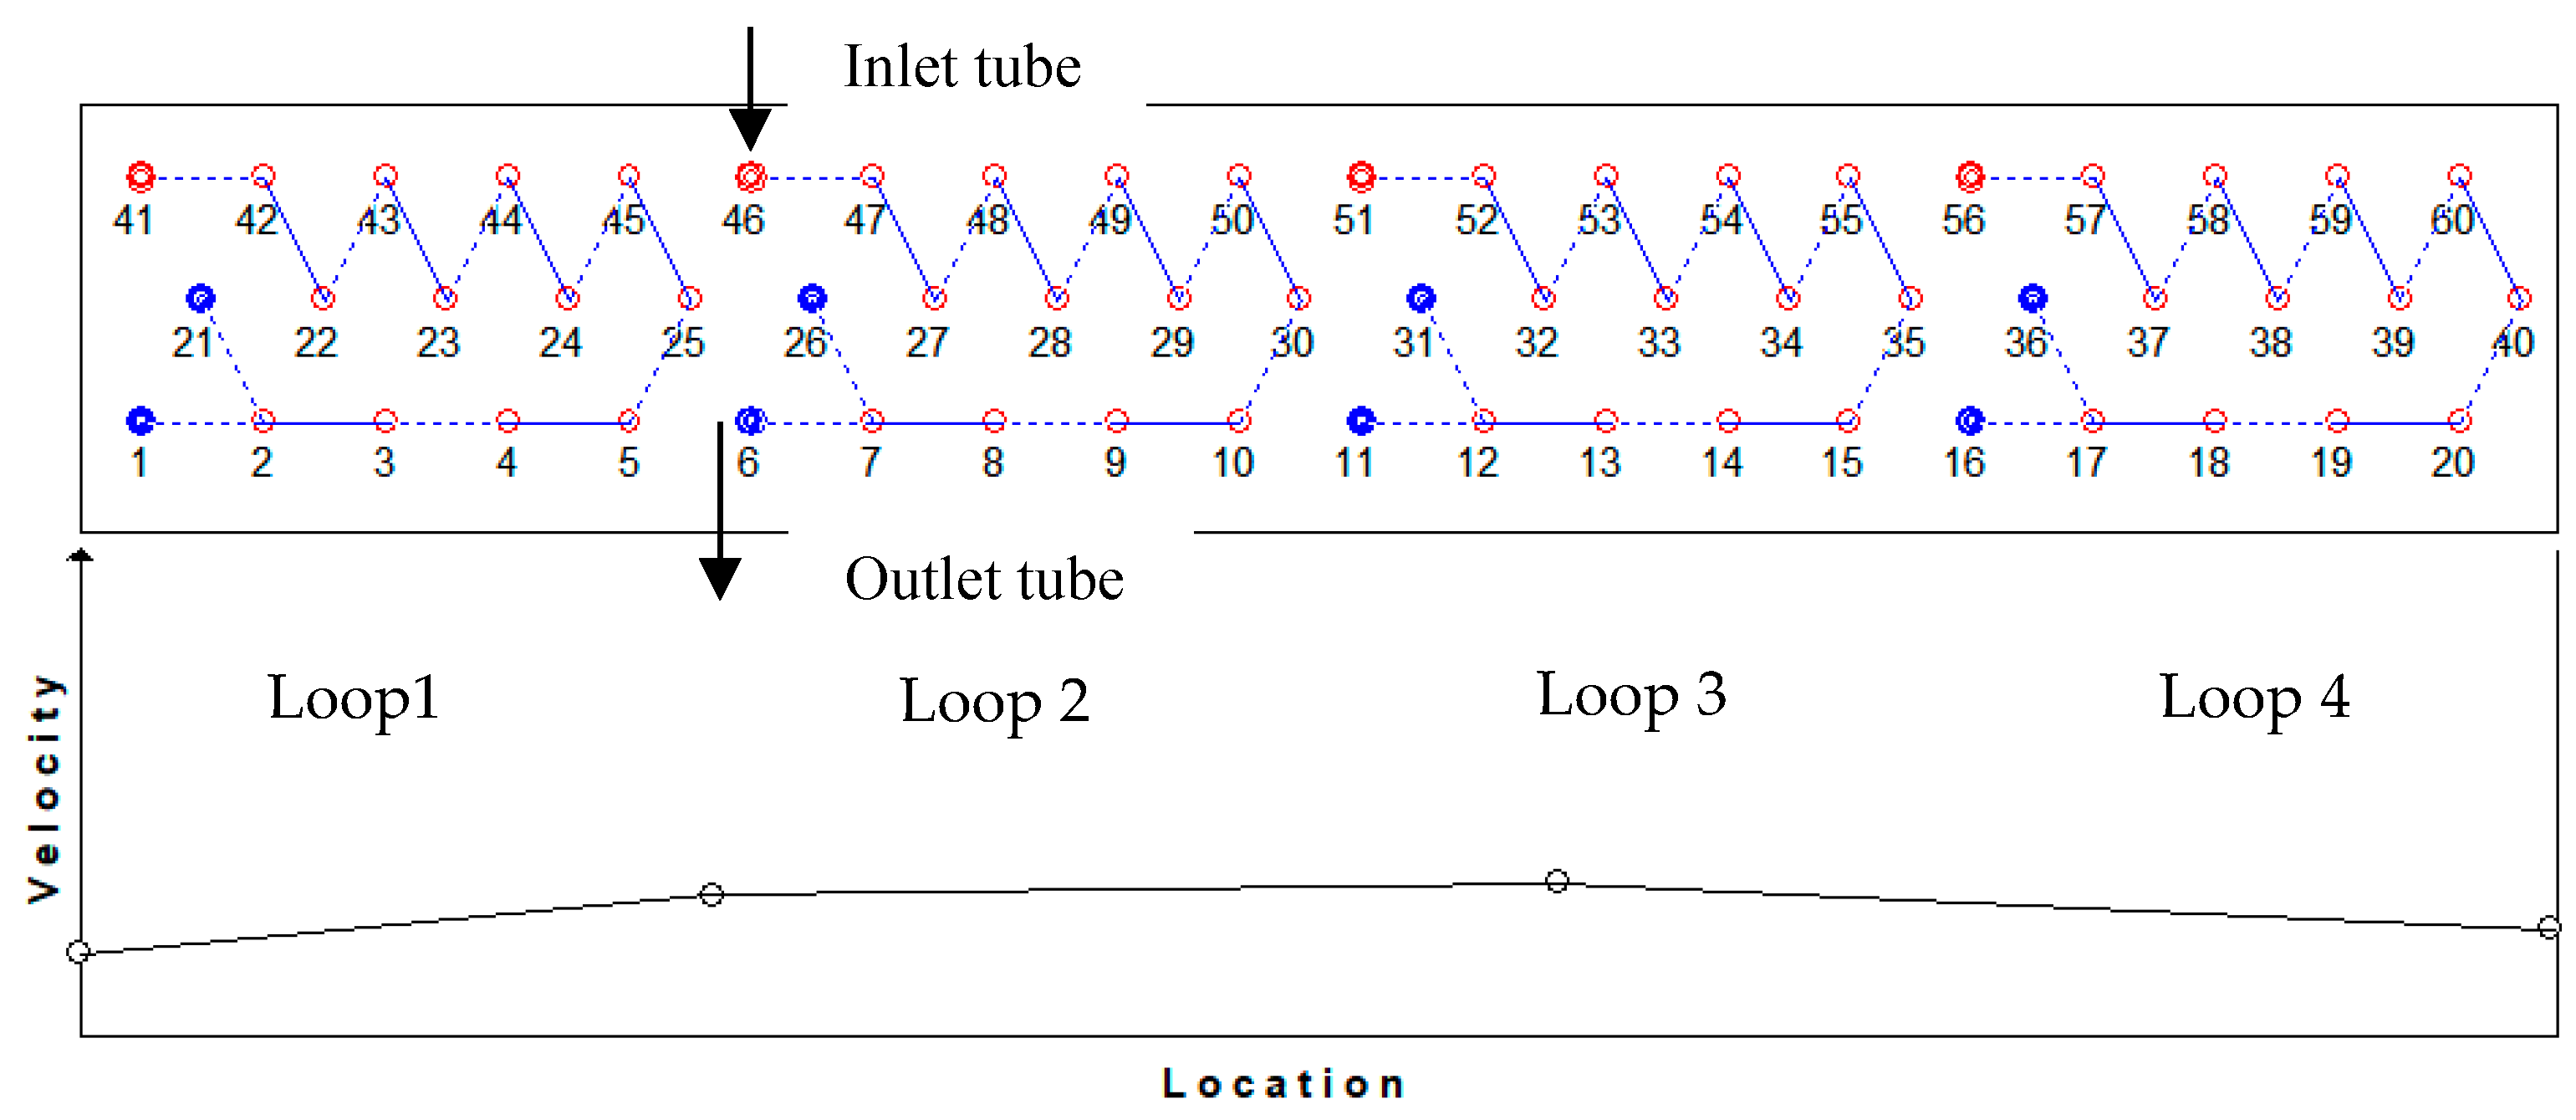
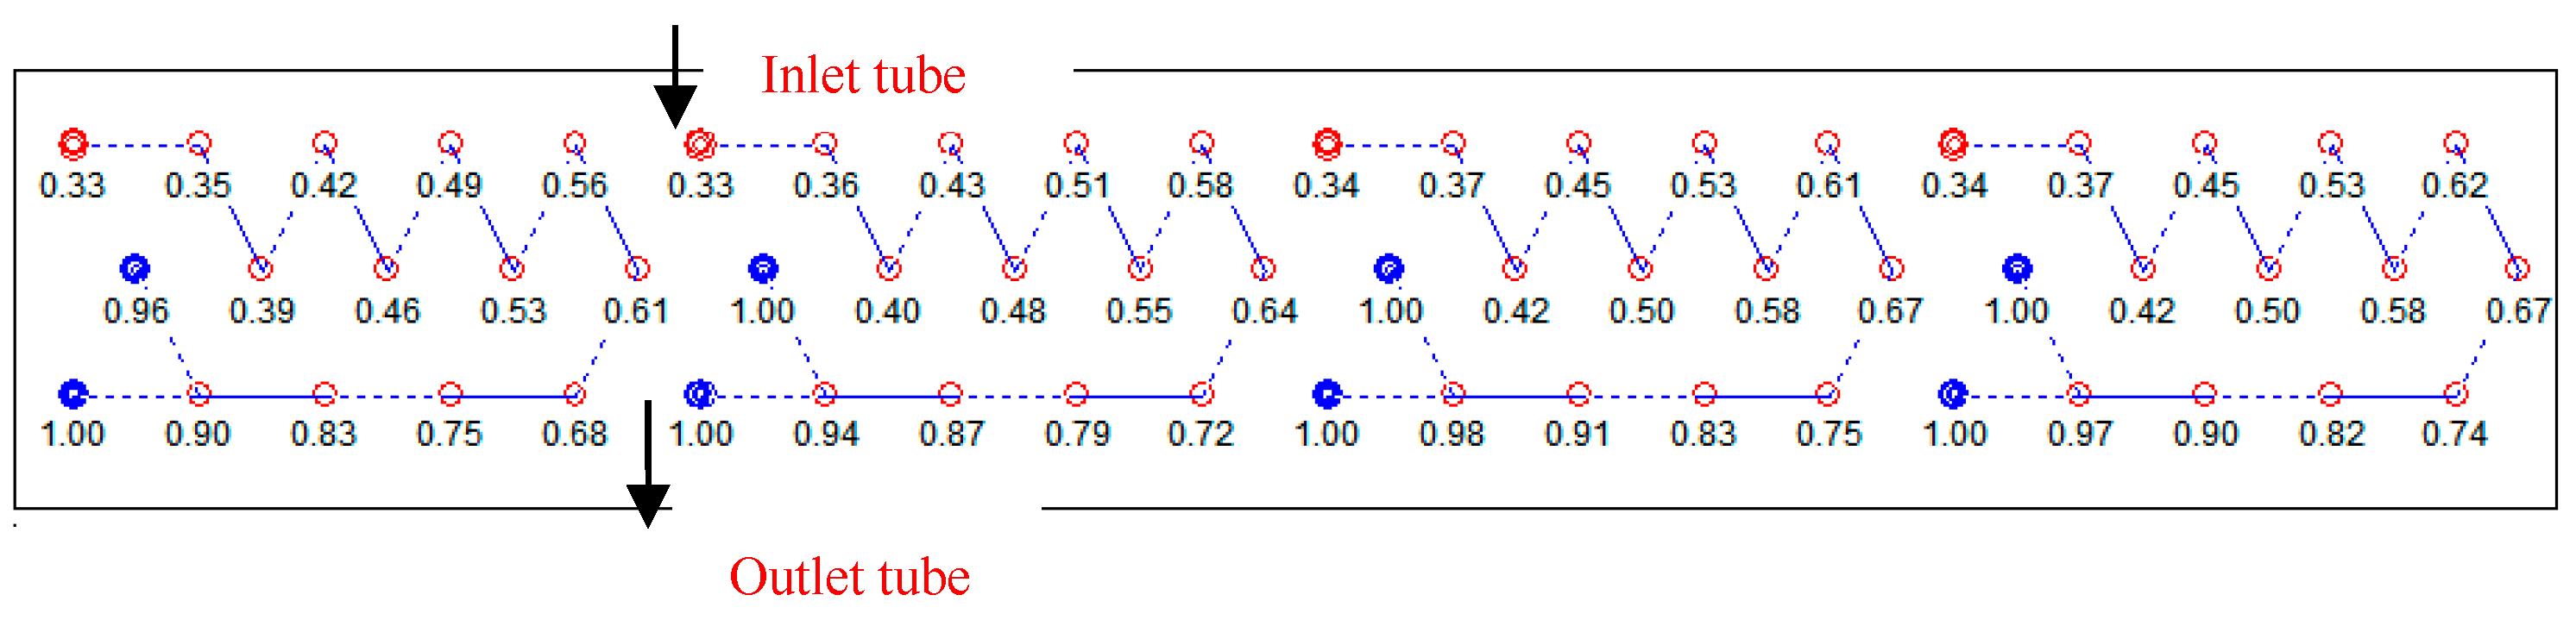
4.1. Circuitry Optimization

In order to propose an appropriate scheme of circuitry for FTHXs to enhance their overall performance, four different tube arrangements were designed in this paper, as shown in Figure 6. On the basis of the original HX, considering the refrigerant mal-distribution in the last two tubes, the last tubes for each circuit in the middle row were removed, and thus 56 tubes were employed in the A-type and B-type FTHXs as shown in Figure 6a,b. For mitigating the refrigerant flow mal-distribution, a cross-flow arrangement of refrigerant circuits, designated by C-type, was adopted, as shown in Figure 6c. Furthermore, considering the uneven air flow distribution on the air side, three refrigerant circuits with 54 tubes were rearranged at the middle of the evaporator, where the air flow was relatively uniform (Figure 6d). Consequently, for the A-type, B-type, and C-type FTHXs, 6.66%, 6.66%, and 10% reduction in tubes were achieved in comparison to the original FTHX. Therefore, the amount of copper used could be decreased due to fewer tubes, and then the cost would decrease.
From Table 5, the heat exchange capacities of every HX with fin pitch at 1.8 mm and 2.0 mm were simulated. Compared to the original HX, type C HX had better heat exchange capacity with cross flow, with an increase of 1.42%. The heat exchange capacity of other HXs at 1.8 mm of fin pitch, such as types A, B, and D, was about 9.8 kW. The heat exchange capacity of types B and D with a 2.0 mm pin pitch was about 9.5 kW. The heat exchange has slightly decreased, but the use of copper was reduced as fewer tubes were applied. In addition, the qualities of each refrigerant circuit are shown in Figure 7. After rearranging the refrigerant circuits, the heat transfer area on the refrigerant side could be better utilized, and the flow maldistribution could be mitigated to a certain extent.
Furthermore, for validation of the optimization results, these four types of finned-tube evaporators were also installed and tested in the experimental rig. The test results well agreed with the simulation ones, with a reported relative error within 6%, demonstrating the feasibility of the proposed circuit optimization method.

4.2. GA Based Fin Pitch Optimization

Moreover, the fin pitch is another important parameter that influences the performance of finned-tube evaporators, as it directly determines the heat exchange area on the air side. As the refrigerant circuitry, fin pitch could be relatively easily changed in manufacturing as compared to other structure parameters. Hence, based on the circuitry optimization in Section 4.1, the multi-objective genetic algorithm (NSGA-II) was also used to optimize the fin pitch, yielding the Pareto optimal frontier for the structural optimization problem.

4.2.1. Multi-Objective Optimization Model

For a FTHX, its heat transfer capacity can be calculated as follows:
Q = α A Δ T
α is the heat transfer coefficient, A is the heat exchange area, Δ T is the heat transfer temperature difference.
The Nusselt number (Nu), Colburn factor (j), and friction factor (f) of the HXs are derived from experimental data, as are the air side heat transfer and friction properties. Heat transfer coefficient and Nusselt number are calculated as follows:
α = N u   ·   λ d 3
N u = 0.772 R e 0.477 ( s d 3 ) 0.363 ( N   ·   s 2 d 3 ) 0.217
Reynolds number is calculated by
R e = u m a x d 3 ν f
where
u m a x = Q f A 1
where A1 is calculated by
A 1 = H × L n × H × δ N × s × d 3 × n
The Colburn factor is calculated by the correlation [32].
j = N u R e   ·   P r 1 / 3
The friction factor is calculated by [33]
f = 5.541 R e 0.436 ( s d 3 ) 1.1
When the performance of FTHX is optimized, the Colburn factor j and the friction factor f, respectively, represent the strength of the heat exchange capacity of the HX and the resistance that affects the performance. In fact, in real life, it can be found that while the heat exchange capacity of the HX has greatly increased, some structural parameters will affect the resistance factor and increase the resistance. Therefore, in this case, it is one-sided for us to consider the single HX Colburn factor j or friction factor f as the only objective function. It is more reasonable to consider the two factors together rather than only one of them. Therefore, the comprehensive performance factor JF is needed to analyze the performance of the HX.
The JF factor is one factor used to assess the effectiveness of the HX. Comprehensive consideration is given to the relationship between the friction factor and the Colburn factor. The volume goodness factor can be used to drive the index [34].
J F = j / f 1 / 3
The fundamental steps in optimizing the convective heat transfer process are increasing the heat transfer capacity and lowering the flow resistance. However, an increase in flow resistance typically coincides with an improvement in heat transfer capacity. In order to obtain the best balancing of heat transfer capacity and flow resistance, it is required to rationally design the structure of heat transfer elements and optimize the selection of flow parameters. The following expression serves as a summary of the multi-objective optimization model:
{ max j = f 1 ( s , s 1 , s 2 , H , L ) min f = f 2 ( s , s 1 , s 2 , H , L )
The boundary condition for variable s is between 1.3~2.3 mm.

4.2.2. Fin Pitch Optimization Based on GA

In this study, FTHX optimization was carried out using the multi-objective non-dominated sorting genetic algorithm (NSGA-II). In order to assess the HX’s thermodynamic and financial efficiency, GA generates the first population and codes each individual’s objective functions. To get rid of individuals who go beyond the limits, the penalty mechanism is used. Up until the fitness function’s final convergence condition is met, a new population is created using the genetic operators of selection, crossover, and mutation.
The Colburn factor (j) and friction factor (f), which are separately taken into account for analyzing the heat transfer and pressure drop of air, make up the objective functions. These two functions are antagonistic in the majority of HXs, and as one gets better, the other gets worse. Finding the design points when both of these functions are in their best states is the goal of this research [35]. The calculation procedures of the optimization objective functions such as the Colburn factor, friction factor, and JF factor are based on Equations (7)–(9).
The design of a HX with maximum heat transfer and a minimal air pressure drop is the ultimate goal. However, the air pressure drop also rises as a result of the changes made to the exchanger’s geometrical structure to enhance heat transfer [29]. Therefore, since both objective functions could not be optimized concurrently for a feasible solution (a set of design variable values), the Pareto optimal solution approach was applied. In relation to the various geometrical parameters of FTHX, this multi-objective optimization was carried out using the NSGA-II method. A population size of 100 was used in the optimization process in each iteration of the method. Based on some prescribed probability, crossover is generally between 0.6 and 0.9. Mutation is performed based on a very low probability. Hence, the probabilities of crossover (Pc) and mutation (Pm) were 0.9 and 0.09, respectively. As shown in Figure 8, after 50 iterations, the program converged. Premature convergence states that the result will be suboptimal if the optimization problem coincides too early. To avoid this issue, some researchers suggested that diversity should be used. The Colburn factor and friction factor should be selected to increase diversity. However, the JF factor, as a comprehensive factor, is a single variable, and then it has not had a significant increase.
In Figure 9, the Pareto front of two objective functions (Colburn factor j and friction factor f) has been used to demonstrate the optimal positions. A Pareto front optimum position is one where no objective function can be improved without at least one other objective function deteriorating [35]. To put it another way, by traveling over the locations in Figure 9, one objective function’s condition improved while the condition of the other objective function deteriorated. Noting that none of these were superior to the others and that all are ideal positions, the HX can be designed at any of these locations. Some of these ideal sites had distinctive characteristics, which were described. In Figure 9, 10 points had been selected, and Table 6 included the input variable values and pertinent objective function values. Comparing the optimized result with the original value before optimization, it can be seen that points 1–4 showed the increase in the Colburn factor j was negative, while the decrease in the friction factor f was positive. The friction factor decreased by 3.5% as one moved from Point 1 to Point 4, but the Colburn factor rose by 1.02%. Points 5–10 showed the increase in the Colburn factor j was positive, while the decrease in the friction factor f was negative. The friction factor decreased by 5.31%, while the Colburn factor increased by 1.51% when going from Point 5 to Point 10. In other words, a large decrease in fluid pressure drop can be achieved by accepting a slight increase in the rate of heat transfer.
Moreover, due to the conflicting effects of factor j and factor f, it was necessary to find a balance point in the Pareto front. The results of optimization with a comprehensive performance factor showed that the objective function was best when the fin pitch was approximately 1.77 mm.

5. Conclusions

In this paper, in order to investigate the heat performance of FTHX with different circuitry, EVAP-COND was used to optimize the refrigerant circuit arrangement via evaluating the heat transfer performances of FTHX under different refrigerant circuitries. The HX’s multi-objective optimization for fin pitch and heat transfer capacity was built using the multi-objective genetic algorithm (NSGA-II). The main conclusions are as follows:
(1)
EVAP-COND software was used to simulate the performance of FTHXs with different fin pitches and different circuitries. The error between the simulation results and the experimental results was not significant and within the allowable range, less than 10%. The evaporator capacity exhibited very minor variations in the numerical and actual data, demonstrating the simulation’s correctness.
(2)
Four different tube arrangements were designed in this paper. The numbers of tubes type A, B, and D HXs are fewer, at 56, 56, and 54 tubes. The number of tubes decreased, and then the heat exchange area inside the tubes decreased by 6.66%, 6.66%, and 10%. Therefore, the amount of copper used decreased due to fewer tubes, and then the cost decreased. Compared to the original HX, type C HX has better heat exchange capacity with cross flow, with an increase of 1.42%. The heat exchange capacity of other HXs at 1.8 mm of fin pitch, such as types A, B, and D, is about 9.8 kW. The heat exchange capacity of types B and D with a 2.0 mm pin pitch is about 9.5 kW. The heat exchange had slightly decreased, but the copper pipes used had decreased. Therefore, the tube arrangements are reasonable.
(3)
The maximum heat transfer factor (j) and the lowest friction factor (f) were employed as the goal functions in the NSGA-II algorithm to optimize the heat transfer performance of the FTHX. 10 points were chosen in Pareto front. Points 1 to 4 showed the increase in the Colburn factor j was negative, while the decrease in the friction factor f was positive. The friction factor decreased by 3.5% as one moved from Point 1 to Point 4, but the Colburn factor rose by 1.02%. Points 5 to 10 showed the increase in the Colburn factor was positive, while the decrease in the friction factor was negative. The friction factor decreased by 5.31%, while the Colburn factor increased by 1.51% when going from Point 5 to Point 10. Moreover, to find a balance point in the Pareto front, the results of optimization demonstrated that the objective function performed at its optimum when the fin pitch was around 1.77 mm.
It should be pointed out that, in the current study, the structure parameter of fin pitch was considered to optimize the performance of FTHX as it could be relatively easily changed in practical applications. In fact, other structure parameters, such as tube diameter, longitude tube pitch, transverse tube pitch, etc., will also influence the operating performance of FTHX. Thus, further studies on optimizing other structure parameters based on the similar optimization method will be carried out in future works.

Author Contributions

Conceptualization, N.J., Y.X. and Q.D.; methodology, N.J. and X.Z.; software, Y.X.; validation, Z.W. and Y.C.; investigation, N.J., Y.X. and Q.D.; writing—original draft preparation, Y.X.; writing—review and editing, X.Z. and Q.D.; supervision, Y.C. and Z.W. All authors have read and agreed to the published version of the manuscript.

Funding

This research received no external funding.

Institutional Review Board Statement

Not applicable.

Informed Consent Statement

Not applicable.

Data Availability Statement

The data presented in this study are available on request from the corresponding author.

Conflicts of Interest

The authors declare no conflict of interest.

Nomenclature

Atotal heat transfer surface area, m2
A1minimum free-flow area, m2
Dtube diameter, mm
d3fin collar outside diameter, mm
ffriction factor, dimensionless
Hheight of heat exchanger, m
hheat transfer coefficient, W/(m2·°C)
jthe Colburn factor, dimensionless
Llength of heat exchanger, m
nthe number of fins
Nnumber of longitudinal tube rows, dimensionless
PrPrandtl number, dimensionless
Qheat transfer rate, W
Q f fan capacity, W
ReReynolds number based on tube collar diameter, dimensionless
sfin pitch, mm
s1transverse tube pitch, mm
s2longitudinal tube pitch, mm
umaxmaximum air velocity, m/s
ΔTtemperature difference, °C
Δ p pressure drop, pa
Greek symbols
λ thermal conductivity, W/(m·K)
ν f air kinematic viscosity
ρ mass density of fluid, kg/m3
δ thickness, mm
List of abbreviations
CCcooling coil
EEREnergy Efficiency Ratio
EEVelectronic expansion valve
FRMAairflow rate measuring apparatus
FTHXFin-and-tube heat exchanger
GAgenetic algorithmHX Heat exchangers
LGUload generation unit
NISTNational Institute of Standards and Technology
NSGA-IInon-dominated sorting genetic algorithm
Pccrossover probability
Pmmutation probability
VSDvariable speed drives

References

  1. Karthik, P.; Kumaresan, V.; Velraj, R. Anning friction (f) and col-burn (j) factors of a louvered fin and flat tube compact heat exchanger. Therm. Sci. 2017, 21, 141–150. [Google Scholar] [CrossRef] [Green Version]
  2. Delouei, A.A.; Sajjadi, H.; Atashafrooz, M.; Hesari, M.; Hamida, M.B.B.; Arabkoohsar, A. Louvered Fin-and-Flat Tube Compact Heat Exchanger under Ultrasonic Excitation. Fire 2023, 6, 13. [Google Scholar] [CrossRef]
  3. Delouei, A.A.; Atashafrooz, M.; Sajjadi, H.; Hesari, M.; Karimnejad, S. The thermal effects of multi-walled carbon nanotube concentration on an ultrasonic vibrating finned tube heat exchanger. Int. Commun. Heat Mass Transf. 2022, 135, 106098. [Google Scholar] [CrossRef]
  4. Li, Z.N.; Aute, V.; Ling, J.Z. Tube-fin heat exchanger circuitry optimization using integer permutation based Genetic Algorithm. Int. J. Refrig. 2019, 103, 135–144. [Google Scholar] [CrossRef] [Green Version]
  5. Huang, L.; Aute, V.; Radermacher, R. A survey of optimization formulations and techniques for the design of heat exchangers using lower GWP refrigerants. ASHRAE Trans. 2015, 121. [Google Scholar]
  6. He, Y.L.; Chu, P.; Tao, W.Q.; Zhang, Y.W.; Xie, T. Analysis of heat transfer and pressure drop for fin-and-tube heat exchangers with rectangular winglet-type vortex generators. Appl. Therm. Eng. 2013, 61, 770–783. [Google Scholar] [CrossRef]
  7. Lee, J.H.; Domanski, P.A. Impact of Air and Refrigerant Maldistributions on the Performance of Finned-Tube Evaporators with R22 and R 407; Building Environment Division, National Institute of Standards and Technology: Gaithersburg, MD, USA, 1997. [Google Scholar]
  8. Zhao, R.J.; Wang, Z.P.; Sun, Y.; Wang, F.; Huang, D. Effect of the Number of Circuits on a Finned-Tube Heat Exchanger Performance and Its Improvement by a Reversely Variable Circuitry. Appl. Sci. 2022, 12, 8960. [Google Scholar] [CrossRef]
  9. Song, X.Z.; Huang, D.; Liu, X.Y.; Chen, Q. Effect of non-uniform air velocity distribution on evaporator performance and its improvement on a residential air conditioner. Appl. Therm. Eng. 2012, 40, 284–293. [Google Scholar] [CrossRef]
  10. Domanski, P.A.; Yashar, D.; Kim, M. Performance of a finned-tube evaporator optimized for different refrigerants and its effect on system efficiency. Int. J. Refrig. 2005, 28, 820–827. [Google Scholar] [CrossRef]
  11. Mishra, M.; Das, P.K.; Sarangi, S. Optimum design of crossflow plate-fin heat exchangers through genetic algorithm. Int. J. Heat Exch. 2004, 2, 379–402. [Google Scholar]
  12. Xie, G.N.; Sunden, B.; Wang, Q.W. Optimization of compact heat exchangers by a genetic algorithm. Appl. Therm. Eng. 2008, 28, 895–906. [Google Scholar] [CrossRef]
  13. Peng, H.; Ling, X. Optimal design approach for the plate-fin heat exchangers using neural networks cooperated with genetic algorithms. Appl. Therm. Eng. 2008, 28, 642–650. [Google Scholar] [CrossRef]
  14. Mishra, M.; Das, P.K.; Sarangi, S. Second law based optimisation of crossflow plate-fin heat exchanger design using genetic algorithm. Appl. Therm. Eng. 2009, 29, 2983–2989. [Google Scholar] [CrossRef] [Green Version]
  15. Zhang, G.H.; Wang, B.L.; Lia, X.T.; Shi, W.X.; Cao, Y. Review of experimentation and modeling of heat and mass transfer performance of fin-and-tube heat exchangers with dehumidification. Appl. Therm. Eng. 2019, 146, 701–717. [Google Scholar] [CrossRef]
  16. Raja, B.D.; Patel, V.; Jhala, R.L. Thermal design and optimization of fin-and-tube heat exchanger using heat transfer search algorithm. Therm. Sci. Eng. Prog. 2017, 4, 45–57. [Google Scholar] [CrossRef]
  17. Tang, L.H.; Zeng, M.; Wang, Q.W. Experimental and numerical investigation on air-side performance of fin-and-tube heat exchangers with various fin patterns. Exp. Therm. Fluid Sci. 2009, 33, 818–827. [Google Scholar] [CrossRef]
  18. Xie, G.N.; Wang, Q.W.; Sunden, B. Application of a genetic algorithm for thermal design of fin-and-tube heat exchangers. Heat Transf. Eng. 2008, 29, 597–607. [Google Scholar] [CrossRef]
  19. Wang, Q.W.; Liang, H.X.; Xie, G.N.; Luo, L.Q.; Feng, Z.P. Genetic algorithm optimization for primary surfaces recuperator of microturbine. ASME J. Eng. Gas Turbines Power 2007, 129, 436–442. [Google Scholar]
  20. Tang, S.Z.; Wang, F.L.; He, Y.L.; Yu, Y.; Tong, Z.X. Parametric optimization of H-type finned tube with longitudinal vortex generators by response surface model and genetic algorithm. Appl. Energy 2019, 239, 908–918. [Google Scholar] [CrossRef]
  21. Sadeghzadeh, H.; Aliehyaei, M.; Rosen, M.A. Optimization of a Finned Shell and Tube Heat Exchanger Using a Multi-Objective Optimization Genetic Algorithm. Sustainability 2015, 7, 11679–11695. [Google Scholar] [CrossRef] [Green Version]
  22. Zhang, T.Y.; Chen, L.; Wang, J. Multi-objective optimization of elliptical tube fin heat exchangers based on neural networks and genetic algorithm. Energy 2023, 269, 126729. [Google Scholar] [CrossRef]
  23. Zeeshan, M.; Nath, S.; Bhanja, D. Numerical study to predict optimal configuration of fin and tube compact heat exchanger with various tube shapes and spatial arrangements. Energy Convers. Manag. 2017, 148, 737–752. [Google Scholar] [CrossRef]
  24. Huang, D.; Zhao, R.J.; Liu, Y.; Yi, D.B. Effect of fin types of outdoor fan-supplied finned-tube heat exchanger on periodic frosting and defrosting performance of a residential air-source heat pump. Appl. Therm. Eng. 2014, 69, 251–260. [Google Scholar] [CrossRef]
  25. ASHRAE Standard 41.1; Standard Method for Temperature Measurement. ASHRAE: Atlanta, GA, USA, 2013.
  26. ASHRAE Standard 41.2; Standard Methods for Laboratory Airflow Measurement. ASHRAE: Atlanta, GA, USA, 2018.
  27. GB/T 7725-2022; Room Air Conditioner. Chinese Standardization Administration: Beijing, China, 2022.
  28. Chen, W.J.; Chan, M.Y.; Deng, S.M.; Yan, H.X.; Weng, W.B. A direct expansion based enhanced dehumidification air conditioning system for improved year-round indoor humidity control in hot and humid climates. Build. Environ. 2018, 139, 95–109. [Google Scholar] [CrossRef]
  29. Domanski, P.A. EVAP-COND, Version 4.0; Simulation Models for Finned-Tube Heat Exchangers with Circuitry Optimization. [EB/OL]. 28 June 2016. Available online: http://www.nist.gov/el/building_environment/evapcond_software.cfm (accessed on 16 June 2023).
  30. Domanski, P.A.; Yashar, D.; Kaufman, K.A. An optimized design of finned-tube evaporators Using the learnable evolution model. HVACR Res. 2004, 10, 201–211. [Google Scholar] [CrossRef]
  31. Devotta, S.; Padalkar, A.S.; Sane, N.K. Performance assessment of HC-290 as a drop-in substitute to HCFC-22 in a window air conditioner. Int. J. Refrig. 2005, 28, 594–604. [Google Scholar] [CrossRef]
  32. Kays, W.M.; London, A.L. Compact Heat Exchangers, 3rd ed.; Krieger: Malabar, FL, USA, 1984; p. 336. [Google Scholar]
  33. Wang, C.C.; Lee, C.J.; Chang, C.T. Heat transfer and friction correlation for compact louvered in-and-tube heat exchangers. Int. J. Heat Mass Transf. 1999, 42, 1945–1956. [Google Scholar] [CrossRef]
  34. Shah, R.K.; Sekulić, D.P. Selection of heat exchangers and their components. In Fundamentals of Heat Exchanger Design; John Wiley & Sons, Inc.: Hoboken, NJ, USA, 2007; pp. 673–734. [Google Scholar]
  35. Damavandi, M.D.; Forouzanmehr, M.; Safikhani, H. Modeling and Pareto based multi-objective optimization of wavy fin-and-elliptical tube heat exchangers using CFD and NSGA-II algorithm. Appl. Therm. Eng. 2017, 111, 325–339. [Google Scholar] [CrossRef]
Figure 1. Layout of the experimental setup.
Sustainability 15 11587 g001
Figure 2. Schematic diagram of a fin-and-tube heat exchanger.
Sustainability 15 11587 g002
Figure 3. Schematic diagram of the experimental A/C unit.
Sustainability 15 11587 g003
Figure 4. The tube arrangement of the original HX.
Sustainability 15 11587 g004
Figure 5. Simulation results of refrigeration quality at the evaporator outlet for original HX.
Sustainability 15 11587 g005
Figure 6. The circuit arrangement of types A (a), B (b), C (c) and D (d) HXs.
Sustainability 15 11587 g006
Figure 7. Simulation results of refrigeration outlet quality of types A (a), B (b), C (c) and D (d) HXs.
Sustainability 15 11587 g007
Figure 8. Number of iterations.
Sustainability 15 11587 g008
Figure 9. Pareto front of two objectives Colburn factor and friction factor.
Sustainability 15 11587 g009
Table 1. Specifications of the experimental A/C unit.
ComponentsSpecifications
CompressorType: Rotary
Allowable speed range: 900~6600 r/min
Heating Capacity: 9580 W at 3450 r/min
Cooling Capacity: 7175 W at 3450 r/min
Displacement: 24.0 mL/rev
EEVPulse range: 0~500 Pulse
Rated capacity: 9000 W
Port diameter: 1.8 mm
EvaporatorLength of the windward area: 478 mm
Height of the windward area: 500 mm
Transverse tube pitch: 25 mm
Longitude tube pitch: 21.65 mm
Fin Pitch: 1.8 mm
Fin thickness: 0.105 mm
Number of the tube row: 3
Number of refrigerant loop: 4
CondenserLength of the windward area: 750 mm
Height of the windward area: 1205 mm
Transverse tube pitch: 25 mm
Longitude tube pitch: 21.65 mm
Fin Pitch: 2 mm
Fin thickness: 0.105 mm
Number of the tube row: 2
Number of refrigerant loop: 4
Table 2. Measured quantities and the uncertainty.
QuantityRangeUncertainty
Temperature0–50 °C±0.1 °C
Air pressure difference0–1000 Pa±1 Pa
Electric power0–5000 W0.5%
Table 3. Comparison results of simulation data and experimental data of original HX.
TypeFin Pitch/mmSimulated Heat Exchange
Capacity/W
Experimental Heat Exchange
Capacity/W
Relative
Error/%
Original HX1.8990992586.57
Table 4. Conditions of the refrigerant in each outlet tube.
Loop No.Tube No.QualityTemperature/°CSuperheat/°CMass Fraction
Loop 1118.52.10.133
210.9616.500.121
Loop 26110.23.70.129
2618.82.30.122
Loop 311112.86.30.124
31110.33.80.123
Loop 416112.560.125
3619.93.50.123
Table 5. Comparison results of simulation data and experimental data.
Circuit TypeFin Pitch/mmSimulated Heat Exchange Capacity/WExperimental Heat Exchange Capacity/WRelative Error/%
Type A HX1.8981892695.59
Type BHX1.8973192504.94
Type BHX2.0956193622.08
Type CHX1.810,05094935.54
Type DHX1.8982995932.4
Type DHX2.0952693202.16
Table 6. Evaluation of the obtained optimal Pareto front using NSGA-II.
s/mjfj (Increase %)f (Decrease %)
The raw data0.00180.020411.41786//
Point 10.0018720.0201681.3603−1.21%4.23%
Point 20.0018550.0202251.373485−0.93%3.23%
Point 30.0018310.0203071.392518−0.53%1.82%
Point 40.0018120.0203731.407946−0.20%0.70%
Point 50.0017970.0204251.4203570.05%−0.18%
Point 60.0017750.0205031.4389420.43%−1.47%
Point 70.001770.0205211.443230.52%−1.76%
Point 80.0017530.0205821.4579950.82%−2.75%
Point 90.0017350.0206471.4739441.14%−3.81%
Point 100.0017110.0207351.4957331.57%−5.21%
Disclaimer/Publisher’s Note: The statements, opinions and data contained in all publications are solely those of the individual author(s) and contributor(s) and not of MDPI and/or the editor(s). MDPI and/or the editor(s) disclaim responsibility for any injury to people or property resulting from any ideas, methods, instructions or products referred to in the content.

