Article

Recycling of Plastics as a Strategy to Reduce Life Cycle GHG Emission, Microplastics and Resource Depletion

by
Elias W. Gabisa
1,2,3,4,
Chavalit Ratanatamskul
4 and
Shabbir H. Gheewala
1,2,*
1
The Joint Graduate School of Energy and Environment, King Mongkut’s University of Technology Thonburi, 126 Pracha Uthit Road, Bangkok 10140, Thailand
2
Centre for Energy Technology and Environment (CEE), Ministry of Higher Education, Science, Research and Innovation, Bangkok 10400, Thailand
3
Faculty of Chemical and Food Engineering, Bahir Dar Institute of Technology, Bahir Dar University, Bahir Dar 6000, Ethiopia
4
Department of Environmental Engineering, Chulalongkorn University, Bangkok 10330, Thailand
*
Author to whom correspondence should be addressed.
Sustainability 2023, 15(15), 11529; https://doi.org/10.3390/su151511529
Submission received: 13 June 2023 / Revised: 13 July 2023 / Accepted: 22 July 2023 / Published: 25 July 2023

Abstract

:
Plastic waste is the most challenging type of waste because its generation rate (consumption rate) is high, and the current recycling rate is low. The increase in the production and disposal of plastics has led to significant environmental problems including greenhouse gas (GHG) emissions, microplastic pollution, and resource depletion. The study aimed at quantifying the potential environmental effects reduction achieved by recycling the most widely consumed polymers. One approach to establishing a circular economy for plastics is recycling. Plastic recycling as a strategy to reduce life cycle GHG emissions, microplastic emissions, and resource depletion was investigated. Life cycle assessment methodology was employed, considering cradle-to-gate as a system boundary. The results showed that recycling can significantly reduce life cycle GHG emissions and resource depletion. Replacing the virgin material with recycled material reduces the emission to −67 MtCO2e. Recycling could have saved 56.8 million microplastic emissions per year. However, mechanical recycling, which is commercialised nowadays, contributed to an increase in microplastics as much as 2.4 × 10⁹ million particles per year. Recycling will also save about 50 million tonnes of resources from depletion worldwide by recycling around 20 Mt plastics. However, microplastic emissions reduction in the present scenario of mechanical recycling is not possible unless other mechanisms to capture the emitted microplastics are introduced or other recycling methods, such as chemical recycling, are employed.

1. Introduction

The use of plastics in everyday life has become an integral part of our society with its convenience and durability making it a popular choice for packaging, consumer goods, and various industrial applications [1]. The World Bank reported that in 2016, plastic waste made up 12% of all municipal solid waste in the world, totalling 242 million tonnes. Most of this waste came from three regions: East Asia and the Pacific with 57 million tonnes, Europe and Central Asia with 45 million tonnes, and North America with 35 million tonnes [2]. Additionally, 8 million tonnes of poorly managed plastic garbage are discharged into the ocean, where it can disintegrate into microplastics through photo-oxidation and thermo-oxidation [3]. The increase in the production and disposal of plastics has led to significant environmental problems, including greenhouse gas (GHG) emissions, microplastic pollution, and resource depletion [4,5]. Plastic waste is the most challenging type of waste because its generation rate (consumption rate) is high, and the current recycling rate is low (18%). The current post-consumer recycling rate is 32.5% and 12% in European and Association of South East Asian Nations (ASEAN) countries, respectively [6]. Moreover, these numbers will be lower if the complete value chain is taken into account when conducting material flow analysis including sorting and recycling stage losses. As a result, a substantial amount of plastic waste currently ends up in landfills, is incinerated, or dumped at open dump sites. This leads to increased environmental emissions and material losses. Littering has a significant impact on ecosystems and biodiversity as a result of irresponsible consumption and improper waste management, which is still under investigation. Littering has a significant impact on ecosystems and biodiversity as a result of irresponsible consumption and improper waste management, which is still under investigation, and it is the worst in developing regions [7,8,9]. For example, about 20 million caps and lids have been found on beach cleaning over the past 30 years [10].
Recycling as a strategy to reduce the life cycle of GHG emissions, microplastics, and resource depletion is gaining increasing attention. Across the world, plastics make up a considerable component of municipal solid waste. To this end, European countries, for example, have set an ambitious target for recycling plastic waste 50%, 55%, and 60% of the amount generated for realising by 2025, 2030, and 2035, respectively [7,11]. Countries like the USA set polymer-specific recycling targets; for instance, a 70% recycling rate for polyethylene terephthalate (PET), polypropylene (PP), and high-density polyethylene (HDPE) bottles, 50% for PET-non-bottle rigid packaging, and 50% for PP-non-bottle rigid packaging [12]. A country in ASEAN, Thailand, has also set a target of 100% recycling by 2027 applying circular economy principles, which is not realistic [13].
Plastic production and disposal are major sources of GHG emissions [14]. The production of plastic requires fossil fuels, which release carbon dioxide and other greenhouse gases during extraction, transportation, and processing [15]. The Intergovernmental Panel on Climate Change (IPCC) estimates that the plastic industry is responsible for about 4% of global GHG emissions [16]. For instance, a study on the LCA of plastic caps deduced that electricity consumption during the production stage of 19 L multicomponent caps contributed to global warming reaching 8.5 × 10⁻³ to 6.18 × 10 kg CO2eq [17].
Microplastics, defined as particles smaller than 5 mm, are a growing environmental concern [18]. These particles are found in oceans, freshwater, and even in the air. They originate from a variety of sources, such as the decomposition of larger plastic wastes and the release of microbeads from personal care products and industrial applications. Microplastics can have detrimental effects on marine life and other organisms, as well as potentially on human health through the food chain [19,20].
In addition to the environmental problems caused by plastics, the production of plastics contributes to the depletion of finite resources [21]. Oil and natural gas are the primary feedstocks for plastic production, and with the world’s reserves of these resources dwindling, the sustainability of plastic production is being called into question. Approximately 4% of global oil and gas production is utilised as a raw material for plastic production [14]. However, in 2014 it was increased to 6% and expected to increase to 20% in 2050 [22]. Recycling plastic can help to conserve these finite resources by reducing the need for crude oil.
Considering the significant environmental gain, such as reduction of GHG emissions, microplastics, and resource depletion, this study aimed at quantifying the potential environmental effects reduction achieved by recycling the most widely consumed polymers. The polymers considered in the study are HDPE, low-density polyethylene (LDPE), PP, PET and polystyrene (PS). The primary impact categories considered are global warming potential, microplastic emissions and resource depletion reduction potential through recycling compared to virgin material. The Ecoinvent 3.9 database and published literature were consulted as primary data sources. To the best of the authors’ knowledge, there is no comprehensive assessment of the reduction of potential environmental effects achieved by recycling different types of polymers. Furthermore, there is no study addressing recycling as a strategy to reduce microplastic emissions.

2. Materials and Methods

2.1. Goal and Scope

The objective of this study was to estimate the environmental benefits and/or burdens associated with substituting recycled material for virgin polymers. It pertains to the utilisation of recycled polymers in unspecified plastics applications.

System Boundary and Assumptions

In the case of recycled resin production, the system boundary is made up of unit operations related to the feedstock supply, which is plastic waste, including mechanical recycling, and sorting and recycling losses (Figure 1). Though mechanical recycling is presently employed to recycle plastic, chemical recycling is also gaining attention. Mechanical recycling involves size reduction, extrusion, and granulation processes which are prone to leak microplastics directly into the environment [23]. Chemical recycling is the degradation of polymer bonds to recover the monomers for the production of new products of smaller molecular weight [24]. This study focuses on mechanical recycling as it is the one widely employed and commercially available technology. The products produced during process control are attributed to the system by considering the avoided comparable outputs from the sources of energy. By expanding the system boundaries, the avoided production process of the co-products is also considered. The system boundary is “cradle-to-gate,” which encompasses crude oil refining to naphtha and polymer synthesis itself because virgin polymers are believed to be replaced by recycled ones.
Within the framework of life cycle assessment (LCA), the circular footprint formula (CFF) was considered. The Product Environment Footprint (PEF) technique adopts the CFF to calculate the potential effects of recycled material production and allocate costs of recycling and virgin material production throughout successive product value chains (Equations (1) and (2)).
I r m p = I c o l l e c t i o n + I s o r t i n g + I r e c y c l i n g × A + I v p × 1 A × Q s Q p           ( I m p a c t t )
I = I r m p I v p × Q s Q p
where Irmp is impact of recycled material production, Icollection is plastics collection and transportation impact (impact/t), Isorting is impact of sorting activities (impact/t). Irecycling is impact of recycling operation (impact/t), Ivp is virgin material production impact. A is the factor to allocate market impacts between the various life cycle stages (PEF suggested 0.5 for recycled plastics. Qs/Qp is the secondary material quality to primary material ratio.
Using Equation (2), which is the distinction between the impact related to introducing recycled material and that connected with manufacturing of displaced virgin material, the net impact (burden/saving) of replacing virgin with recycled material was computed. Utilising the substitution factor Qs/Qp, the quality differences between recycled and virgin materials are considered when calculating the impacts of virgin manufacture. The burdens/savings compared with the quantity of virgin material that may be for the given polymer, replaced in an unspecified application are therefore represented by the delta (∆). The PEF approach uses substitution factors that are set as default values to quantify the displacement of virgin polymers by recycled ones. They are 0.9 for PS, PET, PP, and HDPE depending on techno-economic factors, and 0.75 for LDPE [25].

2.2. Life Cycle Inventory

The data and major assumptions for modelling waste collection, sorting, recycling, and virgin polymer production are discussed in this section. The ecoinvent 3.9 database and published literature were consulted as primary data sources.
Collection and transportation for source-separated recycling were modelled in accordance with [26]. Since there are no well-organised statistics for plastic collection, the data used here are derived from literature that describes better management systems.
After collection, specific material recovery facilities (MRFs) sort the polymer waste from post-consumer plastic items that have been collected separately. In the case of a multi-material collection, the objectives of sorting include separating plastics from any other materials collected, removing impurities (i.e., non-recyclable components), and sorting mixed plastics into discrete polymer streams. Additional colour-based sorting of homogeneous polymer streams can be accomplished either within the sorting facilities or prior to recovery at recycling plants. The specific data of sorting mixed plastic waste was compiled by [27]. The sorting of plastics that are collected at the municipality is represented by most of the data applied. We acknowledge the limitations arising from the missing of some specific data. The rate of sorting was determined using the results of a recent study; the percentages are 91% (PET and HDPE), 73% (LDPE), 79% (P), and 65% (PS) [28].
For each polymer studied, mechanical recycling process was modelled. Sorted plastic waste and its processing stages were modelled using aggregated EF-compliant data set for secondary PET granulate production for considering the burdens. This hypothesis is consistent with the typical disposition of residues from plastic recycling, which are typically incinerated or co-fired in the cement industry due to their high calorific value [29].
The ecoinvent dataset “polyethylene terephthalate production, granulate, bottle grade, recycled” was used for modelling the secondary PET bottle production from the post-consumer sorted PET waste when there was lack of EF-compliant dataset [30]. It was created using data from various recycling facilities and represents the costs of processing bottle-quality PET flakes from waste PET bundles. Following that, the purified PET flakes were washed and dried. The foundation for modelling HDPE recycling was “Polyethylene production, high density, granulate, recycled” from ecoinvent [31]. The latest and more comprehensive version of the original inventory data was also reflected in the updated dataset [32].
A specific dataset for PP recycling is not available in current life cycle inventory databases or in the EF context. A new dataset was therefore developed using foreground inventory data from the literature and databases such as ecoinvent 3.9, as well as EF-compliant datasets for the supply of energy and material.
Like PP, there are no specific recycling datasets for LDPE and PS recycling in the EF context or in existing databases of life cycle analysis. Hence, the combined EF-compliant dataset for the production of recycled plastic from sorted plastics waste was used to estimate recycling (Table 1). The modelled recycling process includes procedures that are usually used for other thermoplastics, based on operation-specific inventory data from the literature.

2.2.1. Virgin Polymer Production

Virgin polymers are produced from fossil fuels and their derivatives, which are extracted and transported to refineries. At refineries, the fossil fuels are processed into naphtha, which is used as feedstock for polymer manufacturing. The feedstocks are then converted into other intermediate products and monomers that are used to make different types of polymers through polymerisation. Finally, the polymers are formed into pellets or semi-finished products and transported to their destinations. All these steps contribute to the production of virgin polymers [33].

2.2.2. Feedstock Supply

A dataset that adheres to the EF compliance standards was acquired and prepared to estimate the costs of transporting crude oil from various conventional and unconventional sources to refineries that process it. The dataset represents the crude oil mix that was consumed in 2014, which accurately reflects the situation of that year [34]. The crude oil inventory covers all the activities involved in supplying crude oil, such as finding, drilling, producing, refining it, transporting it over long distances by pipelines and ships, and distributing it to final consumers by pipelines. The inventory excludes accidental spills and fires of oil but does include oil losses that occur during transportation by pipelines or vessels. The inventory also considers the land use and land use change impacts of land-based sources and activities related to other oil sources [11]. When crude oil and natural gas are produced together, the inventory allocates resources based on their net calorific value. The inventory uses literature data to model the activities of finding, producing and refining oil.
The inventory includes all the steps in the natural gas supply chain, such as finding, drilling, producing, processing, liquefying, gasifying, transporting over long distances by pipelines and ships, and distributing to final consumers by pipelines [35]. The inventory also considers the possible losses of natural gas during transportation by pipelines or vessels.

2.2.3. Polymer Production

The inventory uses aggregated gate-to-gate datasets to model the production of various polymers from feedstock like naphtha, crude oil and natural gas by polymerisation (Table 2). The main process is steam cracking of naphtha and natural gas, which generates ethylene, propylene, butadiene, and other intermediates. Other processes include reforming naphtha using catalyst and reforming natural gas using steam.

2.3. Climate Change Effects (GHG Savings) from Plastic Recycling

The annual climate change impact of plastic waste recycling is calculated by projection of the per tonne results to the overall waste flow, which may be recycled further. Depending on the information from global plastic outlook 2022, we estimate the overall potential benefits by considering the yearly generation of plastic waste across the globe amounting to 242 Mt in 2019 [32]. The quantity of each plastic waste generated (polymer waste i) is calculated (Equation (3)) based on the current share of market percentage of total demand for plastics share of market i reported in [36].
(Polymer waste generated)i = Annual generation of plastic waste in World × (Market share)i
Equation (4) is used to calculate the quantity of each plastic waste separately collected currently for recycling.
(Polymer waste collected currently for recycling)i = (Polymer waste generated)i × (%collected and sent for recycling)i
With the assumption that this plastic would go to landfill or incineration if there is no recycling, and that the virgin material is replaced by secondary material, the overall yearly climate change (GHG savings as CO2e) from the present recycling can be estimated by employing Equation (5). However, there may be an argument on whether the effects of displacement of incineration and landfill have to be considered or not because there is no diversion of the waste for recycling [37]. On the other hand, a similar justification may be applied to the effects of virgin material substitution analogically; since product manufacturing should already have secondary material use as an established practice, no virgin material displacement would take place if recycling were already happening. Also, note that the index i refers to every single investigated plastic waste in this study in every equation.
Annual climate change effect from recycling = ∑ ((Polymer waste collected for recycling)i × (Climate change effect)i)
Equation (6) calculates the quantity of each plastic waste that can be collected and sent for recycling besides the present scenario. The additional climate change (GHG savings) from diverting the presently incinerated or landfilled polymer waste to recycling can be estimated using Equation (7). In terms of the expected capture rate for polymer waste, we depend on Triconomics’ figures [38] that are based on the Nordic Council of Ministers study, which suggests a maximum level of 70%.
(Plastics waste additionally collected for recycling)i = (Polymer waste generated)i − (Polymer waste currently collected for recycling)i × Expected Rate
Annual Climate Change effect (future recycling) = ∑ (Plastics waste that can be collected for recycling)i × (Climate Change effect)i

2.4. Microplastics Emission Reduction

Assuming global recycling rate of 12%, the emissions of microplastics were calculated using the following Equations (8) and (9).
Mismanaged Plastics waste = ∑ [Per capita Plastic waste generation × (1 − Recycling Rate)]
Potential Microplastics Emissions = Mismanaged Plastic by polymer type × Microplastic Emission factor
The emission factors were extracted from different literature. Per capita waste generation data are extracted from (ourworldindata.org). Although they are not agreed-upon values, we were obliged to use them since there are no standardised values available. However, the above equations did not consider the microplastics emitted from the recycling process. Therefore, the amount of microplastics emitted from the recycling process stages is added to the total amount at the end. Emission data during recycling was extracted from [39].

2.5. Resource Depletion Savings

Similarly, resource depletion saving was calculated according to the following Equation (10) and the total saving is the sum of the savings from each type of plastic.
Resource Depletion Savings = (Amount of plastics waste generated (Mt) × Recycling rate (%) × Substitution factor) + Resource Saved due to avoided raw material extraction and transportation (Mt)

3. Results and Discussion

3.1. GHG Emissions Reduction

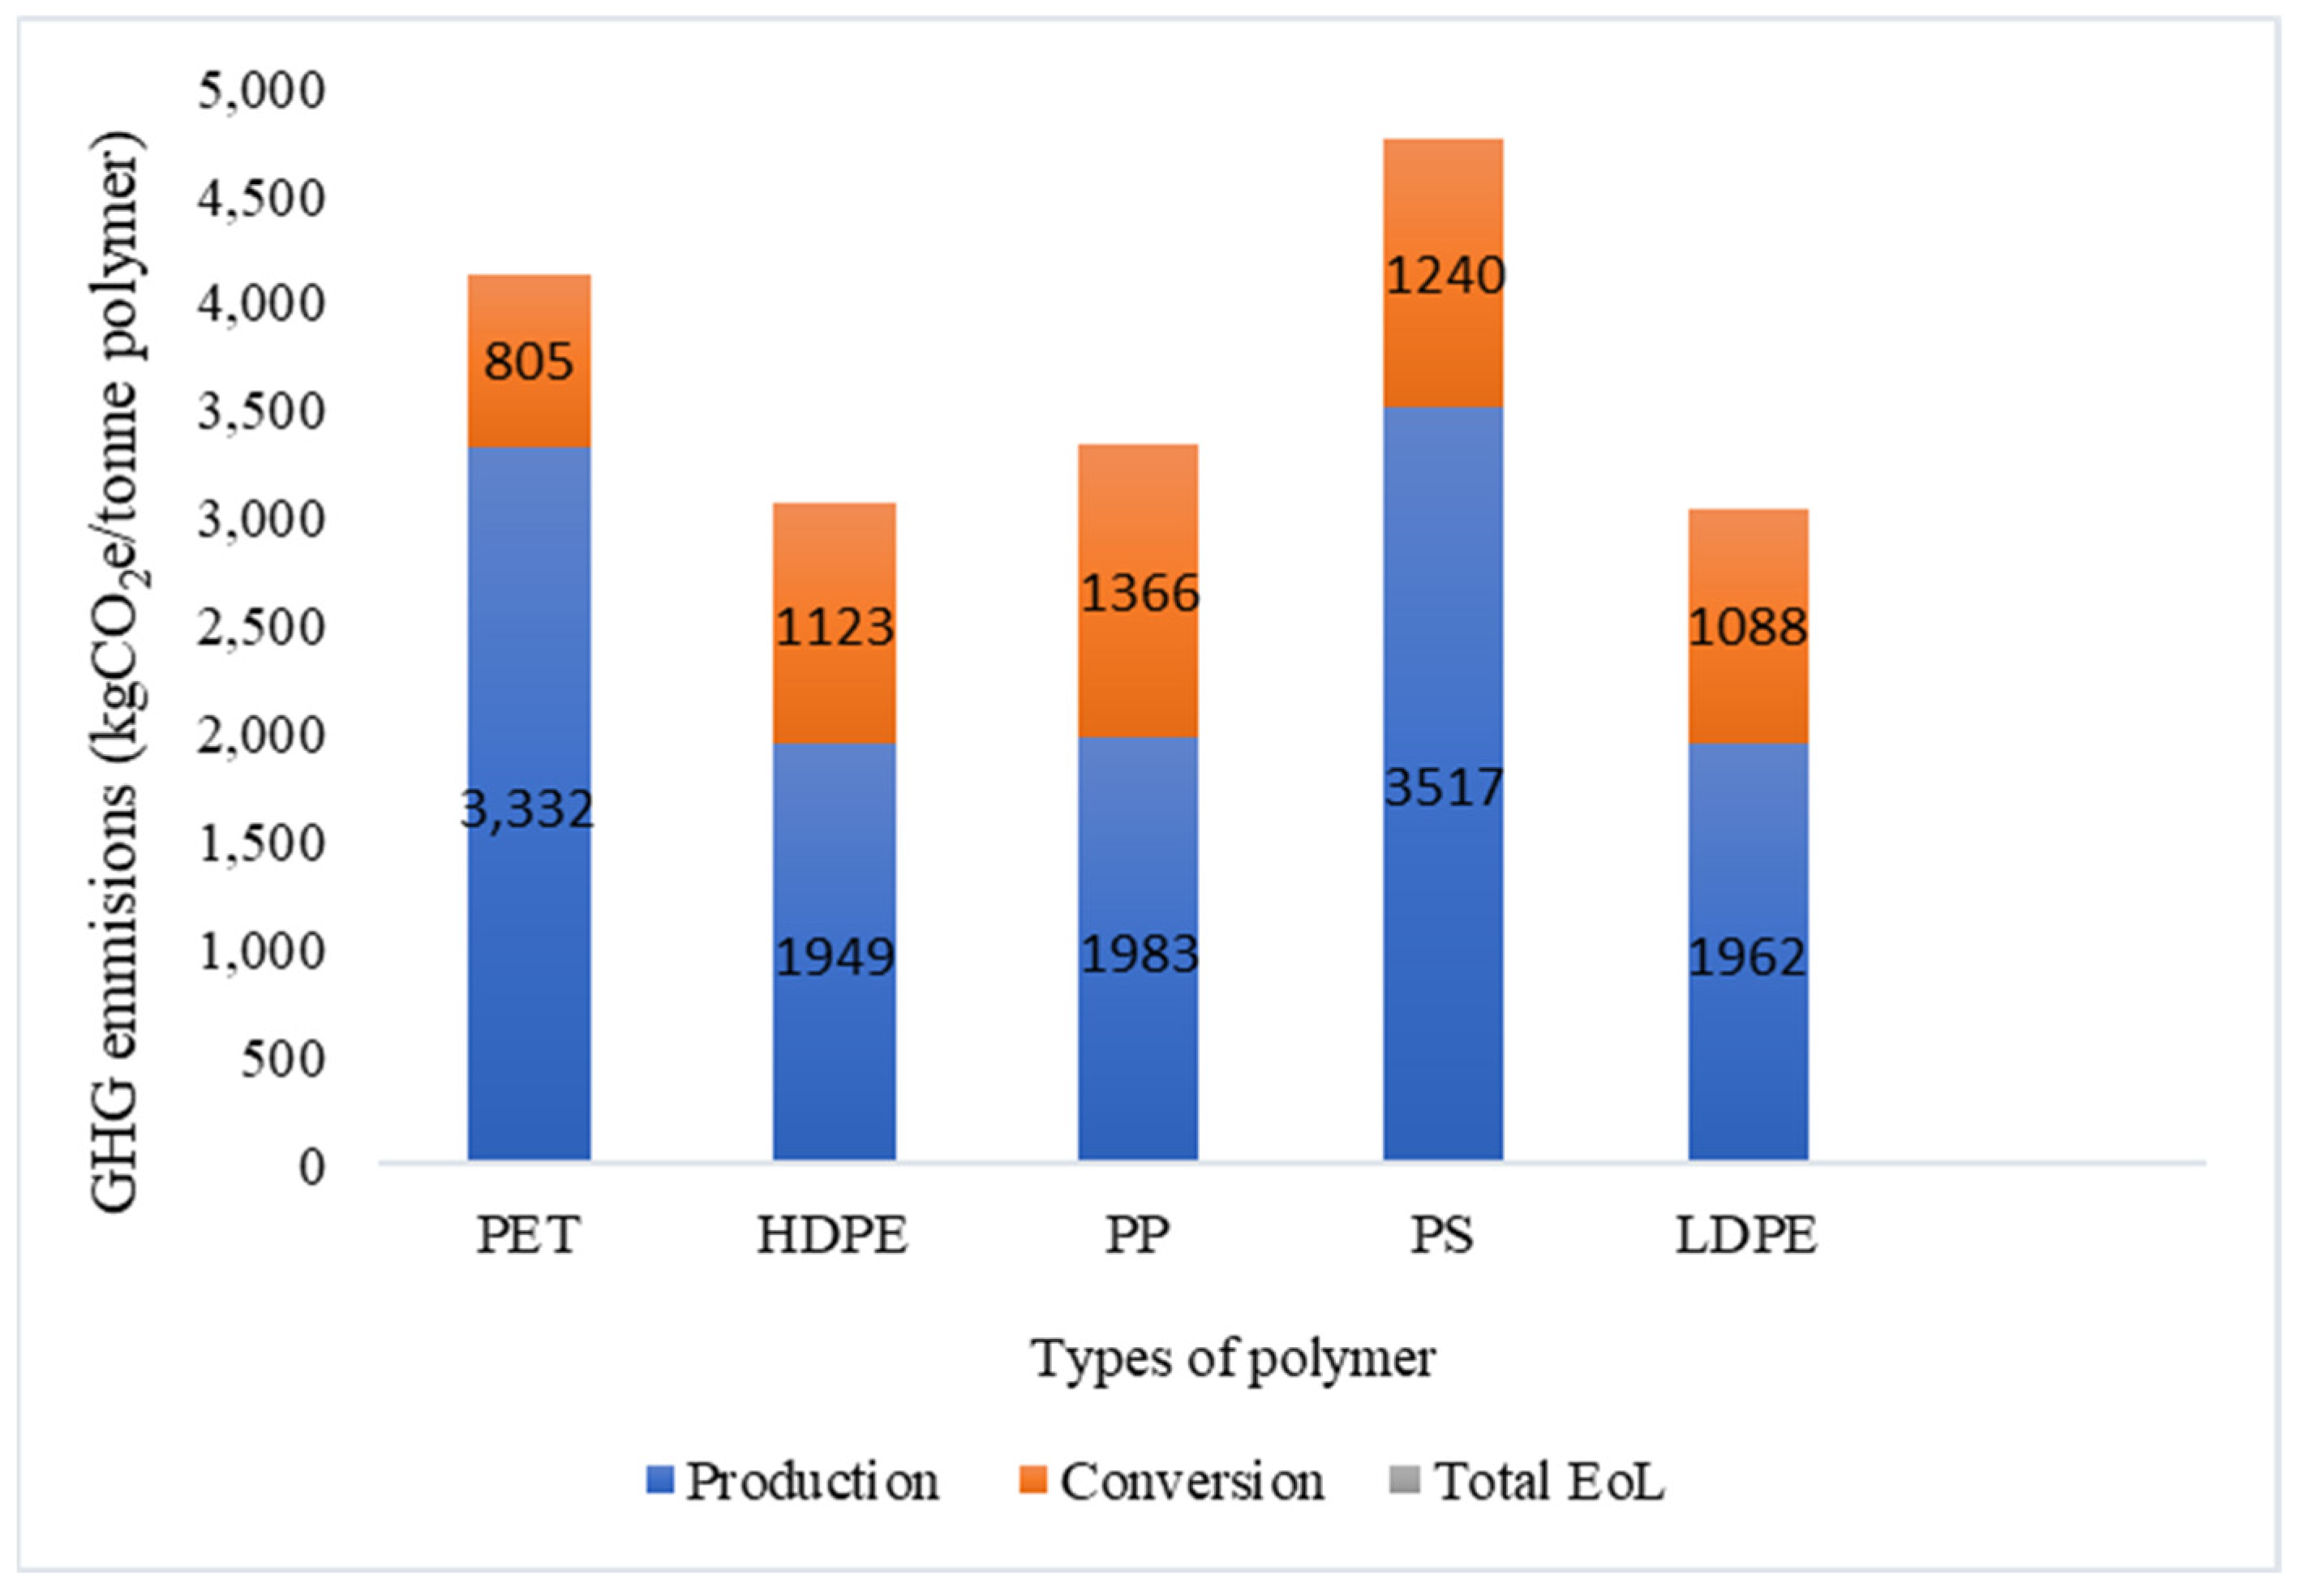
Conventional (fossil fuel-based) plastics emitted 1.8 GtCO2e in 2015 over their life cycle, which is 3.8% of the GHG emitted globally in the same year, 47 GtCO2e [40]. In this study, we focused only on the widely used polymer types and the life cycle GHG emission was estimated to be 20.7 GtCO2e/year. The production stage greatly contributed to the emission (61%), followed by the conversion stage (30%), the rest being contributed by end-of-life (EoL) management facilities. Among the polymers, polystyrene contributed the highest followed by polyethylene (Figure 2).
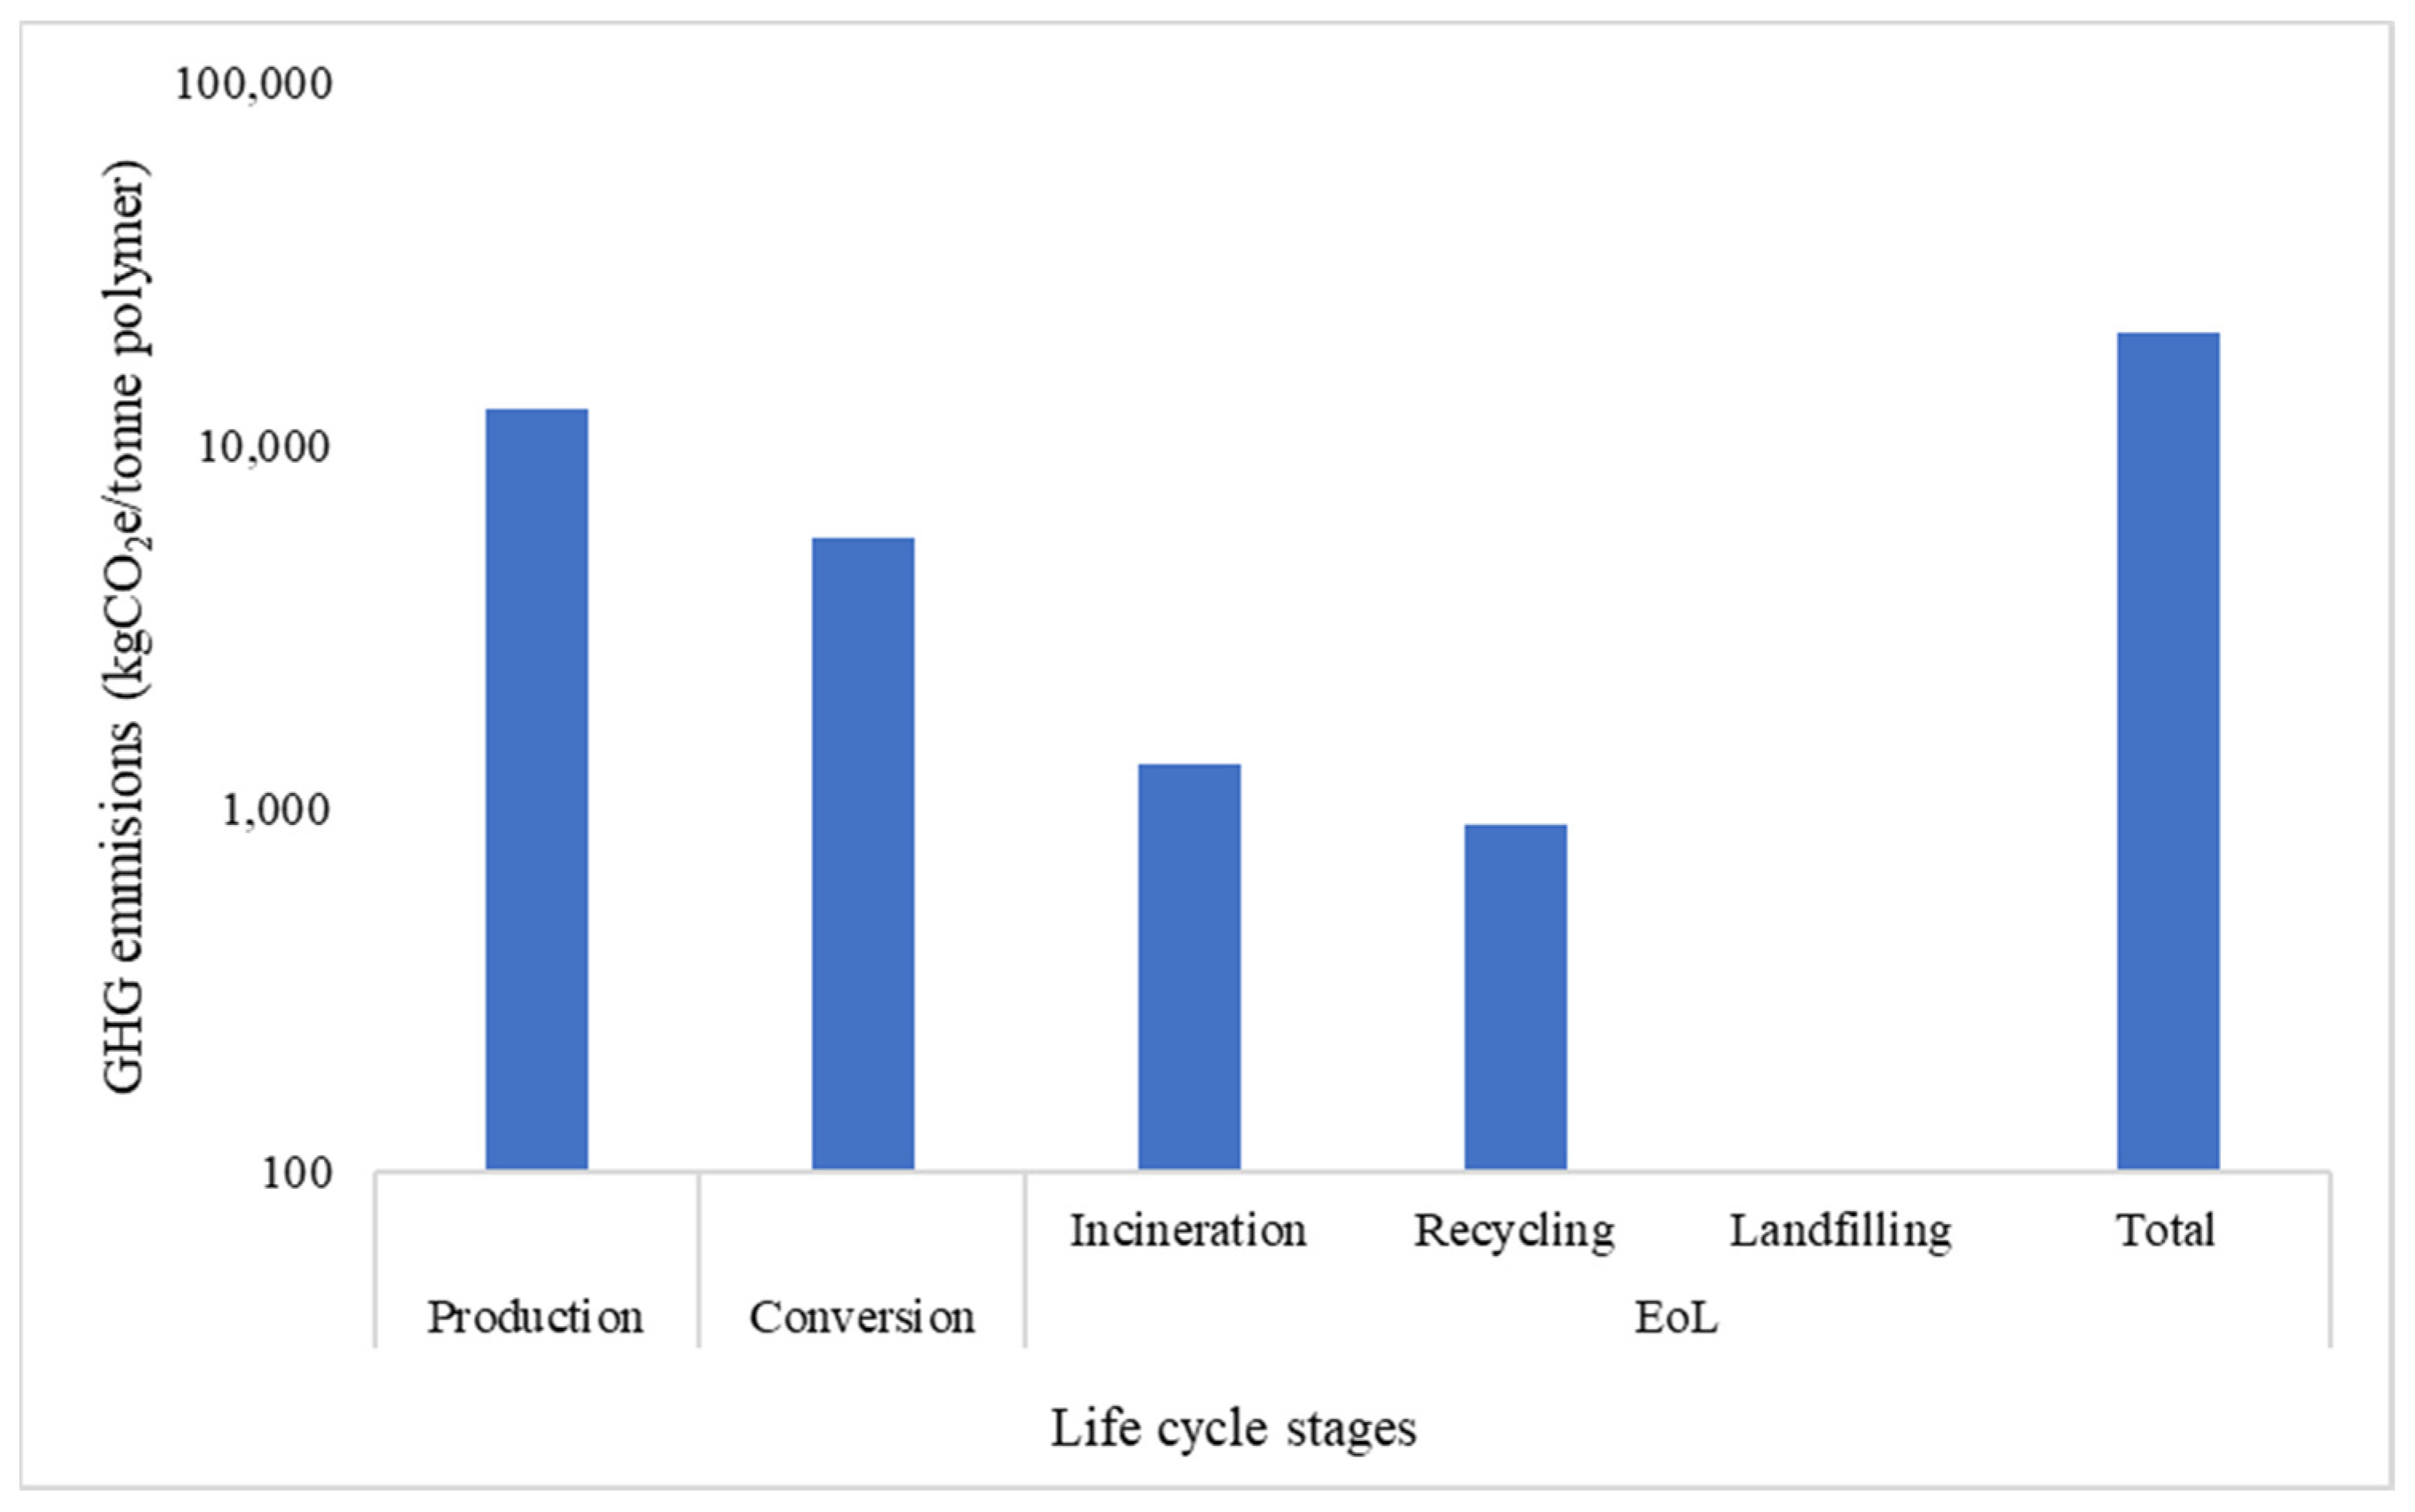
Excluding the carbon credits from recycling, the EoL stage contributed 9% of overall life cycle emissions. Among EoL processes (Figure 3), incineration was found to be the major source of GHG emissions. Landfill produced the lowest GHG emissions, even though the biggest portion of plastic waste ended up in them. The recycling process generated 50 MtCO2e. However, when the replacement of virgin polymer production by recycling is taken into account, the GHG emission decreased to negative 67 MtCO2e, and the overall emissions from the EoL would decrease from 160 MtCO2e to 45 MtCO2e. In this scenario, the overall global life cycle GHG emissions of plastics will be 1.74 GtCO2e, which is 3.5% of annual GHG emissions in 2015 across the globe.
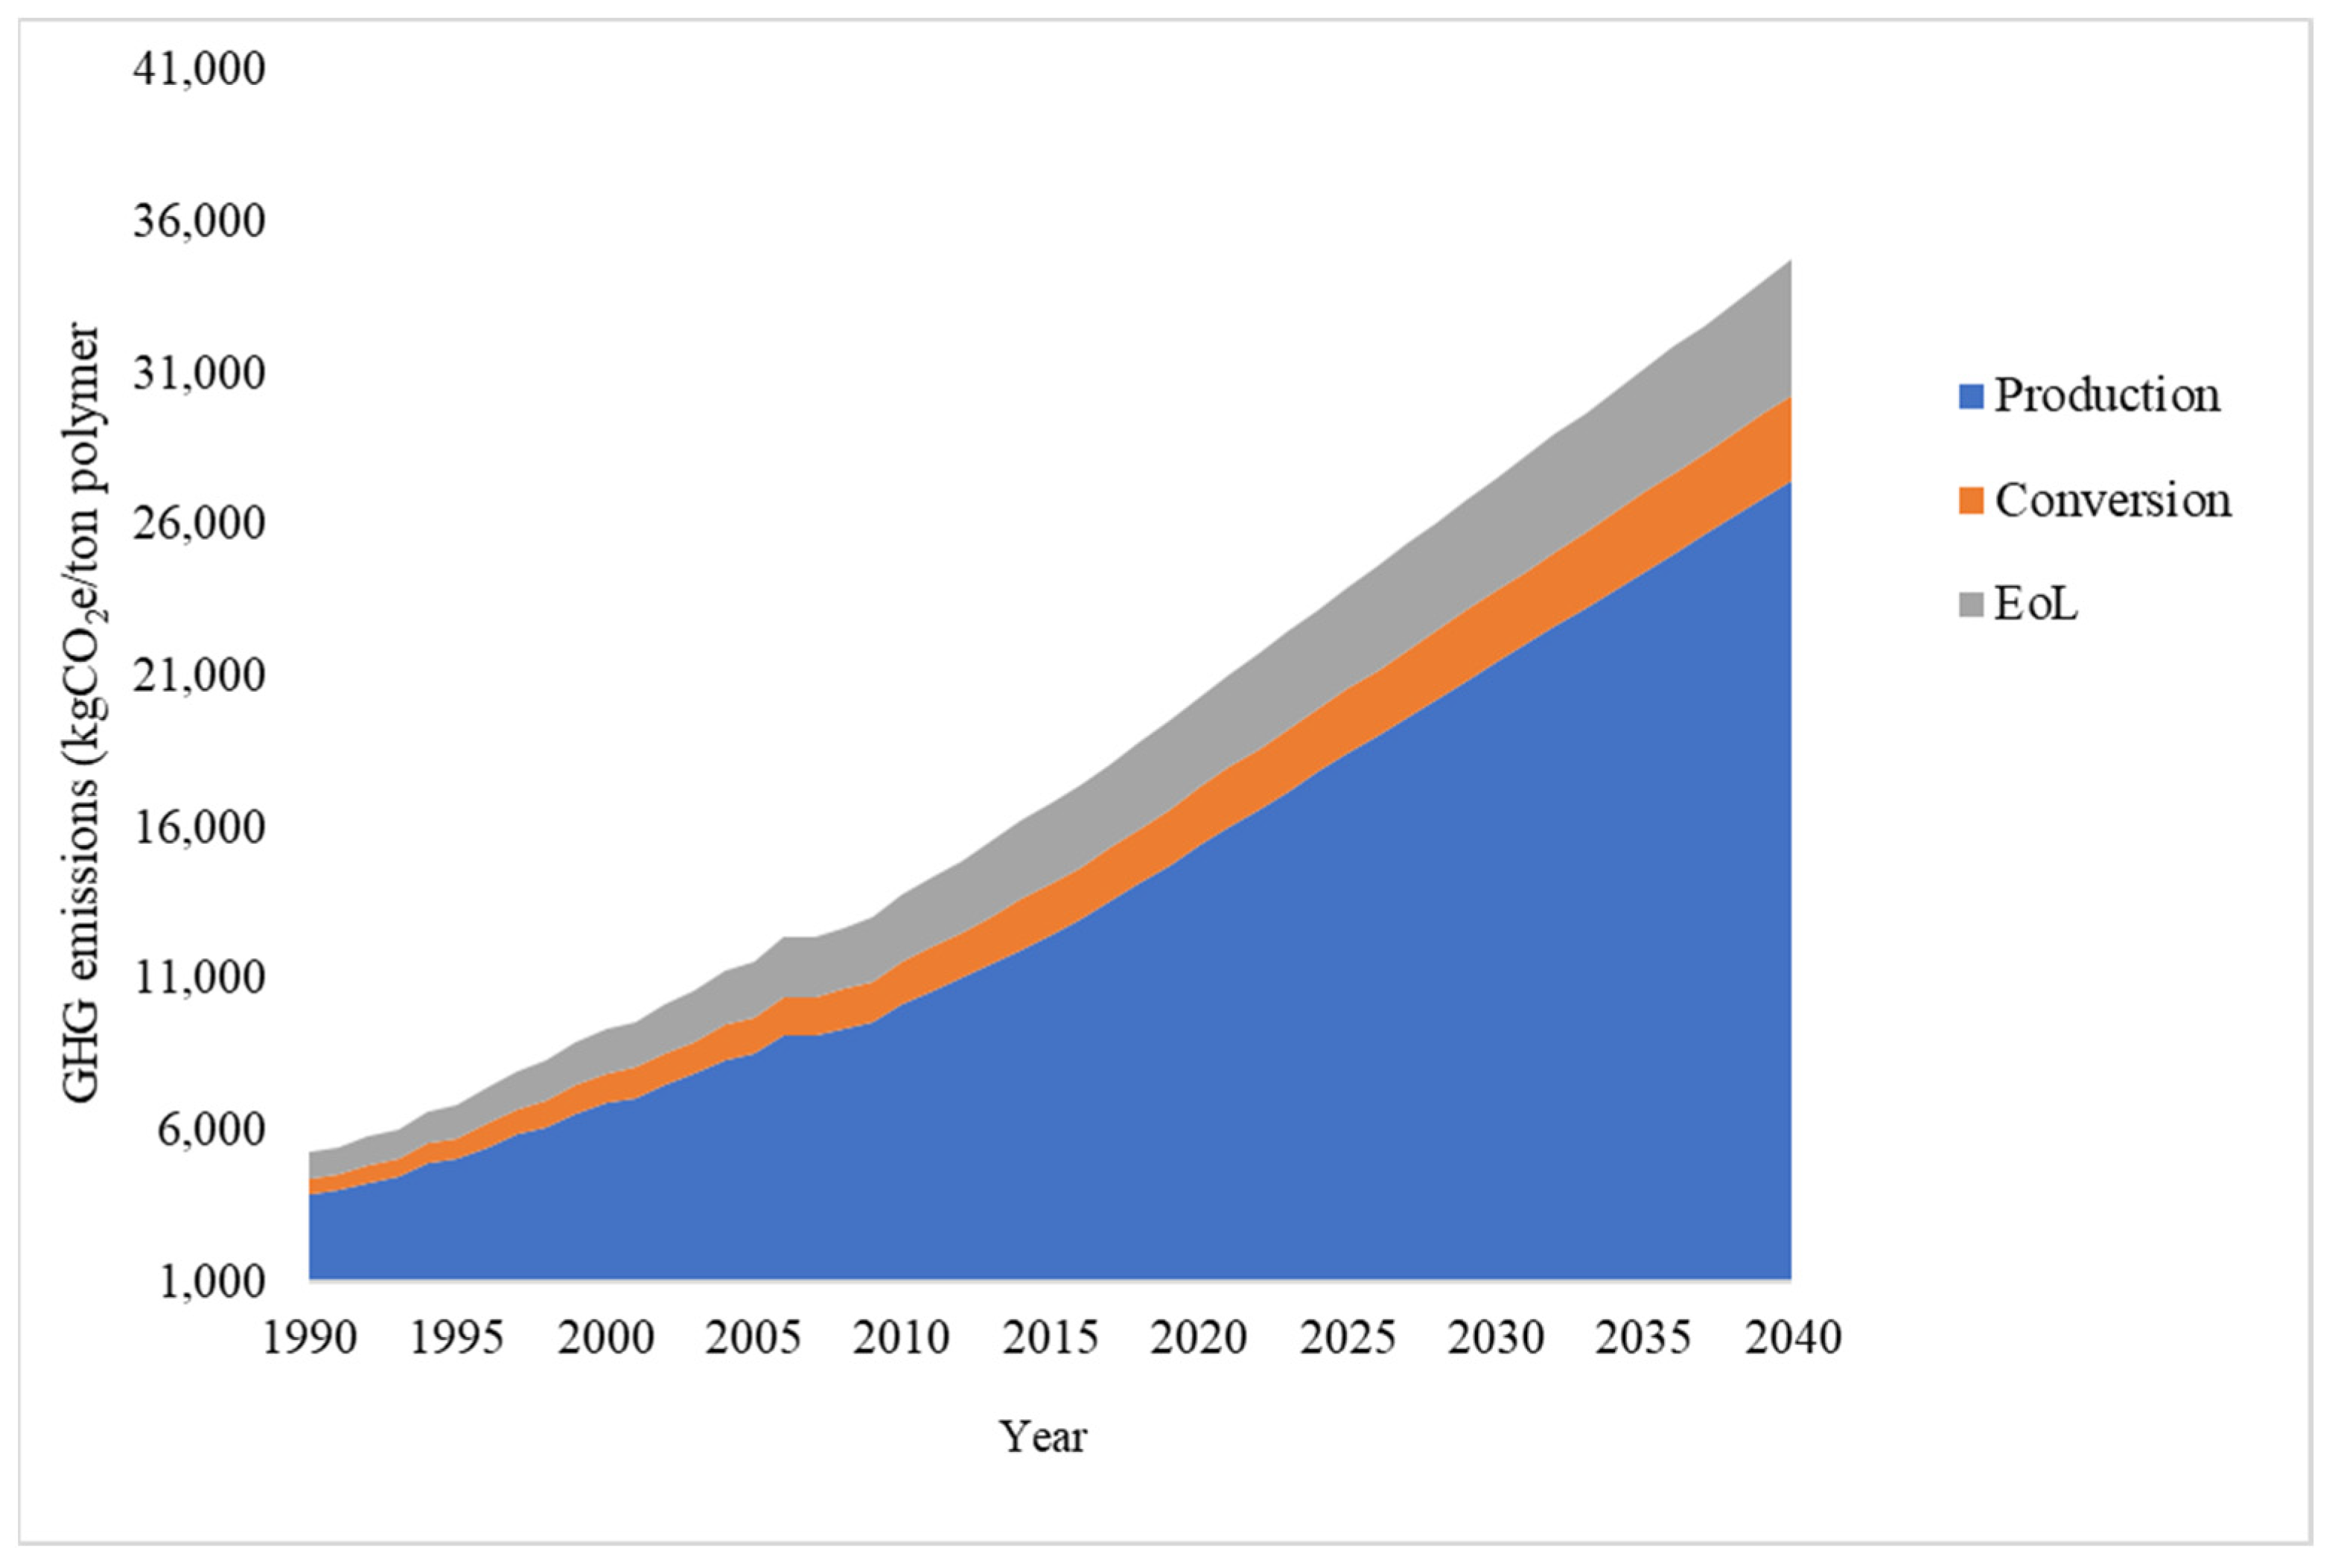
If the current trend continues, globally the life cycle GHG emissions from plastics are likely to grow fast. The global economy generated over 400 Mt of plastics in 2015, with an average annual growth rate of 4% between 2010 and 2015. Based on this trend, yearly plastics production is predicted to grow to 1600 Mt by 2040, and the life cycle GHG emissions are predicted to grow from 1.74 GtCO2e in 2015 to 3.5 GtCO2e in 2040 (Figure 4). The total yearly emissions will reach 6.0 GtCO2e if all plastic waste is incinerated by 2040. However, recycling all plastic waste would drop the emissions to 3.9 GtCO2e by 2040. Recycling reduces GHG emissions from some end-of-life processes like incineration, while partly lowering the carbon-intensive virgin polymer production [41].

3.2. Microplastics Emissions

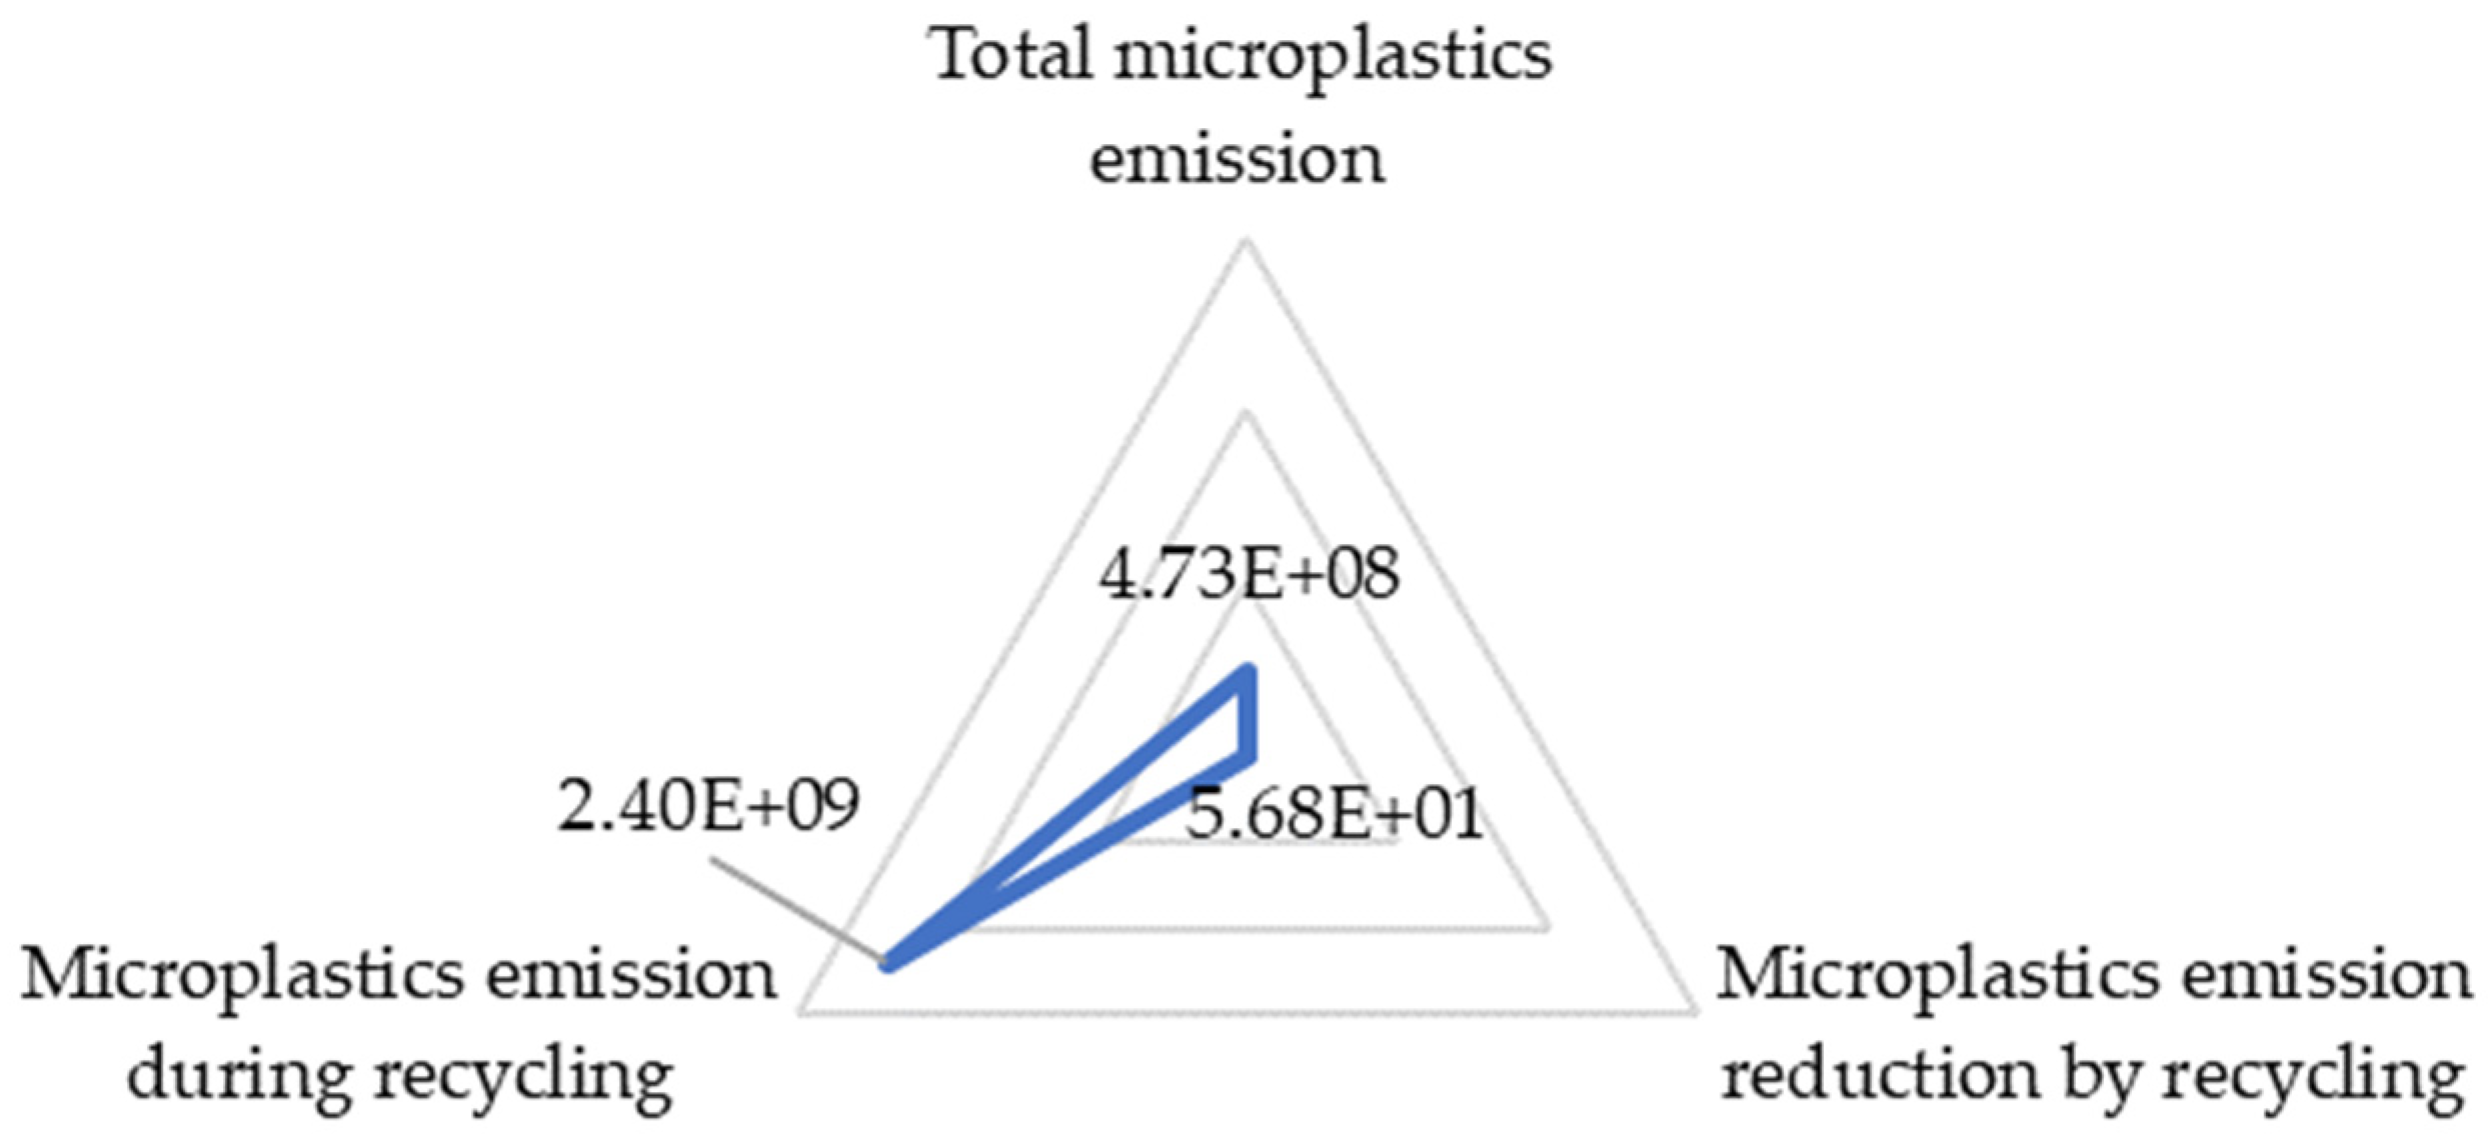
The recovery and recycling of plastics has increased significantly recently as a strategy to achieve sustainable production and consumption and minimisation of plastics pollution. However, the emission of microplastics during plastic recycling has hardly received attention. Although plastic recycling can reduce some amount of microplastic emissions, the processes involved in mechanical recycling are found significantly contributing to microplastic emissions. In this study, we found that the recycling facility reduced microplastics due to decreased disposal of plastics to the environment and recycling, considering a 12% recycling rate as a basis (Figure 5). However, the microplastic emissions from the overall recycling process increased up on recycling. This may be attributed to the change in the property of the collected plastics due to weathering and intensive mechanical processes for reducing the size of the plastic waste.
Plastic flakes produced by milling and extrusion at mechanical recycling facilities were found to be a primary source of microplastics. A study conducted in a mechanical recycling facility identified every type of polymer (microplastics) in the nearby water body. The detected microplastics are in their original colour, which indicates that the microplastics are joining instantly and are not fragmented through weathering processes. Not only does the recycling process contributes to the increased microplastic emission, but also the application of recycled plastics. For instance, the incorporation of recycled plastics as polymer modifiers in the bitumen matrix applied for asphalt mix was found to be contributing to a significant amount of microplastic emissions. The premises from the study concluded that acid rain and cold weather facilitate the emission of microplastics [42]. Other studies in China also indicated that the recycling facilities contributed to an increase in microplastics in air as well as water bodies and also revealed that they are acting as a heavy metal carriers in dust from recycling facilities [43]. The wastewater treatment facility at the recycling facility was polluted significantly with increased microplastic concentration and the microplastic concentration was high in the sludge.

3.3. Resource Depletion

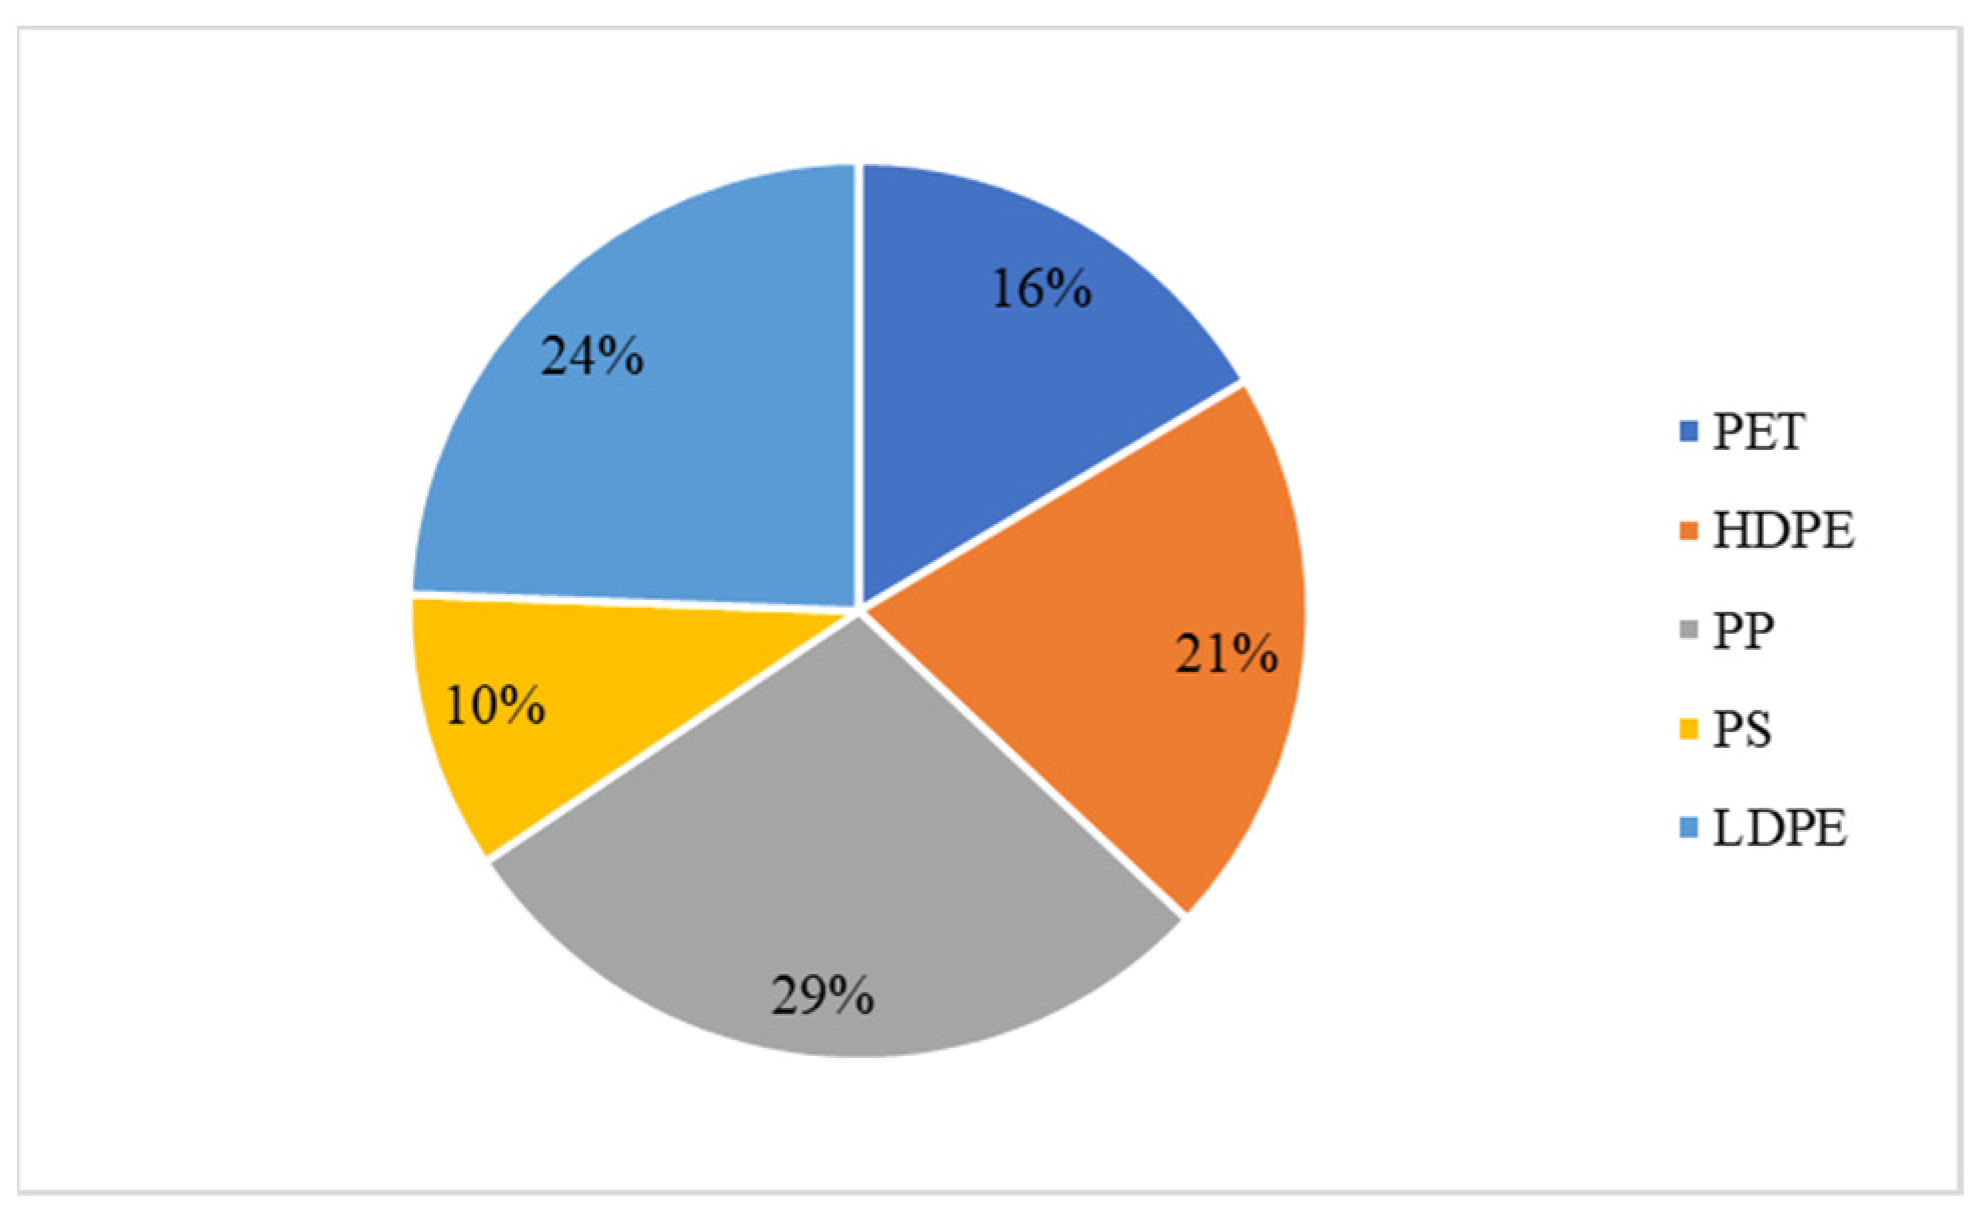
Recycling is an important factor in conserving natural resources and greatly contributes towards improving the environment. Although plastics contribute to economic growth, their current production and consumption trend of “take, make, use and dispose” is a primary driver of natural resource depletion as well as environmental pollution [21]. The study result showed that about 50 Mt of crude oil can be saved per year by employing recycling. In this study, we considered a global recycling rate of 12% for all types of plastics. Accordingly, the resource depletion savings due to recycling were between 10 to 29% for the different plastic types (Figure 6). PP recycling was found to save 29% of the resource from depletion, while PS exhibited the least (10%).

4. Perspectives

In general, the results of the study magnify the benefits of recycling in order to address the most prevailing environmental impacts of plastics. It can also be understood that recycling contributes significantly to the reduction of GHG emissions. However, the reduction is not only attributed to the recycling process. Upstream processes starting from the collection have a great contribution as well. It is also attributed to the displacement of the virgin material extraction as well as avoiding EoL processes such as incineration. The over-ambitious recycling plan (100%) of some of the countries like Thailand has to be revised to fit the reality of the world.
The increase in microplastics in the environment due to recycling needs great attention. All the mechanical processes involved have to be redesigned and modified in such a way that captures the microplastics emitted during the process. More importantly, the size reduction of recycled plastics needs special attention since the fragmentation rate of weathered plastics is higher than that of virgin material. Even though it was presumed that recycling can reduce microplastic emissions as a result of reducing virgin material introduction to the market, the study revealed that the microplastic emissions during mechanical recycling are much higher than the displacement.
Recycling supports the idea of a circular economy, which aims to conserve resources for as long as feasible. A circular economy seeks to build a closed-loop system where materials are continuously recycled and reused rather than adhering to a linear “take-make-dispose” approach. This strategy eliminates waste production and the demand for fresh resource extraction, hence preventing resource depletion and fostering a sustainable method of resource management. Recycling helps materials and products last longer. After their initial usage, materials can be recycled to create new goods rather than being thrown away. This lessens the need to mine and produce new materials, enabling better utilisation of already available resources. Recycling aids in reducing the rate of resource depletion by maximising the usefulness of materials. In general, we can conserve natural resources and lessen the ensuing environmental deterioration by reusing items and reducing the demand for fresh extraction.

5. Conclusions

The study investigated plastics recycling as a strategy to reduce life cycle GHG emissions, microplastics and resource depletion. It can be concluded that recycling can serve as a strategy to reduce environmental burdens such as GHG emissions and resource depletion. The current recycling facilities across the globe are dominated by mechanical recycling, they are significantly contributing to microplastic emissions due to the size reduction (grinding) and extrusion processes. Recycling could save 56.8 million microplastic emissions per year. However, mechanical recycling, which is commercialised nowadays, contributed to an increase in microplastics as much as 2.4 × 10⁹ million particles per year. To this end, the study assumed that recycling could reduce microplastic emissions, which is not valid according to the study result. Recycling also serves as an effective strategy to reduce resource depletion. The results showed that recycling can reduce life cycle GHG emissions and resource depletion significantly. The replacement of carbon-intensive virgin polymer production by recycling can reduce GHG emissions down to negative 67 MtCO2e. Plastics are derived from non-renewable resources such as petroleum and natural gas. By recycling plastics, we can conserve these resources and reduce the need for plastic production from virgin materials. Recycling will also save about 50 million tons of resources from depletion worldwide by recycling around 20 Mt plastics. This will not only help protect finite resources but also reduces the environmental impact associated with the extraction and processing of raw materials.

Author Contributions

E.W.G. and S.H.G. contributed to the study conception and design. Material preparation, data collection and analysis were performed by E.W.G. The first draft of the manuscript was written by E.W.G. and supervised by S.H.G., E.W.G., S.H.G. and C.R. commented on the final version of the manuscript. All authors have read and agreed to the published version of the manuscript.

Funding

This research received no external funding.

Institutional Review Board Statement

Not applicable.

Informed Consent Statement

Not applicable.

Data Availability Statement

The data presented in this study are available in the article itself.

Acknowledgments

The authors acknowledge the Joint Graduate School of Energy and Environment (JGSEE), King Mongkut’s University of Technology Thonburi (KMUTT) for the postdoctoral fellowship.

Conflicts of Interest

The authors declare no conflict of interest.

References

  1. Thompson, R.C.; Moore, C.J.; Saal, F.S.V.; Swan, S.H. Plastics, the Environment and Human Health: Current Consensus and Future Trends. Philos. Trans. R. Soc. B Biol. Sci. 2009, 364, 2153–2166. [Google Scholar] [CrossRef]
  2. Kaza, S.; Yao, L.; Bhada-Tata, P.; Van Woerden, F. What a Waste 2.0: A Global Snapshot of Solid Waste Management to 2050; World Bank Publications: Washington, DC, USA, 2018. [Google Scholar]
  3. Leslie, H.A.; Brandsma, S.H.; van Velzen, M.J.M.; Vethaak, A.D. Microplastics En Route: Field Measurements in the Dutch River Delta and Amsterdam Canals, Wastewater Treatment Plants, North Sea Sediments and Biota. Environ. Int. 2017, 101, 133–142. [Google Scholar] [CrossRef]
  4. Kitahara, K.I.; Nakata, H. Plastic Additives as Tracers of Microplastic Sources in Japanese Road Dusts. Sci. Total Environ. 2020, 736, 139694. [Google Scholar] [CrossRef] [PubMed]
  5. Kumar, R.; Verma, A.; Shome, A.; Sinha, R.; Sinha, S.; Jha, P.K.; Kumar, R.; Kumar, P.; Shubham; Das, S.; et al. Impacts of Plastic Pollution on Ecosystem Services, Sustainable Development Goals, and Need to Focus on Circular Economy and Policy Interventions. Sustainability 2021, 13, 9963. [Google Scholar] [CrossRef]
  6. PlasticsEurope. Eco-Profiles of the European Plastics Industry: Polyurethane Rigid Foam. 2020, pp. 58–59. Available online: https://plasticseurope.org/ (accessed on 20 March 2023).
  7. Popa, C.L.; Dontu, S.I.; Savastru, D.; Carstea, E.M. Role of Citizen Scientists in Environmental Plastic Litter Research—A Systematic Review. Sustainability 2022, 14, 13265. [Google Scholar] [CrossRef]
  8. Mugilarasan, M.; Karthik, R.; Purvaja, R.; Robin, R.S.; Subbareddy, B.; Hariharan, G.; Rohan, S.; Jinoj, T.P.S.; Anandavelu, I.; Pugalenthi, P.; et al. Spatiotemporal Variations in Anthropogenic Marine Litter Pollution along the Northeast Beaches of India. Environ. Pollut. 2021, 280, 116954. [Google Scholar] [CrossRef]
  9. Kamalakkannan, S.; Abeynayaka, A.; Kulatunga, A.K.; Singh, R.K.; Tatsuno, M.; Gamaralalage, P.J.D. Life Cycle Assessment of Selected Single-Use Plastic Products towards Evidence-Based Policy Recommendations in Sri Lanka. Sustainability 2022, 14, 14170. [Google Scholar] [CrossRef]
  10. Nikolaev, A.A. The Physical Characterization and Terminal Velocities of Aluminium, Iron and Plastic Bottle Caps in a Water Environment. Recycling 2022, 7, 28. [Google Scholar] [CrossRef]
  11. European Commission. European Strategy for Plastics in a Circular Economy; European Commission: Brussels, Belgium, 2019.
  12. A Roadmap to 2025: The UK Plastics Pact. WRAP, Annual Report. 2020. Available online: https://wrap.org.uk/resources/guide/roadmap-2025-uk-plastics-pact (accessed on 20 March 2023).
  13. The World Bank. Plastic Waste Material Flow Analysis for Thailand; The World Bank: Washington, DC, USA, 2022. [Google Scholar]
  14. Mrowiec, B. Plastics in the circular economy (CE). Environ. Prot. Nat. Resour. 2018, 29, 16–19. [Google Scholar] [CrossRef]
  15. Vanderreydt, I.; Rommens, T.; Tenhunen, A.; Fogh Mortensen, L.; Tange, I. Greenhouse Gas Emissions and Natural Capital Implications of Plastics (Including Biobased Plastics)—Eionet Portal. Flanders, Belgium, 59p. 2021. Available online: https://www.eionet.europa.eu/etcs/etc-wmge/products/etc-wmge-reports/greenhouse-gas-emissions-and-natural-capital-implications-of-plastics-including-biobased-plastics (accessed on 20 March 2023).
  16. IPCC. Climate Change 2022, Mitigation of Climate Change Summary for Policymakers (SPM); IPCC: Geneva, Switzerland, 2022; ISBN 9781107415416. [Google Scholar]
  17. Agarski, B.; Budak, I.; Micunovic, M.I.; Vukelic, D. Life Cycle Assessment of Injection Moulding Tools and Multicomponent Plastic Cap Production. J. Clean. Prod. 2023, 413, 137450. [Google Scholar] [CrossRef]
  18. Zhang, K.; Hamidian, A.H.; Tubić, A.; Zhang, Y.; Fang, J.K.H.; Wu, C.; Lam, P.K.S. Understanding Plastic Degradation and Microplastic Formation in the Environment: A Review. Environ. Pollut. 2021, 274, 116554. [Google Scholar] [CrossRef]
  19. Seltenrich, N. New Link in the Food Chain? Marine Plastic Pollution and Seafood Safety. Environ. Health Perspect. 2015, 123, A34–A41. [Google Scholar] [CrossRef] [PubMed] [Green Version]
  20. Yuan, Z.; Nag, R.; Cummins, E. Human Health Concerns Regarding Microplastics in the Aquatic Environment—From Marine to Food Systems. Sci. Total Environ. 2022, 823, 153730. [Google Scholar] [CrossRef] [PubMed]
  21. Pinto Da Costa, J.; Rocha Santos, T.; Duarte, A. The Environmental Impacts of Plastics and Micro-Plastics Use, Waste and Pollution: EU and National Measures; European Union: Brussels, Belgium; Luxembourg, 2020; pp. 10–62. [Google Scholar]
  22. World Economic Forum (WEF). Rethinking the Future of Plastics—The New Plastics Economy: Rethinking the Future of Plastics; World Economic Forum: Cologny, Switzerland, 2016. [Google Scholar]
  23. Ragaert, K.; Delva, L.; Van Geem, K. Mechanical and Chemical Recycling of Solid Plastic Waste. Waste Manag. 2017, 69, 24–58. [Google Scholar] [CrossRef]
  24. Serranti, S.; Bonifazi, G. Techniques for Separation of Plastic Wastes. In Use of Recycled Plastics in Eco-Efficient Concrete; Elsevier: Amsterdam, The Netherlands, 2018; pp. 9–37. ISBN 9780081026762. [Google Scholar]
  25. Kangal, M.O.; Üçerler, Z. Recycling of Virgin and Post-Consumer Polypropylene and High Density Polyethylene. Int. Polym. Process. 2018, 33, 268–275. [Google Scholar] [CrossRef]
  26. Rigamonti, L.; Falbo, A.; Grosso, M. Improving Integrated Waste Management at the Regional Level: The Case of Lombardia. Waste Manag. Res. 2013, 31, 946–953. [Google Scholar] [CrossRef] [PubMed]
  27. Franklin Associates. Life Cycle Impacts of Plastic Packaging Compared To Substitutes in the United States and Canada; Franklin Associates: Baton Rouge, LA, USA, 2018; pp. 1–160. [Google Scholar]
  28. Antonopoulos, I.; Faraca, G.; Tonini, D. Recycling of Post-Consumer Plastic Packaging Waste in EU: Process Efficiencies, Material Flows, and Barriers. Waste Manag. 2021, 126, 694–705. [Google Scholar] [CrossRef] [PubMed]
  29. Rigamonti, L.; Falbo, A.; Zampori, L.; Sala, S. Supporting a Transition towards Sustainable Circular Economy: Sensitivity Analysis for the Interpretation of LCA for the Recovery of Electric and Electronic Waste. Int. J. Life Cycle Assess. 2017, 22, 1278–1287. [Google Scholar] [CrossRef] [Green Version]
  30. Ecoinvent: Ecoinvent 3.9.1 Dataset Documentation “Polyethylene Terephthalate Production, Granulate, Bottle Grade, Recycled-GLO”. Available online: https://v391.ecoquery.ecoinvent.org/Details/UPR/514a0bcb-315a-48e6-a0db-c066f9c92d3e/8b738ea0-f89e-4627-8679-433616064e82 (accessed on 15 May 2023).
  31. Ecoinvent: Ecoinvent 3.9.1 Dataset Documentation “Polyethylene Production, High Density, Granulate, Recycled-GLO”. Available online: https://v391.ecoquery.ecoinvent.org/Details/UPR/6ef2a207-2712-4809-8469-835fc8a66830/8b738ea0-f89e-4627-8679-433616064e82 (accessed on 15 May 2023).
  32. Nessi, S.; Sinkko, T.; Bulgheroni, C.; Garcia-Gutierrez, P.; Giuntoli, J.; Konti, A.; Sanye-Mengual, E.; Tonini, D.; Pant, R.; Marelli, L.; et al. Life Cycle Assessment (LCA) of Alternative Feedstocks for Plastics Production Part 1: The Plastics LCA Method; Publications Office of the European Union: Luxembourg, 2021. [Google Scholar]
  33. Hopewell, J.; Dvorak, R.; Kosior, E. Plastics Recycling: Challenges and Opportunities. Philos. Trans. R. Soc. B Biol. Sci. 2009, 364, 2115–2126. [Google Scholar] [CrossRef] [Green Version]
  34. Nessi, S.; Rigamonti, L.; Grosso, M. Packaging Waste Prevention Activities: A Life Cycle Assessment of the Effects on a Regional Waste Management System. Waste Manag. Res. 2015, 33, 833–849. [Google Scholar] [CrossRef]
  35. Littlefield, J.; Rai, S.; Skone, T.J. Life Cycle GHG Perspective on U.S. Natural Gas Delivery Pathways. Environ. Sci. Technol. 2022, 56, 16033–16042. [Google Scholar] [CrossRef] [PubMed]
  36. Textile Exchange. Preferred Fiber & Materials Market Report 2021; Textile Exchange: Lamesa, TX, USA, 2021. [Google Scholar]
  37. Zink, T.; Geyer, R. Material Recycling and the Myth of Landfill Diversion. J. Ind. Ecol. 2019, 23, 541–548. [Google Scholar] [CrossRef]
  38. Guran, S. Options to Feed Plastic Waste Back into the Manufacturing Industry to Achieve a Circular Carbon Economy. AIMS Environ. Sci. 2019, 6, 341–355. [Google Scholar] [CrossRef]
  39. Suzuki, G.; Uchida, N.; Tuyen, L.H.; Tanaka, K.; Matsukami, H.; Kunisue, T.; Takahashi, S.; Viet, P.H.; Kuramochi, H.; Osako, M. Mechanical Recycling of Plastic Waste as a Point Source of Microplastic Pollution. Environ. Pollut. 2022, 303, 119114. [Google Scholar] [CrossRef] [PubMed]
  40. Astrup, T.; Fruergaard, T.; Christensen, T.H. Recycling of Plastic: Accounting of Greenhouse Gases and Global Warming Contributions. Waste Manag. Res. 2009, 27, 763–772. [Google Scholar] [CrossRef] [PubMed]
  41. Gala, A.B.; Raugei, M.; Fullana-i-Palmer, P. Introducing a New Method for Calculating the Environmental Credits of End-of-Life Material Recovery in Attributional LCA. Int. J. Life Cycle Assess. 2015, 20, 645–654. [Google Scholar] [CrossRef]
  42. Enfrin, M.; Myszka, R.; Giustozzi, F. Paving Roads with Recycled Plastics: Microplastic Pollution or Eco-Friendly Solution? J. Hazard. Mater. 2022, 437, 129334. [Google Scholar] [CrossRef]
  43. Zhan, L.; Zhang, Q.; Bulati, A.; Wang, R.; Xu, Z. Characteristics of Microplastics and the Role for Complex Pollution in E-Waste Recycling Base of Shanghai, China. Environ. Int. 2022, 169, 107515. [Google Scholar] [CrossRef]
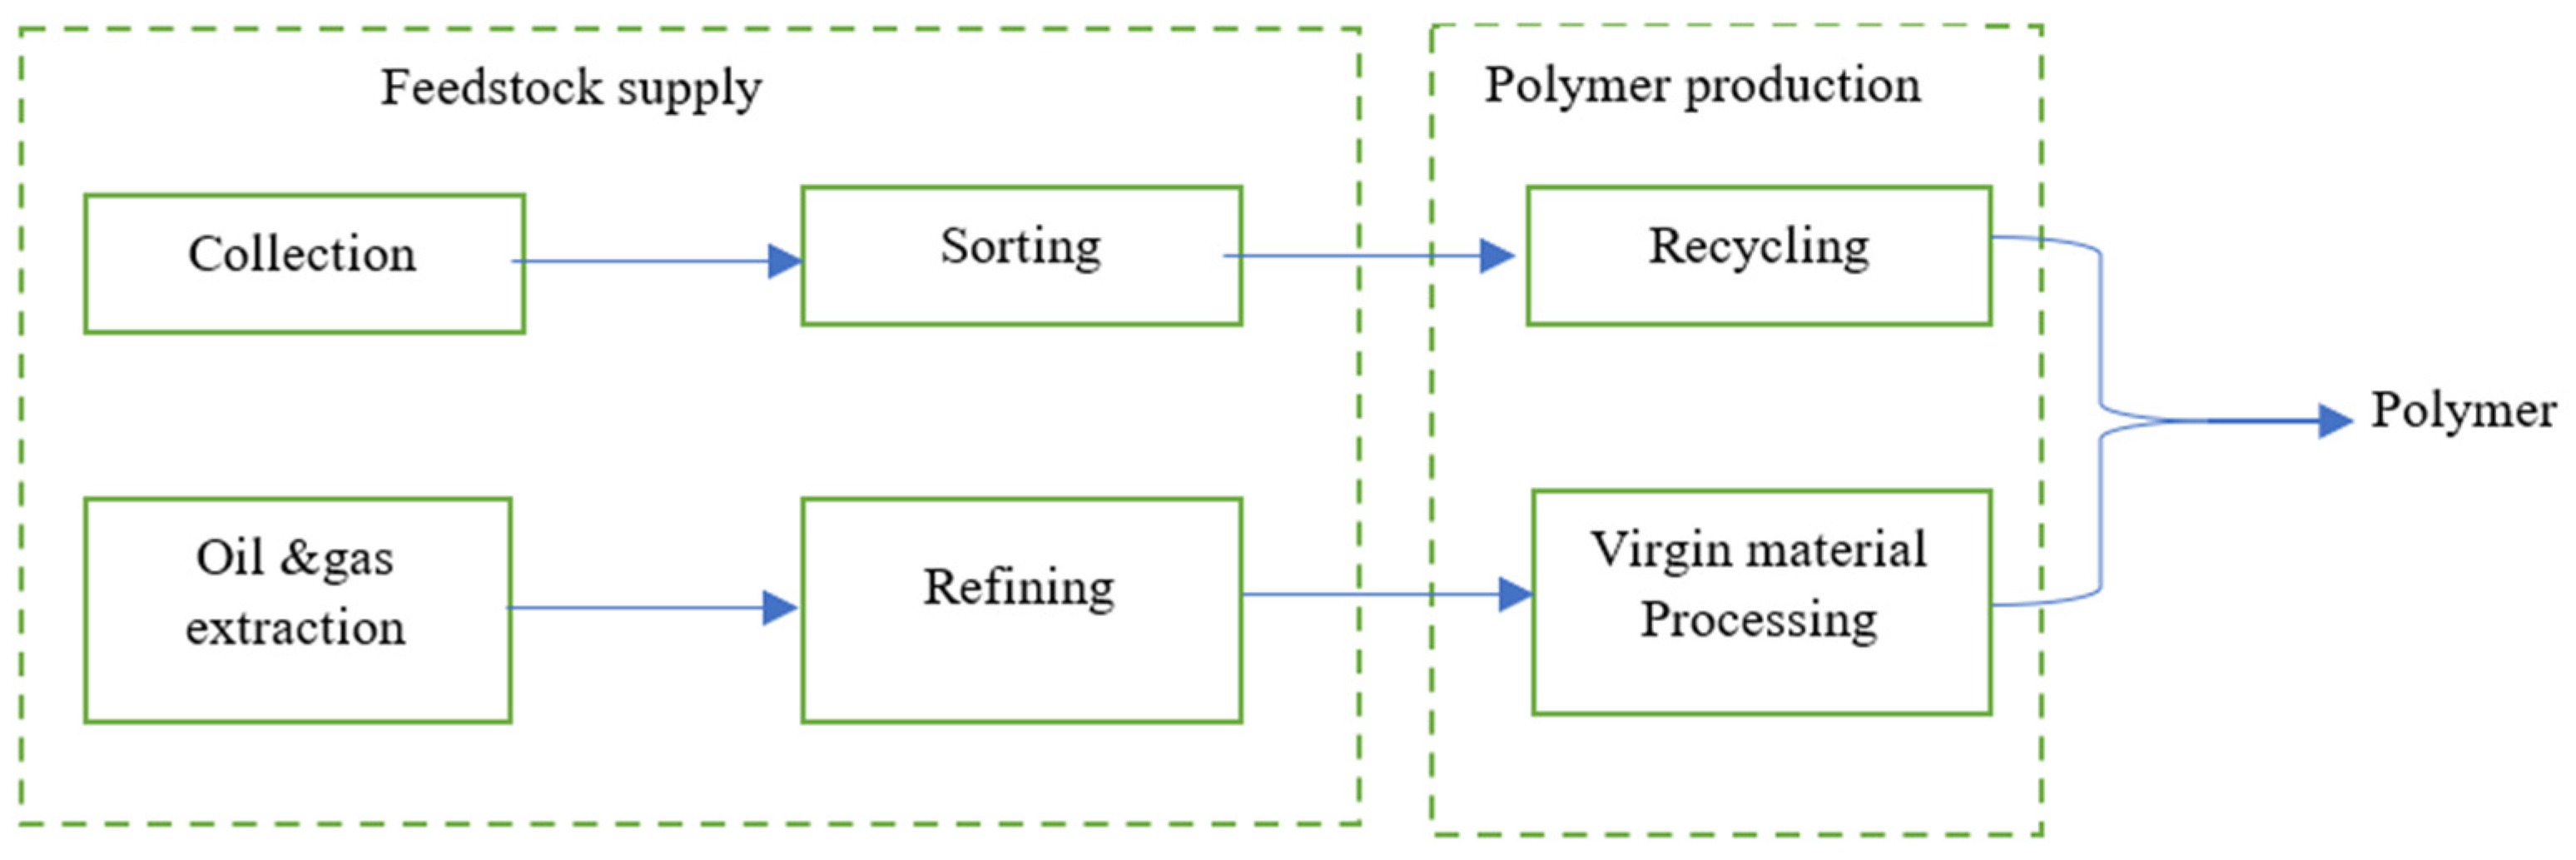
Figure 1. System boundary for recycled and virgin polymer production.
Sustainability 15 11529 g001
Figure 2. GHG emissions from different polymer types at the production and conversion stages.
Sustainability 15 11529 g002
Figure 3. GHG emission from each life cycle stage of polymer production, conversion, and end-of-life. Note: Conversion is a process to convert a virgin material to usable plastics, while recycling is producing the same or another product using the already used plastics.
Sustainability 15 11529 g003
Figure 4. GHG emission from life cycle stages of polymer production, conversion, and end-of-life projected to 2040.
Sustainability 15 11529 g004
Figure 5. Microplastics emission during mechanical recycling (all the values are in number of particles per year).
Sustainability 15 11529 g005
Figure 6. Resource depletion savings by polymer type.
Sustainability 15 11529 g006
Table 1. Datasets used in representing polymer recycling, recycling rate, sorting rates, and virgin substitution factors assumed.
Polymer TypeRecycling DatasetRate of SortingRate of RecyclingSubstitution Factor
PETEF91%12%0.9
HDPEEI91%12%0.9
LDPEEF73%12%0.75
PPEF79%12%0.9
PSEF65%12%0.9
Note: EI—eecoinvent. EF—environmental footprint.
Table 2. Polymer production and waste generation data [32].
Polymer TypePrimary Plastic Production (Mt)Waste Generated (Mt)
PE3332
HDPE5240
PP6855
PS2517
LDPE6457
Total242201
Disclaimer/Publisher’s Note: The statements, opinions and data contained in all publications are solely those of the individual author(s) and contributor(s) and not of MDPI and/or the editor(s). MDPI and/or the editor(s) disclaim responsibility for any injury to people or property resulting from any ideas, methods, instructions or products referred to in the content.