Article

Data Mining Technology and Its Applications in Coal and Gas Outburst Prediction

School of Energy Science and Engineering, Henan Polytechnic University, Jiaozuo 454000, China
*
Author to whom correspondence should be addressed.
Sustainability 2023, 15(15), 11523; https://doi.org/10.3390/su151511523
Submission received: 26 June 2023 / Revised: 18 July 2023 / Accepted: 21 July 2023 / Published: 25 July 2023

Abstract

:
Coal and gas outburst accidents seriously threaten mine production safety. To further improve the scientific accuracy of coal and gas outburst risk prediction, a system software (V1.2.0) was developed based on the C/S architecture, Visual Basic development language, and SQL Server 2000 database. The statistical process control (SPC) method and logistic regression analyses were used to assess and develop the critical value of outburst risk for a single index, such as the S value of drill cuttings and the K1 value of the desorption index. A multivariate information coupling analysis was performed to explore the interrelation of the outburst warning, and the prediction equation of the outburst risk was obtained on this basis. Finally, the SPC and logistic regression analysis methods were used for typical mines. The results showed that the SPC method accurately determined the sensitivity value of a single index for each borehole depth, and the accuracy of the logistic regression method was 94.7%. These methods are therefore useful for the timely detection of outburst hazards during the mining process.

1. Introduction

In recent years, new energy industries such as nuclear energy, wind energy, and solar energy have developed rapidly, and China’s energy system has shown a diversified development trend. However, as the pillar of China’s energy system, coal resources have advantages such as maturity, reliability, and low price, and play an important role in the sustainable development of China’s national economy. Therefore, coal mine safety plays an important role in the sustainable development of China’s economy. In the process of coal mining, various natural risks threaten the safety of coal mine production, such as fire [1,2], partial or complete collapse of the mine roof [3], and coal and gas outbursts [4,5,6]. Different geological structure conditions also affect the safety of coal mine production [7]. Coal and gas outbursts, as one of the hazards in the process of coal mining, refer to sudden movements of coal and gas during underground mining operations in coal mines, which are accompanied by a dynamic sound phenomenon and violent force effects [8].
Coal and gas outbursts are affected by factors such as in-ground stress, gas, and the mechanical properties of coal. Currently, there are mainly two hypotheses for the mechanism of coal and gas outbursts, namely, the “energy” theory and the “uneven stress distribution” theory. The former believes that the occurrence of coal outbursts is due to the sudden release of energy, and that the elastic energy of coal mass accumulation can make the coal mass broken. High gas can throw out broken coal. The latter hypothesis believes that the geological structure causes uneven stress distribution in the surrounding rock of the coal seam, leading to stress release in the surrounding rock and thus causing the destruction of the coal mass. The duration of coal and gas outbursts from occurrence to completion is very short; however, their destructive capacity is very large and can damage the coal wall and working equipment of the mining face.
China is the country with the most serious outbursts. The earliest outburst recorded in China occurred on 20 November 1939, when the coal quantity of the Fuguo 2 well of the Source Mining Bureau was 7 tons. The largest outburst in China occurred in the Sanhui Mining area of Chongqing Tianfu Mining Bureau on 8 August 1975, with 12,780 tons of coal and rock outburst and 140,000 m3 of gas outburst. More than 11,000 coal and gas outbursts have been recorded in Ukrainian coal mines; a typical example is the coal and gas outburst accident that occurred at the Yu. A. Gagarin mine in Donetsk in 1969. The coal and gas volume reached 14,500 tons, the outburst time was 32 s, and the speed reached tens of meters per second [9,10,11].
To ensure the safe production of mines and improve economic benefits, it is necessary to effectively prevent outbursts, and the prediction of outburst risk is the premise of outburst prevention. This is a crucial problem in the field of mine safety, and research on reliable means and methods to achieve accurate predictions of outburst risk is the key basis for the effective prevention and control of outburst disasters and the efficient development and utilization of gas resources. Data mining technology can help decision-makers analyze historical and current data and discover hidden relationships and patterns. Furthermore, it can predict possible behavior in the future, analyze the information of the breeding, preparation, and occurrence process of coal and gas outbursts, and apply it to the prediction of outburst risk. Therefore, data mining technology is of great significance for improving the accuracy of outburst risk prediction and reducing the occurrence of accidents [12].
In recent years, many scholars have conducted research on the prediction of coal and gas outbursts and proposed many prediction methods, which can be divided into single-index and multiple-information coupling methods [13,14]. The single-index method compares the value of a selected single index with the set critical value of coal and gas outbursts to determine whether accidents will occur [15]. The single-index method can easily predict coal and gas outbursts; however, its prediction accuracy is poor, and the critical value of the prediction index is difficult to determine. In each mine investigated, the most commonly used prediction methods are the number of drilling cuttings [16], initial gas emissions [17], initial gas desorption characteristics [15], debris index [18], and gas desorption index [19]. The outburst risk can be determined by collecting and comparing the corresponding indices during drilling operations. However, in the statistics of outburst accidents, situations are often found where the prediction of a single index did not indicate an outburst, but the actual occurrence was an outburst. Therefore, the selection of the outburst prediction Index and its sensitivity requires further investigation and analysis. Coal and gas outbursts are complex dynamic phenomena that are affected by many factors. Therefore, the prediction of coal and gas outbursts using multivariate information coupling methods has gradually attracted the attention of scholars [20].
The multiple-information coupling prediction method refers to the selection of multiple indexes for analysis. To understand the relationships between the various factors affecting coal and gas outbursts, many scholars have constructed different prediction models using approaches such as multiple regression analysis [21], attribute mathematics [22], extension theory [14], and structural equations [23]. Zheng et al. [24] studied the parameter optimization of eXtreme Gradient Boosting (XGBoost) based on a grid search and metaheuristic algorithm, and the optimized parameter combination achieved 100% prediction accuracy for outbursts in the test process. Liu et al. [25] proposed a least-squares support vector machine (LSSVM) to establish a prediction model and introduced an improved particle swarm optimization (IPSO) algorithm, where the relative error of the established model was less than 2.7%. Wu et al. [26] combined the IPOS algorithm with the IPSO-Powell algorithm to optimize support vector machine (SVM) coal and gas outburst prediction algorithms. Wang et al. [14] built an outburst risk prediction system and a risk grade index value system based on extension theory. Shu et al. [27] established the initial conditions of an outburst from the perspective of mechanics and energy, and proposed a key structural model of an outburst through the analysis of its spatial geological structure. Ru et al. [28] used a correlation coefficient to fill in missing data, identified abnormal data based on the Pauta criterion, and used a random forest model to predict coal and gas outbursts. Although the multiple-information coupling prediction model has gradually become a mainstream research direction, it still has some limitations, such as the need for a large amount of sample data optimization and slow calculation speed.
Based on domestic and foreign research on coal and gas outburst prediction and considering the advantages and disadvantages of existing forecasting methods, this study used the statistical process control (SPC) method to determine the critical value of sensitivity indexes, and the outburst dynamic phenomenon was transformed into a logistic regression method for the joint analysis of each single index and outburst dynamic phenomena. Finally, stress prediction of coal and gas outbursts in typical mines was carried out using the SPC method and logistic regression analysis.

2. Prediction of Coal and Gas Outburst by Data Mining Technology

2.1. Determination of the Critical Value of Sensitivity Indexes

In the process of mathematical statistics, each sensitivity index can be regarded as not causing dangerous harm to production within a certain numerical distribution range, whereas abnormal data outside this distribution range can cause danger in the future. Therefore, determining this distribution interval is an important means of investigating sensitivity index values.
In the process of investigating and judging an existing single index and then forecasting the risk, if the single index exceeds the scope of the usual inspection data, an outburst risk is considered to exist. “Anomalous data” are sifted to predict the likelihood of an accident. SPC of all data is required during the screening processes. SPC is widely used when manufacturing enterprises with similar processes perform product quality control [29].
The control chart was designed using a scientific method to measure, record, and control the quality of the process. The chart has a centerline (CL), upper control limit (UCL), lower control limit (LCL), and a tracing sequence of the values of the sample statistics drawn in chronological order (see Figure 1 for an example of the control chart).
In this study, μ ± 3σ was selected as the control range. The reason why 3σ was used to calculate the control line in SPC is closely related to the process capability index. The denominator of our process capability index formula was 3σ, and a control level of ± 3σ reached 99.73%, which fully met the requirements of the engineering site.

2.2. Prediction of Coal and Gas Outburst Risk with Multivariate Information Coupling

2.2.1. Deficiency of the Single-Index Method

In the actual outburst prediction work, it was found that the prediction of a single index was often targeted at a single work site during the detection process. However, most existing prediction works are based on drilling operations; that is, the construction of advanced drilling in front of the working face before drilling or mining, the analysis and inspection of the coal body in front, and the data characterizing the size of the risk. In the actual operation process, the selection of the drilling location is significantly affected by human factors, which are as follows:
(1)
Each borehole index is different. In the process of designing the drilling location, owing to the restrictions of the workplace or different experience levels of the practitioner, the drilling location can also be very different. Consequently, the index data obtained from each borehole in the construction are uneven and sometimes contradictory.
(2)
Problems with drilling construction quality. In the drilling operation process, whether advance drilling can reach a predetermined depth is greatly affected by the geological conditions of the coal mine and the working attitude of the employees. Sometimes, drilling cannot reach the predetermined depth; sometimes, drilling cannot be constructed according to the design angle, and the drilling deviation is very large. As a result, the coal sample is not representative and the risk ahead cannot be truly verified.
(3)
The range of the obtained forecasts is narrow. The prediction of outburst risk by the drilling operation method has a certain limitation: the stress state and gas occurrence in front of the working face change with the distance from the working face, and the drilling cannot reach a considerable depth and breadth.

2.2.2. Multiple-Information Coupling Prediction

Multiple information coupling means that in the actual outburst prediction process, not only a single index value is used to judge the outburst risk, but various other factors are also considered, such as geological factors, coal structure, burial depth, and various dynamic phenomena in the drilling process.
Outburst dynamic phenomena (such as coal bursts, gas fluctuations, gas anomalies, spray roofs, drill clamping, and sloughing slagging) reflect the overall coal seam gas situation, ground stress situation, and other information in the area near the working face. Therefore, the dynamic phenomenon reflects not a test point, but the outburst danger situation in the entire working area. Thus, an effective way to solve the deficiency of the prediction of a single index is using dynamic phenomena to assist in the prediction of outburst risk. However, in the actual recording process, the outburst dynamic phenomenon is based only on the judgment of the staff, and data recording is mostly qualitative. Qualitative indexes often present great difficulty in forecasting, and there is no unified standard for qualitative descriptions; hence, they are difficult to implement. Therefore, quantification of the outburst dynamic phenomenon is the primary problem when using this condition for forecasting.
Outburst intensity is an important index for characterizing the degree of harm caused by an outburst. Therefore, it is used to directly express the degree of danger of an outburst accident. For the risk coefficient T, we can collect the data on the relationship between coal mine outburst intensity and outburst omen nationwide. The risk coefficient T of the different outburst signs was obtained by normalizing the statistics. The normalization treatment is the value obtained by dividing the average outburst intensity corresponding to each type of outburst dynamic phenomenon by the sum of the average intensity of each type of outburst dynamic phenomenon.
To facilitate on-site operations, various outburst signs are divided into three categories: severe, moderate, and mild. Whether the outburst phenomenon belongs to the severe, moderate, or mild outburst grade needs to be determined by experienced workers. The severity level of the outburst is listed in Table 1 according to the different circumstances.
The severity level corresponds to the severity coefficient; when the severity level is severe, the severity coefficient is 2, and when the grade is moderate, the coefficient of severity is 1. In mild cases, the severity coefficient is 0.5.
Definition: The size of the outburst risk corresponding to different outburst dynamic phenomena is the degree of outburst risk D.
D = T y × ξ
where D is the degree of outburst risk corresponding to different outburst dynamic phenomena, Ty is the severity of the outburst consequences corresponding to different types of outburst dynamic phenomena, and  ξ  is the severity coefficient of the outburst dynamic phenomena.

2.2.3. Establishment of Logistic Regression Model

The method of joint analysis of each single index and the outburst dynamic phenomenon to judge the risk of an outburst is also called the point-and-surface combination method. Whether the outburst in front of the working face is a standard second-class assessment/second-class score prediction (i.e., outburst or not), judging its relationship with a single index and dynamic phenomena can be reduced to a second-class assessment regression analysis. In the process of determining the critical value of a single index, it has been proven that all the influencing indexes obey a normal distribution; therefore, regression analysis can be carried out using the common logistic regression analysis method of binary classification.
Logistic regression analysis was first proposed by the Belgian scholar P.F. Verhulst in 1838. Logistic regression refers to regression analysis with the secondary score or secondary evaluation as the dependent variable. The probability of a coal and gas outburst is an event that changes with the changes in each single index and outburst dynamic phenomenon, and its probability of occurrence is between 0 and 1. The logistic function and its properties are as follows.
The logistic function, also known as the growth function, is used for population estimation and prediction; its prototype is
p = L 1 + exp a + bt
where t is the time, p is the number of people at time t, L is the maximum limit value of p, and a and b are the relevant parameters. As a population-prediction function, p is always positive. According to the requirements of the nonlinear probability model, it is necessary to replace p with the probability p = p (y = 1) and change the upper limit L to 1. Thus, the range of probabilities is limited to a reasonable range between 0 and 1. We obtain the logistic probability function, defined as
p = 1 1 + exp a + b x = 1 1 + exp b a b x .
This formula highlights two useful parameters. The first is b, and the second is minus a/b. From this function, the following can be observed.
(1)
When b is positive, the logistic function increases monotonically as x increases. When b is negative, the logistic function decreases monotonically as x increases. Therefore, b reflects the correspondence between the independent variable x and the probability function. Similar to determining the direction of action of the independent variable using the sign of the regression coefficient in multiple linear regression analysis, b also represents the direction of action of the independent variable in the logistic probability function.
(2)
a/b is actually the center of the curve, at which point the probability function takes a value of 0.5, which is half the interval between the values of the probability function. The function takes the inflection point (−a/b, 0.5) as the center of symmetry, where the rate of change of the curve is the largest; the farther away from this point, the smaller the rate of change of the curve when approaching the upper or lower limit of the function, and the rate of change of the curve is close to zero.
(3)
The greater the absolute value of b, the faster the curve rises or falls to the middle. This implies that the major changes are compressed in the vicinity of the corresponding inflection points on the X-axis.
When there is more than one independent variable, with a linear combination a + b1 × 1 + b2 × 2 + … bk × k, and assuming z, the logistic function can be expressed as
p = 1 1 + exp b i x i = 1 1 + exp z .
Further deformation of it is obtained as follows:
p = exp z 1 + exp z .
This is a common expression for the logistic function. This expression is further transformed into
ln p 1 p = z = b i x i .
That is, the probability of an event expressed as a nonlinear independent variable can be transformed into a function of the probability of an event expressed as a linear independent variable. In the above linear expression, various functions related to the probability of events are named and defined as follows:
  • Probability of event occurrence: p = p (y = 1).
  • Probability of the event not occurring: 1 − p = (y = 0).
  • Odds: p/(1 − p) =  Ω .
The occurrence ratio in the above formula, also known as relative risk, is the ratio between the probability of occurrence and the probability of non-occurrence. An occurrence ratio greater than one indicates that the occurrence probability of an accident is greater than 50%; the larger the occurrence ratio, the higher the risk.
In logistic regression, we assume that the relationship between the probability of event occurrence and the independent variable follows a logistic function distribution. This effectively limits the range of the regressive dependent variable to between 0 and 1, and changes continuously as the combined value z of the independent variable changes.

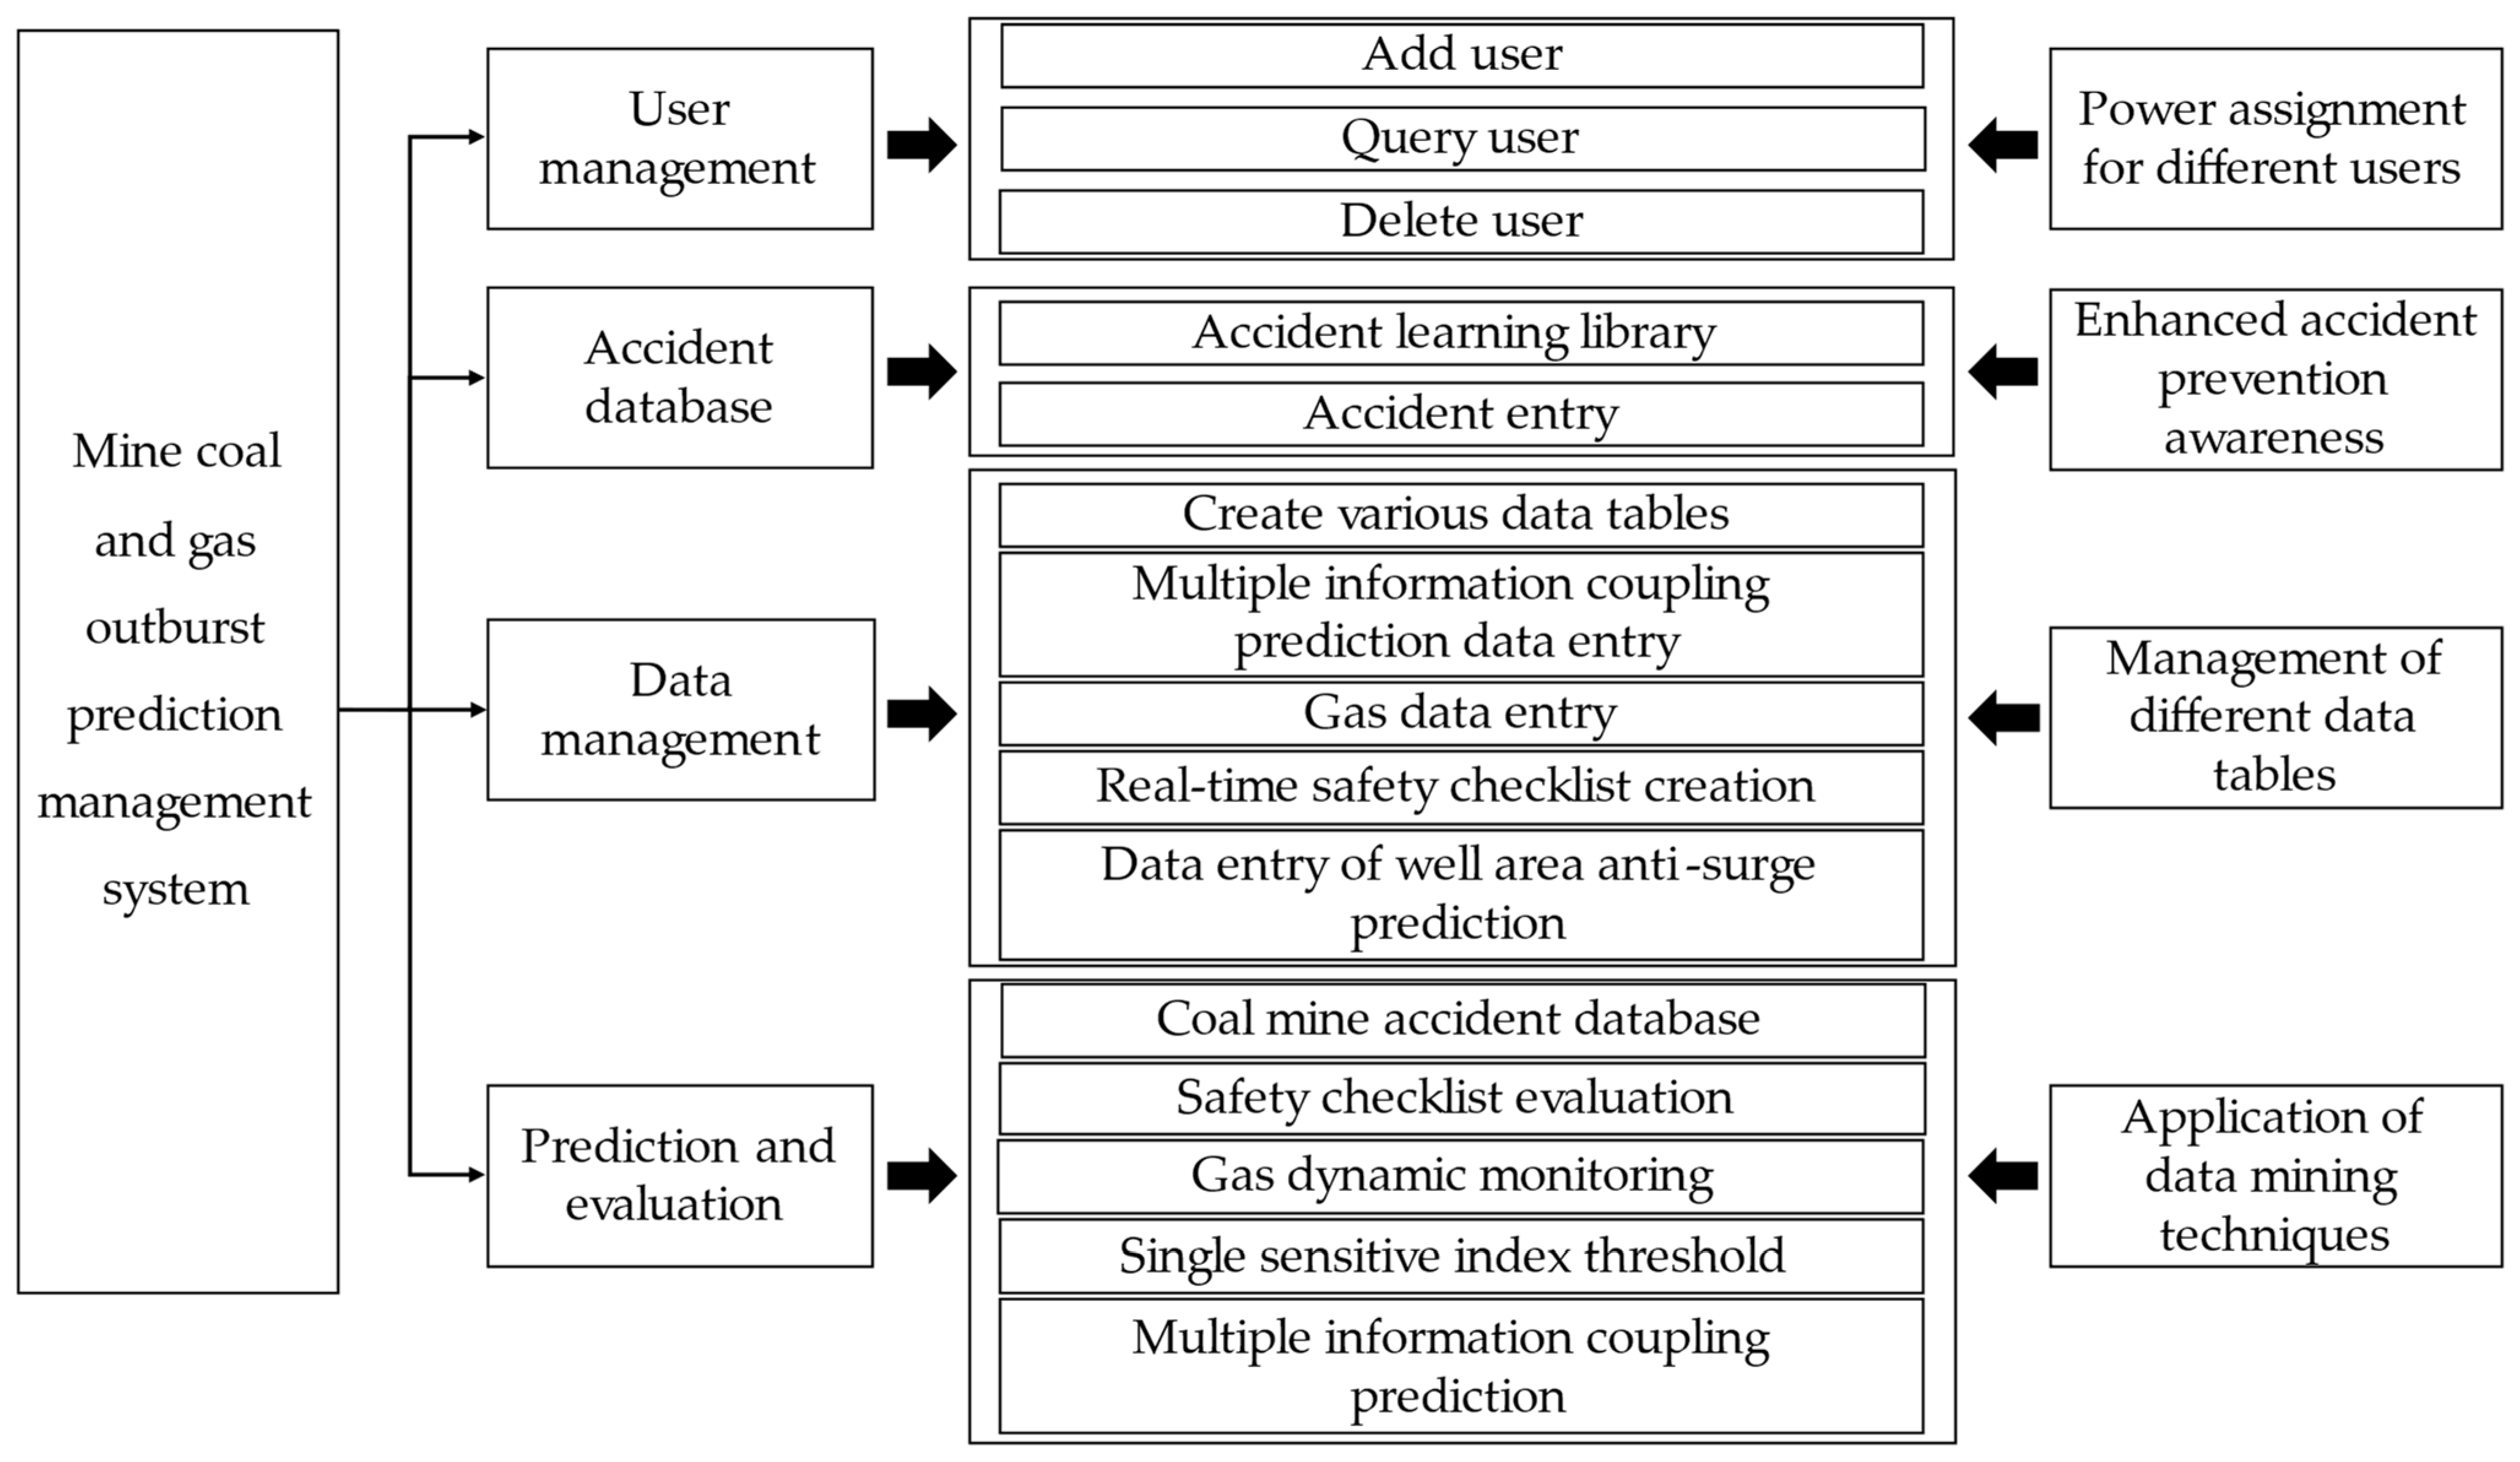
2.3. Realization of the System Software Function

In this study, software (V1.2.0) development was based on the C/S architecture, Visual Basic development language, and SQL Server 2000 database. System functions included user management, accident database, data management, and prediction and evaluation. Among the prediction and evaluation functions, the SPC control chart method was used to limit the critical value of a single sensitivity index, and logistic regression analysis was used to couple the single sensitivity value index with the dynamic outburst phenomena to predict coal and gas outbursts. A functional diagram of the system software is shown in Figure 2.

3. Application of Data Mining Technology in a Typical Mine

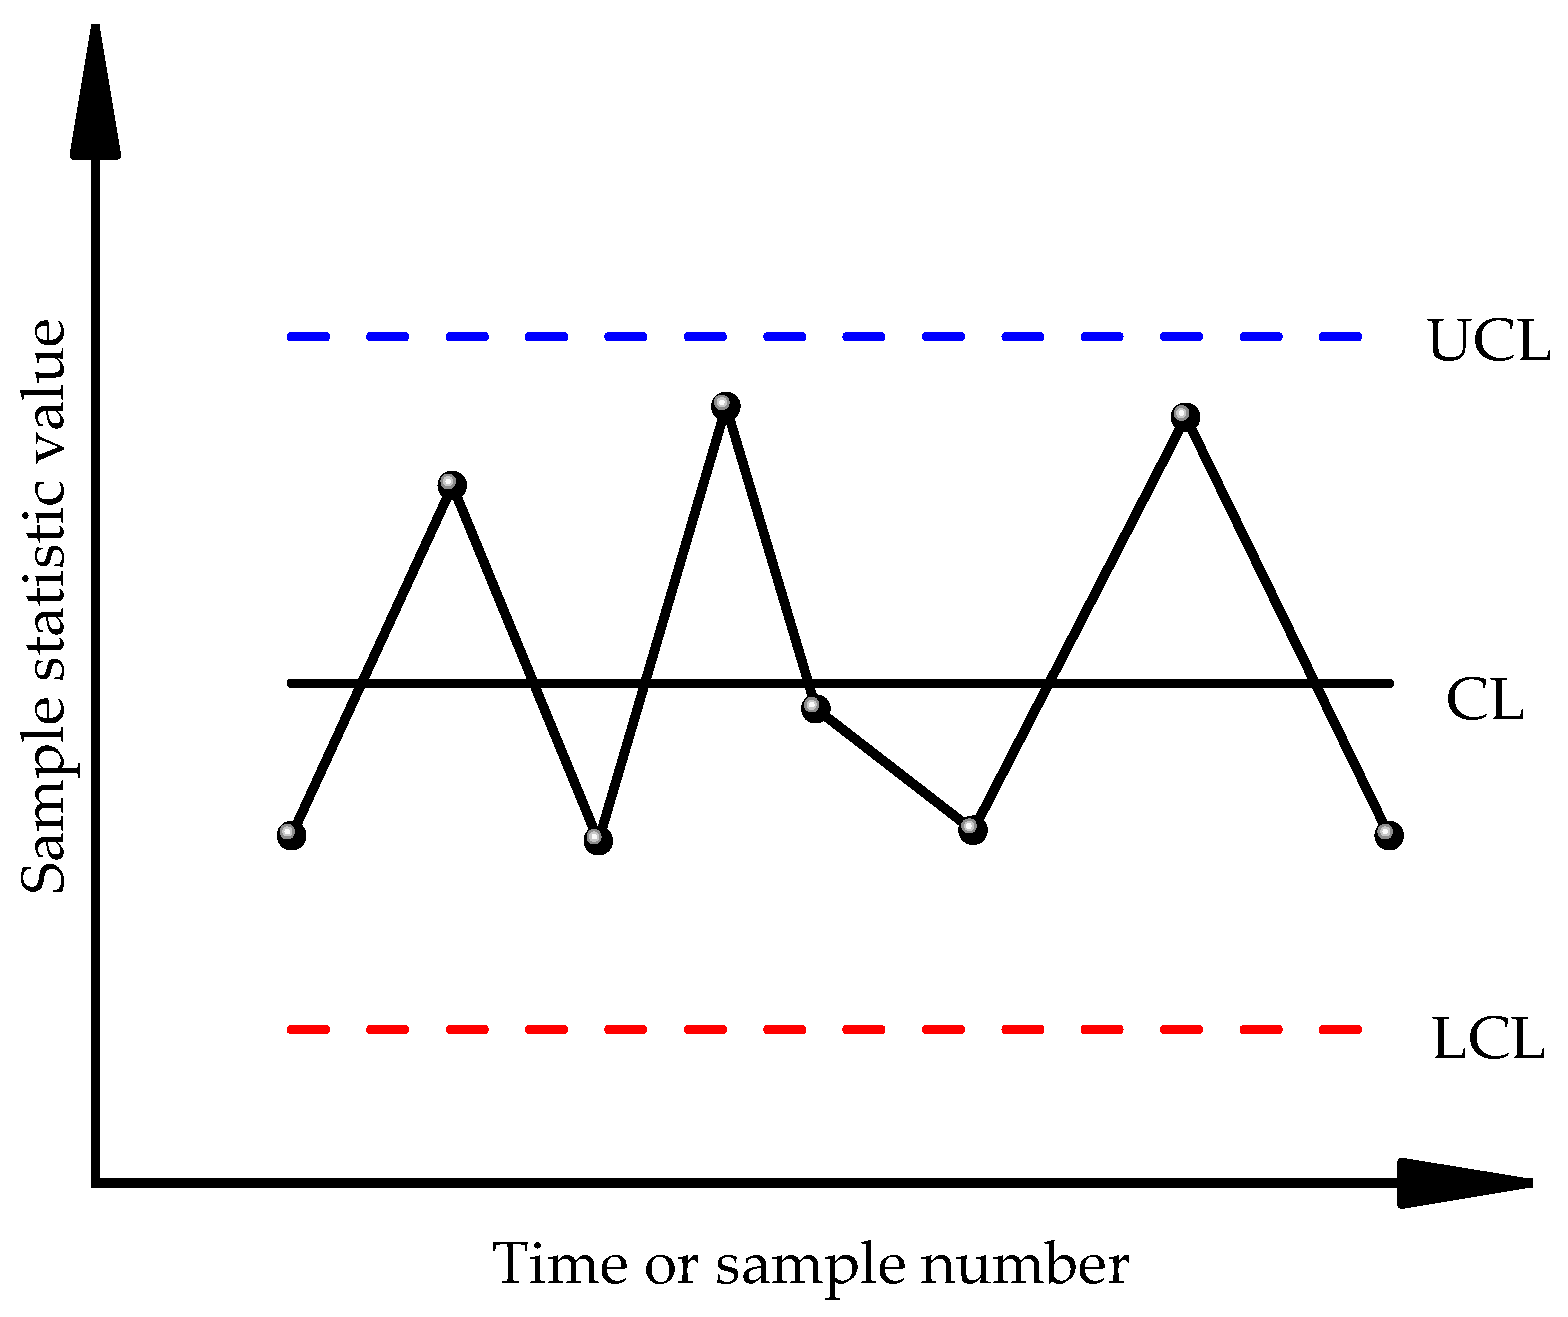
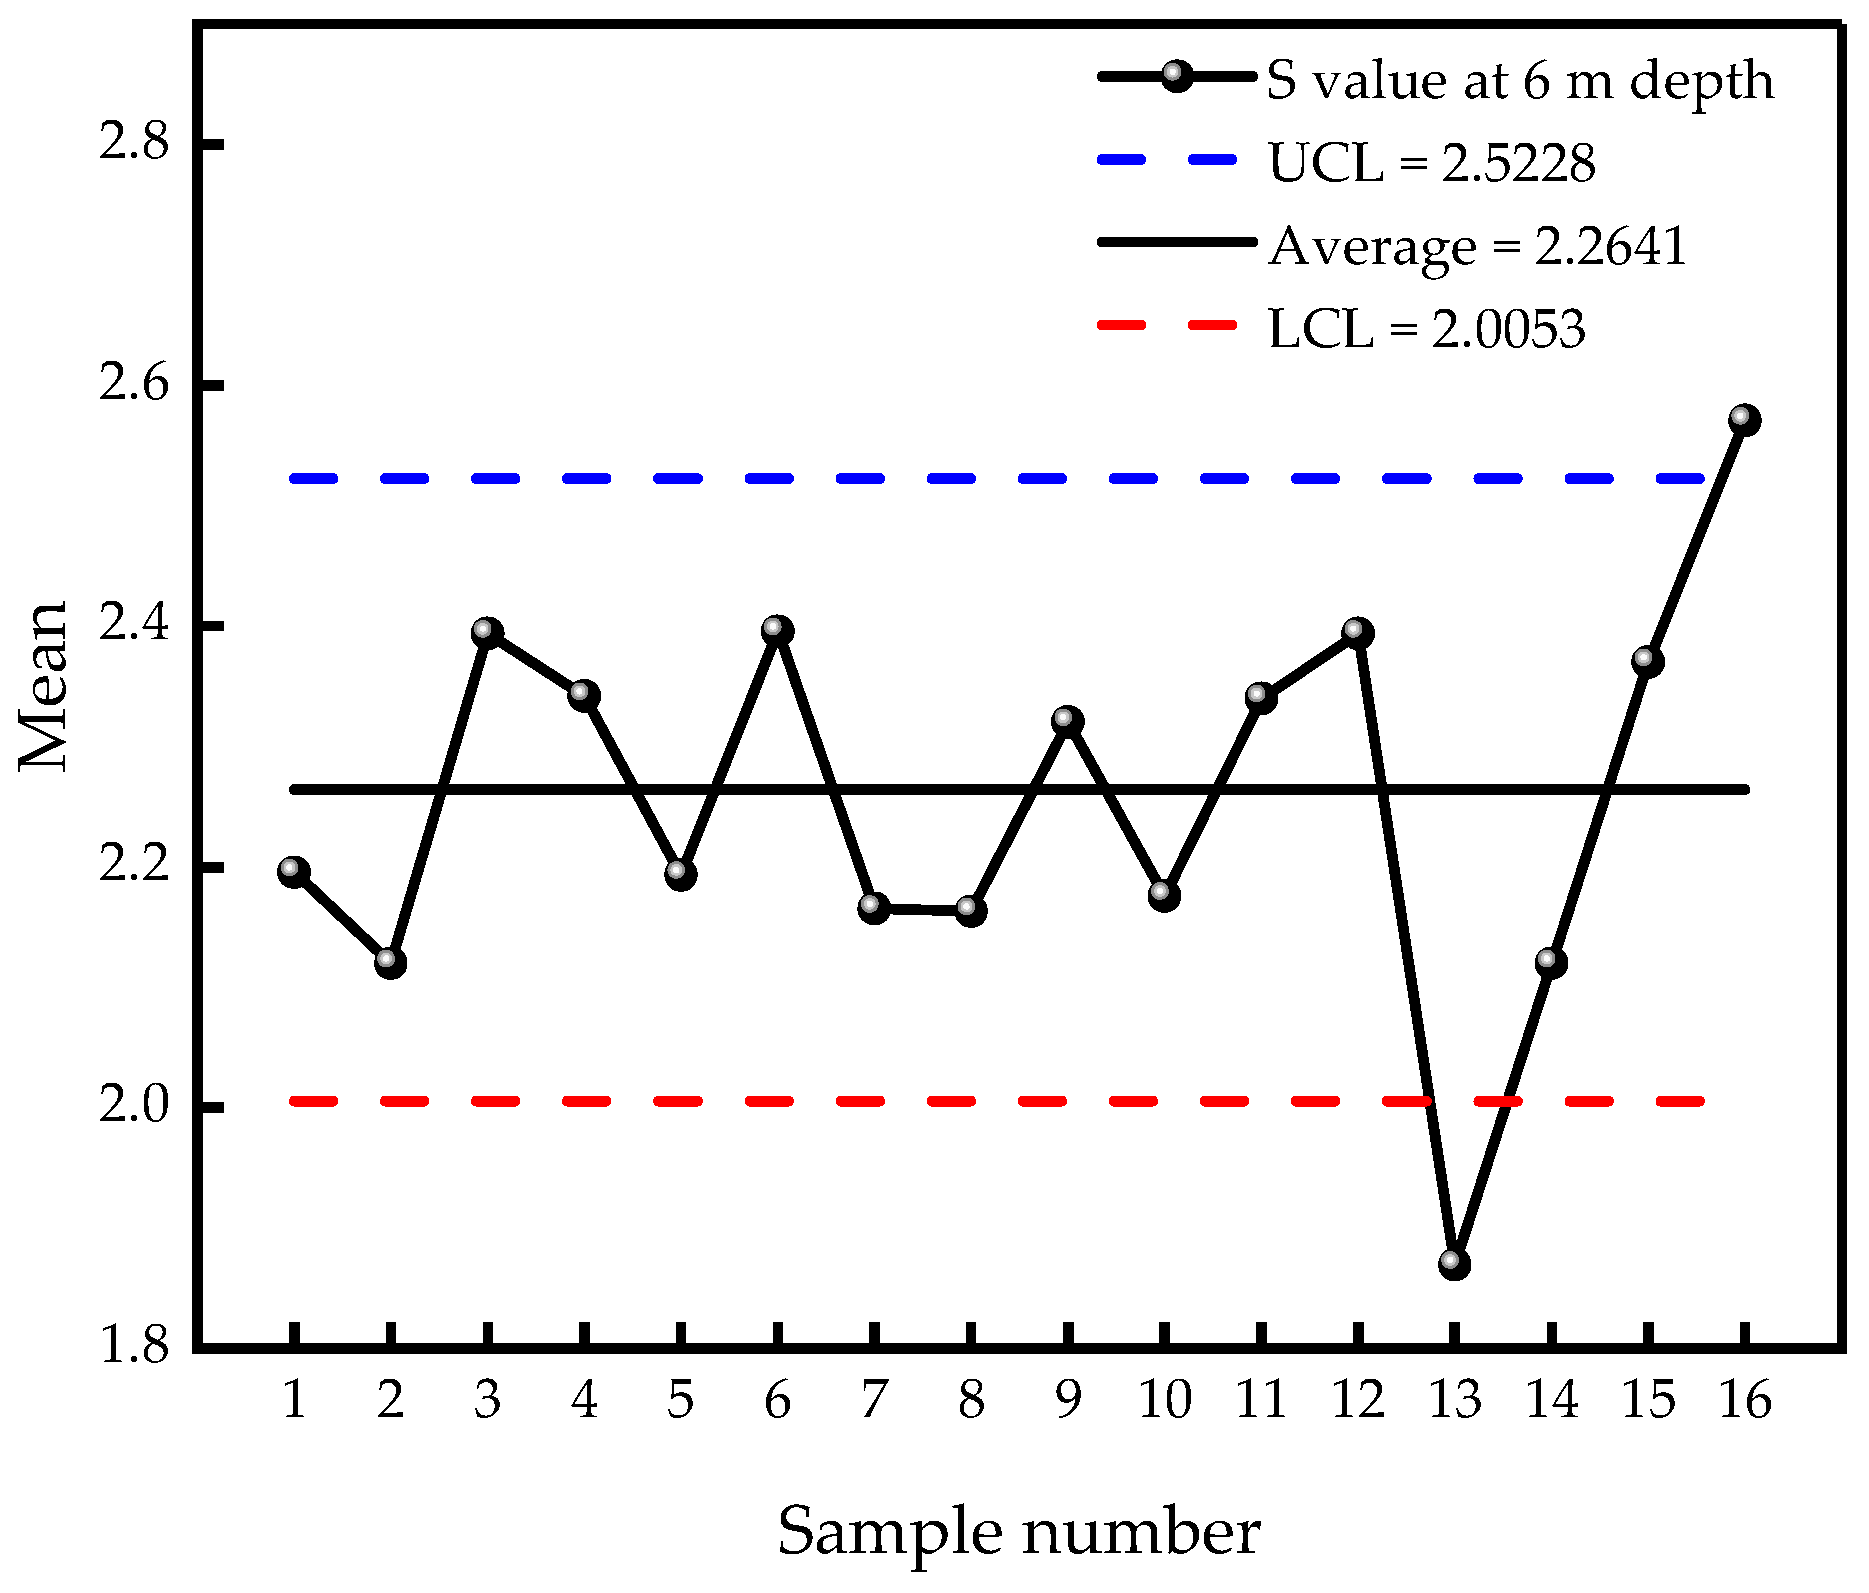
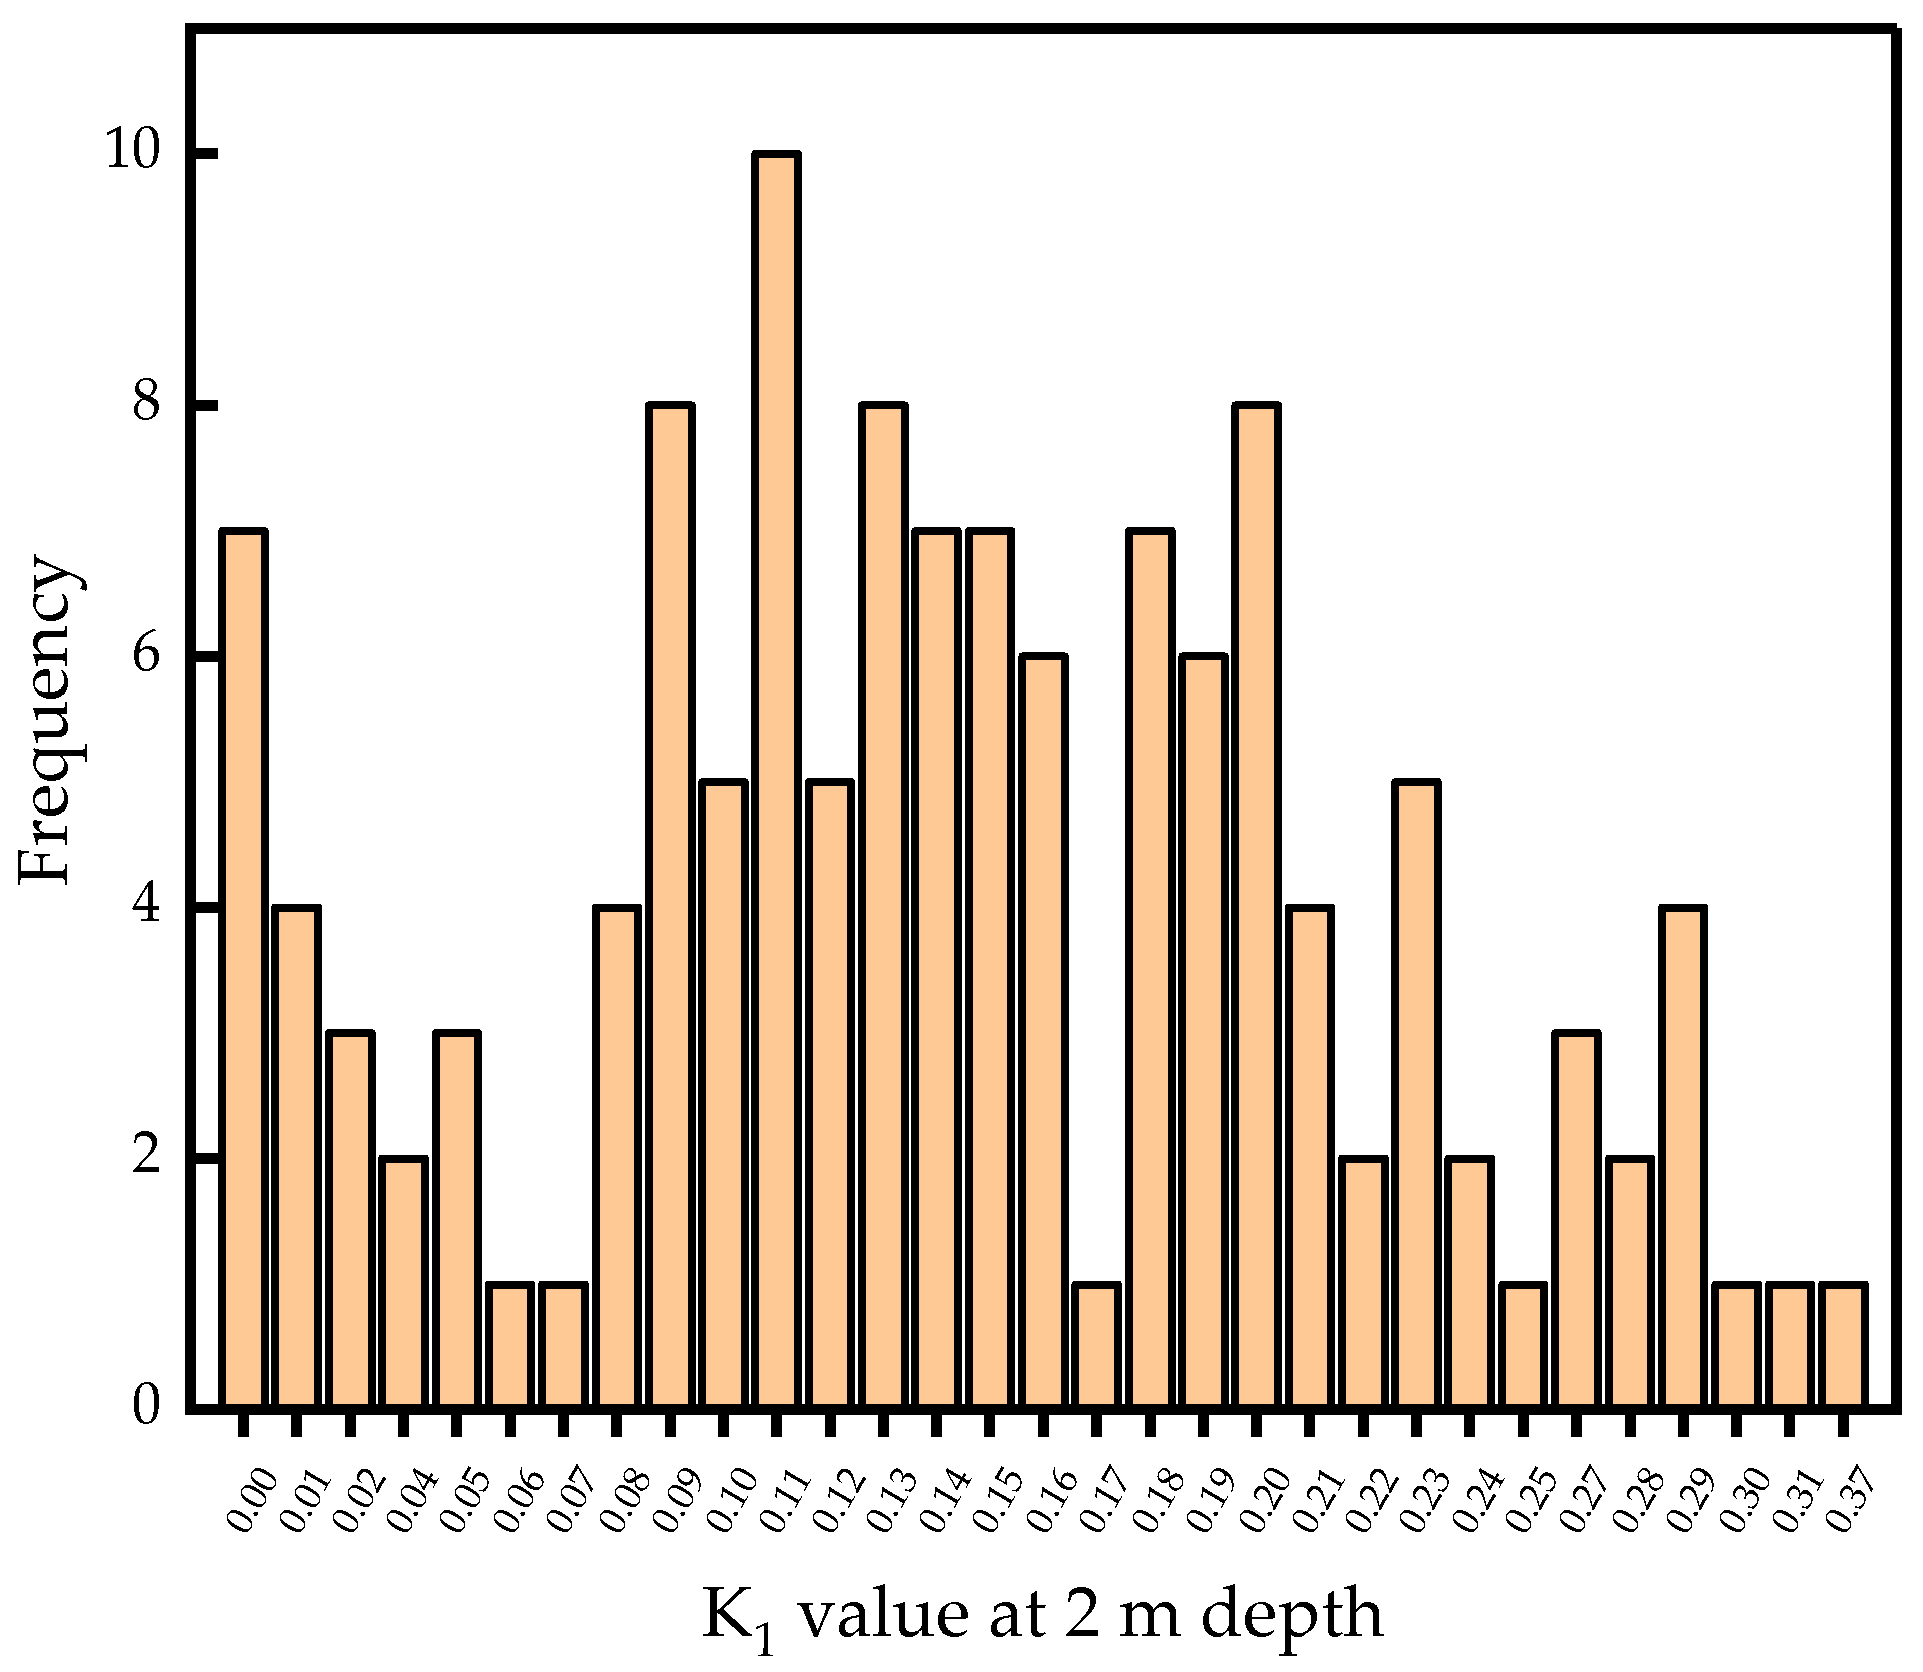
3.1. Statistical Process Control Method for Determining the Critical Value of a Single Index

The upper control limit of each index under a normal distribution was obtained by drawing an SPC control chart for each index. The acquisition of the upper control limit can help the staff of the relevant departments analyze the measured data to determine the outburst risk in front of the working face. The Sihe mine in Jincheng City, Shanxi Province, was selected as the experimental site for investigation and analysis.
The Sihe mine is located in the southeast edge of Qinshui coal field, and the industrial site is located in Yinzhuang village, Jiafeng Town, Qinshui County, approximately 70 km away from Jincheng City. The Sihe mine is a typical high-gas mine with a production capacity of 10.8 million t/a. The recoverable coal seams in the whole field are 5 layers with a total thickness of 12.1 m. Among them, the average coal thickness of the main mining seam is 6.42 m, the average coal seam inclination angle is 5°, the structure is simple, the mining conditions are good. The main inclined shaft of the mine has an inclination angle of 16° and an inclination length of 763.5 m, the west main inclined shaft has an inclination angle of 16° and an inclination length of 981.1 m, and the auxiliary inclined shaft has an inclination angle of 19° and an inclination length of 575.44 m. The mine design was based on an inclined-shaft panel area development mode and comprehensive mechanized mining. The predicted outburst risk work of the Sihe mine primarily adopts the drilling operation method. In the implementation process, the value of the cuttings quantity index S of the coal samples at different drilling depths and the value of the initial gas emission velocity K1 of the coal samples were investigated as the judgment indices of the coal outburst risk in front of the working face.
As shown in Figure 3, Figure 4, Figure 5, Figure 6, Figure 7, Figure 8, Figure 9, Figure 10, Figure 11, Figure 12, Figure 13, Figure 14, Figure 15, Figure 16, Figure 17 and Figure 18, Figure 3, Figure 5, Figure 7 and Figure 9 are the control chart of the drilling cuttings amount S value of the coal sample when the drilling depth is 2 m, 4 m, 6 m, and 8 m respectively; Figure 4, Figure 6, Figure 8 and Figure 10 are the frequency distribution chart of the drilling cuttings amount S value of the coal sample when the drilling depth is 2 m, 4 m, 6 m, and 8 m respectively. Figure 11, Figure 13, Figure 15 and Figure 17 respectively show the control chart of the value of the initial gas emission velocity K1 of the coal samples when the drilling depth is 2 m, 4 m, 6 m, and 8 m; Figure 12, Figure 14, Figure 16 and Figure 18 respectively show the frequency distribution chart of the value of the initial gas emission velocity K1 of the coal samples when the drilling depth is 2 m, 4 m, 6 m, and 8 m. As shown in Figure 3, Figure 5, Figure 7, Figure 9, Figure 11, Figure 13, Figure 15 and Figure 17, the control upper limits of S value of drilling cuttings and K1 value of initial gas emission velocity in coal samples can be obtained at different drilling depths.
It can be observed from Table 2 that with an increase in the drilling depth, the S and K1 values both show a trend of first increasing and then decreasing, which is related to the stress state in front of the working face and is also a verification of this theory. According to the SPC control chart and frequency distribution analysis of the above data, the control upper limit of a single index obtained from the control chart has a certain representativeness and reference and can be defined as the sensitivity value of a single index. When each index exceeds the corresponding control limit during the actual driving process, it is necessary to increase vigilance and implement appropriate measures to prevent outbursts. During the process, the statistical upper limit index is obtained using the SPC control chart method, and the risk degree of each drilling depth is deeply understood, which changes the situation in which a critical value covers all drilling depths.

3.2. Application of Logistic Regression Analysis in Multivariate Information Coupling Prediction

3.2.1. Determination of Investigation Methods

For the field application of the logistic regression analysis method, the Sanhui 1 mine of Chongqing Tianfu Mining Group was selected, and the Sanhui 3 mine was used as the experimental site for inspection. Sanhui mine is a typical outburst mine. In the shaft field of the Sanhui 1 mine, 680 m south of the 8# exploration line is above the level of +590 m, and no protective layer K4 is recoverable in the area of 2150 m north. The dip angle of coal seam in the south area of the 8# exploration line is 20°~25°, and that of the north area is 28°~35°. The K1 coal seam has a medium thickness with an average thickness of 2.74 m. The K1, K3, K4, and K6 coal seams are mined from bottom to top in the Sanhui 3 coal mine, and all the coal seams have an outburst risk. The original gas content of coal seams is 14.45 m3/t for the K1 coal seam, 11.02 m3/t for the K3 coal seam, 21.09 m3/t for the K4 coal seam, and 11.5703 m3/t for the K6 coal seam. The gas pressures of the coal seams are 4.7~8.7 MPa for the K1 coal seam, 3.0 MPa for the K3 coal seam, and 2.44 MPa for the K4 coal seam.
Investigation and analysis of the calculation results are important for judging whether the calculation method conforms to reality. In the actual drilling process of a mine, if a dynamic phenomenon occurs, it is considered to pose an outburst risk. However, when a single index is used to make the outburst prediction, it often appears that the value of the single index does not exceed the standard, and there is a dynamic phenomenon. The SPC control chart method is used to control the upper limit of a single index, and the control upper limit obtained has improved this situation to a certain extent; however, it still does not completely eliminate this phenomenon. Therefore, the results obtained from the investigation of multiple pieces of information, the results of the investigation of a single index, and the risk of the reaction of the outburst dynamic phenomena were compared and analyzed. The risk of outburst needs to be judged.
The “three rate” method is used to analyze the outburst prediction data according to the prediction outburst rate, the prediction outburst accuracy rate, and the prediction non-outburst accuracy rate, so as to determine the outburst sensitivity index. The effect test predicts the outburst risk again after the implementation of the outburst prevention measures and uses the same index to judge whether the outburst prevention measures are effective. In the event of an outburst during the prediction process, the sensitivity index and its critical value can be determined according to the following “three rates”:
(1)
The prediction outburst rate
η 1 = 100 n t N
where  η 1  is the predicted outburst rate (%); nt is the number of predicted outburst hazards (times); and N is the total number of predicted outburst hazards (times).
(2)
The prediction outburst accuracy rate
η 2 = 100 n A n t
where  η 2  is the prediction outburst accuracy (%); and nA is the number of times in which there is actually an outburst hazard among the predicted times with outburst risk.
(3)
The prediction non-outburst accuracy rate.
η 3 = 100 n B n C
where  η 3  is the prediction accuracy rate without outburst (%); nB is the predicted number of times without outburst risk (times); and nC is the number of times in which there is actually no outburst hazard among the predicted times without outburst risk.

3.2.2. Effect Investigation and Analysis

The data used for the investigation were from the 21201 transportation lane of Sanhui 1 mine and 6402 of Sanhui 3 mine. The multivariate information coupling prediction method was used for regression analysis, and the multivariate information analysis function in the system function was used for regression probability calculation.
The results of the regression prediction were investigated and analyzed according to the three-rate method, and the corresponding results are presented in Table 3.
The actual number of outbursts refers to the actual outburst risk judged in the drilling process, as presented in the table above. In terms of the predicted coincidence of outburst times, the number of outburst times predicted by the K1 value is 22 times, the number of outburst times predicted by the S value is only 3 times, and the number of outburst risk predicted by multiple regression is 21 times, while the number of outburst risk times in the actual drilling process is 21 times. It can be observed that the number of outbursts predicted by multiple information regression is the best, and the result predicted by the drilling chip amount S value is the worst. When the coupling analysis of the single index and outburst dynamic phenomenon was carried out via logistic analysis, the accuracy of protrusion prediction by the single-index method increased from 77.27% to 94.7% based on the K1 value. With respect to the non-outburst prediction accuracy, the results of using multiple regression prediction increased, reaching 99.04%. It can be observed that the multivariate information coupling prediction analysis using a single index combined with the outburst dynamic phenomenon has a greater improvement in accuracy than the single-index method. When the prediction probability of this time is greater than 50%, as calculated by the danger degree calculation formula obtained by the logistic method, it is judged that there is a risk of outburst in the front, and corresponding measures should be taken to prevent dynamic phenomena in the drilling process in the next stage to avoid the occurrence of outburst accidents.

4. Conclusions

In order to ensure the sustainable mining of coal resources in the outburst mine, it is necessary to continuously predict the coal and gas outburst during the mining process, so as to ensure the safe production of the outburst mine. Based on the shortcomings of the existing coal and gas outburst prediction methods, combined with the relevant characteristics of data mining technology, through the use of computer technology and the network architecture of coal mining enterprises, the paper realizes the application of relevant data management and data mining technology to the coal and gas outburst prediction work. Through comparative effect analysis, the following conclusions are obtained:
(1)
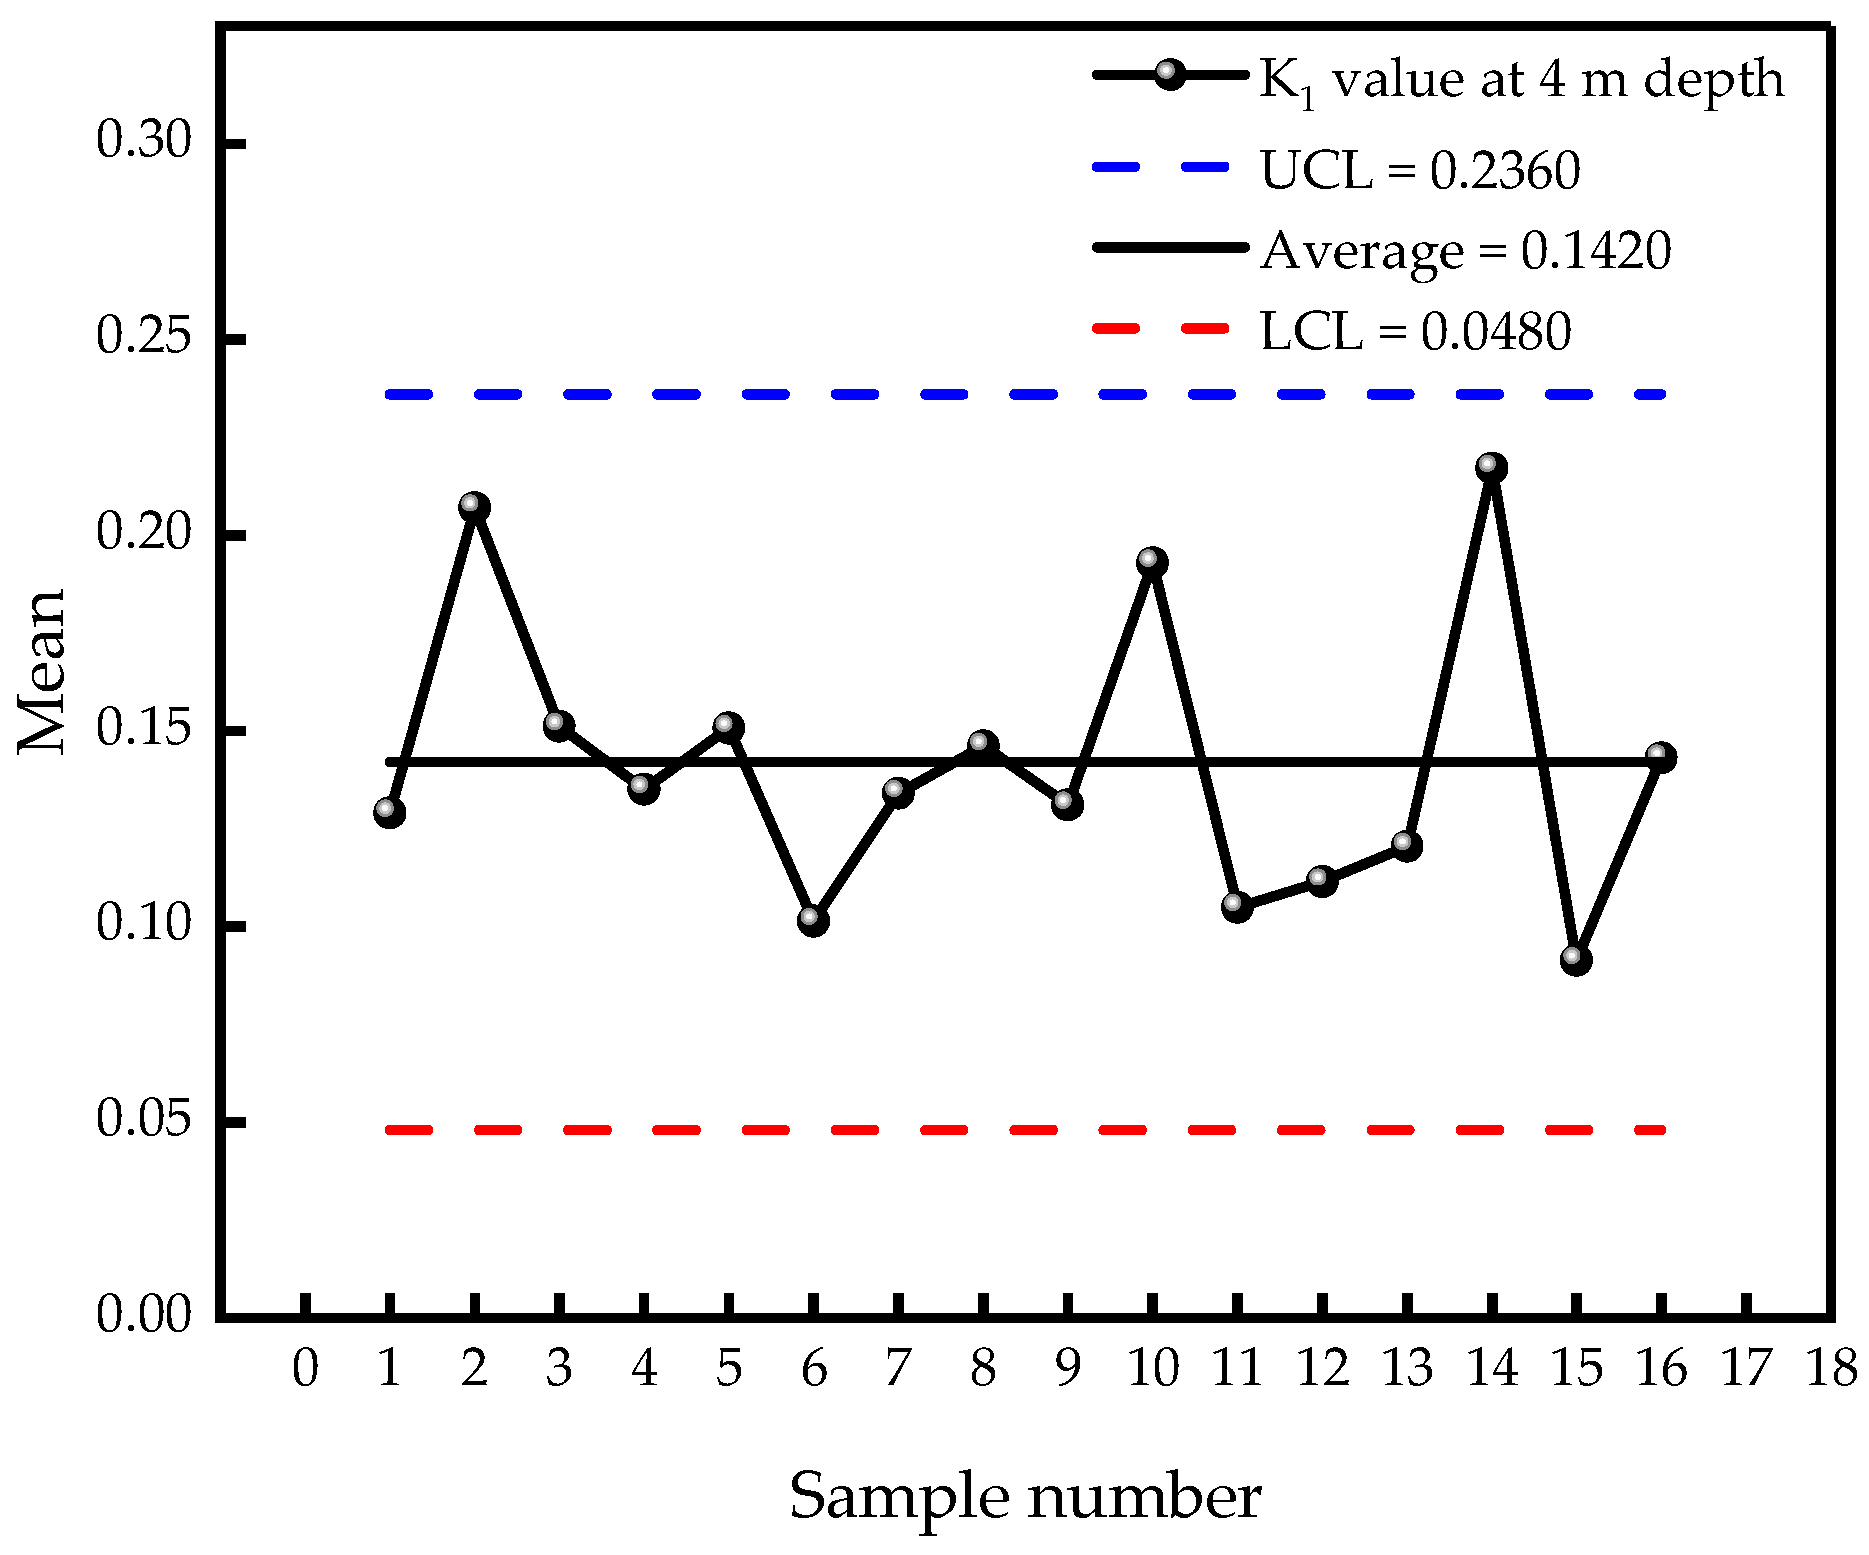
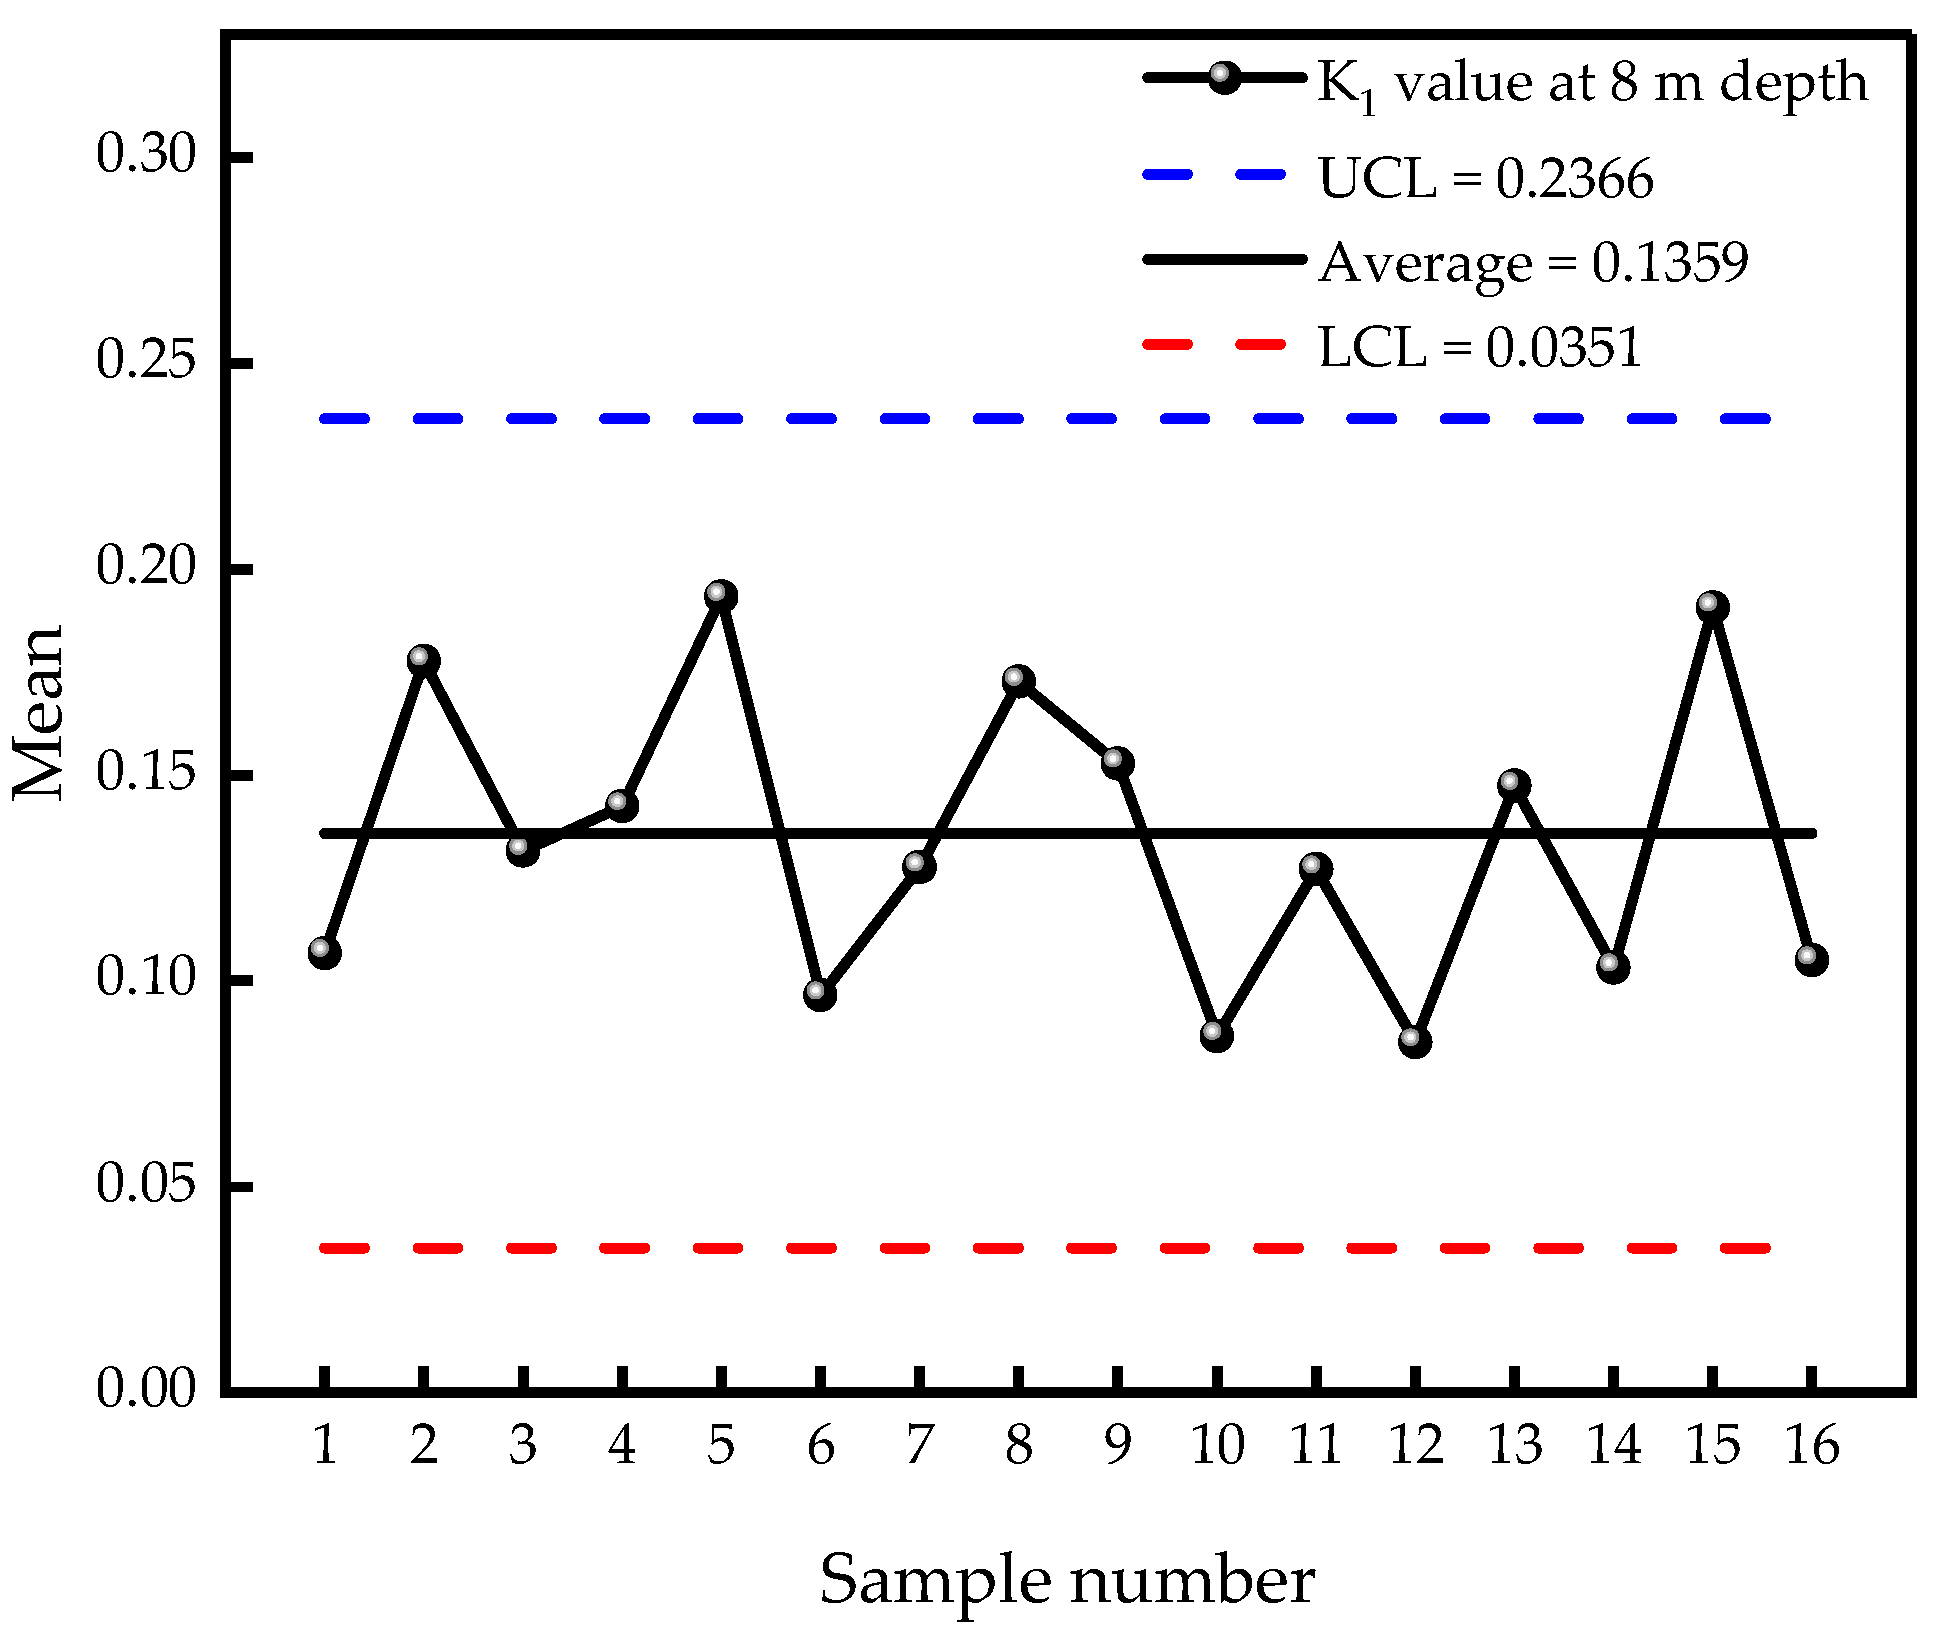
When a single index is used to predict the risk of outburst in the coal mine site, the prediction index value of each borehole depth satisfies the law that with the increase of borehole depth, the inspection index first increases, and then decreases after reaching the maximum value. In the field application of the SPC control method to the outburst index of Sihe mine to analyze the upper control limit, the sensitivity value of a single index under each borehole depth is established, which assists the timely discovery of danger warnings.
(2)
Through the logistic regression analysis method, taking the measured data of Chongqing Tianfu Mining Group Sanhui 1 mine and Sanhui 3 mine as the inspection and verification indexes, the inspection results show that the accuracy of outburst prediction and non-outburst prediction have been greatly improved, and the accuracy of outburst risk prediction in front of the working face shows a great breakthrough, which has good application value.

Author Contributions

Conceptualization, X.L. and S.H.; methodology, X.L.; validation, T.W., W.Z. and J.Z.; formal analysis, S.H.; investigation, T.W., W.Z. and J.Z.; resources, X.L.; data curation, T.W., W.Z. and J.Z.; writing—original draft preparation, S.H.; writing—review and editing, X.L.; visualization, S.H.; supervision, X.L.; project administration, X.L.; funding acquisition, X.L. All authors have read and agreed to the published version of the manuscript.

Funding

This research was funded by the National Natural Science Foundation of China (Grant No. 52174175, 52274078 and 52174073), Program for the Scientific and Technological Innovation Team in Universities of Henan Province (Grant No. 23IRTSTHN005) and the Scientific and Technological Research Project in Henan Province (Grant No. 212102310377).

Institutional Review Board Statement

Not applicable.

Informed Consent Statement

Not applicable.

Data Availability Statement

The data that support the findings of this study are available from the corresponding author upon a reasonable request.

Conflicts of Interest

The authors declare no conflict of interest.

References

  1. Luhar, K.A.; Emmerson, M.K.; Reisen, F. Modelling smoke distribution in the vicinity of a large and prolonged fire from an open-cut coal mine. Atmos. Environ. 2020, 229, 117471. [Google Scholar] [CrossRef]
  2. Bosikov, I.I.; Martyushev, N.V.; Klyuev, R.V.; Savchenko, I.A.; Kukartsev, V.V.; Kukartsev, V.A.; Tynchenko, Y.A. Modeling and Complex Analysis of the Topology Parameters of Ventilation Networks When Ensuring Fire Safety While Developing Coal and Gas Deposits. Fire 2023, 6, 95. [Google Scholar] [CrossRef]
  3. Gendler, S.G.; Gabov, V.V.; Babyr, N.V.; Prokhorova, E.A. Justification of engineering solutions on reduction of occupational traumatism in coal longwalls. Min. Informational Anal. Bull. 2022, 5–19. [Google Scholar] [CrossRef]
  4. Młynarczuk, M.; Skiba, M. An Approach to Detect Local Tectonic Dislocations in Coal Seams Based on Roughness Analysis. Arch. Min. Sci. 2022, 67, 743–756. [Google Scholar]
  5. Kozieł, K.; Janus, J. Force Exerted by Gas on Material Ejected During Gas-geodynamic phenomena Analysis and Experimental Verification of Theory. Arch. Min. Sci. 2022, 66, 491–508. [Google Scholar]
  6. Black, J.D. Review of coal and gas outburst in Australian underground coal mines. Int. J. Min. Sci. Technol. 2019, 29, 815–824. [Google Scholar] [CrossRef]
  7. Gabov, V.V.; Zadkov, D.A.; Babyr, N.V.; Xie, F. Nonimpact rock pressure regulation with energy recovery into the hydraulic system of the longwall powered support. Eurasian Min. 2021, 36, 55–59. [Google Scholar] [CrossRef]
  8. Yan, J.; Zhang, X.; Zhang, Z. Research on geological control mechanism of coal-gas outburst. J. China Coal Soc. 2013, 38, 1174–1178. [Google Scholar]
  9. Ayruni, A.T. Prediction and Prevention of Gas-Dynamic Phenomena in Coal Mines; Nauka: Moscow, Russia, 1987. [Google Scholar]
  10. Malyshev, Y.N.; Trubetskoy, K.N.; Airuni, A.T. Fundamental and Applied Methods for the Solution of Coal-Bed Methane Problems; Academy of Mining Sciences Publishing House: Moscow, Russia, 2000. [Google Scholar]
  11. Rubinsky, A.A.; Mineev, S.P. The Main Patterns of the Manifestation of Powerful Gas-Dynamic Phenomena in Coal Mines; Donetsk National Technical University: Donetsk Oblast, Ukraine, 2009; Volume 10, pp. 129–136. [Google Scholar]
  12. Wang, E.; Zhang, G.; Zhang, C. Research progress and prospect on theory and technology for coal and gas outburst control and protection in China. J. China Coal Soc. 2022, 47, 297–322. [Google Scholar]
  13. Cheng, Y.; Zhou, H. Research progress of sensitive index and critical values for coal and gas outburst prediction. Coal Sci. Technol. 2021, 49, 146–154. [Google Scholar]
  14. Wang, W.; Wang, H.; Zhang, B.; Wang, S.; Xing, W. Coal and gas outburst prediction model based on extension theory and its application. Process Saf. Environ. Prot. 2021, 154, 329–337. [Google Scholar] [CrossRef]
  15. Wang, C.; Li, X.; Xu, C.; Niu, Y.; Chen, Y.; Yang, S.; Zhou, B.; Jiang, C. Study on factors influencing and the critical value of the drilling cuttings weight: An index for outburst risk prediction. Process Saf. Environ. Prot. 2020, 140, 356–366. [Google Scholar] [CrossRef]
  16. Sun, Z.; Li, L.; Wang, F.; Zhou, G. Desorption characterization of soft and hard coal and its influence on outburst prediction index. Energy Sources Part A Recovery Util. Environ. Eff. 2020, 42, 2807–2821. [Google Scholar] [CrossRef]
  17. Tang, J.; Wang, C.; Chen, Y.; Li, X.; Yang, D.; Liu, J. Determination of critical value of an outburst risk prediction index of working face in a coal roadway based on initial gas emission from a borehole and its application: A case study. Fuel 2020, 267, 117229. [Google Scholar] [CrossRef]
  18. Zhang, C.; Wang, E.; Xu, J.; Peng, S. A new method for coal and gas outburst prediction and prevention based on the fragmentation of ejected coal. Fuel 2021, 287, 11949. [Google Scholar] [CrossRef]
  19. Liang, Y.; Wang, F.; Luo, Y.; Hu, Q. Desorption characterization of methane and carbon dioxide in coal and its influence on outburst prediction. Adsorpt. Sci. Technol. 2018, 36, 1484–1495. [Google Scholar] [CrossRef] [Green Version]
  20. Xie, X.; Shu, X.; Fu, G.; Shen, S.; Jia, Q.; Hu, J.; Wu, Z. Accident causes data-driven coal and gas outburst accidents prevention: Application of data mining and machine learning in accident path mining and accident case-based deduction. Process Saf. Environ. Prot. 2022, 162, 891–913. [Google Scholar]
  21. Li, Z.; Wang, E.; Ou, J.; Liu, Z. Hazard evaluation of coal and gas outbursts in a coal-mine roadway based on logistic regression model. Int. J. Rock Mech. Min. Sci. 2015, 80, 185–195. [Google Scholar] [CrossRef]
  22. Ma, Y.; Wang, E.; Liu, Z. Study on the comprehensive evaluation model of attributes for coal seam outburst risk. J. Min. Saf. Eng. 2012, 29, 416–420. [Google Scholar]
  23. Kursunioglu, N.; Onder, M. Application of structural equation modeling to evaluate coal and gas outbursts. Tunn. Undergr. Space Technol. 2019, 88, 63–72. [Google Scholar] [CrossRef]
  24. Zheng, X.; Lai, W.; Zhang, L.; Xue, S. Quantitative evaluation of the indexes contribution to coal and gas out-burst prediction based on machine learning. Fuel 2023, 338, 127389. [Google Scholar]
  25. Liu, H.; Dong, Y.; Wang, F. Prediction Model for Gas Outburst Intensity of Coal Mining Face Based on Improved PSO and LSSVM. Energy Eng. 2021, 118, 679–689. [Google Scholar] [CrossRef]
  26. Wu, Y.; Li, H.; Xu, D. Prediction algorithm of coal and gas outburst based on IPSO-Powell optimized SVM. J. Mine Autom. 2020, 46, 46–53. [Google Scholar]
  27. Shu, L.; Wang, K.; Liu, Z.; Zhao, W.; Zhu, N.; Lei, Y. A novel physical model of coal and gas outbursts mechanism: Insights into the process and initiation criterion of outbursts. Fuel 2022, 323, 124305. [Google Scholar] [CrossRef]
  28. Ru, Y.; Lv, X.; Guo, J. Real-Time Prediction Model of Coal and Gas Outburst. Math. Probl. Eng. 2020, 2020, 2432806. [Google Scholar]
  29. Xu, M.; Wei, P. SPC Evaluation Method and Application on Methane Control Effect of Fully Mechanized Working Face. Coal Technol. 2016, 35, 118–120. [Google Scholar]
Figure 1. Sample control chart.
Sustainability 15 11523 g001
Figure 2. System software function diagram.
Sustainability 15 11523 g002
Figure 3. S value control chart at 2 m depth.
Sustainability 15 11523 g003
Figure 4. S value frequency distribution chart at 2 m depth.
Sustainability 15 11523 g004
Figure 5. S value control chart at 4 m depth.
Sustainability 15 11523 g005
Figure 6. S value frequency distribution chart at 4 m depth.
Sustainability 15 11523 g006
Figure 7. S value control chart at 6 m depth.
Sustainability 15 11523 g007
Figure 8. S value frequency distribution chart at 6 m depth.
Sustainability 15 11523 g008
Figure 9. S value control chart at 8 m depth.
Sustainability 15 11523 g009
Figure 10. S value frequency distribution chart at 8 m depth.
Sustainability 15 11523 g010
Figure 11. K1 value control chart at 2 m depth.
Sustainability 15 11523 g011
Figure 12. K1 value frequency distribution chart at 2 m depth.
Sustainability 15 11523 g012
Figure 13. K1 value control chart at 4 m depth.
Sustainability 15 11523 g013
Figure 14. K1 value frequency distribution chart at 4 m depth.
Sustainability 15 11523 g014
Figure 15. K1 value control chart at 6 m depth.
Sustainability 15 11523 g015
Figure 16. K1 value frequency distribution chart at 6 m depth.
Sustainability 15 11523 g016
Figure 17. K1 Value control chart at 8 m depth.
Sustainability 15 11523 g017
Figure 18. K1 value frequency distribution chart at 8 m depth.
Sustainability 15 11523 g018
Table 1. Classification of severity of different outburst dynamic phenomena.
Outburst Dynamic PhenomenaSevereModerateMild
Coal burstFirecrackers, cannon bang; the
sound of the coal cannon
continues.
The interval time between coal guns is longer, and the sound of guns is stronger.Coal cannon occasionally occurs with a quiet,
humming sound.
Sloughing slaggingLarge area of sloughing
accompanied by sound; the side of the sloughing is shifted out; great tremor.
Local sloughing, drop ballast, tremor.Sloughing, dropping
debris phenomenon
occurs, with no tremor.
Spray roof, drill clampingMultiple drilling holes and spray holes; the drilling is very serious, and the distance of the jet hole is greater than 5 m; coal spraying phenomenon occurs.Coal spraying
phenomenon occurs,
multiple drilling holes, drilling, but relatively gentle; the distance of the hole is less than 5 m.
Individual drilling holes or clip drilling, but within the control range.
Structural change of coalThe coal structure is seriously damaged; the coal becomes soft.Bedding disturbance.The luster of coal darkens.
Gas anomalyThe gas fluctuates, and the
maximum concentration exceeds 10%.
The gas fluctuates,
and the maximum
concentration exceeds 1%.
The gas fluctuates, and the maximum concentration of gas is less than 1%.
Table 2. Single parameter control upper limit value and frequency ratio.
Name of IndexValue of SValue of K1
2 m4 m6 m8 m2 m4 m6 m8 m
UCL2.102.292.522.610.230.240.260.24
Fraction of coverage/%8686909288.392.291.486.7
Table 3. Comparison of analysis results by “three rate” method of prediction index.
Analysis ItemUnitContact Index Point PredictionMultiple Information Regression PredictionActual Outburst Risk
K1S
Total number of predictions (validity checks)Time125125125125
Each index predicts the number of outburst risksTime2232121
Forecast outburst of each index in the forecast data%17.62.416.816.8
Predicted number of outburst hazards was actually the
number of outburst hazards
Time17320
Prediction accuracy of each
index in the forecast data when there is outburst
%77.2710094.7
Number of actual non-outburst times among the predicted
non-outburst risk times
Time99104103104
Prediction accuracy of each
index in the forecast data when there is no outburst
%96.1285.2599.04
Disclaimer/Publisher’s Note: The statements, opinions and data contained in all publications are solely those of the individual author(s) and contributor(s) and not of MDPI and/or the editor(s). MDPI and/or the editor(s) disclaim responsibility for any injury to people or property resulting from any ideas, methods, instructions or products referred to in the content.

