Article

Investigating the Spatial-Temporal Variation of Pre-Trip Searching in an Urban Agglomeration

1
School of Geography and Ocean Science, Nanjing University, Nanjing 210023, China
2
School of Business Administration, Nanjing University of Finance and Economic, Nanjing 210023, China
*
Author to whom correspondence should be addressed.
Sustainability 2023, 15(14), 11423; https://doi.org/10.3390/su151411423
Submission received: 11 April 2023 / Revised: 8 July 2023 / Accepted: 10 July 2023 / Published: 23 July 2023
(This article belongs to the Section Sustainability in Geographic Science)

Abstract

:
Search engines have been the primary tool for online information search before traveling. Timely detection and the control of peak tourist flows in scenic areas prevent safety hazards and the overconsumption of tourism resources due to excessive tourist clustering. This study focuses on the spatial-temporal interactions between the pre-trip stage and the after-arrival stage to investigate online information search behavior. Big data obtained from mobile roaming and search engines provide precise data on daytime and city scales, which enabled this paper to examine the relationship between daily tourist arrivals and their pre-trip searching from 40 cities within the Yangtze River Delta urban agglomeration. This study had several original results. First, tourists generally search for tourist information 2–8 days before arriving at destinations, while tourist volume and SVI from source cities show distance attenuation. Second, SVI is a precursor to changes in tourist volume. The precursory time rises with the increase of traffic time spatially. Third, we validated a VAR model and improved its accuracy by constructing it based on the spatial-temporal differentiation of search features. These findings would enhance the management and preservation of tourism resources and promote the sustainable development of tourism destinations.

1. Introduction

With the widespread accessibility of the internet and smartphones, tourist information search (TIS) has turned into one of the most critical research categories in tourist behavior and destination marketing [1,2]. Modern tourists increasingly rely on the internet to choose a vacation destination, obtain destination information, plan their itinerary, find hotels, and other tourism services [3]. Search engines, as a primary context-aware tool, provide information to tourists who leave their usual resident place and travel to an unfamiliar destination in many forms, such as text reviews, pictures, videos, and even virtual maps [4,5]. Everyone’s online search behaviors leave traces on search engines, which makes search volume index (SVI) a rare real-time dynamic form of big data that provides the opportunity to study pre-trip behavior [6,7]. From the perspective of big data, analyzing tourists’ search data on search engines helps to predict visitor traffic and to timely detect and control the peak flow of tourists in scenic areas. This has become an important tool for destination managers for marketing, monitoring, and controlling tourist destinations, and it contributes to improving the level of sustainable development of tourism destinations [8,9].
Tourism demand forecasting is of great significance in the tourism industry, as it could help tourism practitioners and tourism managers to better formulate tourism plans, resource allocation, and marketing strategies to promote the sustainable development of the destination [10,11]. At the same time, forecasting tourism demand can also help tourism enterprises and government departments to better respond to changes in the tourism market and improve the quality and efficiency of tourism services [12], thereby promoting the sustainable development of tourism.
Traditional tourism demand forecasting methods include time series analysis [13], regression analysis [14], and neural networks [15]. In recent years, with the development of big data technology [12] and artificial intelligence technology [16], tourism demand forecasting has also gradually developed towards a data-driven and intelligent direction. Researchers have adopted search engine data to predict COVID-19 [17], macroeconomic statistics [18], and tourist volume [19,20]. Some structural features of SVI, such as platform bias [1], language bias [19], and distance bias [6], have been noted recently. In addition, the rapid development of bulk data handling techniques has made mobile roaming data and timely sources available for tourist behavior research. Roaming data have been used to analyze tourist flows [21] and travel distances [22,23].
Studies have further used different precursor effects of SVI with various sources to optimize the prediction model of total tourist volume [6,19]. Compared to traditional data, search volume is timely monitored, easily collected, and provides instant feedback. In the last couple of decades, traditional sources, quarterly or annual data, are the mainstream sources (more than 90%) [24], but today, demand fluctuation serves as essential data for service departments for the perspective of short-term precision marketing and personalized services [25]. Using big data to obtain more accurate short-term tourist flow data makes it possible to revise the traditional forecasting model. The data resources resulting from online services are a breakthrough in the improvement of the accuracy of real-time prediction.
However, most of the current studies on SVI were based on time series data, which ignored the interaction between the spatial distribution data and time-series data of tourist sources. This study aimed to bridge this gap in the existing literature by combining daily search indexes and actual tourist arrivals from 40 cities around the destination in a large urban agglomeration. The remaining paper was organized as follows: firstly, we critically reviewed TIS literature and its predictive power in the literature review. Secondly, we presented the co-integration test and Granger causality test to analyze the correlation in the Section 3. Thirdly, we took the world cultural heritage site Zhongshan Scenic Area as an example and analyzed the time–space correlation of tourists’ mobility and related online searches in the Section 4. Furthermore, this section used the method to compare predictions and verify the application value of the spatial features of SVI precursory effects. Finally, in the Section 5, we present the theoretical contributions and managerial implications.

2. Literature Review

2.1. Tourism Information Search (TIS)

Hyde [26] determined that information search, plans, and reservations are unique aspects of pre-trip decision-making. The amount of information searched before the tour could predict the extent of a tourist’s planning and bookings. Most researchers have admitted TIS as a widely researched issue in predicting tourist behavior and filled the gap brought by econometric models [27]. Specifically, TIS by search engine data has been used in predicting the demand of hotels or accommodations [28], tourist arrivals [18,29], and tourist flows [6].
Researchers also revealed the demographical factors that affect search behavior [30]. The websites browsed and the keywords searched by tourists reflect their knowledge, background, and information needs [31]. In addition, various factors between different cultures and society in pre-trip online information search behavior are verified, such as cultural background, habits, economy, and technology [32].
Webometrics, as a new frame, can evaluate the phenomena happening in cyberspace of precursors, from online information searches to offline visits [33]. The current TIS study mainly focuses on time series data, revealing that different tourism-based factors have short, medium, or long timescale effects [34,35]. For example, the weather proved to be a short-term impact on tourist volume [36,37]; extreme events proved to be a medium-term impact [8]; and scenic spots had a long-term impact [38]. In the post-COVID-19 era, examining the role of search data in travel has also become an important topic [39]. However, scant search engine studies have paid attention to the relationship between time-series data and spatial distribution. Thus, whether the search data also follow distance decay rules and affect tourists’ intention to travel temporally and geographically is one of the main focuses of this study. Validating the accuracy of prediction models from spatiotemporal data is more helpful for tourist market analysis and destination management.

2.2. Search Engine Used in the Forecasting

Tourist forecasting is a popular topic with great significance in practical management applications. The research on tourist flow forecasting has gone through the beginning stage of analyzing the factors that affect tourism development, the intermediate stage of qualitatively describing the relationship between various factors and tourist flow forecasting, and the current stage of constructing models for quantitative analysis. Travel flow forecasting models commonly used in recent research include traditional time-series prediction methods [40], econometric methods [41], artificial neural network techniques [42,43], and combined prediction methods [44,45].
The traditional time-series forecasting model is widely used in tourism demand research since it only needs observation information of the variables itself, which makes data collection and model construction less costly. Autoregressive integrated moving average models have achieved remarkable results in forecasting tourism demand [46,47]. Researchers develop and revise various models based on these studies to achieve better predictions. The prediction power of VAR and vector error correction (VEC) models, which reflect the causal relationship between the forecasting object and the influencing factor, is better than the traditional time-series forecasting model [48]. The prediction accuracy of the VAR model is related to multiple parameters, including lag order, model selection criteria, covariance matrix of residuals, etc. It is necessary to select and adjust these parameters according to specific situations in order to improve the prediction ability of the model. To further improve prediction accuracy, researchers began to combine different prediction methods to compensate for the limitations of existing models [46,49]. For example, Hu et al. adopted feature extraction technology and combined econometrics, integrated learning, and hybrid methods to build models and optimize the performance of tourism prediction with field effect tubes [50]. The forecasting comparison and correlation of multiple source regions have attracted the attention of scholars. The relationships between tourism demand and variables such as income, ticket prices, and travel costs within a country or across multiple regions are empirically studied [41].
As short-term data becomes more readily available, routine and even real-time predictive studies are becoming feasible and promising. For example, a short-term demand for casino tourism [51] and a holiday forecast of tourist flow for Mountain Huangshan [44] were studied by tourism scholars. Scholars have paid attention to the development of artificial intelligence (AI) and the fresh blood to tourism demand forecasting research [52].
Numerous studies have confirmed the predictive effectiveness of search-engine-query-volume data in social and economic domains [13,29]. Tourism-flow-affected factors, such as economic indicators, climate/weather index, search engines, and market sentiment, are incorporated into the forecasting models as explanatory variables to improve the accuracy [37,53]. Referring to research in hospitality and tourism, the pre-trip behavior of tourists reflected by SVI is a major concern [54]. The study of tourist search behavior found that tourists typically make travel decisions at least two to three weeks in advance, which is more accurate than the seasonal pattern uncovered in the previous study [1,55].
The advantage of real-time and regional search data is gradually taken into account, which improves daily tourist forecasting [56]. Google or Baidu Trends, as forecasts with a large number of users, were adopted to predict tourist volumes or hotel occupancy for various scales of destination area in an approaching time (seasonally, weekly, and daily) [28,57,58]. In particular, the space-time features and platform bias of SVI are worth the further detailed study, which could be used to correct and aggregate SVI for preferable forecasting on a short-time scale [19].

3. Methodology

To eliminate spurious regression in regression analysis, we used the augmented Dickey-Fuller (ADF) test method in this study to examine the stability and co-integration of time-series data. Furthermore, as a statistical method for testing causality between time series, this study used Granger causality tests to investigate the relationship between tourist volume and SVI in each city and demonstrate the causal relationship in the temporal dimension. Finally, the impulse response function was utilized to examine the dynamic influence of SVI on the tourism flow in each city by creating a vector autoregression model (VAR) with each city’s tourist arrivals and SVI data. VAR is a multivariate time series analysis model that is used to describe the linkage relationship between multiple variables. The effect of random perturbations from a standard deviation of scenic spot SVI on a dependent variable of visitor arrivals was observed with greater precision. More precisely, the effect of random perturbations to the standard deviation of a scenic spot’s SVI on the dependent variable of visitor arrivals was identified. To investigate the influence of SVI on the spatial distribution characteristics of tourist flow in the precursory days, we examined the lag of impulse response peak (LRP) in the function graphs of various cities, which refers to the time delay between the point of application of an impulse input signal and the peak of the output response signal, and it is an important parameter used to characterize the behavior of a system and to design control algorithms. This study used LRP to indicate the most significant days for the number of tourist lags behind the SVI.
Following that, we built SVI data to forecast the world heritage site’s tourist flow. To evaluate and compare the prediction model’s performance, we first examined the variable of the tourist flow time series. Then, we used historical data from the Yangtze River Delta’s tourist flow time series to anticipate tourist flow using an autoregressive moving average model (ARMA), which represents time series data as a linear combination of autoregressive terms and moving average terms, taking into account both the historical data of the time series itself and the influence of random error terms. The SVI data were introduced as an explanatory variable to the tourist flow time series prediction, and a VAR prediction model was developed. VAR, which has been widely employed in the economics and tourism literature, treats time series as endogenous in a dynamic process [53,59,60]. The above methods mainly used Arcgis and Stata for data analysis.
We selected cities that have the same response delay time as one type based on the results of the spatial-temporal divergence between online search and visitor flow and developed a bivariate VAR prediction model using tourist volume and SVI for each city [1,61]. The tourist flow variable is denoted by KL-n (n denotes the response lag horizon). For example, the total city tourist flow in ‘response lag period two’ is denoted by KL-2, and the total city tourist flow in ‘response lag period three’ is denoted by KL-3. Similarly, each city’s total tourist volume was computed by adding the forecasted outcomes for each city’s tourist flow (variable ZY). The SVI variable represents the SVI of the city’s scenic area in which the response lags. It is denoted by BD-n (n denotes the response lag period). For example, BD-2 denotes the city’s SVI in ‘response lag period two’ and ‘response lag period three’ by BD-3. As a result, the following estimation equation is derived:
Y t = A 1 Y t 1 + A n Y t n + ε t ;   Y t = K L n   B D n  
where n denotes the response lag period for the association between various categories of tourist volume and SVI; KL-n and BD-n denote the response lag period for tourist flow between source city and SVI, respectively. The total tourist flow VFvar is equal to the sum of the expected values for the n types of source cities listed above, Y t . That is,
V F v a r = i = 1 n Y t i ,
where ZY denotes the total tourist volume from the scenic spot’s source cities, Y t denotes the expected value of each city’s tourist volume, and n denotes the response lag period type.

4. Empirical Results

4.1. Data Resource

At the end of June 2017, China’s Ministry of Industry and Information Technology reported that the country had 1.36 billion smartphone subscribers. That is, nearly every Chinese individual owns a cell phone. The collection of large amounts of data from search engines and mobile devices in every city expands the possibilities for additional research and more practical applications.
Zhongshan Scenic Area is located in the Chinese city of Nanjing, Jiangsu Province (Figure 1). It is home to two world-famous attractions: the Ming Xiaoling Mausoleum, a UNESCO World Heritage Site, and Sun Yat-sen’s Mausoleum. Its primary long-term reliable supply of tourists is the Yangtze River Delta’s 40 cities (local users were excluded). Zhongshan attracted 10.8 million tourists from the Yangtze River Delta during the study period (1 April 2016 to 31 April 2017), accounting for 84.6 percent of total tourists.

4.1.1. Online Search Keywords

Baidu (www.baidu.com) is China’s most popular search engine. Baidu Index, similar to Google Trends, is a critical record of Internet users’ search volume on Baidu. It utilizes frequency weighting to determine the popularity of each keyword on the Baidu platform. It reflects the actual volume of specific searches, with no upper limit and consistent processing, unlike Google’s 0–100 trend processing [62]. In prior comparative research, the Baidu index was deemed to be more appropriate for China due to its larger market share in the Chinese language [63]. The Baidu Index can rapidly and accurately display online TIS fluctuation for various cities. Thus, the SVI can readily be adjusted to match the daily tourist flow in various cities.
We used the destination-related keywords from tourists in the cities of the Yangtze River Delta in the Baidu Index “https://index.baidu.com (accessed on 3 June 2017)” as tourist SVI. When picking keywords for the search, statistic objects connected to the Zhongshan Scenic Area’s primary attractions were employed. The benchmark keywords were “Nanjing Sun Yat-sen Mausoleum”, “Zhongshan Mausoleum Ticket”, “Ming Xiaoling Mausoleum”, “Sun Yat-sen Mausoleum”, and “Spirit Valley Temple” (all in Chinese). These were the five most frequently used keywords connected to the study site. Then, we extracted each term associated with the Zhongshan Scenic Area from the Baidu Index between 1 April 2016 and 31 April 2017 and combined them to create the overall index for each city. They were denoted by the abbreviations ‘province-city initials + BD’ (for example, Hangzhou SVI recorded as ZJ-HZBD, Huzhou SVI recorded as ZJ-hzBD, and Shanghai SVI as SHBD). The study assumed that travelers search for a large number of keywords in a concentrated manner before a trip and thus aggregated five keywords as a complete indicator.

4.1.2. Tourist Volume Data

Existing data on tourist volume research are primarily derived from two sources. Firstly, international organizations or local tourism bureaus’ statistical yearbooks are consulted. Unfortunately, these statistics are deficient in relevance, specificity, and timeliness. Secondly, tourism researchers develop survey programs to meet specific study objectives. However, there are shortcomings, such as a small sample size that cannot accurately reflect the unique tourist conditions when gathered by sampling surveys and other ways.
To solve both of these data gaps, we collected data using a new system called the Nanjing Smart Tourism System. The Nanjing Smart Tourism System, which was developed in collaboration with telecom operators, is capable of collecting daily tourist data for the Zhongshan Scenic Area. It utilizes geolocation data from tourists’ mobile phones to track and record their trips to the scenic area. As a result, these data are large-scale, with a high degree of relevance and timeliness. From 1 April 2016 to 31 April 2017, we obtained the real-time daily number of tourists visiting the Zhongshan Scenic Area from cities in the Yangtze River Delta (including Anhui province, Jiangsu province, Zhejiang province, and Shanghai City). They are denoted by ‘province-city initials + Y’ (e.g., the Hangzhou tourist volume is recorded as ZJ-HZY, Huzhou tourist volume as ZJ-hzY, and Shanghai tourist volume as SHY).

4.1.3. Distribution Characteristics

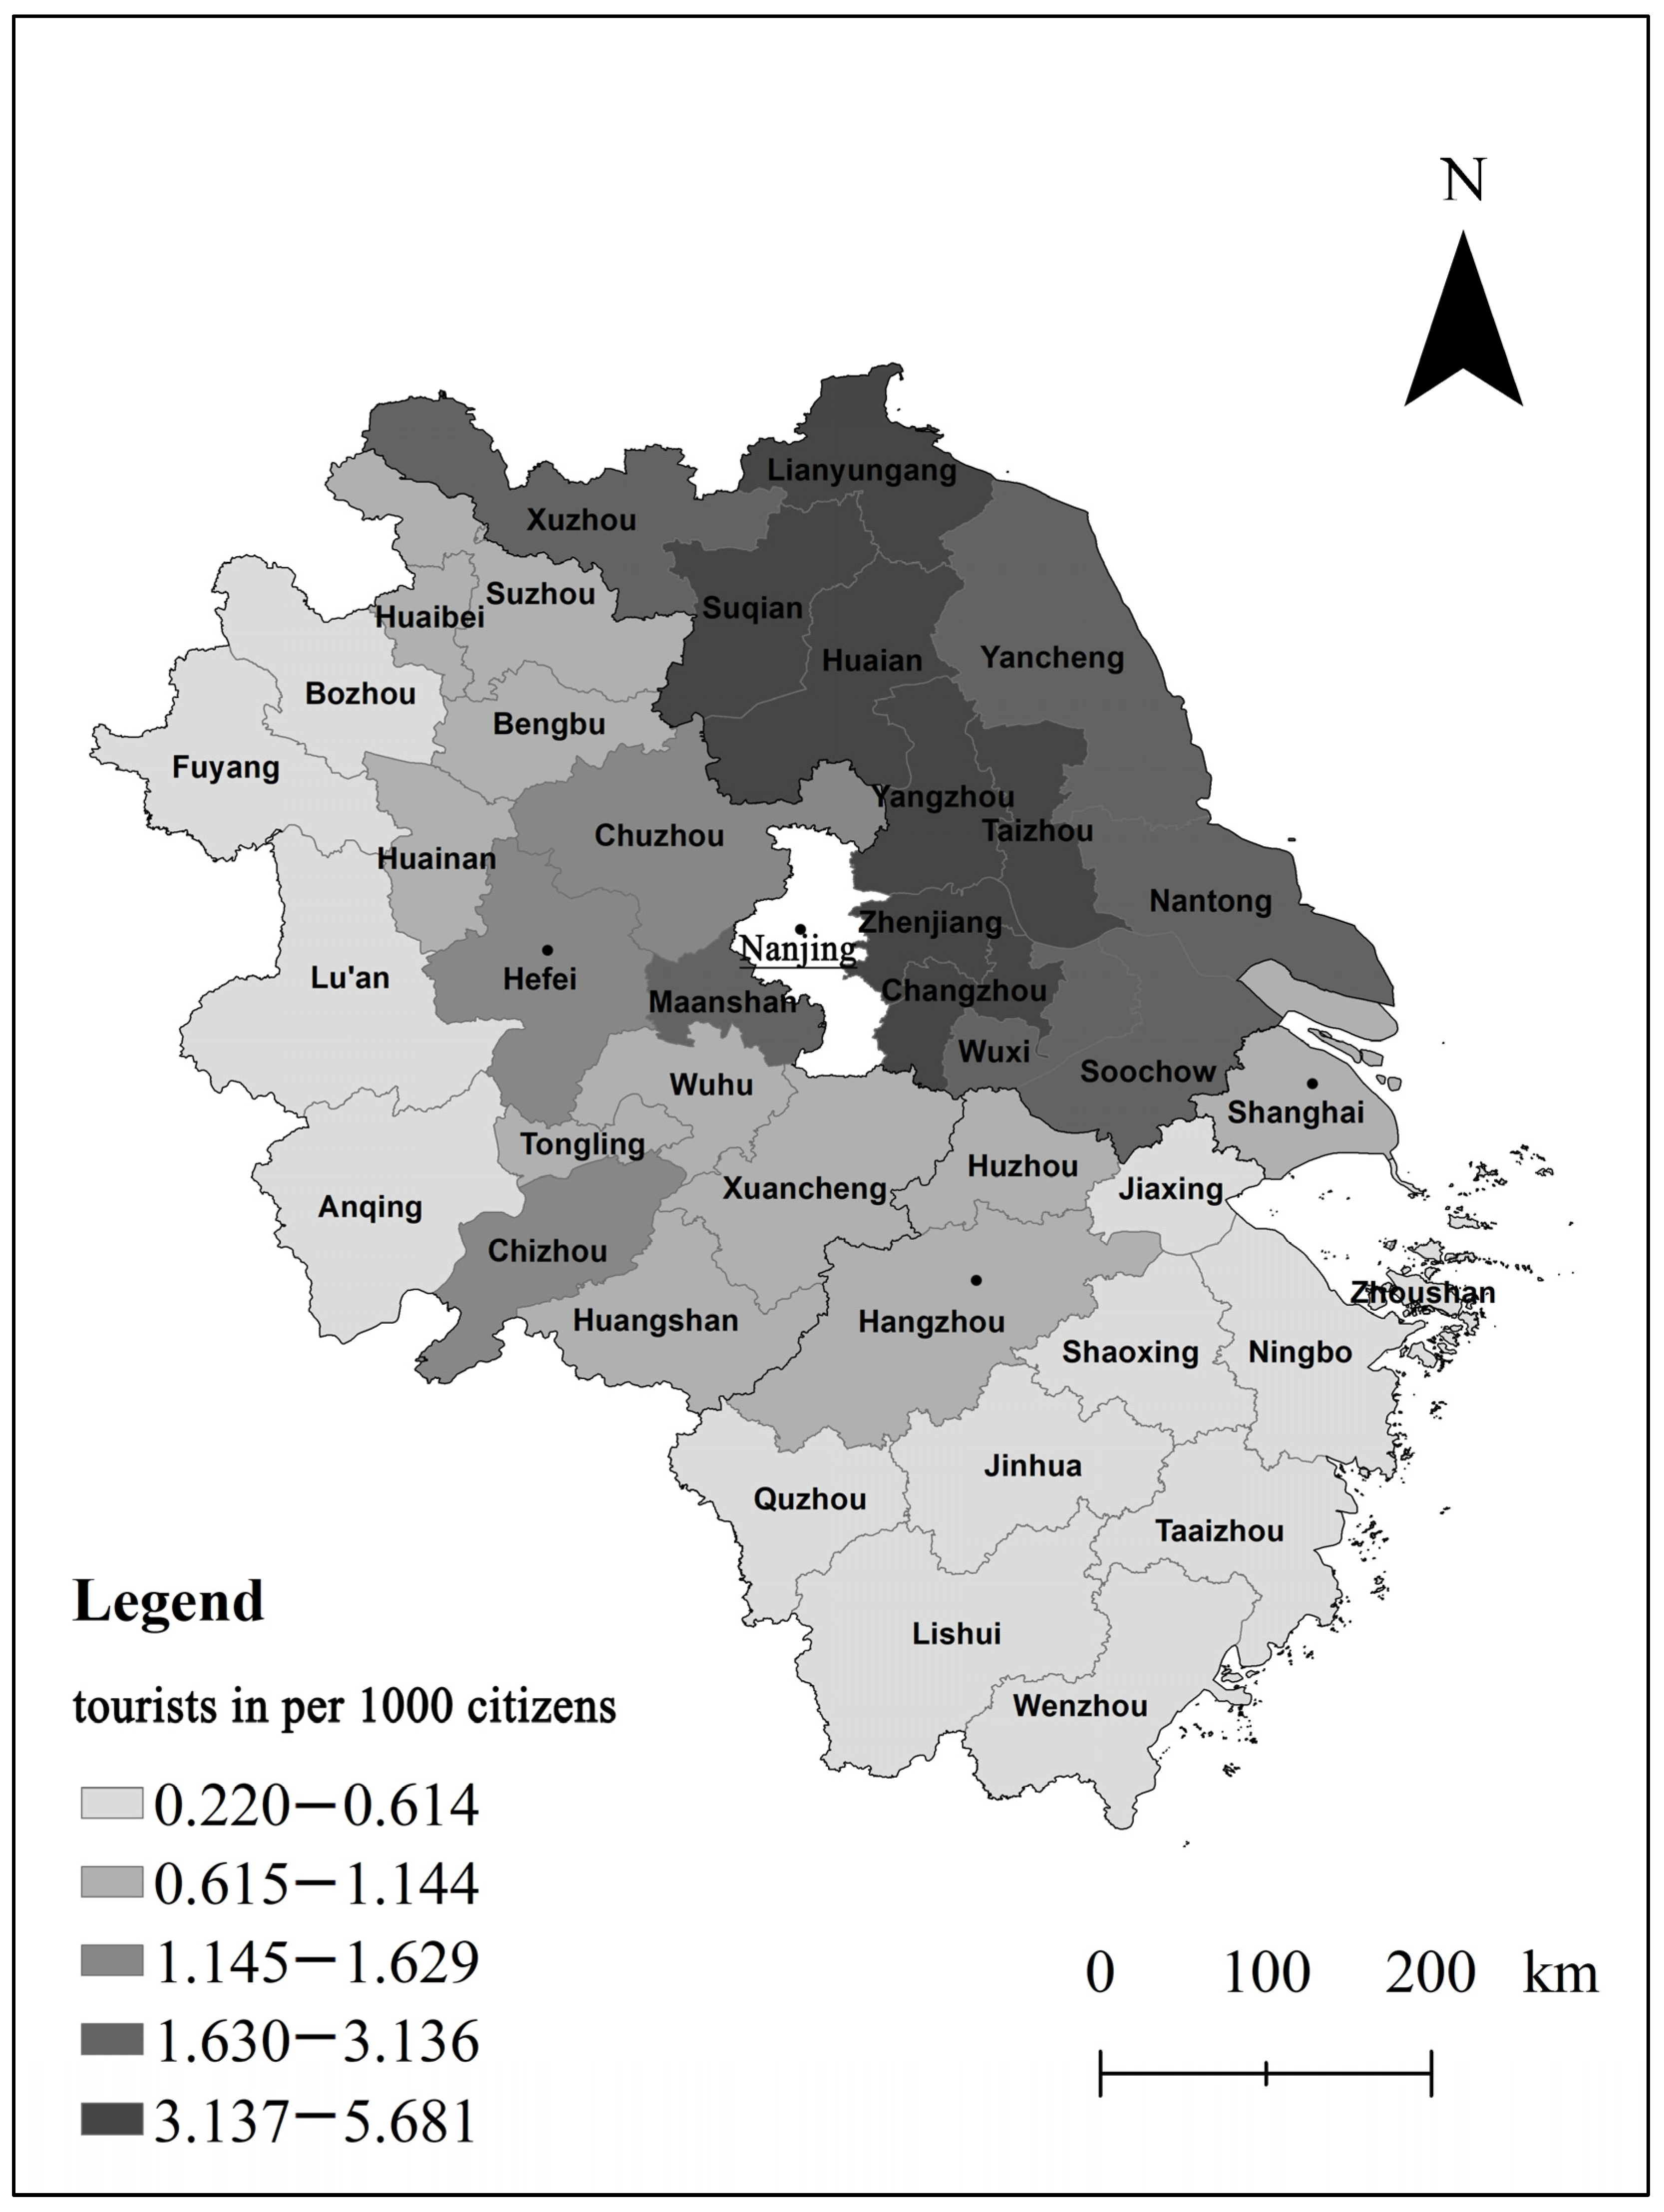
The population of a city in the Yangtze River Delta can have an effect on tourism statistics. The relative tourist arrivals from the source cities were calculated by normalizing the tourist volume and population of each city. This information highlighted the travelers’ geographical characteristics (Figure 2). Tourists are primarily drawn from surrounding cities, and the quantity of tourists in a given space is often diminished by geographical distance.
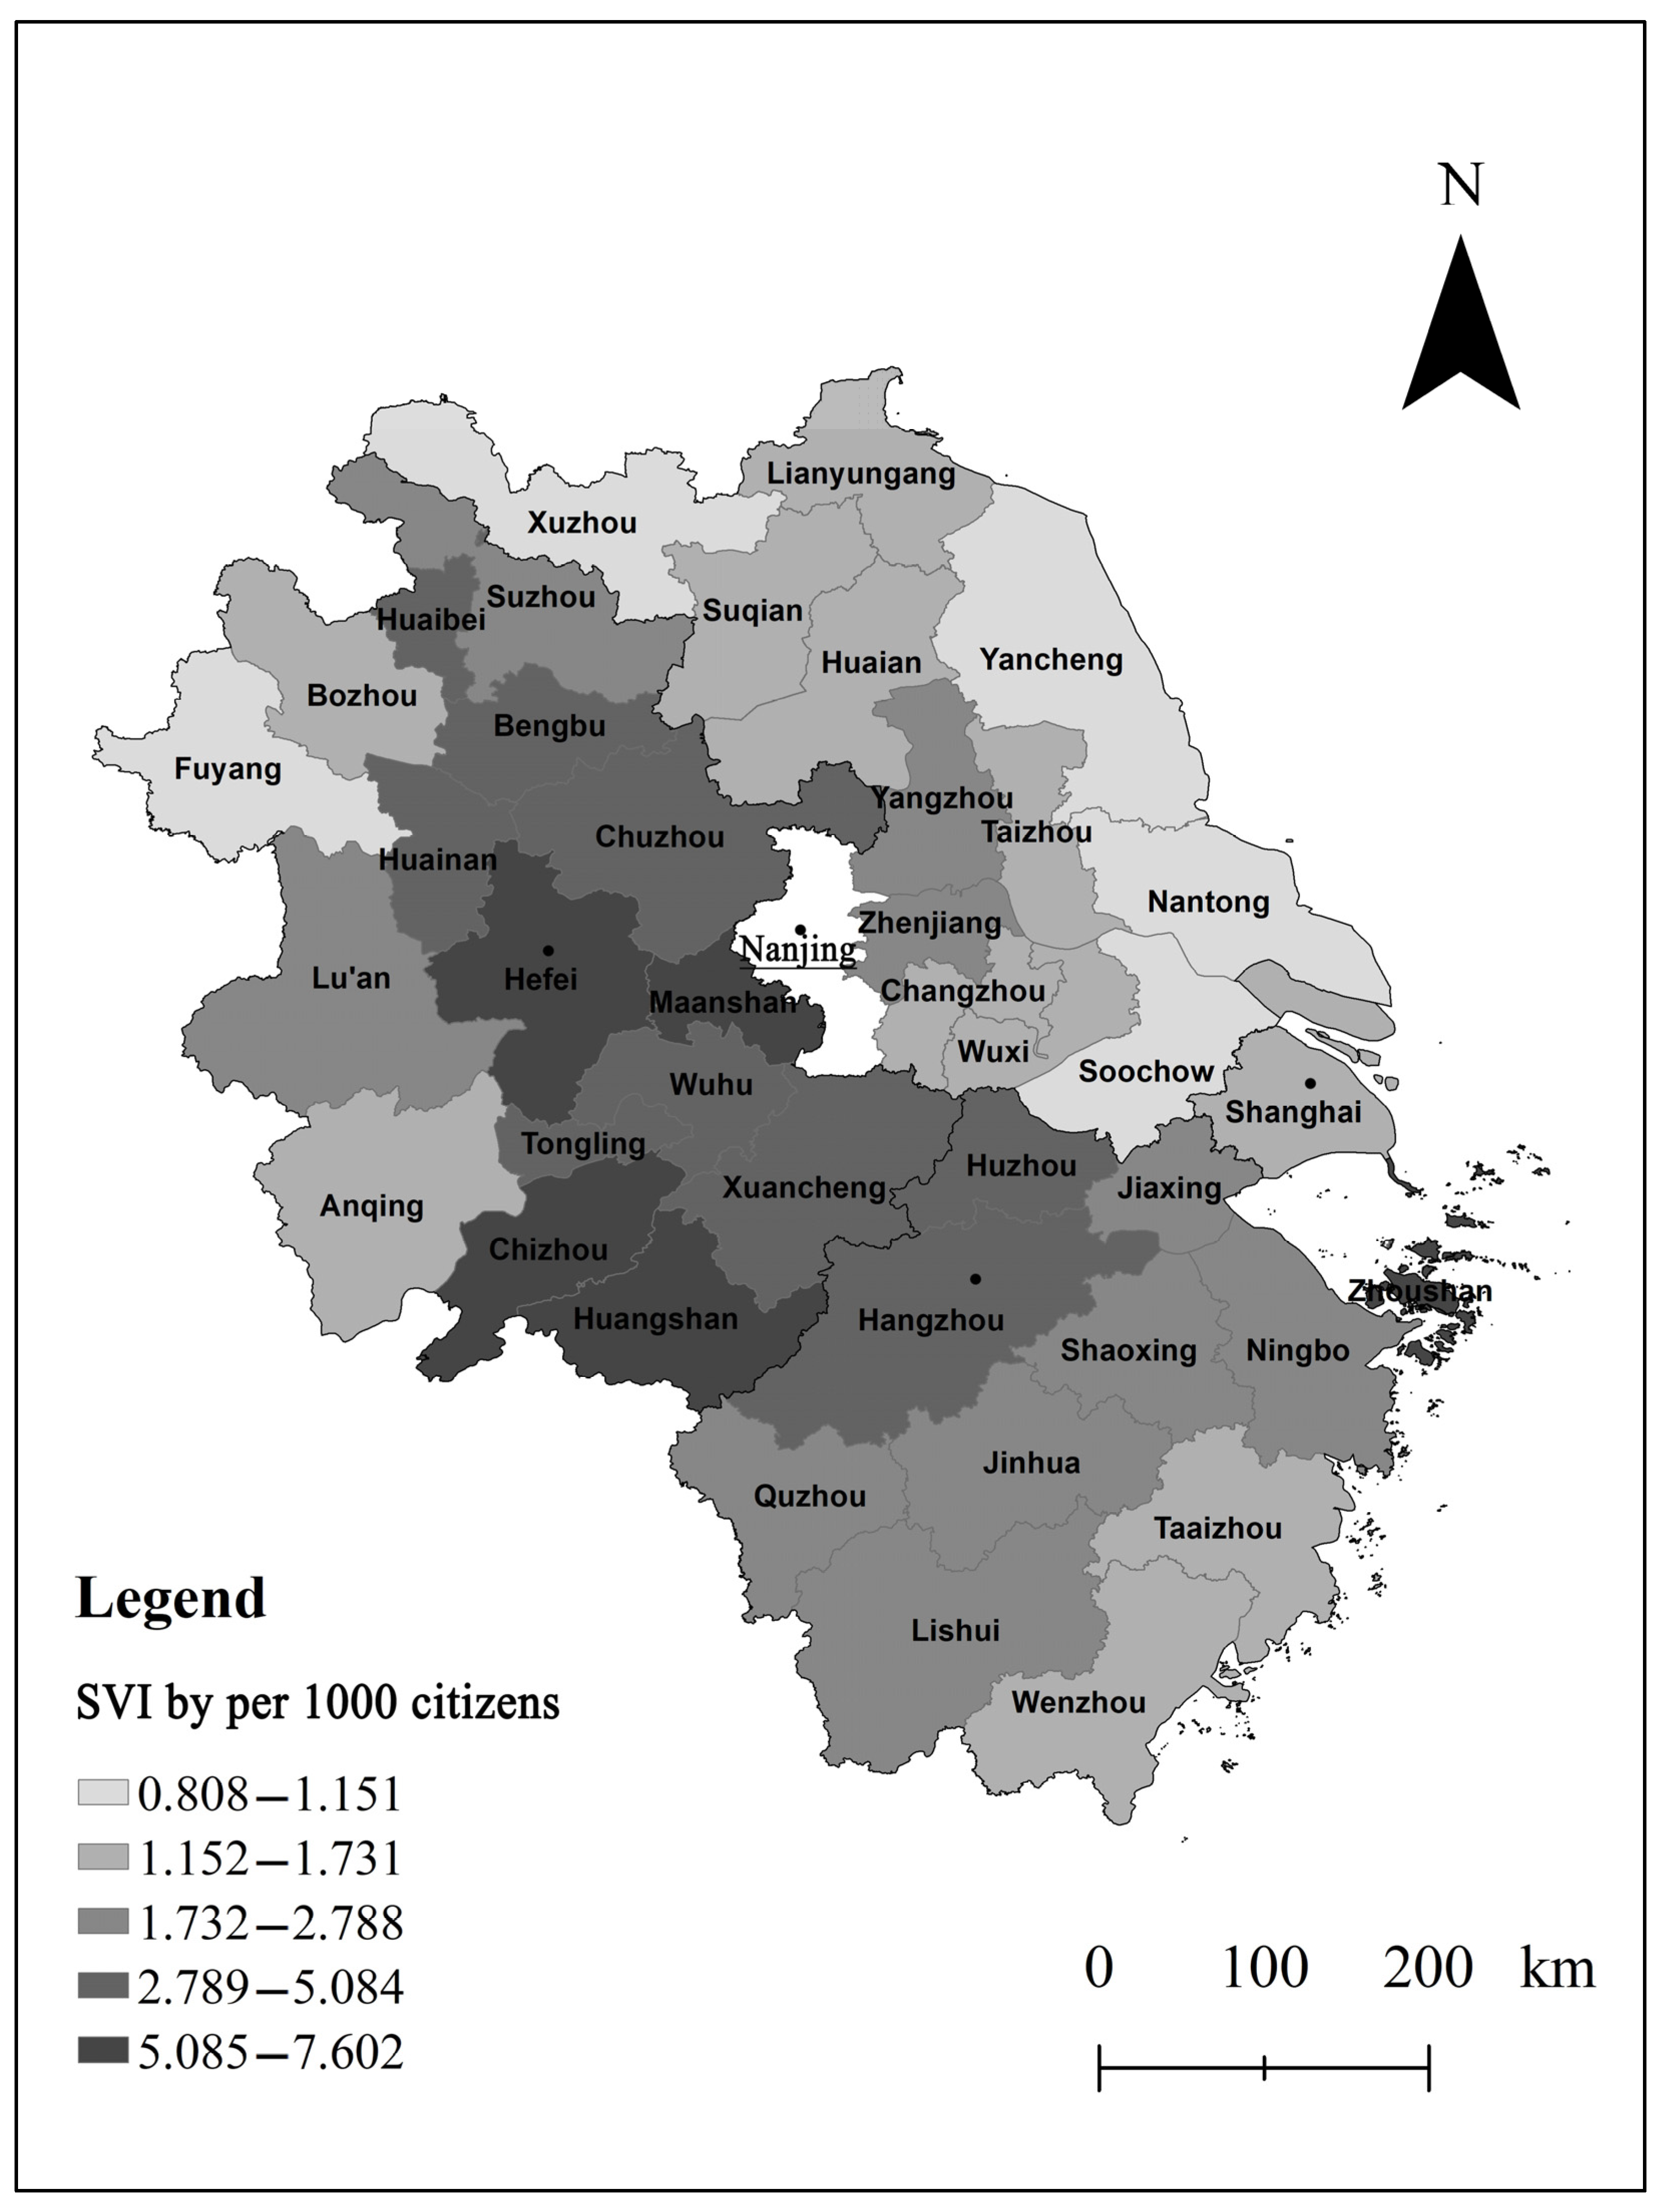
The SVI of tourists in 40 cities has various characteristics, and the number of online searches is first determined by the regional internet user population [61]. Assuming that other factors remained constant, the standardized processing of SVI was performed on the result of the daily SVI value of the Zhongshan Scenic Area divided by the number of city Internet users in each city of the Yangtze River Delta (the number of city Internet users = city population* network penetration rate) (Figure 3). Along with the geographic attenuation of tourism network search volume, it demonstrated the distribution characteristics, with Shanghai, Hefei, and Hangzhou as the core cities.

4.2. Spatial Disparity of SVI Precursory Effects

Firstly, the ADF test was performed to verify daily tourist data and index data from each city. Each city’s SVI is zero-order and monostable, allowing for the application of the Granger causality test. Due to the Granger causality test’s increased sensitivity to the lag period chosen, the optimal lag order is typically calculated using methods such as the Akaike Information Criterion (AIC) and Schwarz Criterion. Table A1 contains the test results.
When analyzing whether the daily SVI was a Granger cause of tourist volume, all test findings rejected the null hypothesis that the daily SVI may be regarded as a forerunner to the shift in the daily tourist amount. When analyzing whether the daily tourist volume was the Granger cause of the SVI of the day, the test findings of eight cities contradicted the initial hypothesis, showing that the daily tourist quantity was the Granger cause of the SVI. The daily online search in this type of city could affect the real number of tourists, and the number of daily tourists can also cause changes in the web search. The two showed mutual correlation and causation.
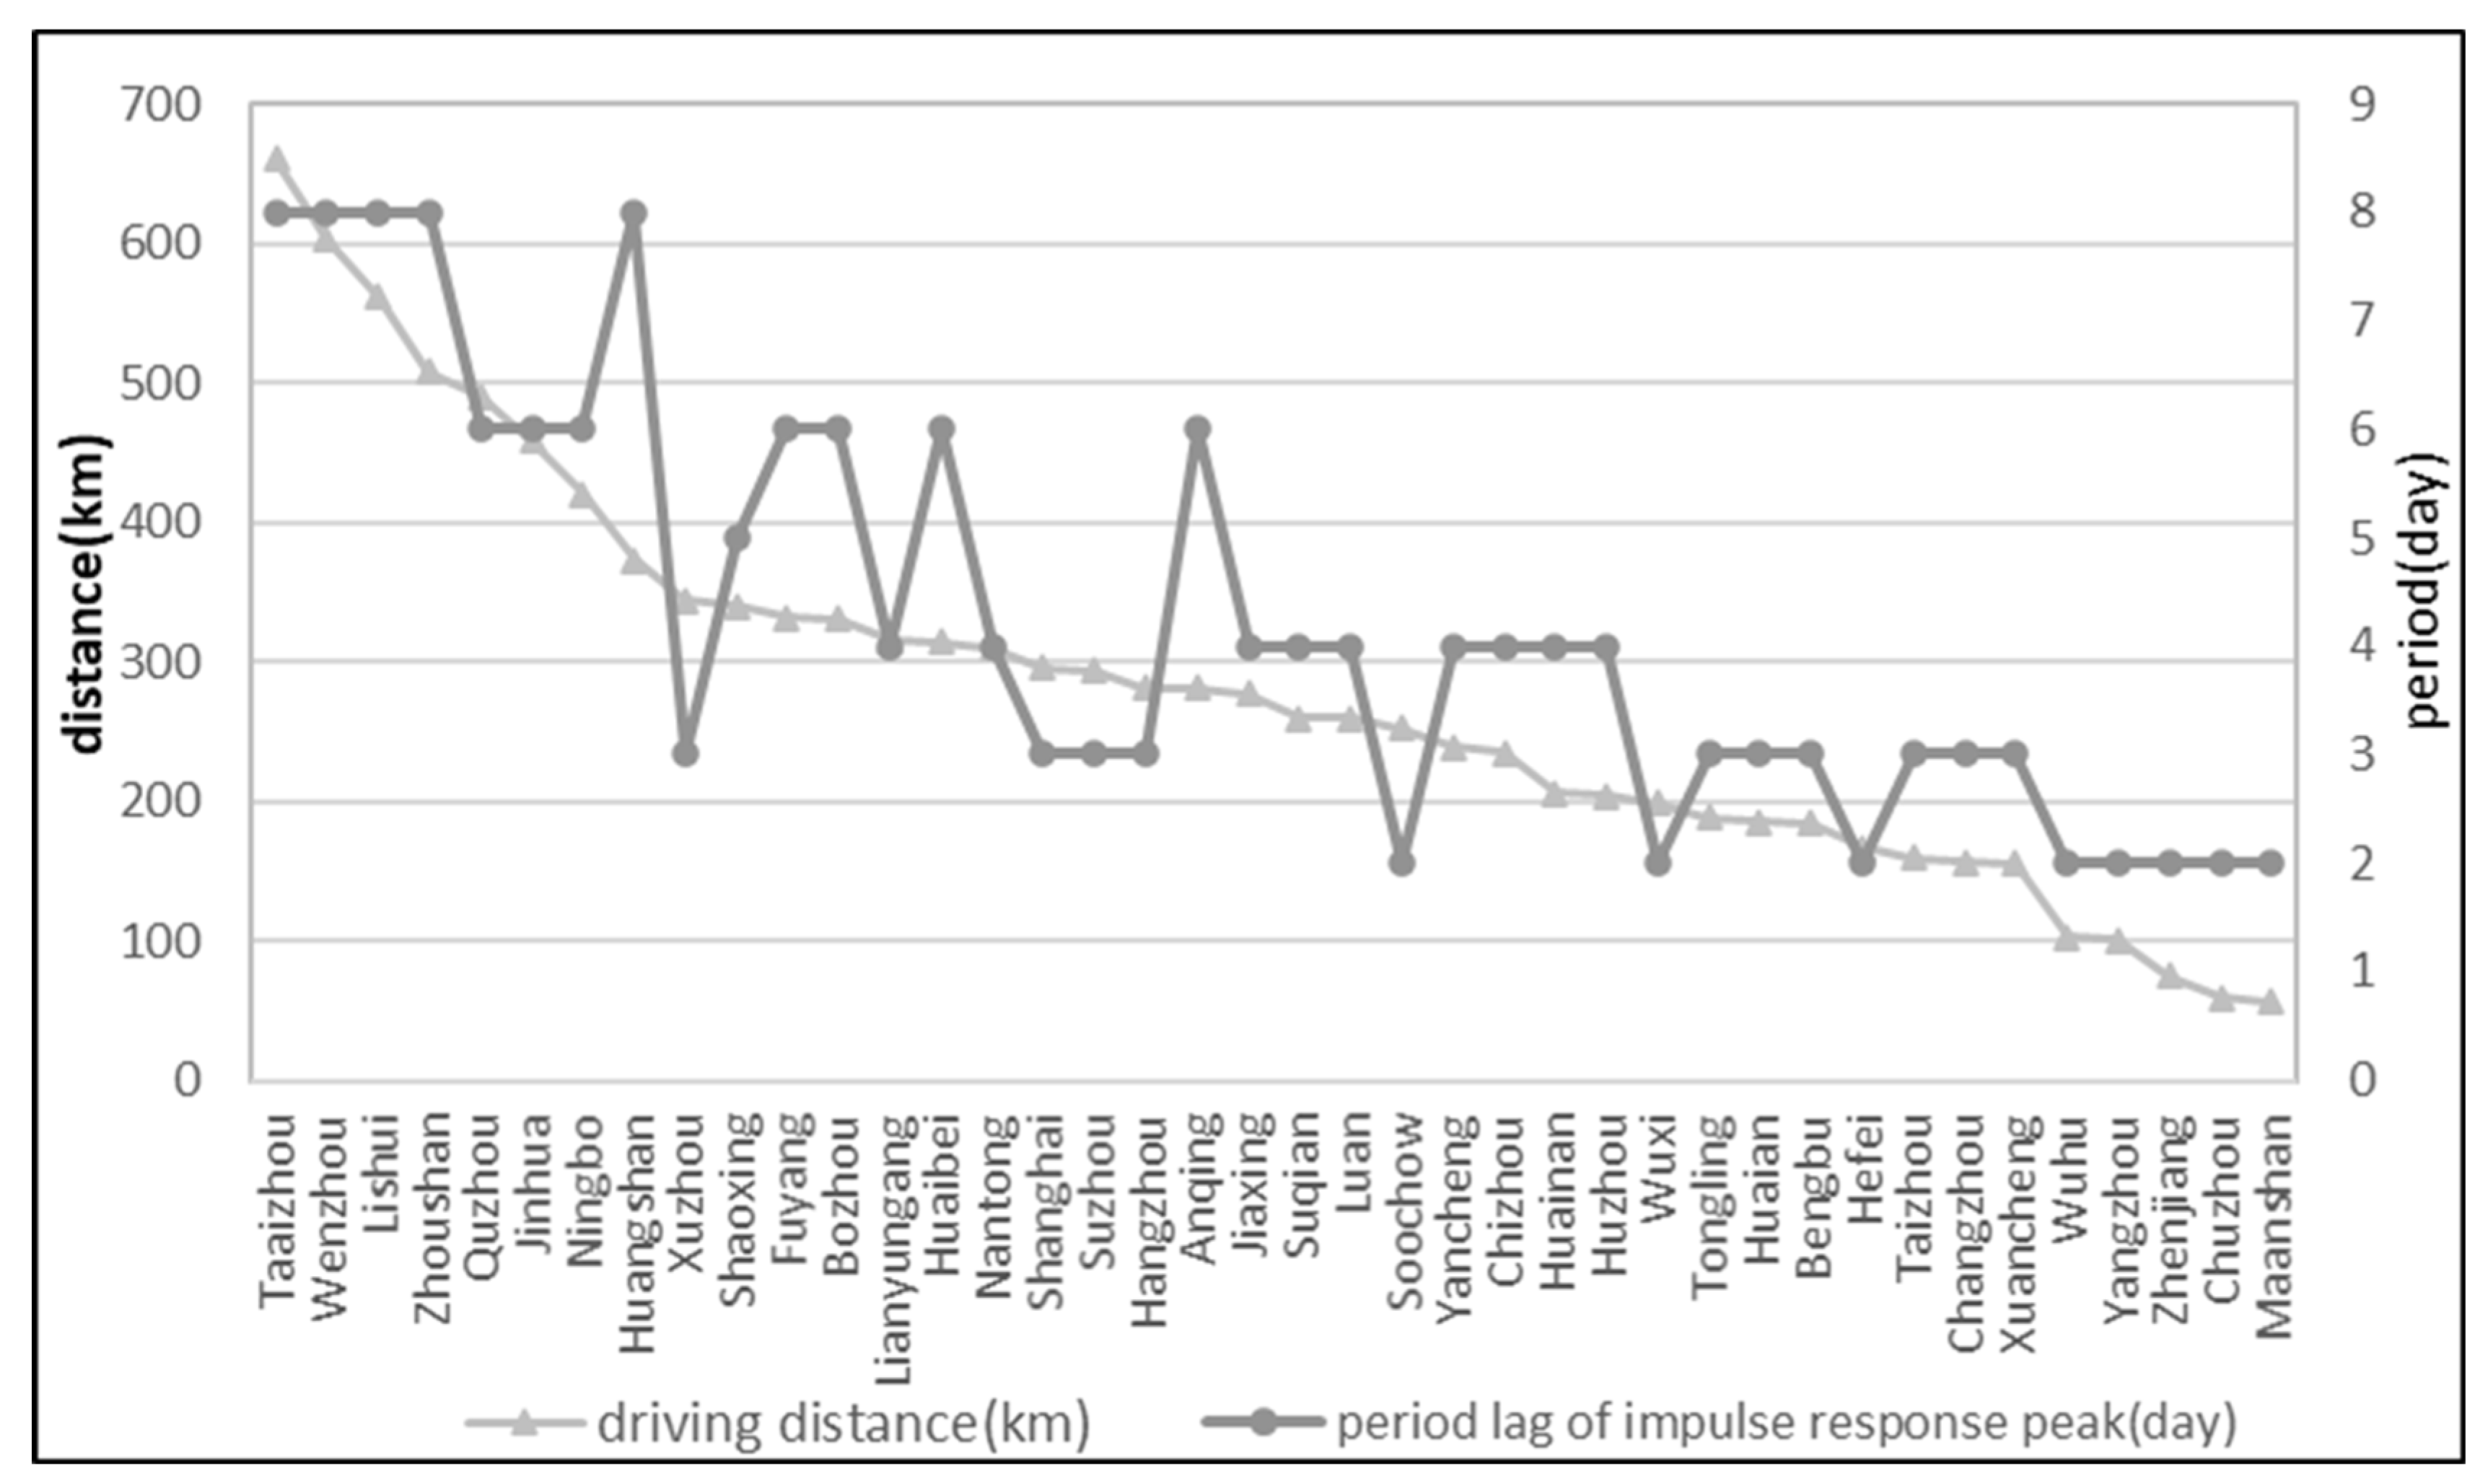
Using the tourist flow from each city as a dependent variable, a standard deviation of random disturbances was applied by corresponding SVI [60]. The peak period in the impulse response figure indicates the precursory duration of SVI (Figure 4). The peak period of visitor volume response to the SVI was 2–8 days in the 40 cities of the Yangtze River Delta region, showing that tourists generally search for tourist information 2–8 days before arriving at the picturesque place. For example, tourists from 12 cities in Jiangsu Province search for information 2–4 days before arriving at the picturesque area. The antecedent time is shorter than that of tourists from other provinces. Tourists from Zhejiang Province often search for tourist information 3–8 days before arriving at the scenic area.
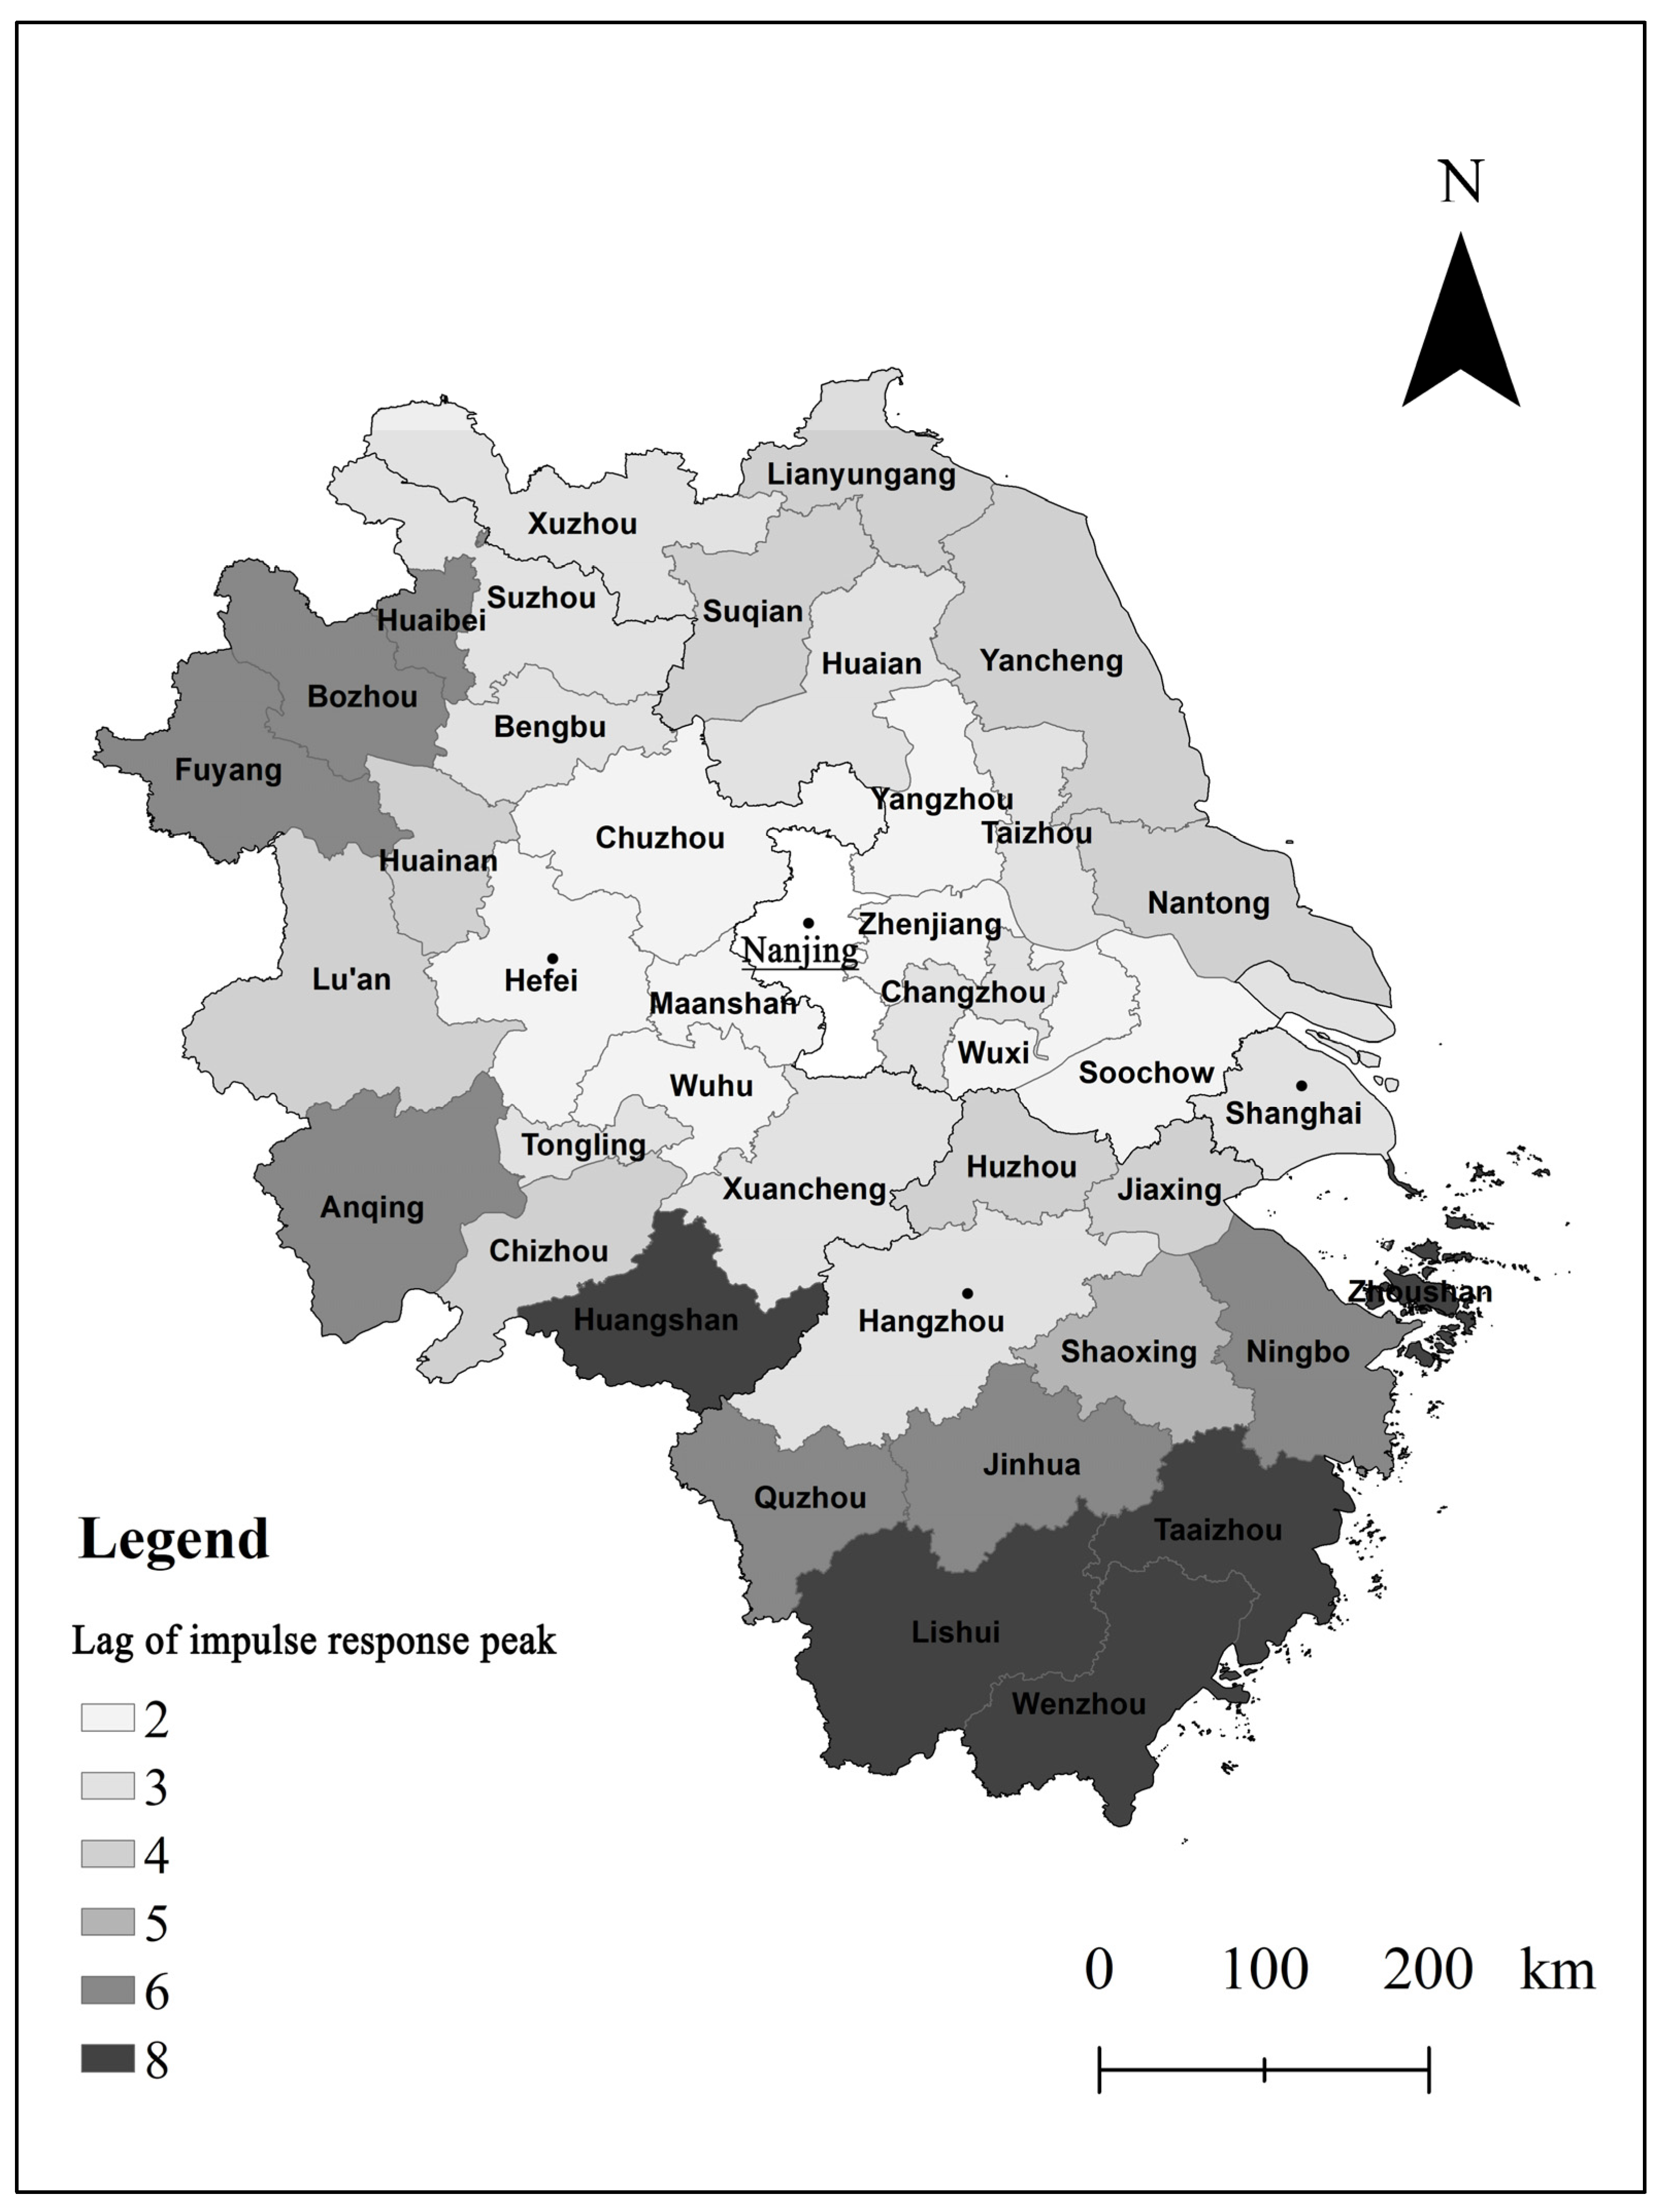
The spatial distribution map of online tourist search lead days (Figure 5) revealed a clear dispersion of urban visitors within 150 km of Nanjing, including Maanshan, Changzhou, and Wuhu in Anhui Province, and Zhenjiang and Yangzhou in Jiangsu Province. Cities 200–250 km apart have provincial-level utility impacts, and the distance affects the sensitivity of the online search time from the province’s source cities. The sensitivity is lower than that of the province’s source cities. For urban travelers, the pre-trip search period of 250–600 km increases with distance. The distance between cities in Zhejiang Province is greater than the distance between cities in Nanjing, and the search time for tourists is between four and eight days.
To further demonstrate how tourist pre-trip seeking features vary with distance, we considered simply the time of arrival of each city in Nanjing as an independent variable (designated as X) and the number of response periods (designated as Y) in each city. A linear regression equation was developed for the correlation (where R = 0.992, the probability of the F statistic is less than 0.05, and the model is significant):
ln(Y) = −2.2685 + 0.0656ln(X)
According to Equation (3), traffic time has a considerable positive effect on the duration of the pre-trip search, with an elasticity coefficient of 0.0656. As a unit’s traffic time increases, so does the search time, which indicates that potential tourists must collect information for an extended period before arriving at the picturesque place.
We observed that SVI, as a precursor, varies with distance but not entirely with driving distance. Zhongshan, Xuzhou, and Suzhou in the Yangtze River Delta’s source markets have only high-speed rail connections to Nanjing in the northern cities (the speed is about twice that of self-driving cars). Soochow, Wuxi, Shanghai, and Hangzhou are hub cities in the Yangtze River Delta tourism traffic network. Transit between these cities and Nanjing is more convenient than transportation between equidistant cities. The lead time of tourist search activity does not alter precisely as physical distance increases but rather represents the integrated distance. We noticed that SVI as a precursor is different for distance but is not entirely for driving distance.

4.3. Application Verification of Precursory Effects

We optimized the prediction of daily tourist volume using the precursory effects and their spatial features mentioned earlier. In this process, we compared the spatial feature optimized VAR model with the traditional ARIMA model.

4.3.1. ARIMA Model

According to the ADF tests, the tourist volume sequence lacked a unit root and was a smooth time series. Thus, the ARIMA(p,d,q) model’s parameter ‘d’ was set to 0. Due to trailing phenomena in the autocorrelation function (ACF) and partial correlation function (PACF) diagrams of the tourist volume sequence, the ARMA (p,q) model was constructed. We increased the lag duration to obtain a more accurate prediction model and compared the AIC, SC, and residual sequence correlation of p and q for numerous parameters. When p = 6 and q = 5, the AIC and SC values for the model were the smallest, and the residual sequence was unrelated. The best estimate model for daily tourist volume ( V F a r m a ) using ARMA (6, 5) was built, yielding the following estimated results:
V F a r m a = i = 1 6 A R i Z Y i + i = 1 5 M A i ε i + C
The goodness of fit for Equation (4) is 0.7124; the AIC is 21.561; the SC is 20.483; and the reciprocal of the AR model roots are 0.87, 0.25 − 0.21i, 2.25 + 0.21i, and −0.33 + 0.88i, respectively, with −0.33 − 0.88i, −0.08 − 0.54i, and −0.08 + 0.54i within the unit circle. The daily tourist volume forecast’s root mean square error (RMSE) was 5077.382 for the sample period.

4.3.2. Vector Autoregressive Model

According to the Equation, the response lag period of visitor volume to network search consists of six situations (1). We created a VAR estimating model for KL-2 and BD-2 and received the following expected results by setting the lag period to 2:
Y t = 25.98   0.23   0.11   1.53   Y t 1 + 7.52   0.18     0.37   20.73   Y t 2 + ε t   ; Y t = K L 2   B D 2  
Y t = K L 2   B D 2    
Then, using a VAR estimating model for KL-3 and BD-3 and a lag period of 3, we obtained the estimated values as follows:
Y t =   45.76   1.44   0.22   15.23   Y t 1 +   23.47   0.33   4.92   12.62   Y t 2 + 11.12   30.58     4.02   25.26   Y t 3 + ε t   ;
    Y t = K L 3   B D 3  
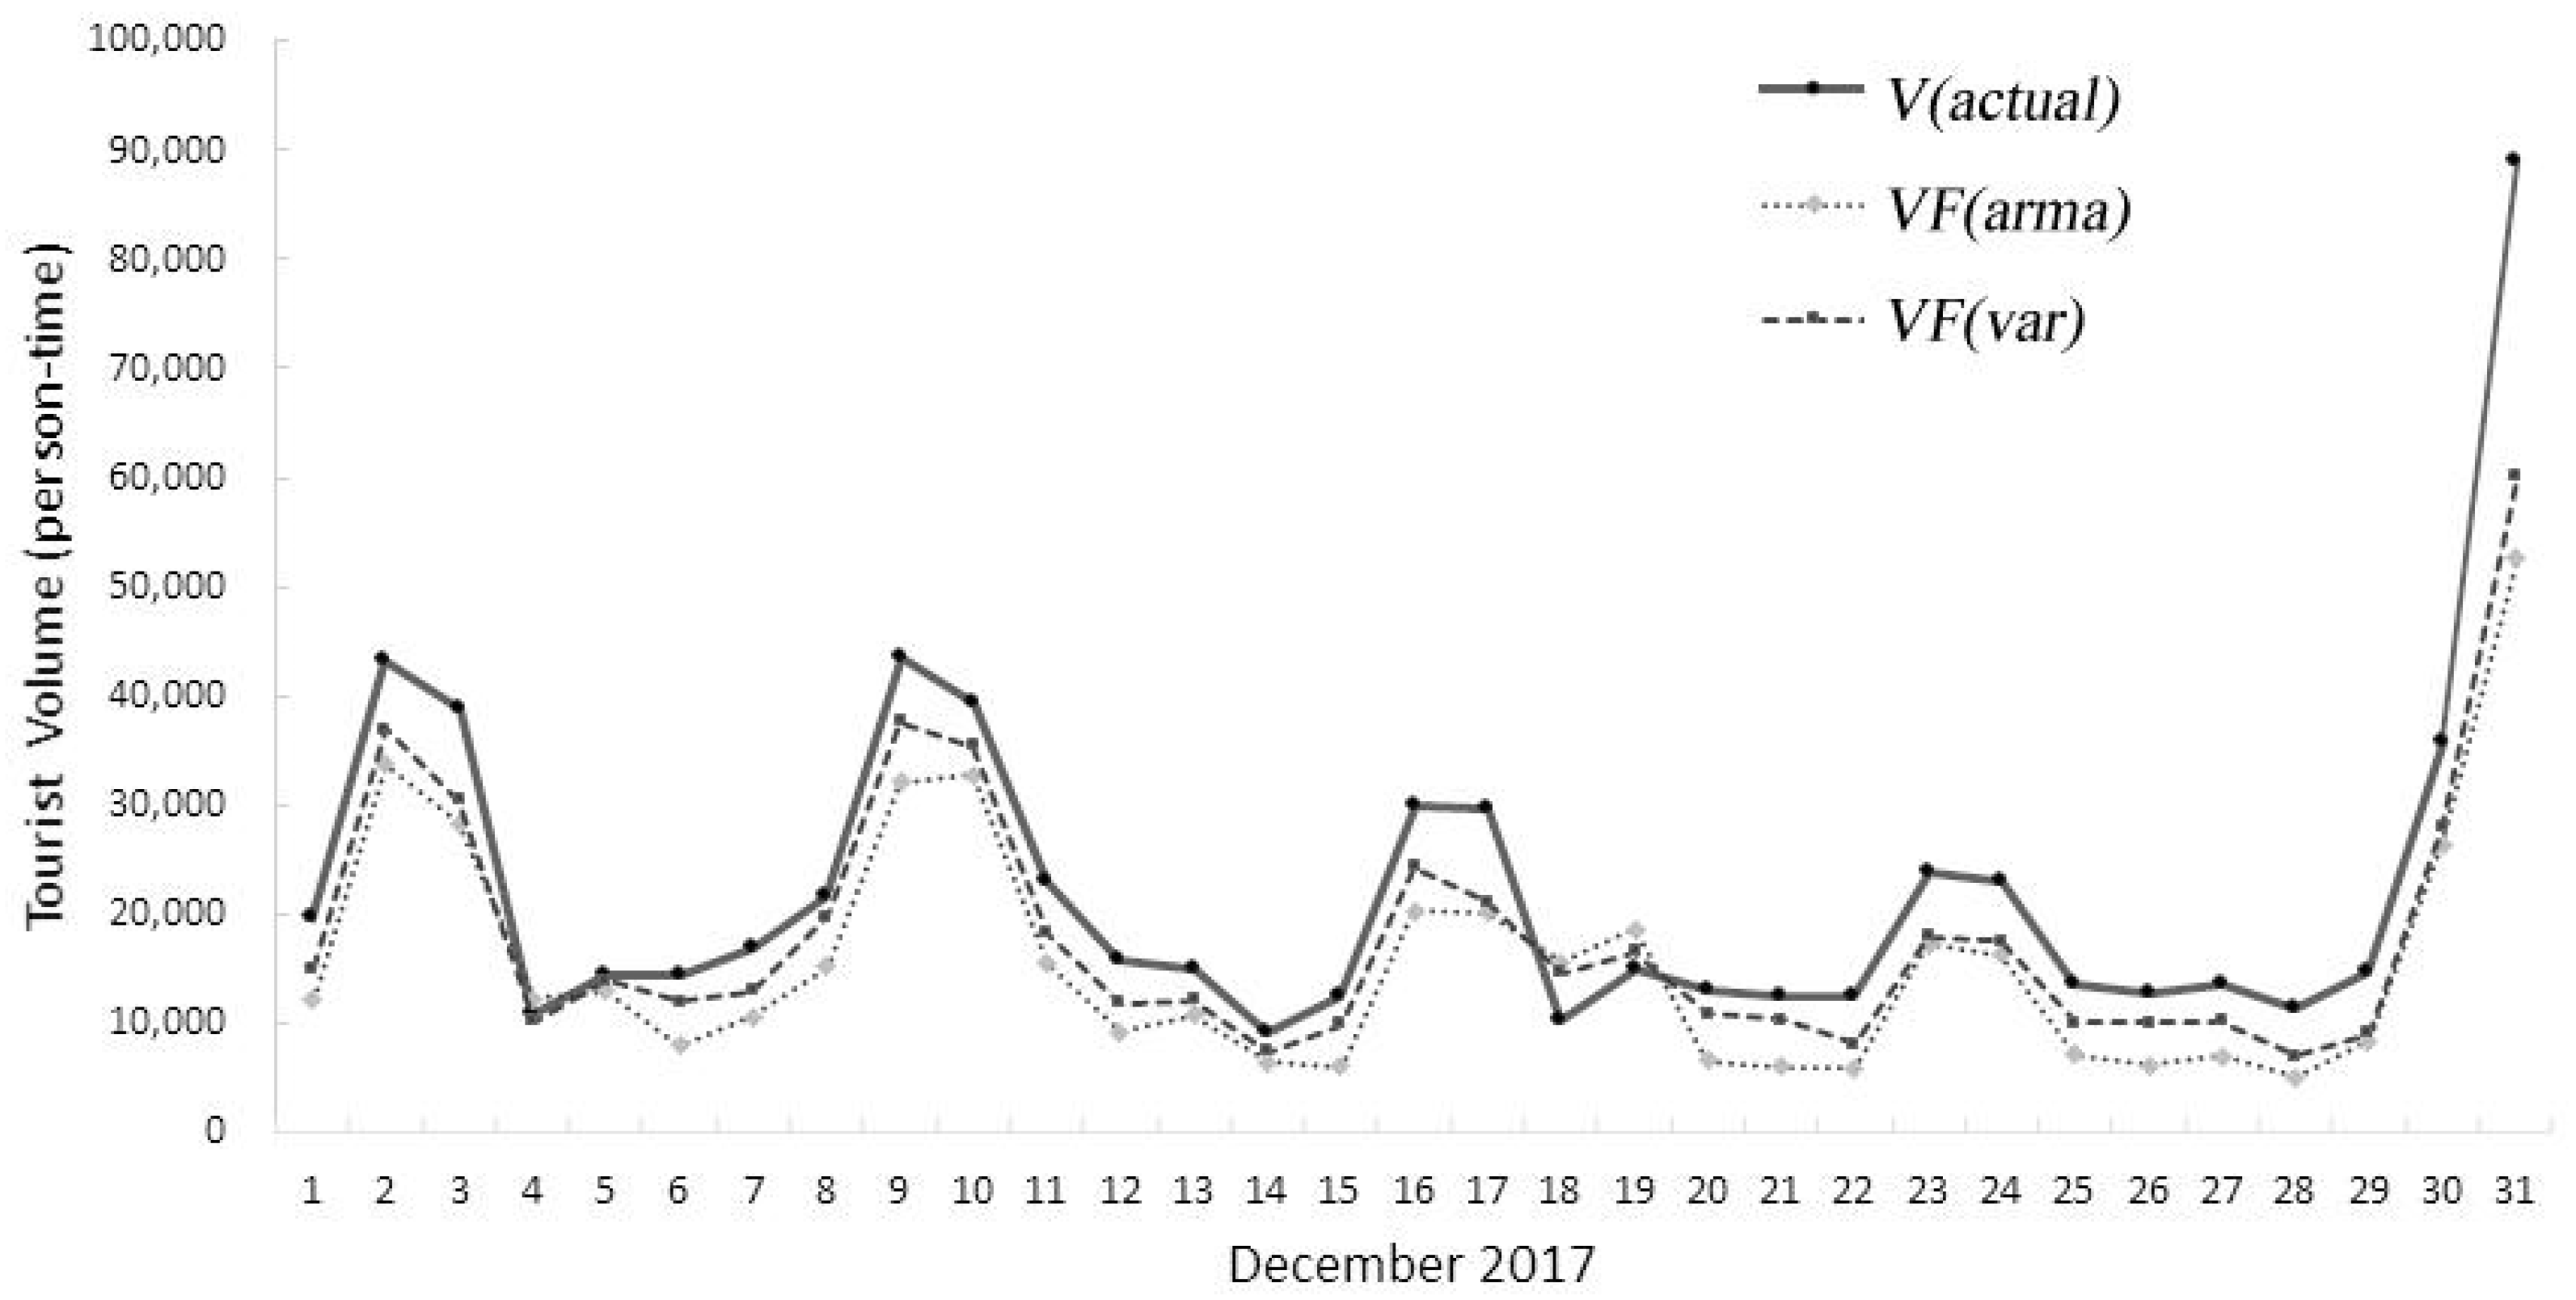
We constructed daily tourist volume estimate formulae for cities that lag behind by 4, 5, 6, and 8 days and then added the tourist volume from each source city in Zhongshan to obtain the total estimated tourist volume (VFvar). After forecasting tourist volume using Equations (1) and (2), the root mean square error (RMSE) of the prediction result was determined to be 4158.382, which is less than the ARMA model. The tourist volume outside the sample in December 2017 was forecast to further assess the VAR model’s forecasting power. Figure 6 illustrates the prediction results and the actual tourist volume. V is the actual number of tourists, while VF denotes the ARMA and VAR model forecast results, respectively. The VAR model’s predicted value was closer to the actual value, and the RMSE of the forecasted data for the inspection period was 3414.48, which is less than the ARMA model without SVI (4271.85). Therefore, the VAR model optimized based on spatiotemporal patterns is generally more predictable.

5. Conclusions

Cyberspace interacts with physical worlds on a spatial and material level [64]. On the internet, time and distance do not vanish but are recreated and reflected in geo-cyberspace [65]. This study examined online information search behavior by examining the spatial-temporal interactions between the pre-trip and post-arrival stages. The spatial-temporal link between multivariate models was investigated. In comparison to a previous study on the characteristics of China’s domestic pre-tour searching behavior [48,54], this paper quantified the length of tourist flow lags as distance increased for different cities ranging from 1 to 8. By investigating the spatial-temporal interactions between the pre-trip stage and the after-arrival stage, this paper uncovered the temporal and spatial deviations of pre-trip searching and validated their potential application in tourism forecasting, making an original contribution to the study of online information search behavior.
The contributions of this study are manifold. Predictability and interpretability were the focus of this study. Firstly, we attempted to integrate time and space into a tourism demand forecasting model. Few attempts have been made to deduce the information search flow’s time-space features. Previous research has utilized this indicator to forecast destinations. However, this method ignores the tourism market’s internal spatial-temporal variation [57]. Using cellular signaling monitoring and search engine data from big data platforms, we investigated the temporal and spatial differentiation of visitors’ TIS. A time and accuracy-optimized approach was proposed for forecasting tourist volume from many sources. Compared to the existing research results, the model constructed in this paper has wider usability.
Secondly, our research proposed a new method for predicting daily visitor numbers at tourist attractions based on accurate data from mobile roaming data and search engines. At the same time, we integrated a variety of research methods, making the research results more general and scalable and allowing for more accurate tourism forecasting models. We used the Zhongshan Scenic Area in Nanjing as a case study to examine daily tourist flow and SVI data in 40 Yangtze River Delta source cities over 640 days. The Granger causality test, the VAR model, and the impulse response function were used to determine the geographical distribution disparities between nearby source cities, web search data, and the spatiotemporal connection between tourist flow and SVI. Finally, using these correlations, we used ARMA and VAR models to forecast tourist arrivals in a scenic location. We finish by saying the following:
First, tourist volume and SVI from source cities demonstrate attenuation due to distance. There is a direct correlation between tourist volume and SVI daily statistics. That is to say, SVI is predictive of changes in visitor numbers. According to Buhalis, search engines are the first choice for families to collect information when making travel plans, and SVIs can be used as an important indicator for the destination prediction of tourist behavior [66]. Among the source area, tourists from major source cities are the main predictive of SVI.
Second, when traffic time increases spatially, the precursory time for tourists’ online searches increases. The SVI results on the lead time for changes in tourist flow can be interpreted as the time required for tourists to gather knowledge prior to traveling in order to acquire various search behavior characteristics based on spatial cognition. For example, tourist search query data about “hotels and flights” can significantly improve the forecast accuracy of local tourist numbers [29]. Additionally, it demonstrates that travelers traveling across short distances spend less time preparing for information than long distances.
Finally, the prediction model developed using the spatial-temporal differentiation of search features exhibits high predictability. The forecasting model for scenic tourist flow that incorporates SVI is more accurate than the classic time series forecasting model that does not incorporate SVI. It is capable of estimating the inter-daily tourist volume, which is critical for monitoring and managing the tourist flow in the scenic site.
Thus, when monitoring the tourist volume, the tourist destination can choose the best way to control the tourist volume and disseminate information according to the tourist search behavior pattern in the past [67]. At the same time, travel agencies and destination management organizations (DMOs) should narrow the gap between travel intentions and actual arrivals to improve the destination’s capacity to manage tourist flows and promote the healthy and sustainable development of destinations. These insights can be used to improve the accuracy of tourism advertisements and their efficacy. In terms of future research implications, we can select additional prediction models based on the particular spatial-temporal correlations between tourist volume and SVI at the city and daily scales, hence optimizing forecast accuracy rather than at the country and monthly scales. Additionally, a prospective tourist from a variety of cities may be interested in a variety of factors during their pre-trip research, such as scenery or service facilities. Spatial and temporal differentiation is a vital task that requires further investigation.

6. Limitations

The regional disparities in online search prior to tourist visits, on the other hand, show the statistical association between overall search results and visitor volume in the research. Although we analyzed the tourist flow and SVI data among 40 cities in the Yangtze River Delta, it is possible to continue investigating the longer distance source or even international tourist flow. In addition, only the effect of the traffic time variable on the relationship between SVI and tourist flow was studied to investigate the influencing elements of the temporal coupling relationship between SVI and tourist flow.
Moreover, in the post-epidemic era, the importance of web search has been revealed. Thus, the spatial-temporal pattern alterations in the post-COVID-19 era must be monitored in the future.

Author Contributions

Conceptualization, P.L. and J.Z. (Jianxin Zhang); methodology, L.M.; data curation, P.L.; writing—original draft preparation, L.M.; writing—review and editing, P.L. and J.Z. (Jinyue Zhang); visualization, Y.Y.; supervision, P.L.; project administration, P.L.; funding acquisition, P.L. and J.Z. (Jianxin Zhang). All authors have read and agreed to the published version of the manuscript.

Funding

This research was funded by the National Natural Science Foundation of China (Award No. 42001145 to Peixue Liu) and MOE (Ministry of Education in China) Project of Humanities and Social Sciences (Award No. 22YJA760106 to Jianxin Zhang).

Institutional Review Board Statement

This study does not involve human subjects or animals. Therefore, no Institutional Review Board approval was required.

Informed Consent Statement

All participants provided informed consent prior to their participation in this study. They were provided with detailed information about the study objectives, procedures, potential risks, and benefits, and they voluntarily agreed to participate.

Data Availability Statement

Not available to the public. The data presented in this study are available only on reasonable request from the corresponding author.

Acknowledgments

The authors would like to appreciate the anonymous reviewers for their insightful comments and suggestions.

Conflicts of Interest

The authors declare no conflict of interest.

Appendix A

Table A1. Granger causality test results.
Granger CausalityFp Value Granger CausalityFp Value
JS-SZBD ∕→ JS-SZY3.02420.0264JS-TZY ∕→ JS-TZBD2.37280.1817
JS-SZBD ∕→ JS-SZY3.87210.0305JS-TZBD ∕→ JS-TZY3.36430.0394
JS-WXY ∕→ JS-WXBD2.39360.0277JS-SQY ∕→ JS-SQBD2.48240.1134
JS-WXBD ∕→ JS-WXY2.40240.0219JS-SQBD ∕→ JS-SQY1.72160.0341
JS-ZJY ∕→ JS-ZJBD1.99470.1313JS-YCY ∕→ JS-YCBD1.99850.0972
JS-ZJBD ∕→ JS-ZJY3.62850.0211JS-YCBD ∕→ JS-YCY3.38450.0133
JS-CZY ∕→ JS-CZBD1.33230.1633JS-HAY ∕→ JS-HABD1.47350.07937
JS-CZBD ∕→ JS-CZY3.38240.0216JS-HABD ∕→ JS-HAY3.26780.0482
JS-NTY ∕→ JS-NTBD1.78340.0749JS-LYGY ∕→ JS-LYGBD2.55710.1113
JS-NTBD ∕→ JS-NTY3.62960.0137JS-LYGBD ∕→ JS-LYGY3.47370.0081
JS-YZY ∕→ JS-YZBD3.37210.0831JS-XZY ∕→ JS-XZBD1.08900.0213
JS-YZBD ∕→ JS-YZY4.00130.0125JS-XZBD ∕→ JS-XZY2.93860.0050
AH-CZY ∕→ AH-CZBD4.11270.0721AH-HNY ∕→ AH-HNBD4.20780.0538
AH-CZBD ∕→ AH-CZY4.33820.0031AH-HNBD ∕→ AH-HNY4.36810.0120
AH-MASY ∕→ AH-MASBD4.32970.1772AH-HBY ∕→ AH-HBBD4.29760.0900
AH-MASBD ∕→ AH-MASY4.40190.0043AH-HBBD ∕→ AH-HBY4.31740.0087
AH-WHY ∕→ AH-WHBD3.97820.1522AH-BZY ∕→ AH-BZBD4.39330.1103
AH-WHBD ∕→ AH-WHY4.19730.0381AH-BZBD ∕→ AH-BZY3.89620.0064
AH-HFY ∕→ AH-HFBD4.32150.0226AH-FYY ∕→ AH-FYBD3.58560.1074
AH-HFBD ∕→ AH-HFY3.78290.0097AH-FYBD ∕→ AH-FYY4.62740.0048
AH-XCY ∕→ AH-XCBD3.77510.1030AH-AQY ∕→ AH-AQBD3.98560.0937
AH-XCBD ∕→ AH-XCY4.39700.0042AH-AQBD ∕→ AH-AQY3.87750.0219
AH-BBY ∕→ AH-BBBD3.58230.0830AH-LAY ∕→ AH-LABD4.02940.1143
AH-BBBD ∕→ AH-BBY3.85920.0052AH-LABD ∕→ AH-LAY4.13950.0005
AH-SZY ∕→ AH-SZBD4.01730.0077AH-CZY ∕→ AH-CZBD3.94020.1047
AH-SZBD ∕→ AH-SZY4.11960.0036AH-CZBD ∕→ AH-CZY3.68440.0031
AH-TLY ∕→ AH-TLBD3.89250.0823AH-HS ∕→ AH-HSBD4.11860.2901
AH-TLBD ∕→ AH-TLY4.31680.0271AH-HSBD ∕→ AH-HS4.39210.0048
ZJ-HZY ∕→ ZJ-HZBD3.01210.0038ZJ-JHY ∕→ ZJ-JHBD3.06420.1031
ZJ-HZBD ∕→ ZJ-HZY3.07930.0029ZJ-JHBD ∕→ ZJ-JHY2.99410.0002
ZJ-hzY ∕→ ZJ-hzBD2.99470.1125ZJ-NBY ∕→ ZJ-NBBD2.87490.0036
ZJ-hzBD ∕→ ZJ-hzY3.11850.0038ZJ-NBBD ∕→ ZJ-NBY2.99510.0047
ZJ-JXY ∕→ ZJ-JXBD3.02750.0921ZJ-ZSY ∕→ ZJ-ZSBD3.06250.0722
ZJ-JXBD ∕→ ZJ-JXY2.99520.0089ZJ-ZSBD ∕→ ZJ-ZSY3.04310.0311
ZJ-SXY ∕→ ZJ-SXBD2.98750.0802ZJ-TZY ∕→ ZJ-TZBD2.97420.0814
ZJ-SXBD ∕→ ZJ-SXY3.01740.0044ZJ-TZBD ∕→ ZJ-TZY2.98730.0207
ZJ-QZY ∕→ ZJ-QZBD3.02930.0723ZJ-WZY ∕→ ZJ-WZBD3.06160.0563
ZJ-QZBD ∕→ ZJ-QZY2.99810.0117ZJ-WZBD ∕→ ZJ-WZY2.89790.0081
ZJ-LSY ∕→ ZJ-LSBD3.07830.0824SHY ∕→ SHBD3.78260.0041
ZJ-LSBD ∕→ ZJ-LSY2.94330.0307SHBD ∕→ SHY3.57410.0003
Notes: The null hypothesis test, H0: A B, implies ‘xt does not cause yt’.

References

  1. Yang, X.; Pan, B.; Evans, J.A.; Lv, B. Forecasting Chinese tourist volume with search engine data. Tour. Manag. 2015, 46, 386–397. [Google Scholar] [CrossRef]
  2. Xu, J.; Qiao, G.; Hou, S. Exploring factors influencing travel information-seeking intention on short video platforms. Curr. Issues Tour. 2022. [Google Scholar] [CrossRef]
  3. Vong, F. Application of cultural tourist typology in a gaming destination—Macao. Curr. Issues Tour. 2016, 19, 949–965. [Google Scholar] [CrossRef]
  4. Tavitiyaman, P.; Qu, H.; Tsang, W.-S.L.; Lam, C.-W.R. The influence of smart tourism applications on perceived destination image and behavioral intention: The moderating role of information search behavior. J. Hosp. Tour. Manag. 2021, 46, 476–487. [Google Scholar] [CrossRef]
  5. Pop, R.-A.; Saplacan, Z.; Dabija, D.-C.; Alt, M.-A. The impact of social media influencers on travel decisions: The role of trust in consumer decision journey. Curr. Issues Tour. 2022, 25, 823–843. [Google Scholar] [CrossRef]
  6. Liu, P.; Zhang, H.; Zhang, J.; Sun, Y.; Qiu, M. Spatial-temporal response patterns of tourist flow under impulse pre-trip information search: From online to arrival. Tour. Manag. 2019, 73, 105–114. [Google Scholar] [CrossRef]
  7. Li, H.; Zhang, L.; Hsu, C.H.C. Research on user-generated photos in tourism and hospitality: A systematic review and way forward. Tour. Manag. 2023, 96, 104714. [Google Scholar] [CrossRef]
  8. Li, J.; Xu, L.; Tang, L.; Wang, S.; Li, L. Big data in tourism research: A literature review. Tour. Manag. 2018, 68, 301–323. [Google Scholar] [CrossRef]
  9. Li, M.; Zhang, C.; Sun, S.; Wang, S. A novel deep learning approach for tourism volume forecasting with tourist search data. Int. J. Tour. Res. 2022, 25, 183–197. [Google Scholar] [CrossRef]
  10. Huang, B.; Hao, H. A novel two-step procedure for tourism demand forecasting. Curr. Issues Tour. 2021, 24, 1199–1210. [Google Scholar] [CrossRef]
  11. Schneider, M.J.; Gupta, S. Forecasting sales of new and existing products using consumer reviews: A random projections approach. Int. J. Forecast. 2016, 32, 243–256. [Google Scholar] [CrossRef]
  12. Li, H.; Hu, M.; Li, G. Forecasting tourism demand with multisource big data. Ann. Tour. Res. 2020, 83, 102912. [Google Scholar] [CrossRef]
  13. Bi, J.-W.; Liu, Y.; Li, H. Daily tourism volume forecasting for tourist attractions. Ann. Tour. Res. 2020, 83, 102923. [Google Scholar] [CrossRef]
  14. Liu, A.; Lin, V.S.; Li, G.; Song, H. Ex Ante Tourism Forecasting Assessment. J. Travel Res. 2020, 61, 64–75. [Google Scholar] [CrossRef]
  15. Silva, E.S.; Hassani, H.; Heravi, S.; Huang, X. Forecasting tourism demand with denoised neural networks. Ann. Tour. Res. 2019, 74, 134–154. [Google Scholar] [CrossRef]
  16. Hu, M.; Song, H. Data source combination for tourism demand forecasting. Tour. Econ. 2019, 26, 1248–1265. [Google Scholar] [CrossRef]
  17. Ma, S.; Yang, S. COVID-19 forecasts using Internet search information in the United States. Sci. Rep. 2022, 12, 11539. [Google Scholar] [CrossRef]
  18. Sun, S.; Wei, Y.; Tsui, K.-L.; Wang, S. Forecasting tourist arrivals with machine learning and internet search index. Tour. Manag. 2019, 70, 1–10. [Google Scholar] [CrossRef]
  19. Dergiades, T.; Mavragani, E.; Pan, B. Google Trends and tourists’ arrivals: Emerging biases and proposed corrections. Tour. Manag. 2018, 66, 108–120. [Google Scholar] [CrossRef]
  20. Moehring, M.; Keller, B.; Schmidt, R.; Dacko, S. Google Popular Times: Towards a better understanding of tourist customer patronage behavior. Tour. Rev. 2021, 76, 553–569. [Google Scholar] [CrossRef]
  21. Raun, J.; Ahas, R.; Tiru, M. Measuring tourism destinations using mobile tracking data. Tour. Manag. 2016, 57, 202–212. [Google Scholar] [CrossRef]
  22. Song, C.; Qu, Z.; Blumm, N.; Barabasi, A.-L. Limits of Predictability in Human Mobility. Science 2010, 327, 1018–1021. [Google Scholar] [CrossRef] [Green Version]
  23. Nilbe, K.; Ahas, R.; Silm, S. Evaluating the Travel Distances of Events Visitors and Regular Visitors Using Mobile Positioning Data: The Case of Estonia. J. Urban Technol. 2014, 21, 91–107. [Google Scholar] [CrossRef]
  24. Gunter, U.; Oender, I. Forecasting international city tourism demand for Paris: Accuracy of uni- and multivariate models employing monthly data. Tour. Manag. 2015, 46, 123–135. [Google Scholar] [CrossRef]
  25. Liu, H.; Liu, W.; Wang, Y. A Study On The Influencing Factors Of Tourism Demand From Mainland China To Hong Kong. J. Hosp. Tour. Res. 2021, 45, 171–191. [Google Scholar] [CrossRef]
  26. Hyde, K.F. Information processing and touring planning theory. Ann. Tour. Res. 2008, 35, 712–731. [Google Scholar] [CrossRef]
  27. Tang, L.; Zhang, C.; Li, T.; Li, L. A novel BEMD-based method for forecasting tourist volume with search engine data. Tour. Econ. 2021, 27, 1015–1038. [Google Scholar] [CrossRef]
  28. Bakirtas, H.; Demirci, V.G. Can Google Trends data provide information on consumer’s perception regarding hotel brands? Inf. Technol. Tour. 2022, 24, 57–83. [Google Scholar] [CrossRef]
  29. Bangwayo-Skeete, P.F.; Skeete, R.W. Can Google data improve the forecasting performance of tourist arrivals? Mixed-data sampling approach. Tour. Manag. 2015, 46, 454–464. [Google Scholar] [CrossRef]
  30. Jani, D.; Jang, J.-H.; Hwang, Y.-H. Big Five Factors of Personality and Tourists’ Internet Search Behavior. Asia Pac. J. Tour. Res. 2014, 19, 600–615. [Google Scholar] [CrossRef]
  31. Ni, J.; Rhim, A.H.R.; Chiu, D.K.W.; Ho, K.K.W. Information search behavior among Chinese self-drive tourists in the smartphone era. Inf. Discov. Deliv. 2022, 50, 285–296. [Google Scholar] [CrossRef]
  32. Huertas, A.; Miguel, O.-M. Do tourists seek the same information at destinations? Analysis of digital tourist information searches according to different types of tourists. Eur. J. Tour. Res. 2022, 32, 3211. [Google Scholar] [CrossRef]
  33. Xie, G.; Li, X.; Qian, Y.; Wang, S. Forecasting tourism demand with KPCA-based web search indexes. Tour. Econ. 2021, 27, 721–743. [Google Scholar] [CrossRef]
  34. Li, X.; Wu, Q.; Peng, G. Tourism forecasting by search engine data with noise-processing. Afr. J. Bus. Manag. 2016, 10, 114–130. [Google Scholar] [CrossRef] [Green Version]
  35. Fernandez-Cavia, J.; Vinyals-Mirabent, S.; Fernandez-Planells, A.; Weber, W.; Pedraza-Jimenez, R. Tourist information sources at different stages of the travel experience. Prof. De La Inf. 2020, 29, e290219. [Google Scholar] [CrossRef]
  36. Bausch, T.; Gartner, W.C.; Humpe, A. How weather conditions affect guest arrivals and duration of stay: An alpine destination case. Int. J. Tour. Res. 2021, 23, 1006–1026. [Google Scholar] [CrossRef]
  37. Wang, S.; Yu, Y.; Chen, J.; Liu, J. Impact of climate change on cherry blossom viewing tourism: Analysis and simulation based on Weibo proxy data. Curr. Issues Tour. 2023, 26, 718–734. [Google Scholar] [CrossRef]
  38. Bi, J.-W.; Han, T.-Y.; Yao, Y. Collaborative forecasting of tourism demand for multiple tourist attractions with spatial dependence: A combined deep learning model. Tour. Econ. 2023. [Google Scholar] [CrossRef]
  39. Wickramasinghe, K.; Ratnasiri, S. The role of disaggregated search data in improving tourism forecasts: Evidence from Sri Lanka. Curr. Issues Tour. 2021, 24, 2740–2754. [Google Scholar] [CrossRef]
  40. Li, Y.; Li, Y.; Li, J.; Ma, S.; Gao, P. Tourism demand forecasting from the perspective of mobility: A brand-new predictive variable generated from intercity population mobility big data. Asia Pac. J. Tour. Res. 2022, 27, 526–546. [Google Scholar] [CrossRef]
  41. Zhu, L.; Lim, C.; Xie, W.; Wu, Y. Modelling tourist flow association for tourism demand forecasting. Curr. Issues Tour. 2018, 21, 902–916. [Google Scholar] [CrossRef]
  42. Claveria, O.; Torra, S. Forecasting tourism demand to Catalonia: Neural networks vs. time series models. Econ. Model. 2014, 36, 220–228. [Google Scholar] [CrossRef] [Green Version]
  43. Saba, T.; Shahzad, M.N.; Iqbal, S.; Rehman, A.; Abunadi, I. A New Hybrid SARFIMA-ANN Model for Tourism Forecasting. Cmc-Comput. Mater. Contin. 2022, 71, 4785–4801. [Google Scholar] [CrossRef]
  44. Chen, R.; Liang, C.-Y.; Hong, W.-C.; Gu, D.-X. Forecasting holiday daily tourist flow based on seasonal support vector regression with adaptive genetic algorithm. Appl. Soft Comput. 2015, 26, 435–443. [Google Scholar] [CrossRef]
  45. Chen, X.; Cong, D. Application of Improved Algorithm Based on Four-Dimensional ResNet in Rural Tourism Passenger Flow Prediction. J. Sens. 2022, 2022, e9675647. [Google Scholar] [CrossRef]
  46. Kang, J.; Guo, X.; Fang, L.; Wang, X.; Fan, Z. Integration of Internet search data to predict tourism trends using spatial-temporal XGBoost composite model. Int. J. Geogr. Inf. Sci. 2022, 36, 236–252. [Google Scholar] [CrossRef]
  47. Jiao, E.X.; Chen, J.L. Tourism forecasting: A review of methodological developments over the last decade. Tour. Econ. 2019, 25, 469–492. [Google Scholar] [CrossRef]
  48. Liu, Y.-Y.; Tseng, F.-M.; Tseng, Y.-H. Big Data analytics for forecasting tourism destination arrivals with the applied Vector Autoregression model. Technol. Forecast. Soc. Chang. 2018, 130, 123–134. [Google Scholar] [CrossRef]
  49. Park, S.; Lee, J.; Song, W. Short-term forecasting of Japanese tourist inflow to South Korea using Google trends data. J. Travel Tour. Mark. 2017, 34, 357–368. [Google Scholar] [CrossRef]
  50. Hu, T.; Wang, H.; Law, R.; Geng, J. Diverse feature extraction techniques in internet search query to forecast tourism demand: An in-depth comparison. Tour. Manag. Perspect. 2023, 47, 101116. [Google Scholar] [CrossRef]
  51. Gu, X.; Sheng, L.; Lei, C. Specialization or diversification: A theoretical analysis for tourist cities. Cities 2022, 122, 1381–1384. [Google Scholar] [CrossRef]
  52. Zhang, Y.; Li, G.; Muskat, B.; Law, R. Tourism Demand Forecasting: A Decomposed Deep Learning Approach. J. Travel Res. 2021, 60, 981–997. [Google Scholar] [CrossRef]
  53. Yang, Y.; Zhang, H. Spatial-temporal forecasting of tourism demand. Ann. Tour. Res. 2019, 75, 106–119. [Google Scholar] [CrossRef]
  54. Huang, X.; Zhang, L.; Ding, Y. The Baidu Index: Uses in predicting tourism flows -A case study of the Forbidden City. Tour. Manag. 2017, 58, 301–306. [Google Scholar] [CrossRef]
  55. Dai, F.; Wang, D.; Kirillova, K. Travel inspiration in tourist decision making. Tour. Manag. 2022, 90, 104484. [Google Scholar] [CrossRef]
  56. Camacho, M.; Jose Pacce, M. Forecasting travellers in Spain with Google’s search volume indices. Tour. Econ. 2018, 24, 434–448. [Google Scholar] [CrossRef]
  57. Pan, B.; Yang, Y. Forecasting Destination Weekly Hotel Occupancy with Big Data. J. Travel Res. 2017, 56, 957–970. [Google Scholar] [CrossRef] [Green Version]
  58. Li, X.; Law, R. Forecasting Tourism Demand with Decomposed Search Cycles. J. Travel Res. 2020, 59, 52–68. [Google Scholar] [CrossRef]
  59. Hassani, H.; Silva, E.S.; Antonakakis, N.; Filis, G.; Gupta, R. Forecasting accuracy evaluation of tourist arrivals. Ann. Tour. Res. 2017, 63, 112–127. [Google Scholar] [CrossRef]
  60. Gounopoulos, D.; Petmezas, D.; Santamaria, D. Forecasting tourist arrivals in Greece and the impact of macroeconomic shocks from the countries of tourists’ origin. Ann. Tour. Res. 2012, 39, 641–666. [Google Scholar] [CrossRef] [Green Version]
  61. Yao, L.; Ma, R.; Wang, H. Baidu index-based forecast of daily tourist arrivals through rescaled range analysis, support vector regression, and autoregressive integrated moving average. Alex. Eng. J. 2021, 60, 365–372. [Google Scholar] [CrossRef]
  62. Siliverstovs, B.; Wochner, D.S. Google Trends and reality: Do the proportions match? Appraising the informational value of online search behavior: Evidence from Swiss tourism regions. J. Econ. Behav. Organ. 2018, 145, 1–23. [Google Scholar] [CrossRef]
  63. Xie, G.; Qian, Y.; Wang, S. Forecasting Chinese cruise tourism demand with big data: An optimized machine learning approach. Tour. Manag. 2021, 82, 104208. [Google Scholar] [CrossRef]
  64. Huynh-The, T.; Pham, Q.-V.; Pham, X.-Q.; Nguyen, T.T.; Han, Z.; Kim, D.-S. Artificial intelligence for the metaverse: A survey. Eng. Appl. Artif. Intell. 2023, 117, 105581. [Google Scholar] [CrossRef]
  65. Mateos-Minguez, P.; Arranz-Lopez, A.; Soria-Lara, J.A.; Lanzendorf, M. E-shoppers and multimodal accessibility to in-store retail: An analysis of spatial and social effects. J. Transp. Geogr. 2021, 96, 103198. [Google Scholar] [CrossRef]
  66. Buhalis, D. Strategic use of information technologies in the tourism industry. Tour. Manag. 1998, 19, 409–421. [Google Scholar] [CrossRef] [Green Version]
  67. Wang, X.; Zhen, F.; Tang, J.; Shen, L.; Liu, D. Applications, Experiences, and Challenges of Smart Tourism Development in China. J. Urban Technol. 2022, 29, 101–126. [Google Scholar] [CrossRef]
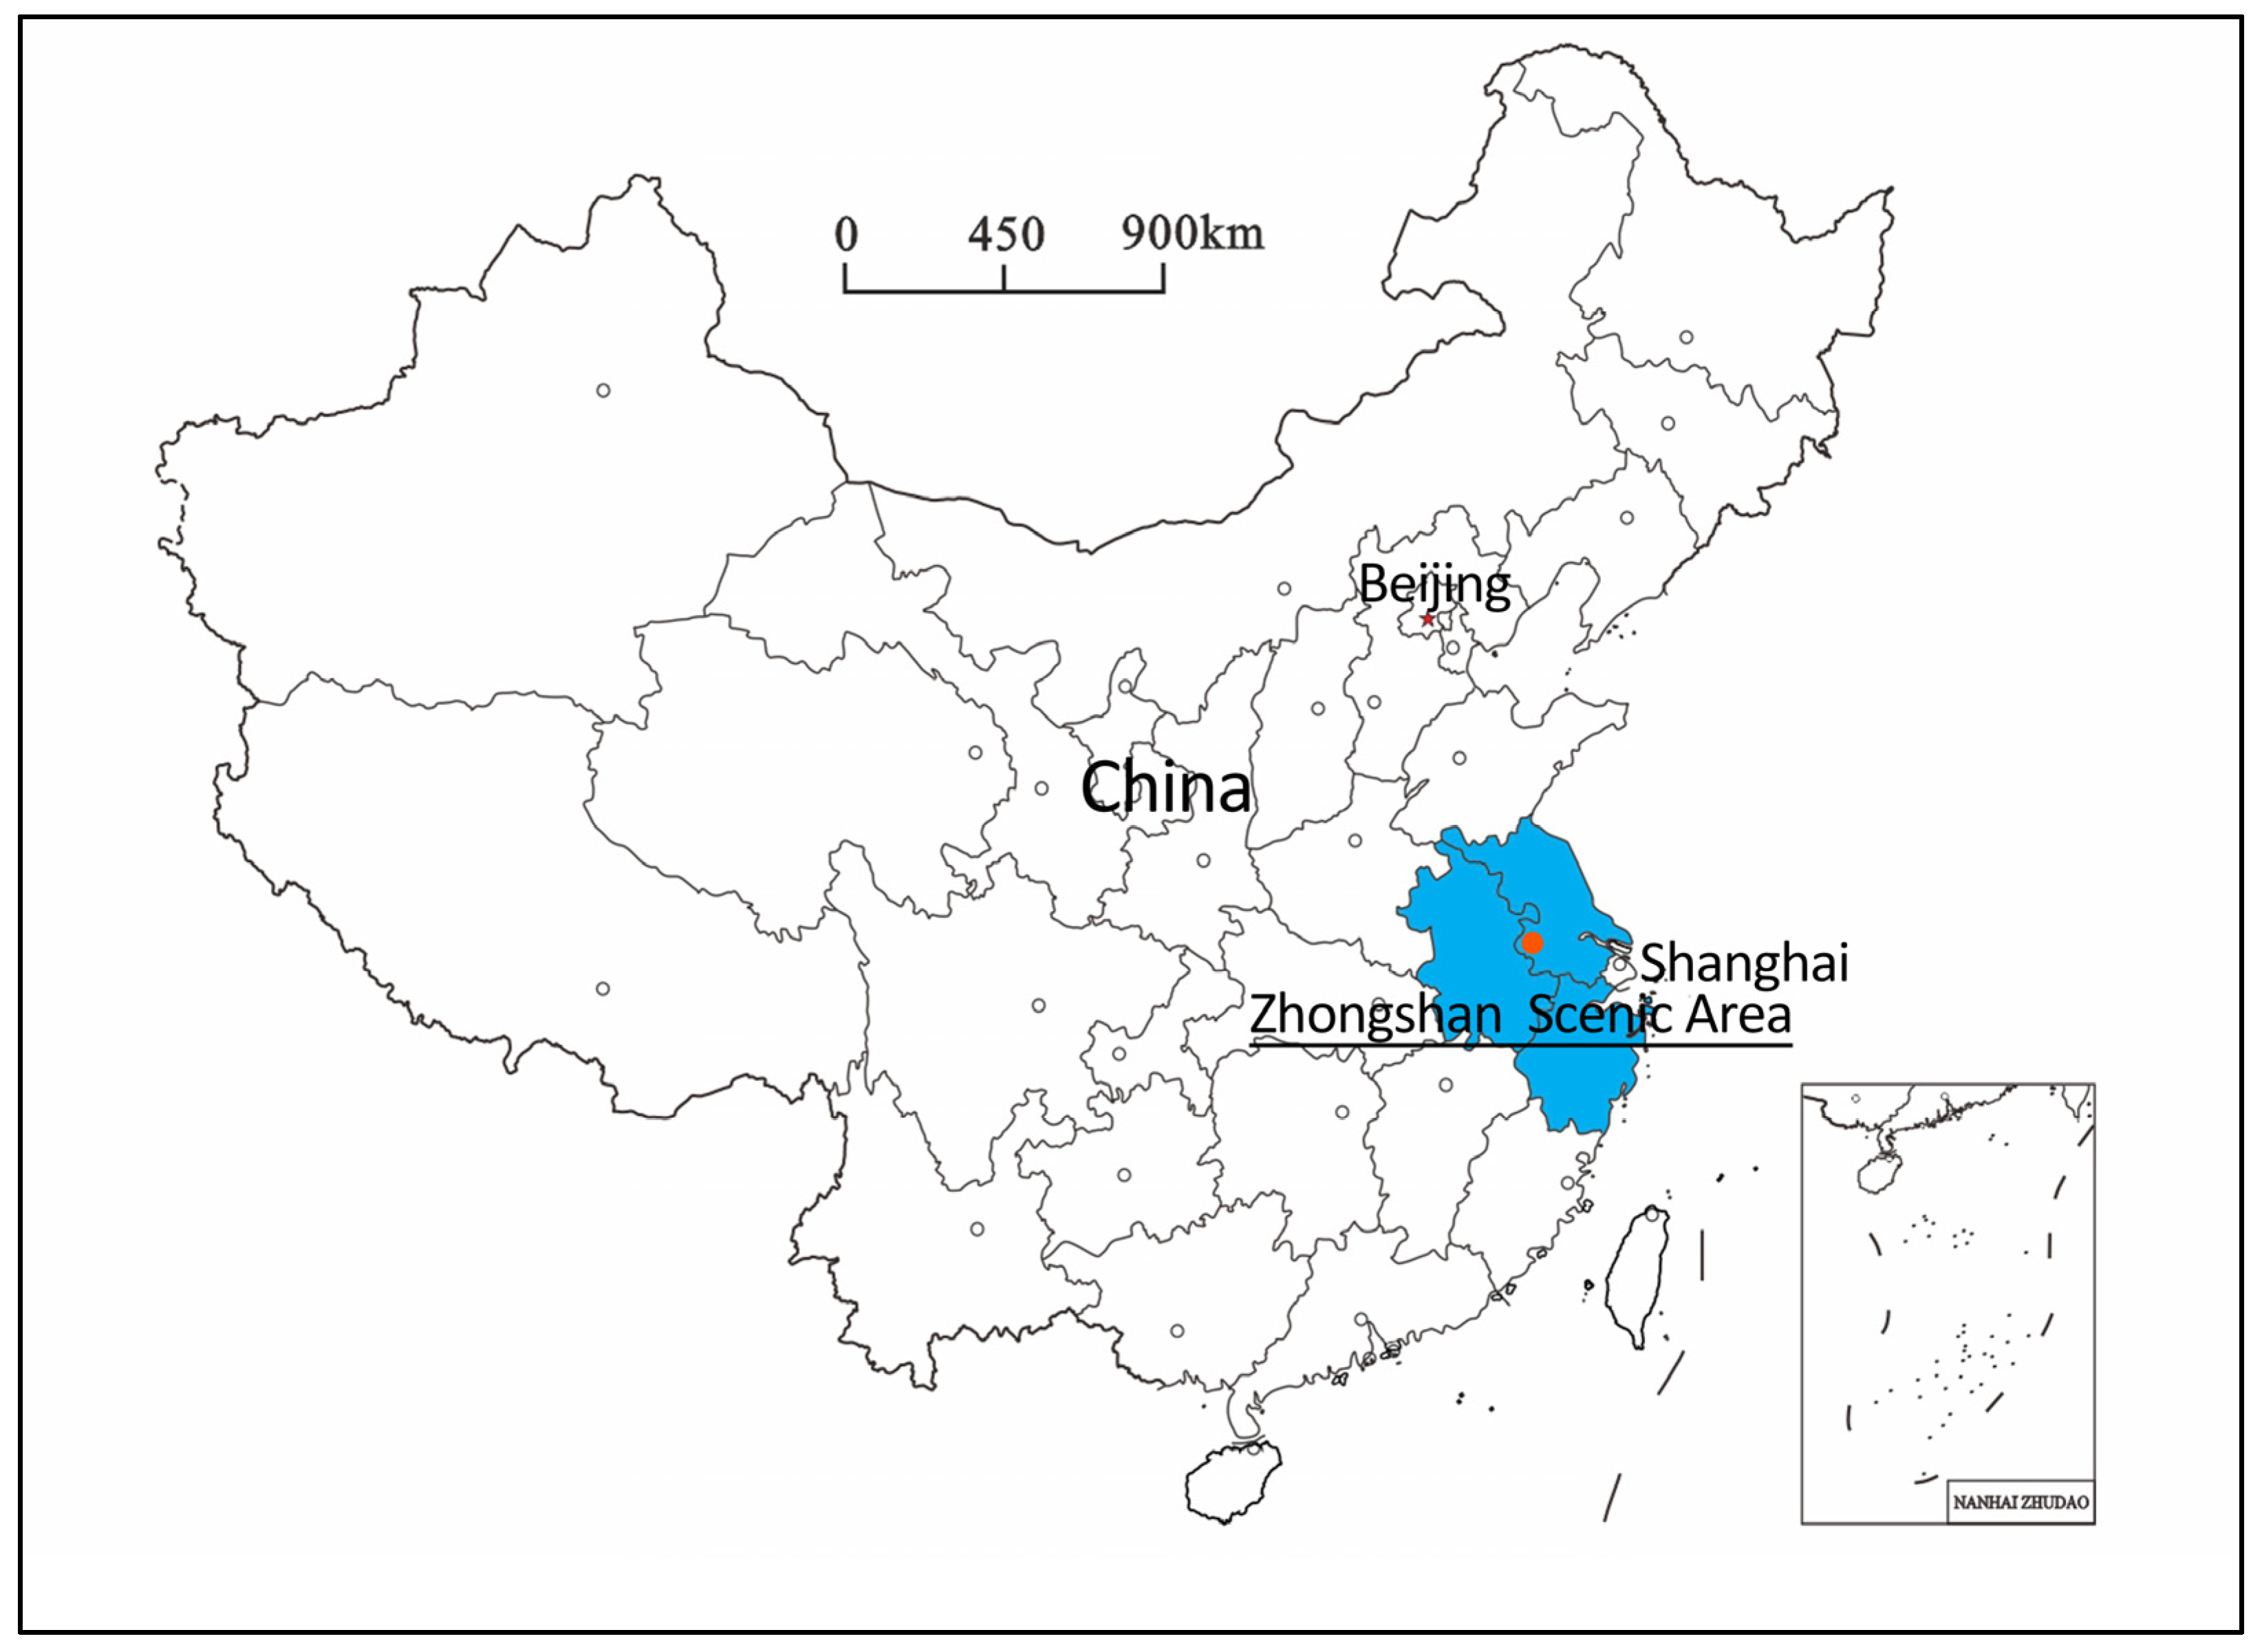
Figure 1. The location of the Yangtze River Delta and Zhongshan Scenic Area, Nanjing, China.
Sustainability 15 11423 g001
Figure 2. Spatial distribution of tourist arrivals to the Zhongshan scenic area in the Yangtze River Delta.
Sustainability 15 11423 g002
Figure 3. Spatial distribution of search volume index (SVI) to the Zhongshan scenic area in the Yangtze River Delta.
Sustainability 15 11423 g003
Figure 4. The relationship between driving distance and the lag of impulse peak tourist arrival response to search volume index from 40 cities.
Sustainability 15 11423 g004
Figure 5. Spatial distribution of the lag of impulse peak tourist arrival response to search volume index from 40 cities.
Sustainability 15 11423 g005
Figure 6. Comparison of the actual number of tourists (V) with the forecast number in the vector autoregression (VFvar) and autoregressive moving average models (VFarma) in December 2017.
Sustainability 15 11423 g006
Disclaimer/Publisher’s Note: The statements, opinions and data contained in all publications are solely those of the individual author(s) and contributor(s) and not of MDPI and/or the editor(s). MDPI and/or the editor(s) disclaim responsibility for any injury to people or property resulting from any ideas, methods, instructions or products referred to in the content.