Article

Counterparty Risk Contagion Model of Carbon Quota Based on Asset Price Reduction

1
School of Economics and Management, Nanjing Tech University, Nanjing 211816, China
2
School of Economics and Management, University of Chinese Academy of Sciences, Beijing 100190, China
*
Author to whom correspondence should be addressed.
Sustainability 2023, 15(14), 11377; https://doi.org/10.3390/su151411377
Submission received: 9 June 2023 / Revised: 7 July 2023 / Accepted: 12 July 2023 / Published: 21 July 2023
(This article belongs to the Special Issue Sustainable Finance and Risk Management)

Abstract

:
Driven by the “double carbon” goal, the sale of financial assets at reduced prices by firms due to carbon emission constraints is bound to aggravate the uncertainty and volatility of carbon trading among firms, and potentially create counterparty risk contagion. In view of this, this paper considers the sensitivity of the transaction of corporate financial assets, the transaction price of carbon quotas, and corporate carbon performance; constructs a network model for the risk contagion of carbon quota counterparties; theoretically discusses the risk formation and infection mechanism of carbon quota counterparties; and calculates and simulates the evolutionary characteristics of the risk contagion of carbon quota counterparties. The main research conclusions are as follows. (1) In the interfirm debt network, the sensitivity to the price of selling the financial asset, the probability of credit risk contagion of carbon quotas among firms, the cumulative proportion of assets sold, and the proportion of rational investors in the financial market exert a decreasing phenomenon on the risk of carbon quota counterparties. In addition, the corporate carbon performance shows a marginal increasing phenomenon. (2) When multiple factors intersect, the proportion of rational investors in the financial market has the greatest influence on the formation of the carbon quota counterparty risk, whereas the effect of corporate carbon performance has the least. Corporate carbon risk awareness has the greatest effect on the risk contagion of carbon quota counterparties, whereas the trading price of the carbon quota has the least influence. In addition, the total score of the interfirm assessment has a great impact on the trend and range of the risk contagion of carbon quota counterparties. (3) Corporate carbon risk awareness and the carbon quota trading price have a marginally decreasing effect on the risk contagion of carbon quota counterparties, and corporate carbon performance and the total score of interfirm assessment have a marginally increasing effect. This study has important theoretical and practical significance for preventing interfirm counterparty risk contagion under the double carbon target.

1. Introduction

In recent years, with the development of the low-carbon economy, the carbon emission trading scheme, as the main measure to achieve emission reduction targets, has achieved positive results in many countries [1]. Counterparty risk has become the main risk faced by market participants and, with the proposal of the “dual carbon” goal, a new counterparty risk contagion has been triggered, and the increasing complexity of carbon trading risk contagion has attracted extensive attention from academic and practical circles [2,3,4]. Therefore, this paper studies the influence mechanism and evolution characteristics of carbon trading risk contagion between firms.
At present, scholars have mainly studied the contagion of counterparty risk from the perspective of traditional finance [5,6,7,8,9,10,11,12]. With the proposed goal of carbon peak and carbon neutrality, green finance has been considered the most important solution [13], and new counterparty risks will be induced in the development of green finance. Therefore, scholars began to study the problem of counterparty risk contagion from the perspective of green finance. At present, studies on green finance have mainly focused on green credit. Ling [14] studied the effect of green credit policies on the investment decisions of firms. They found that green credit policies tend to reduce the investment level of polluting firms but improve their investment efficiency. Zhou [15] empirically analyzed the relationship between bank green loans and credit risk and how China’s green finance regulations contribute to the solvency of individual banks and the resilience of the financial system. They found that the correlation between the proportion of banks’ green loans in their overall loan portfolio and their credit risk depends critically on the size and structure of state-owned holdings. However, there is less research on carbon trading, and the only research focuses on the emission reduction benefits of carbon trading policies. Song [16] used the difference-in-difference model to test whether the carbon trading systems can improve energy efficiency through a quasi-natural experiment. However, ignoring the impact of carbon counterparty risk contagion on firms, this paper studies the contagion of carbon counterparty risk at the firm level from the perspective of green finance, which is the first innovation point in this paper.
As the most important emission reduction strategy, carbon trading has always been the focus of scholars’ research, and in recent years, research on carbon trading has mainly focused on the emission reduction benefits of carbon trading and the factors of carbon trading risks. Wang [17] conducted an empirical test based on the data of 30 provincial samples in China from 2011 to 2020, using the dynamic spatial econometric model and system GMM estimation method, and analyzed digital trade and carbon emissions; the moderating effects of industrial agglomeration and carbon emissions trading mechanisms on the effects of digital trade on carbon emission reduction are also covered. Zhou [18] took Beijing as an example, while this paper selects six indexes, including macroeconomic factors, energy market factors, climate environmental factors, and international market factors—which affect carbon emission trading prices—and establishes an appropriate VAR model for the analysis of carbon emission trading prices in Beijing. Few scholars have studied carbon trading risk contagion. Dong [19] adopted a data-driven factor analysis strategy by introducing the Fuzzy Cognitive Maps (FCM) model to establish a carbon market network and identify risk-related factors, and evaluated the carbon market’s risk level and spillover effects. They found that five factors which influenced carbon market risk emerged from the FCM, including OIL, COAL, SP500ENERGY, SPCLEANENERGY, and GPR, and they also found a notable rise in risk spillover from GPR to EUA during the Russia–Ukraine conflict and an escalation of total cross-market spillover during extreme events. However, the impact of other financial market fluctuations on the carbon trading market is often ignored, so this paper studies the risk contagion of carbon counterparties between firms from the perspective of asset price reduction, which is the second innovation point of this paper.
Complex networks can better describe the interrelation among various agents and truly describe and simulate the complex risk contagion mechanism [20,21]. At present, many counterparty risks have been analyzed with the help of complex networks, representative of which are the following examples. Chen and He [22] proposed the network model of credit risk contagion and studied the influence mechanism of investor behavior and network structure on credit risk contagion. Chen [23] constructed the SIRS model of counterparty credit risk contagion and analyzed the influence, mechanism, and evolution characteristics of the counterparty credit network structure and its heterogeneity, counterparty behavior preference, counterparty fitness, and regulatory rescue strategy on counterparty credit risk contagion in the CRT market. On the basis of an epidemic model, Wang [4] established its network model by considering investor behavior and information disclosure strategy, and they analyzed the mechanism of counterparty credit risk contagion. However, when the network model is constructed in this paper, the relationship among the nodes is related through the scoring system, which is different from previous studies. The association of firms through the scoring system can more truly reflect the relationship between various entities in the real trading market, as well as the phenomenon that firms are more inclined to trade with large firms.
To sum up, from the perspective of green finance and on the basis of the asset sale, this article analyzes the transmission mechanism of the carbon quota counterparty risk, a network model of the risk contagion of carbon quota counterparties is constructed based on complex network theory, and the evolutionary characteristics of the risk formation effect and contagion effect of carbon quota counterparty are analyzed by means of MATLAB R2019a software numerical simulation. The contributions of this paper are as follows. (1) This paper studies carbon quota counterparty risk from the perspective of green finance, which is different from that of traditional finance. (2) From the perspective of green finance and on the basis of asset price reduction, this paper studies the evolution characteristics of the risk contagion of carbon quota counterparties, which is different from the existing studies that only focus on the influence of carbon trading on firms, financial markets, and industry structure on the emission reduction efficiency. (3) Different from the previous studies that used power law distribution to associate network nodes, this paper uses an interfirm scoring system to associate interfirm network nodes, which makes the counterparty credit network more consistent with reality and reduces the conclusion deviation caused by the deviation of the counterparty credit network from reality. (4) This paper obtains novel conclusions with theoretical values. In the interfirm debt network, the price sensitivity of firms to the sale of financial assets, the proportion of rational investors in the financial market, the probability of credit risk contagion of the carbon quota among firms, and the cumulative proportion of assets sold have a marginally decreasing phenomenon on the formation of the carbon quota counterparty risk, whereas the corporate carbon performance has a marginally increasing phenomenon. Corporate carbon risk awareness and the carbon quota trading price have a marginally decreasing effect on the risk contagion of carbon quota counterparties, whereas corporate carbon performance and the total score of interfirm assessment have a marginally increasing effect. Under the cross-effects of various factors, the proportion of rational investors in the financial market has the greatest influence on the risk of carbon quota counterparties, whereas corporate carbon performance has the least. Corporate carbon risk awareness has the greatest effect on the risk contagion effect of carbon quota counterparties, whereas the trading price of the carbon quota has the least influence on the risk contagion effect. The total score of interfirm assessment has a great effect on the trend and range of the risk contagion of carbon quota counterparties. (5) This study not only enriches the theoretical research results of carbon quota counterparty risk, but also provides practical suggestions for governments and firms to prevent and control carbon quota counterparty risk contagion.
The rest of this paper is organized as follows. Section 2 constructs an interfirm debt network model. Section 3 presents an interfirm model of the risk contagion of carbon quota counterparties. Section 4 analyzes, theoretically, the formation and contagion mechanism of carbon quota counterparty risks. Section 5 analyzes the evolutionary characteristics of the formation and contagion of carbon quota counterparty risks. Section 6 summarizes the conclusions of this paper.

2. Interfirm Debt Network Model

2.1. Corporate Balance Sheets

Suppose there exist N firms in the interfirm market, and each firm’s assets consist of carbon quota accounts receivables A Y , trading financial assets A R , and cash C ; and the firm’s liabilities comprise carbon quota accounts payable L Y and trading financial liabilities L R . The owner’s equity of a firm is equal to assets minus liabilities ( E = A L ). The owner’s equity is also the capital buffer of the firm. When the loss of the firm is greater than the owner’s equity of the firm, the firm is insolvent ( E < 0 ) and will default. The structure of the corporate capital sheet in this paper is shown in Table 1.
In the interfirm market, the changes in the balance sheet and the characteristics of the interfirm network structure are affected by the carbon quota trading decisions among firms. That is, firms make decisions on whether carbon quota trading occurs among firms based on the carbon quota ratio in the balance sheet μ i t to the target ratio of corporate carbon quotas μ i ( 0 ) . If μ i t < μ i 0 , then the firm will choose to sell the carbon quota and increase carbon quota accounts receivables; otherwise, if μ i t > μ i 0 , then the firm will choose to purchase the carbon quota and increase the carbon quota accounts payable. Carbon quota ratio is expressed as the ratio of carbon quota accounts receivables to carbon quota accounts payable, shown as follows:
μ i t = A Y i t L Y i t

2.2. Interfirm Debt Network

Firm networks with customer–supplier, licensee–licensor, and strategic alliances have the characteristics of a scale-free network structure, and the degree distribution of firm credit network follows the power law distribution [24,25,26]. On the basis of the above research, this paper constructs an interfirm debt network model. The network model takes the firm as the network node, the number of nodes in the interfirm market represents the number of firms, and the interfirm debt network has N nodes.
By using the agent-based modeling (ABM) method of American finance to describe the interfirm debt network, the firms are divided into large firms and small firms. Particularly, large firms are the first choice for seeking counterparties due to their large scale and abundant assets, which are in a dominant position in the economy and have more carbon emission indexes allocated by the state. The capital and technology of small firms are weak, and the carbon emission index allocated by the country is less than that for large firms. The edge of the interfirm debt network is abstracted from the carbon quota debt relationship among firms, the degree of nodes is the number of other nodes connected to the node in the network, and the degree distribution of the network is P k .
The debt relation of the carbon quota among firms forms the debt network, which is represented by the following adjacency matrix:
Ω = b 11 b 1 j b 1 N b i 1 b i j b i N b N 1 b N j b N N
At that time, when b i j = 1 , firm i is the creditor of firm j , and firm j is in the debt of firm i . When b i j = 0 , no debt relationship exists between firm i and j . Moreover, firms will not have a debt relationship with themselves, that is, b i i = 0 . i = 1 N b i j and j = 1 N b j i represent the number of debt firms and creditor firms of firm i , respectively. The default of interfirm debt affects the creditor through the adjacency matrix. When the creditor suffers losses or goes bankrupt, the risk will be transmitted to the interfirm debt network.

3. Construction of a Counterparty Risk Contagion Model for Carbon Quota Trading among Firms

For a firm, when the owner’s equity E < 0 , the firm will default. Given that the owner’s equity of the firm is equal to its assets minus its liabilities, then:
E i ( t ) = A i ( t ) L i ( t ) = ( A Y i ( t ) + A R i ( t ) + C i ( t ) ) ( L Y i ( t ) + L R i t )
Given that the loss of assets is an important cause of firm bankruptcy, this paper focuses on the influence of capital loss of firms due to asset reduction on the entire firm system. The loss can be considered to be caused by the need to repay interfirm debts and stabilize the liquidity of corporate assets. The loss is also influenced by other factors such as investor sentiment, carbon trading, and carbon performance, which prompts the company to sell its financial assets at less than their value. Carbon performance refers to the performance of corporate carbon management, that is, the comprehensive assessment of the development and implementation of corporate carbon policies, carbon emission reduction targets, carbon management-related education, carbon management R&D capability, carbon emission intensity, and carbon disclosure degree [27]. The sale of financial assets by firms affects the payment of carbon quota trading accounts among firms, thereby forming interfirm carbon quota counterparty risk and triggering risk contagion through the interfirm debt network. The contagion process is shown in Figure 1.

3.1. Fire Sale of Firm Assets

In order to maintain the normal operation of the firm, the firm will choose to sell its financial assets, and the market reprices the financial assets that are sold. The sensitivity of firms to asset prices reflects the perception and reaction degrees of transaction subjects to asset price changes [28]. Therefore, this paper constructs an asset pricing model based on the differences in sensitivity of firms to asset prices. Moreover, in view of the fact that the asset price sensitivity will affect the scale of the fire sale of firms, it will also affect the repricing of assets in the financial market. The factors which affect the asset price sensitivity are as follows. First, the proportion of rational investors: under the condition of asymmetric information, investors in the financial market are divided into rational investors and uninformed emotional investors. The larger the proportion of rational investors τ is, the more efficient the financial market will be [29,30,31]. At this point, the more sensitive firms are more likely to be susceptible to the changes in the market price of their assets. Second, the greater the credit risk contagion probability of carbon quota trading among firms ψ is, the greater the effect on the ability and risk preference of firms to withstand market price volatility risks will be and the more sensitive firms will be to market prices [32,33]. Finally, high carbon performance can promote the improvement of firms’ financial performances. The greater the corporate carbon performance γ is, the lower the sensitivity of the asset prices of firms will be [34,35]. Therefore, the firm sensitivity function η to asset prices can be set as follows:
η = ( 2 ψ ψ 2 ) e γ τ
The demand function for asset price changes caused by supply and demand is an exponential function [28]. The asset inverse demand function is used to determine the price at which firm i sells a certain transactional financial asset at moment t . Then, after asset reduction, the price A R i h of asset h sold at moment t can be expressed as follows:
ρ ( h , t ) = ρ ( h , 0 ) q h = ρ ( h , 0 ) e q h η
where ρ ( h , 0 ) is the initial price of asset A R i h , q h ( 0 < q h d h ) denotes the cumulative proportion of asset A R i h sold, and d h is the market capacity of an asset as a percentage of the market’s absorbable assets.
Moreover, the loss of firm i caused by the price reduction of assets at moment t through the price of assets can be expressed as S i t .
S i t = h = 1 m q h ( ρ ( h , 0 ) ρ ( h , t ) )
Particularly, other current assets contain m types of assets.

3.2. Construction of the Relationship of Carbon Quota Debt among Firms

According to Section 3.1, the asset loss S i t caused by firm i at moment t can be known. When S i t E i t , firm i goes bankrupt. When E i t S i t L Y i t + 1 , firm i will not go bankrupt but will default due to its inability to pay off its carbon quota liabilities. Then, in both cases, firm i will cause certain losses to the creditor with which it has a carbon quota business contact. The process of establishing a carbon quota debt relationship between firm i and its creditor is described as follows.
According to the score system, the firm evaluates the scale of its counterparty and its relationship with the counterparty. In addition, the firm decides on the carbon quota trading among firms through the scale score F A and relationship score F G . It also selects a more suitable counterparty to establish a new debt relationship and realizes the asset flow and balance sheet update of the firm.
(1) The scale score is calibrated by comparing the size of the firm with the average size of existing counterparties. Firms are more inclined to establish interfirm market relations with large firms. Firm j ’s scale evaluation of firm i at moment t can be expressed as follows:
F i j A = log A j t v , v i log A t 1 i , v t 1 v , v i i , v t 1
i , v t = 1 , there   is   a   connection   between   i   and   v   at   t   moments . 0 , others
(2) The relationship score describes a preference of whether to continue business with the existing counterparties. The relationship evaluation of firms i and j in period t can be expressed as follows:
F i j G t = 0 = log L i j 0 , firm   i   and   firm   j   have   initialized   debt 0 , others
F i j G t > 0 = F i j G t 1 + log L i j t , firm   i   and   firm   j   have   new   debt 1 F i j G t 1 , others
where the memory decay function is 0 , 1 .
(3) The total amount of carbon quota sold by firm i to firm j is determined according to the total score system of the interfirm evaluation. The total evaluation score determines the amount of carbon quota that the creditor will sell to the debt firm. The total score between the firms i and j is expressed as follows:
F i j z = υ F i j G + 1 υ ω F i j A
ω = A Y i A i
where υ is the weight of the relationship score.
Equations (7)–(12) describe how to establish a new debt relationship among firms, and reflects the debt relationship, the flow of capital, and the daily financial and operational activities among firms.

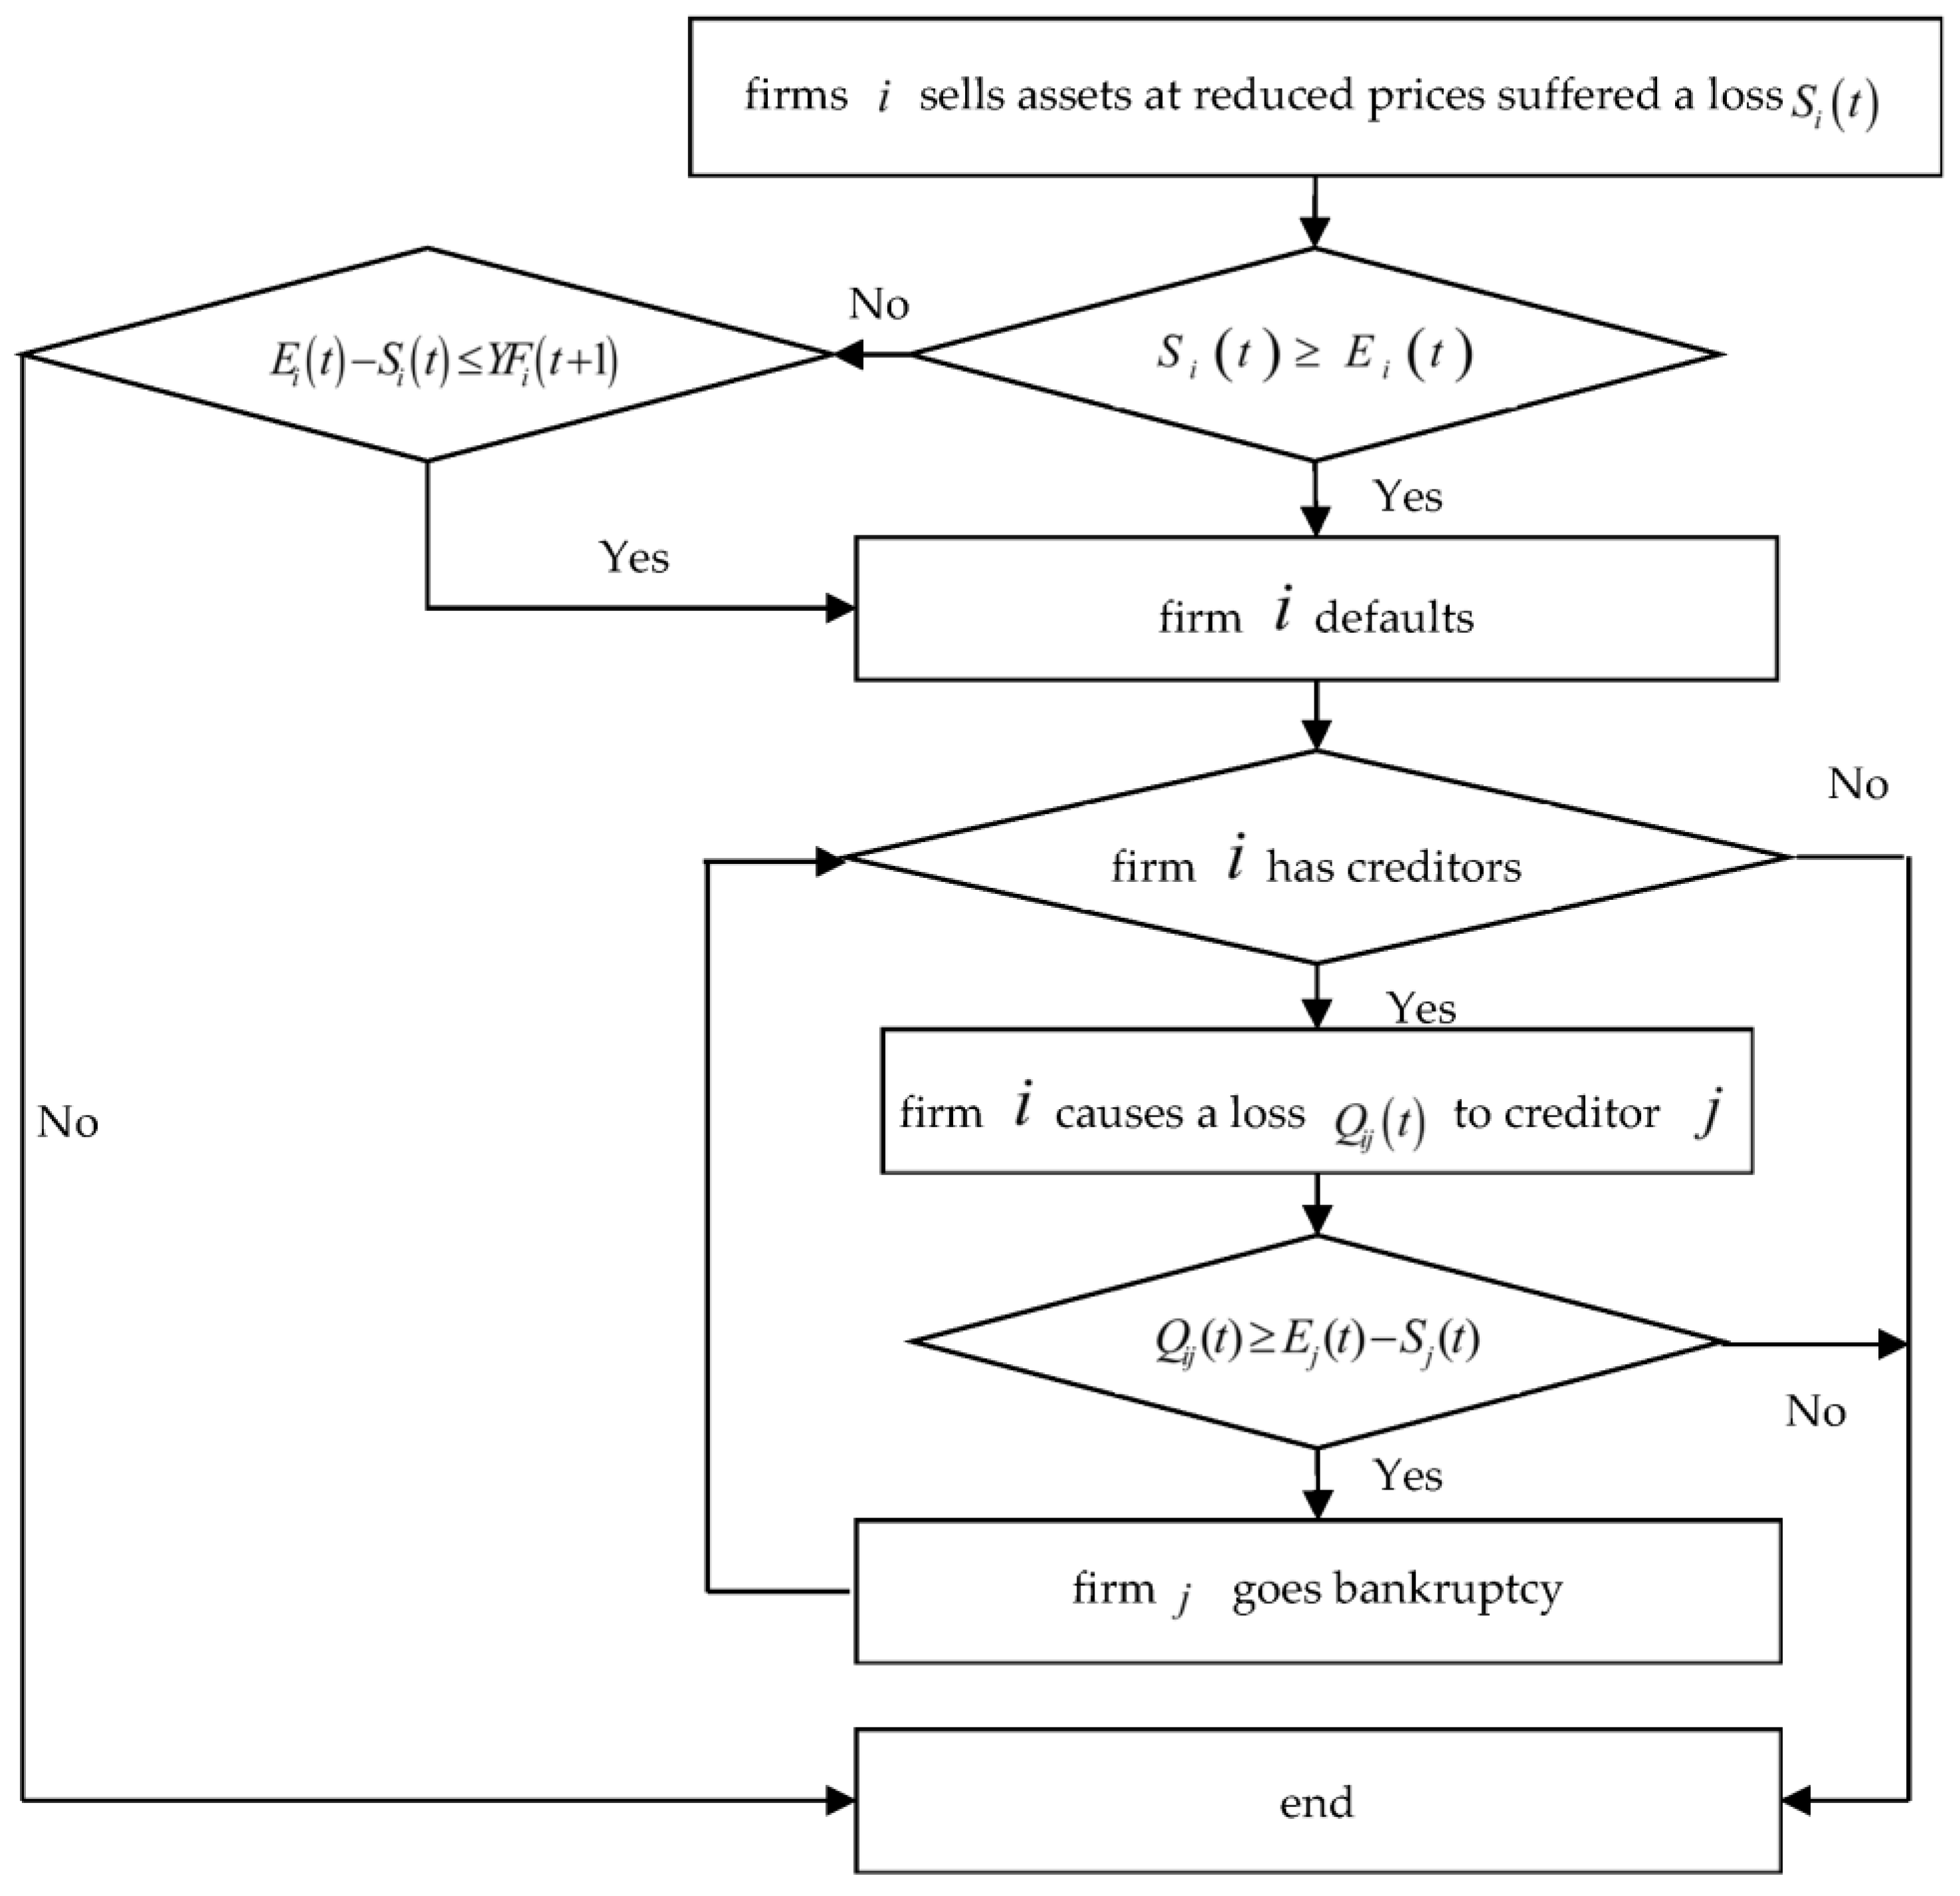
3.3. Risk Contagion Process of Carbon Quota Counterparties

This paper mainly considers the influence of the government and firms on the establishment of carbon quota trading among firms to form a new debt relationship. The main influencing factors include the following. First, the trading price of carbon quota P : under the carbon tax–carbon trading hybrid policy, the higher the trading price of the carbon quota is, the greater the substitution effect of a carbon tax on carbon emission trading and the smaller the probability of establishing a carbon quota debt relationship among firms will be [36,37]. Second, the carbon risk awareness α : carbon risk awareness refers to a firm’s ability to proactively identify carbon-related risks and seriously consider their potential consequences. The greater the carbon risk awareness is, the stronger the firm’s ability to identify carbon-related risks and the smaller the probability of establishing a carbon quota debt relationship among firms will be [38]. Third, carbon performance γ : the larger the carbon performance is, the more carbon quota will be left and the higher the probability of trading carbon quota will be [32,33,39]. Fourth, the interfirm assessment scores F i j z : the greater the interfirm assessment score is, the greater the probability of carbon quota trading will be [40].
Therefore, the probability of establishing a new debt relationship of carbon quota among firms ψ , that is, the probability that defaulting firms transmit carbon quota counterparty risk to creditor firms ψ , can be expressed as follows:
ψ = 1 1 + α e γ ln P F i j z
(1) Scenario 1
If E i ( t ) S i ( t ) 0 , then firm i defaults. That is, at moment t , the firm is unable to pay off the debt, and forms a carbon quota counterparty risk.
This paper assumes that the defaulting firm causes the same loss to its creditor. The loss Q i j t caused by the defaulting firm i to its creditor j can be expressed as follows:
Q i j t = L Y i ( t ) + L R i t , S i ( t ) E i ( t ) min j = 1 N b j i
If E j ( t ) S j ( t ) Q i j ( t ) 0 and E j ( t ) S j ( t ) > 0 , then firm j defaults due to the risk contagion of carbon quota counterparties. In this case, firm j will continue to transmit the carbon quota counterparty risk to its associated creditors until no new defaulting firm exists.
(2) Scenario 2
If 0 < E i t S i t L Y i t + 1 , then firm i defaults due to its failure to repay carbon quota liabilities in full. The loss caused by the defaulting firm i to its creditor j can be expressed as follows:
Q i j t = L Y i t S i ( t ) E i ( t ) min j = 1 N b j i
(3) Scenario 3
If E i ( t ) S i ( t ) > 0 and g i t < g i t , then firm i maintains its liquidity by selling its financial assets at a discount due to its insufficient liquidity. g i t represents the current assets of the firm at moment t . g i t represents the threshold value of the current assets of the firm at moment t , which can be expressed by θ A i t , where θ is the threshold value of the liquidity of the firm and represents the influence of asset price reduction on the current assets of the firm. If E i ( t ) S i ( t ) > 0 and g i t > g i t , then the firm sells its financial assets at a reduced price for debt repayment and keeps its current assets at no lower than the threshold. Then, the current assets required by firm i to repay its debt can be expressed as h = 1 m q h ρ ( h , t ) .
(4) Scenario 4
To solve the short-term liquidity problem of firms, firm i chooses to sell its financial assets at a reduced price at moment t , resulting in losses S i t . If E i ( t ) S i ( t ) 0 , then firm i will be bankrupted and liquidated. When the bankrupt firm cannot repay the accounts payable of the creditor, the creditor j of the bankrupt firm will suffer losses Q i j t . If E j ( t ) S j ( t ) Q i j ( t ) 0 and E j ( t ) S j ( t ) > 0 , then the firm will also go bankrupt, thus forming default contagion among firms. Firm j is bankrupted and liquidated, causing losses Q j l t + 1 to its creditors l . Similarly, when E l ( t + 1 ) S l ( t + 1 ) Q j l ( t + 1 ) 0 and E l ( t + 1 ) S l ( t + 1 ) > 0 , the firm l will go bankrupt. If new bankruptcies occur among creditors of the firm l , credit risk will continue to be passed on until the risk is completely absorbed and no new bankruptcies will be formed. The credit risk contagion process among carbon quota counterparties is shown in Figure 2.

4. Analysis of the Mechanism of Carbon Quota Counterparty Risks

In the interfirm network, the loss caused by the fire sale of financial assets will not only affect the formation of carbon quota counterparty risk among firms but also the size of the credit risk. Suppose that the loss of assets of firms is used to measure the credit risk of carbon quota counterparties among firms [41].

4.1. Analysis of the Mechanism of Risk Formation of Carbon Quota Counterparty Risks

Asset price reduction affects the solvency of firms, thereby causing a counterparty risk of carbon quotas among firms, and the greater the difference between the current price of assets sold in finance and the initial price, the greater the impact of selling at a reduced price will be on firms. At the same time, the sensitivity and rationality of firms to asset prices affect the decision of firms to sell assets at a reduced price and the scale of assets sold, thereby affecting the losses caused by the sale of assets at a reduced price. In addition, the counterparty risk of the carbon quota affects the related firms, which further affects the solvency of firms and causes the risk of carbon quota counterparties among firms. Thus, Theorem 1:
Theorem 1. 
The marginal utility of the loss S i t caused by the price of financial assets sold ρ ( h , t ) , the sensitivity of asset prices η , the proportion of rational investors τ , and the possibility of credit risk contagion in carbon quota trading among firms ψ all show a decreasing trend. The marginal utility of corporate carbon performance γ on the loss S i t caused by the price reduction of financial assets shows an increasing trend.
Proof. 
S i t ρ ( h , t ) = h = 1 m q h < 0
S i t η = h = 1 m q h 2 ρ ( h , 0 ) η 2 e q h η < 0
S i t τ = h = 1 m q h 2 ρ ( h , 0 ) γ 2 ψ ψ 2 η 2 τ 2 e q h η γ τ < 0
S i t ψ = h = 1 m q h 2 ρ ( h , 0 ) ( 2 2 ψ ) η 2 e q h η γ τ < 0
S i t γ = h = 1 m q h 2 ψ ρ ( h , 0 ) η 2 e q h η r τ 2 F i j z 1 ψ 2 P 2 ψ τ
On the basis of Equations (16)–(20), the sale financial asset prices ρ ( h , t ) , the firm asset price sensitivity η , the proportion τ of rational investors, and the possibility of credit risk contagion in carbon quota trading among firms is the monotonically decreasing function of loss S i t on sale firm financial assets. According to Equation (20), to determine whether 2 F i j z 1 ψ 2 P 2 ψ τ is equal to 0, assume that f ψ = 2 F i j z 1 ψ 2 P 2 ψ τ = 0 . The three cases where the deterministic formula Δ = P P + 8 F i j z τ exists are P + 8 F i j z τ < 0 P + 8 F i j z τ = 0 P + 8 F i j z τ > 0 . When P + 8 F i j z τ < 0 , that is, Δ < 0 , If f ψ has no real root and f ψ < 0 . then S i t γ > 0 . At this time, the loss S i t caused by the fire sale of financial assets is a monotonically increasing function regarding the corporate carbon performance γ . When P + 8 F i j z τ = 0 , that is, Δ = 0 , f ψ has a real root and solves for ψ = 3 . Moreover, if ψ 0 , 1 and f ψ < 0 , then S i t γ > 0 ; at this time, the loss S i t caused by the fire sale of financial assets is a monotonically increasing function regarding the corporate carbon performance γ . When P + 8 F i j z τ > 0 , that is, Δ > 0 , f ψ has two real roots and solves for ψ 1 = 4 F i j z τ P P P + 8 F i j z τ 4 F i j z τ < 0 , ψ 2 = 4 F i j z τ P + P P + 8 F i j z τ 4 F i j z τ > 1 . If ψ 0 , 1 . and f ψ < 0 , then η γ < 0 ; at this time, the loss S i t caused by the fire sale of financial assets is a monotonically increasing function regarding the corporate carbon performance γ . Therefore, Theorem 1 is proved. □
According to Theorem 1, effectively controlling the price of the financial assets sold, the carbon performance, and the probability of risk contagion in carbon quota trading among firms, and improving the price sensitivity of firm assets and the proportion of rational investors, can effectively reduce the losses caused by asset price reductions, and reduce the counterparty risks of firms.

4.2. Analysis of the Mechanism of Risk Contagion of Carbon Quota Counterparties

The higher the awareness of the carbon risk is, the stronger the company’s ability to deal with carbon-related risks will be in the future, reducing the contagion of carbon counterparty risks. A firm’s evaluation of counterparties affects the firm’s decision-making regarding carbon trading, and the firm’s evaluation of the counterparty reflects the willingness of the firm to bear the risk of carbon allowance trading, thereby affecting the price of carbon trading. At the same time, since carbon performance reflects a series of measures taken by firms for emission reduction, a high carbon performance reflects the degree of correlation of the carbon trading of firms to a certain extent, which may affect the risk contagion channel of carbon quota counterparties, and then affect the risk contagion of carbon quota counterparties. Thus, Theorem 2 and Theorem 3:
Theorem 2. 
The marginal utility of carbon risk awareness α on the credit risk contagion probability of the carbon quota among firms is decreasing and convex. When F i j z 0 , the marginal utility of carbon quota trading price P on the probability of credit risk contagion of carbon quota ψ shows a decreasing trend. When F i j z < 0 , the marginal utility of carbon quota trading price P on the probability of credit risk contagion of carbon quota ψ shows an increasing trend.
Proof. 
ψ α = e γ ln P F i j z 1 + α e γ P F i j z 2 < 0  
2 ψ α 2 = 2 e γ ln P F i j z 1 + α e γ ln P F i j z 3 > 0
ψ P = α γ F i j z e γ ln P F i j z ( P ln P ) 2 1 + α e γ P F i j z 2
According to Equations (21) and (22), the probability of credit risk contagion of the carbon quota among firms ψ is a monotonically decreasing concave function regarding carbon risk awareness α . Equation (23) shows that ψ P 0 ,   F i j z 0 ψ P > 0 ,   F i j z < 0 . When F i j z 0 , the probability of credit risk contagion of the carbon quota among firms ψ , is a monotonically decreasing function regarding the trading price P of the carbon quota. When F i j z < 0 , the probability of credit risk contagion of the carbon quota among firms ψ is a monotonically increasing function regarding the trading price P of the carbon quota. Therefore, Theorem 2 is proved. □
Theorem 3. 
When F i j z 0 , the marginal utility of carbon performance γ on the probability of credit risk contagion of the carbon quota among firms ψ is increasing and concave; when ln P ln α F i j z < 0 , the marginal utility of carbon performance γ on the probability of credit risk contagion of the carbon quota among firms ψ is decreasing and concave. When 10 F i j z < ln P ln α , in the interval γ 0 , 1 , the marginal utility of carbon performance γ on the probability of credit risk contagion of the carbon quota among firms ψ is increasing and convex. In the interval 0 , γ 0 , the marginal utility of carbon performance γ on the probability of credit risk contagion of the carbon quota among firms ψ is increasing and concave. The marginal utility of interfirm assessment score F i j z on the probability of credit risk contagion of the carbon quota among firms ψ is increasing and concave.
Proof. 
ψ γ = F i j z α e γ ln P F i j z ln P 1 + α e γ P F i j z 2
2 ψ γ 2 = F i j z ln P 2 α e γ ln P F i j z α e γ ln P F i j z 1 2 1 + α e γ ln P F i j z 3
ψ F i j z = γ α e γ ln P F i j z ln P 1 + α e γ ln P F i j z 2 > 0
2 ψ F i j z 2 = γ ln P 2 α e γ ln P F i j z α e γ ln P F i j z 1 2 1 + α e γ ln P F i j z 3
Let f γ = α e γ ln P F i j z 1 and f γ = α F i j z ln P e γ ln P F i j z . When F i j z > 0 , f γ < 0 , then f γ takes the maximum value of f max γ < 0 at γ = 0 on the interval of γ 0 , 1 , 2 ψ γ 2 < 0 . When F i j z = 0 , f γ = α 1 < 0 , 2 ψ γ 2 < 0 . According to Equations (24) and (25), ψ γ 0 ,   F i j z 0 ψ γ < 0 ,   F i j z < 0 ; therefore, when F i j z 0 , the probability of credit risk contagion of the carbon quota among firms ψ is a monotonically increasing convex function regarding carbon performance γ . When F i j z < 0 and f γ > 0 , then f γ takes the maximum value of f 1 = α e F i j z ln P 1 at γ = 1 on the interval of γ 0 , 1 , and there exists two situations: f 1 0 ,   ln P ln α F i j z < 0 f 1 > 0 ,   10 F i j z < ln P ln α . When ln P ln α F i j z < 0 and f γ < f 1 < 0 , then 2 ψ γ 2 < 0 . At this time, the credit risk contagion probability of the carbon quota among firms ψ is a monotonically decreasing convex function regarding carbon performance γ . When 10 F i j z < ln P ln α , f γ has a unique zero point γ 0 ; thus, f γ > 0 on the interval of 0 ,   γ 0 . Then, the probability of credit risk contagion of the carbon quota among firms ψ is a monotonically decreasing concave function regarding carbon performance γ . When f γ < 0 on the interval of γ 0 ,   1 , the credit risk contagion probability of the carbon quota among firms ψ is a monotonically decreasing convex function regarding carbon performance γ . In conclusion, the monotonicity and convexity of the probability of credit risk contagion of the carbon quota among firms ψ on carbon performance γ can be proven to be related to the interfirm assessment scores.
Similarly, let f F i j z = α e γ ln P F i j z 1 , f F i j z = α γ ln P e γ ln P F i j z , and f F i j z < 0 . Then, f F i j z takes the maximum value of f 10 = α e γ ln P 1 at F i j z = 10 on the interval of 10 ,   10 , and γ 0 ,   1 . At this time, f 10 < 0 and 2 ψ F i j z 2 < 0 . Therefore, the credit risk contagion probability of the carbon quota among firms ψ is a monotonically increasing convex function of the evaluation score F i j z among firms. Therefore, Theorem 3 is proved. □
According to Theorems 2 and 3, to effectively control the risk contagion of carbon quota trading among firms, firms should improve their awareness of carbon risks and carbon performance, focus on screening and evaluating the assets and credits of carbon quota counterparties while improving their carbon performance, cooperate with the government’s macro adjustment of trading price carbon allowances, and choose an appropriate carbon trading strategy.

5. Simulation Analysis

On the basis of the risk contagion research model of carbon quota counterparties, a numerical simulation analysis of the evolution characteristics of the risk contagion of carbon quota counterparties is conducted based on the asset discount using MATLAB R2019a software. The baseline value of the parameters is determined according to the literature [21,28,29,30,31,36,37,40,42,43]. Suppose that the scale of firm asset losses is used to measure the credit risk of carbon quota counterparties among firms [41]. The specific benchmark values of each parameter are shown in Table 2.

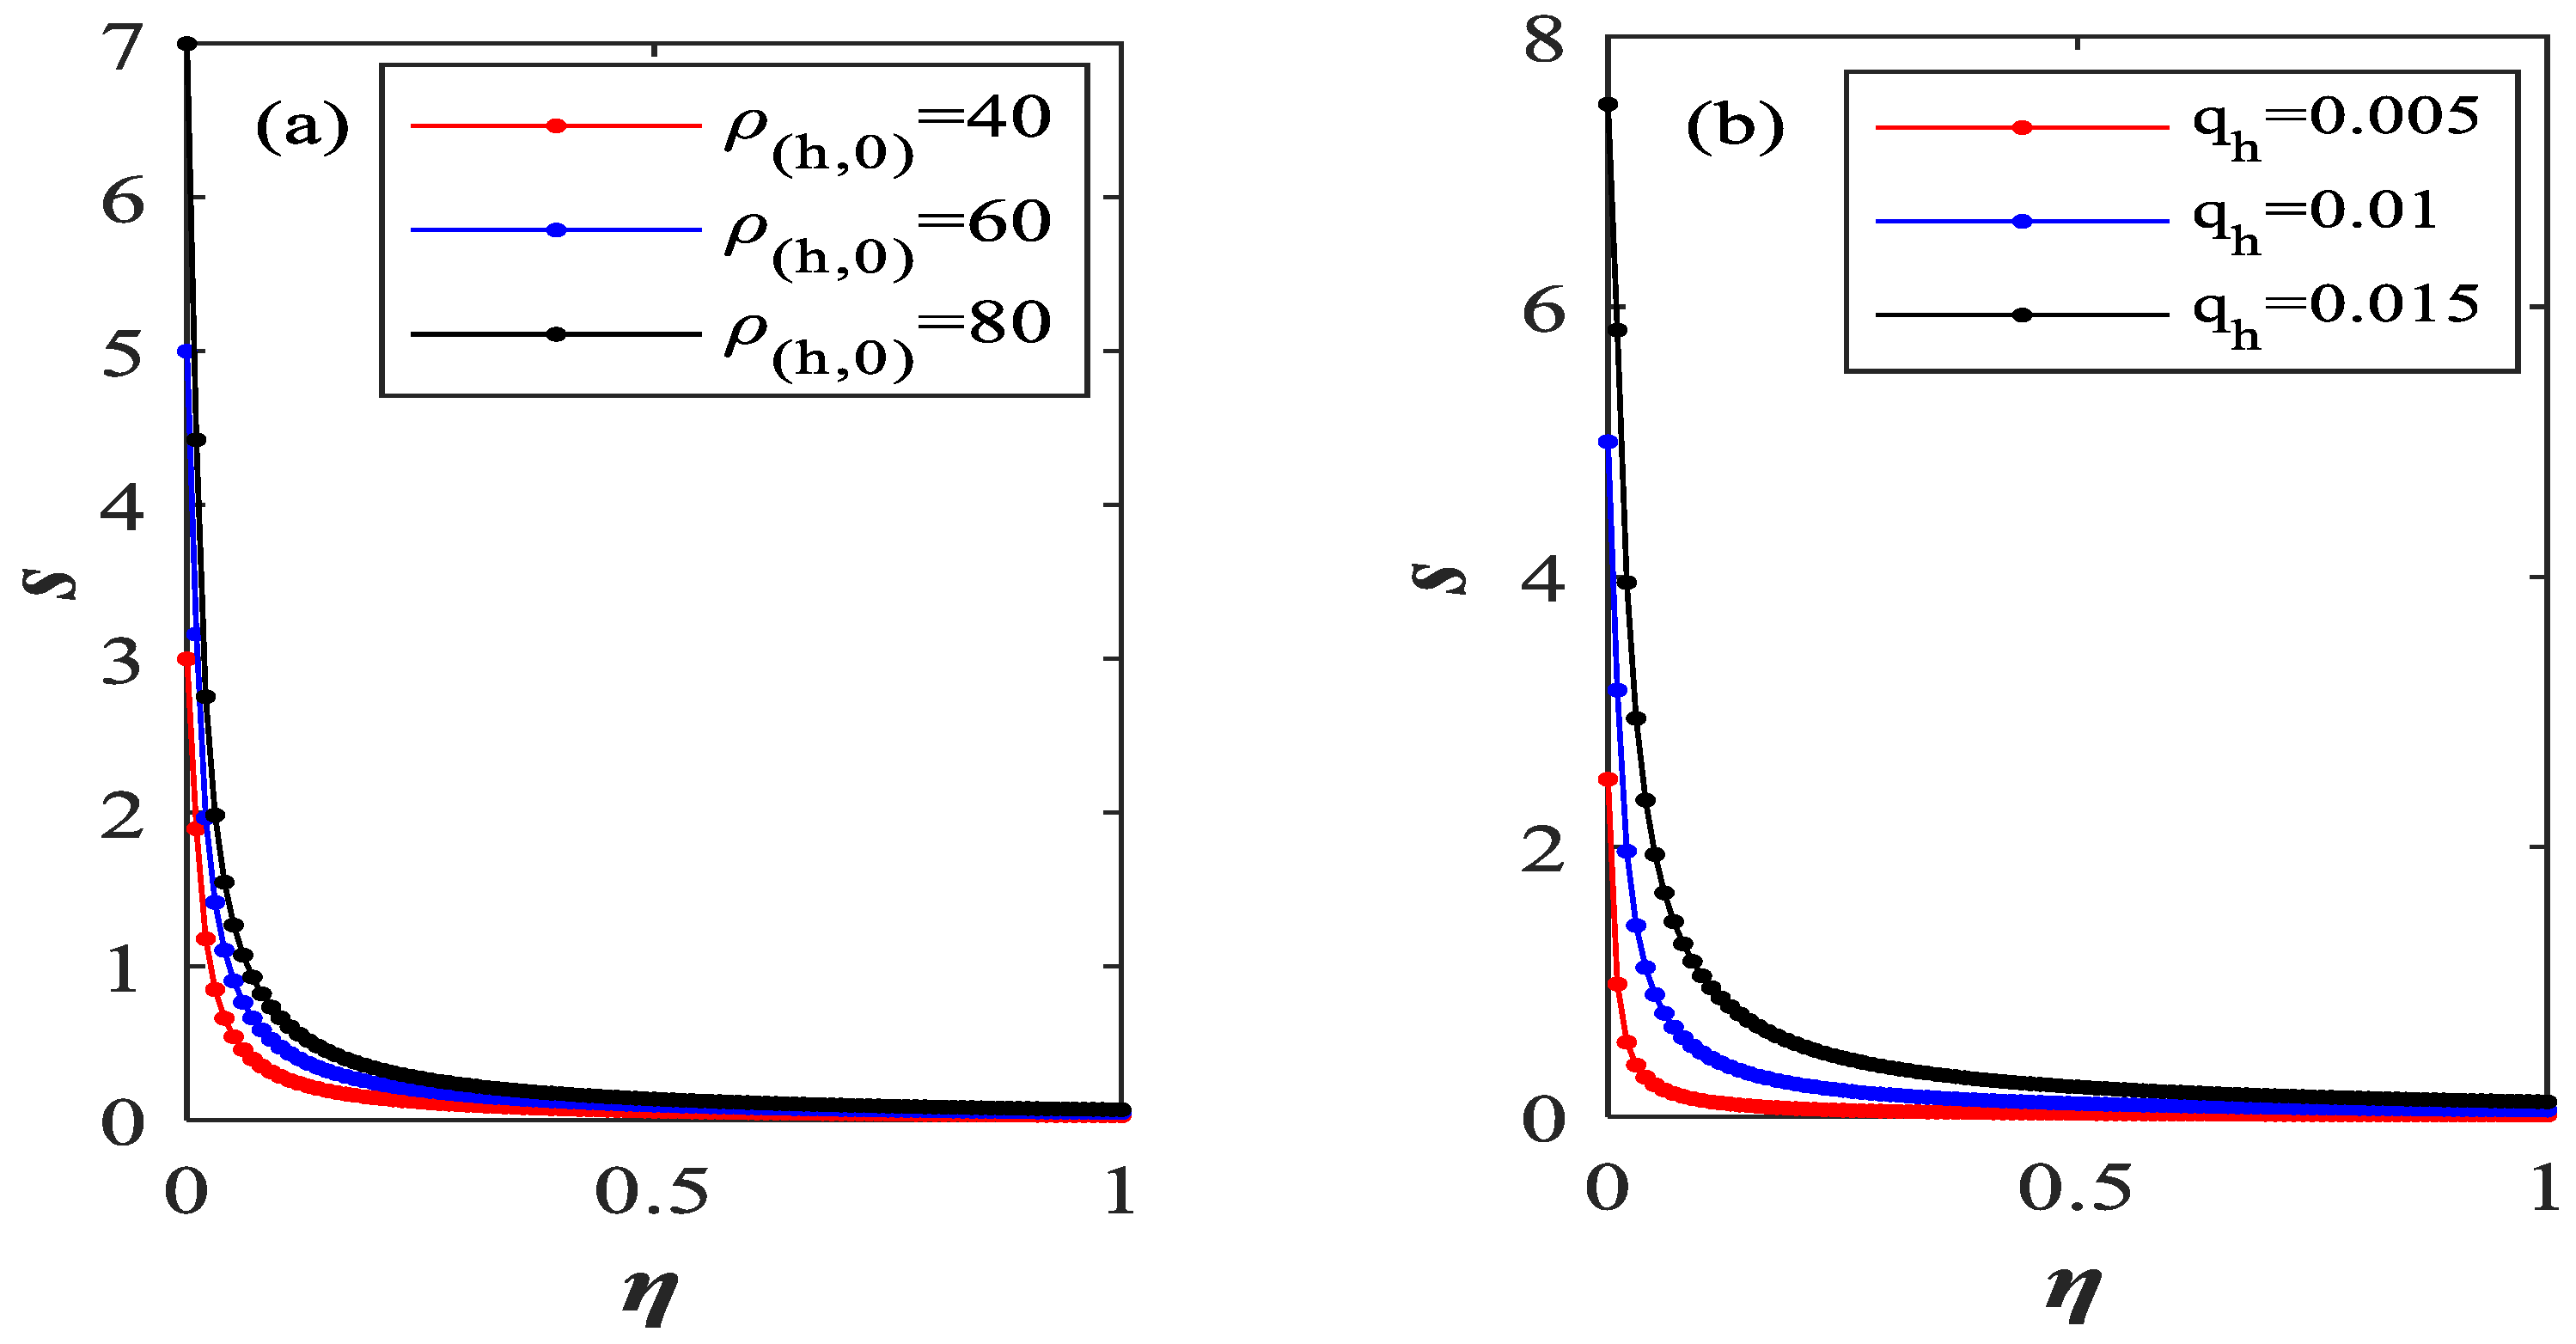
5.1. Formation Effect of Carbon Quota Counterparty Risk

The effects of the following evolutionary characteristics with different parameter values on the counterparty risk evolution are determined via simulation: the formation effect of the carbon quota counterparty risk, the proportion of rational investors through financial markets τ , the probability of credit risk contagion of the carbon quotas among firms ψ , the corporate carbon performance γ , the price sensitivity of the firm to the sale of financial assets η , the cumulative proportion of class h assets sold q h , and the initial market price of class h assets ρ ( h , 0 ) .
Figure 3 depicts the correlation between the size of the carbon quota counterparty risk and the proportion of rational investors in the financial market, the probability of credit risk contagion of carbon quota among firms, the corporate carbon performance, and the price sensitivity of firms to the sale of financial assets. Figure 3 also verifies the conclusion of Theorem 1. According to Figure 3a–d, the carbon quota counterparty risk in the interfirm debt network presents a decreasing marginal feature with the increase in the proportion of rational investors in the financial market τ , the probability of credit risk contagion of the carbon quota among firms ψ and the sensitivity of firms to the price of financial assets sold η , and an increasing marginal feature with the increase in the corporate carbon performance γ . Moreover, when the proportion of rational investors τ is less than 0.2 and the credit risk contagion probability of the carbon quotas among firms ψ is less than 0.1, or when the sensitivity of firms to the price of financial assets sold η is less than 0.2, the carbon quota counterparty risk accelerates in the interfirm debt network. Otherwise, when the value exceeds the threshold, the variation range of the carbon quota counterparty risk becomes smaller in the interfirm debt network. Thus, the strategy of information disclosure, the credit risk contagion probability of carbon quotas among firms, and the price sensitivity of firms to the sale of financial assets considerably affect the formation of carbon quotas between counterparty risks in the market. If the effective prevention and management of carbon quota trading risks are to be achieved, then the government should be encouraged to market information, and firms should be reasonable, avoid blindly following, and adhere to the sensitivity of asset prices to reduce unnecessary losses. As shown in Figure 3c, the carbon quota counterparty risk shows a marginally increasing feature with the increase in the carbon performance γ in the interfirm debt network. Moreover, the variation range of the carbon quota counterparty risk is accelerated in the interfirm debt network; however, the overall variation range of the carbon quota counterparty risk is not obvious. Thus, the carbon performance in the interfirm network significantly improves financial performance, helps firms reduce costs, and increases the cost of firm technology; however, evidently, firm investment in new technology costs less than the benefits that the new technology will bring. As a result, the influence of the corporate carbon performance on the risks caused by firms is not obvious, and the overall change in the carbon quota counterparty risk is also not evident.
Moreover, as shown in Figure 3, the influence of the proportion of rational investors τ in the financial market, the probability of credit risk contagion of the carbon quota among firms ψ , the corporate carbon performance γ and the sensitivity of firms to the price of financial assets sold η on the formation of the carbon quota counterparty risk are mainly reflected in the change in the size of the losses suffered by firms due to asset price reductions in the interfirm debt networks. Conversely, the risk of carbon quota counterparties shows a gradual trend of extinction in interfirm debt networks. Thus, the single influencing factor of credit risk in carbon quota trading cannot play a leading role in the formation of carbon quota counterparty risk in the firm debt network. If the strategy of preventing and controlling the carbon quota counterparty risk is based on a single influencing factor, then it can easily cause deviation and has a limited effect.
Figure 4 depicts the correlation between the size of the carbon quota counterparty risk and the price sensitivity of financial assets. When the initial market price of the class h assets ρ ( h , t ) and the cumulative proportion of class h assets sold q h interact with the price sensitivity to the selling of financial assets η , the carbon quota counterparty risk in the interfirm debt network increases with the increase of the initial market price of the asset and the cumulative proportion of class h assets sold. However, generally, the carbon quota counterparty risk decreases with the increase in the firm’s sensitivity to the price of the financial assets sold. From Figure 4a,b, it can be seen that the initial market price of the financial assets and the cumulative proportion of the assets sold interact with sensitivity to selling the financial asset price in the interfirm debt network, and that the changes in the initial market price of the financial assets sold and the cumulative proportion of assets sold do not have significant effects on the carbon quota counterparty risk. This finding indicates that, when the government and firms develop strategies to prevent and control the risks of carbon quota trading, the government’s macro-control of the carbon quota price in the market can prevent and defuse the carbon quota counterparty risks to a certain extent, although it will not be evident. The change in the cumulative proportion of assets sold by firms is more evident than the effect of regulating the price of the carbon quota. Moreover, firms reduce the sale of financial assets, decrease the saturation of assets in the market, and adjust the relationship between supply and demand in the market to a certain extent. Therefore, firms reduce the cumulative proportion of assets sold, which has a certain effect on preventing and mitigating carbon quota counterparty risks.
Figure 5 depicts the correlation between the size of the carbon quota counterparty risk and the probability of credit risk contagion of the carbon quota among firms when the proportion of rational investors in the financial market, the cumulative proportion of class h assets sold, and the corporate carbon performance interact with the probability of the risk contagion of the carbon quota counterparties among firms. According to Figure 5a–c, it can be seen that the carbon quota counterparty risk decreases with the increase in the proportion of rational investors in financial markets, and increases with the increase in the cumulative proportion of assets sold and the corporate carbon performance in the firm debt network. However, with the increase in the probability of contagion of the carbon quota counterparty risk between firms, the risk of carbon quota counterparty risk increases and shows the characteristics of marginal decline. In the firm debt network, when the financial market proportion of rational investors τ , the cumulative proportion of class h assets sold q h , and the corporate carbon performance γ interact with the contagion probability ψ of the carbon credit counterparty risk, the interactions of corporate carbon performance and the contagion probability of the carbon quota counterparty risk on the risk of carbon quota counterparties are more obvious. However, in general, the changes in the proportion of assets sold, the proportion of rational investors in the financial market, and the corporate carbon performance do not have obvious effects on the risk of carbon quota counterparties. Hence, corporate carbon performance has a significantly positive incentive for firms to improve their financial performance, and a high-carbon performance can help firms to reduce financing costs, reduce losses, and hedge risks to a certain extent. These findings are consistent with the analysis in Figure 3c.
Figure 6 depicts the correlation between the size of the carbon quota counterparty risk and corporate carbon performance when the proportion of rational investors in the financial market, the cumulative proportion of class h assets sold, and the probability of credit risk contagion of the carbon quota among firms interact with the corporate carbon performance. When the financial market proportion of rational investors τ , the cumulative proportion of class h assets sold q h , and the contagion probability of the carbon quota counterparty risk ψ interact with corporate carbon performance γ , in the interfirm debt network, the risk of carbon quota counterparties decreases with the increase in the proportion of rational investors and the probability of contagion of carbon quota counterparties, and increases with the cumulative proportion of assets sold. According to Figure 6a–c, it can be seen that the risk of carbon quota counterparties shows marginally increasing characteristics with the increase in corporate carbon performance. In addition, the smaller the proportion of the rational investors in the financial market and the contagion probability of carbon quota counterparty risk among firms is, the larger the variation range of the carbon quota counterparty risk in the interfirm debt network will be. The smaller the cumulative proportion of assets sold is, the smaller the variation range of the carbon quota counterparty risk in the interfirm debt network will be. Thus, the larger the risk contagion probability of the carbon quota counterparty among firms and the proportion of rational investors in the financial market are, the more sensitive firms will be to asset prices and in the selection of and decision-making regarding counterparties. And the greater the degree of information disclosure is, the more transparent the information of the counterparties will be. The effects of counterparties on the formation of carbon quota counterparty risk in the interfirm debt network are gradually reduced. Therefore, when the proportion of rational investors in the financial market and the risk contagion probability of the carbon quota counterparty among firms is large, the formation of carbon quota counterparty risk in the interfirm debt network is less affected by the corporate carbon performance.
Figure 7 depicts the correlation between the size of the carbon quota counterparty risk and the proportion of rational investors in the financial market when the corporate carbon performance, the cumulative proportion of class h assets sold, and the contagion probability of the carbon quota counterparty risk among firms interact with the proportion of rational investors in the financial market. When the corporate carbon performance γ , the cumulative proportion of class h assets sold q h , and the contagion probability of carbon quota counterparty risk between firms ψ interact with the proportion of rational investors in the financial market, the risk of carbon quota counterparties increases with the increase in corporate carbon performance, the cumulative proportion of assets sold, and the probability of contagion of the carbon quota counterparties among firms. According to Figure 7a–c, it can be seen that the risk of carbon quota counterparties shows a marginal decline with the increase in the proportion of rational investors in the financial market. Furthermore, when the corporate carbon performance, cumulative proportion of assets sold, and contagion probability of carbon quota counterparty risk among firms are kept at a small state, they interact with the proportion of rational investors in the financial market. If the proportion of rational investors in the financial market is less than 0.1, then the risk of carbon quota counterparties among firms will not change with the proportion of rational investors in the financial market. Generally, the counterparty risk of carbon quota trading among firms is greatly affected by the proportion of rational investors in the financial market. This finding indicates that, in the initial stage of credit events, the disclosure degree of information about credit events tends to be consistent for the counterparties in financial markets, and the degree of market information circulation and disclosure, as well as investor sentiment, have greater effects on the risk of carbon quota counterparties. At the same time, the proportion of rational investors in the financial market has a greater influence on the risk of carbon quota counterparties among firms, and the government can implement strategies based on the information disclosure degree and investor sentiment to prevent and resolve the carbon quota counterparty risks among firms, and these strategies will work more effectively.
In sum, Figure 4, Figure 5, Figure 6 and Figure 7 verify Theorem 1. The figures indicate that, in the interfirm debt network, the proportion of rational investors in the financial market has the greatest influence on the formation of the carbon quota counterparty risk, followed by the influence of the sensitivity of firms to the sale of financial assets on the formation of the carbon quota counterparty risk; corporate carbon performance has the least influence on the formation of the carbon quota counterparty risk. Thus, information disclosure and investor sentiment are crucial to firms in trading, and the more complete the information held by the firm is, the more rationally the state will be maintained, and, thus, the decisions made by the firm can avoid losses caused by the risks. However, the positive incentive effect of carbon performance on corporate financial performance will make firms fall into the illusion of good financial condition, but it will only temporarily cause insensitivity of firms to the price of selling financial assets. Nevertheless, corporate carbon performance generally has a positive effect on corporate financial performance, and the losses caused to firms are negligible.

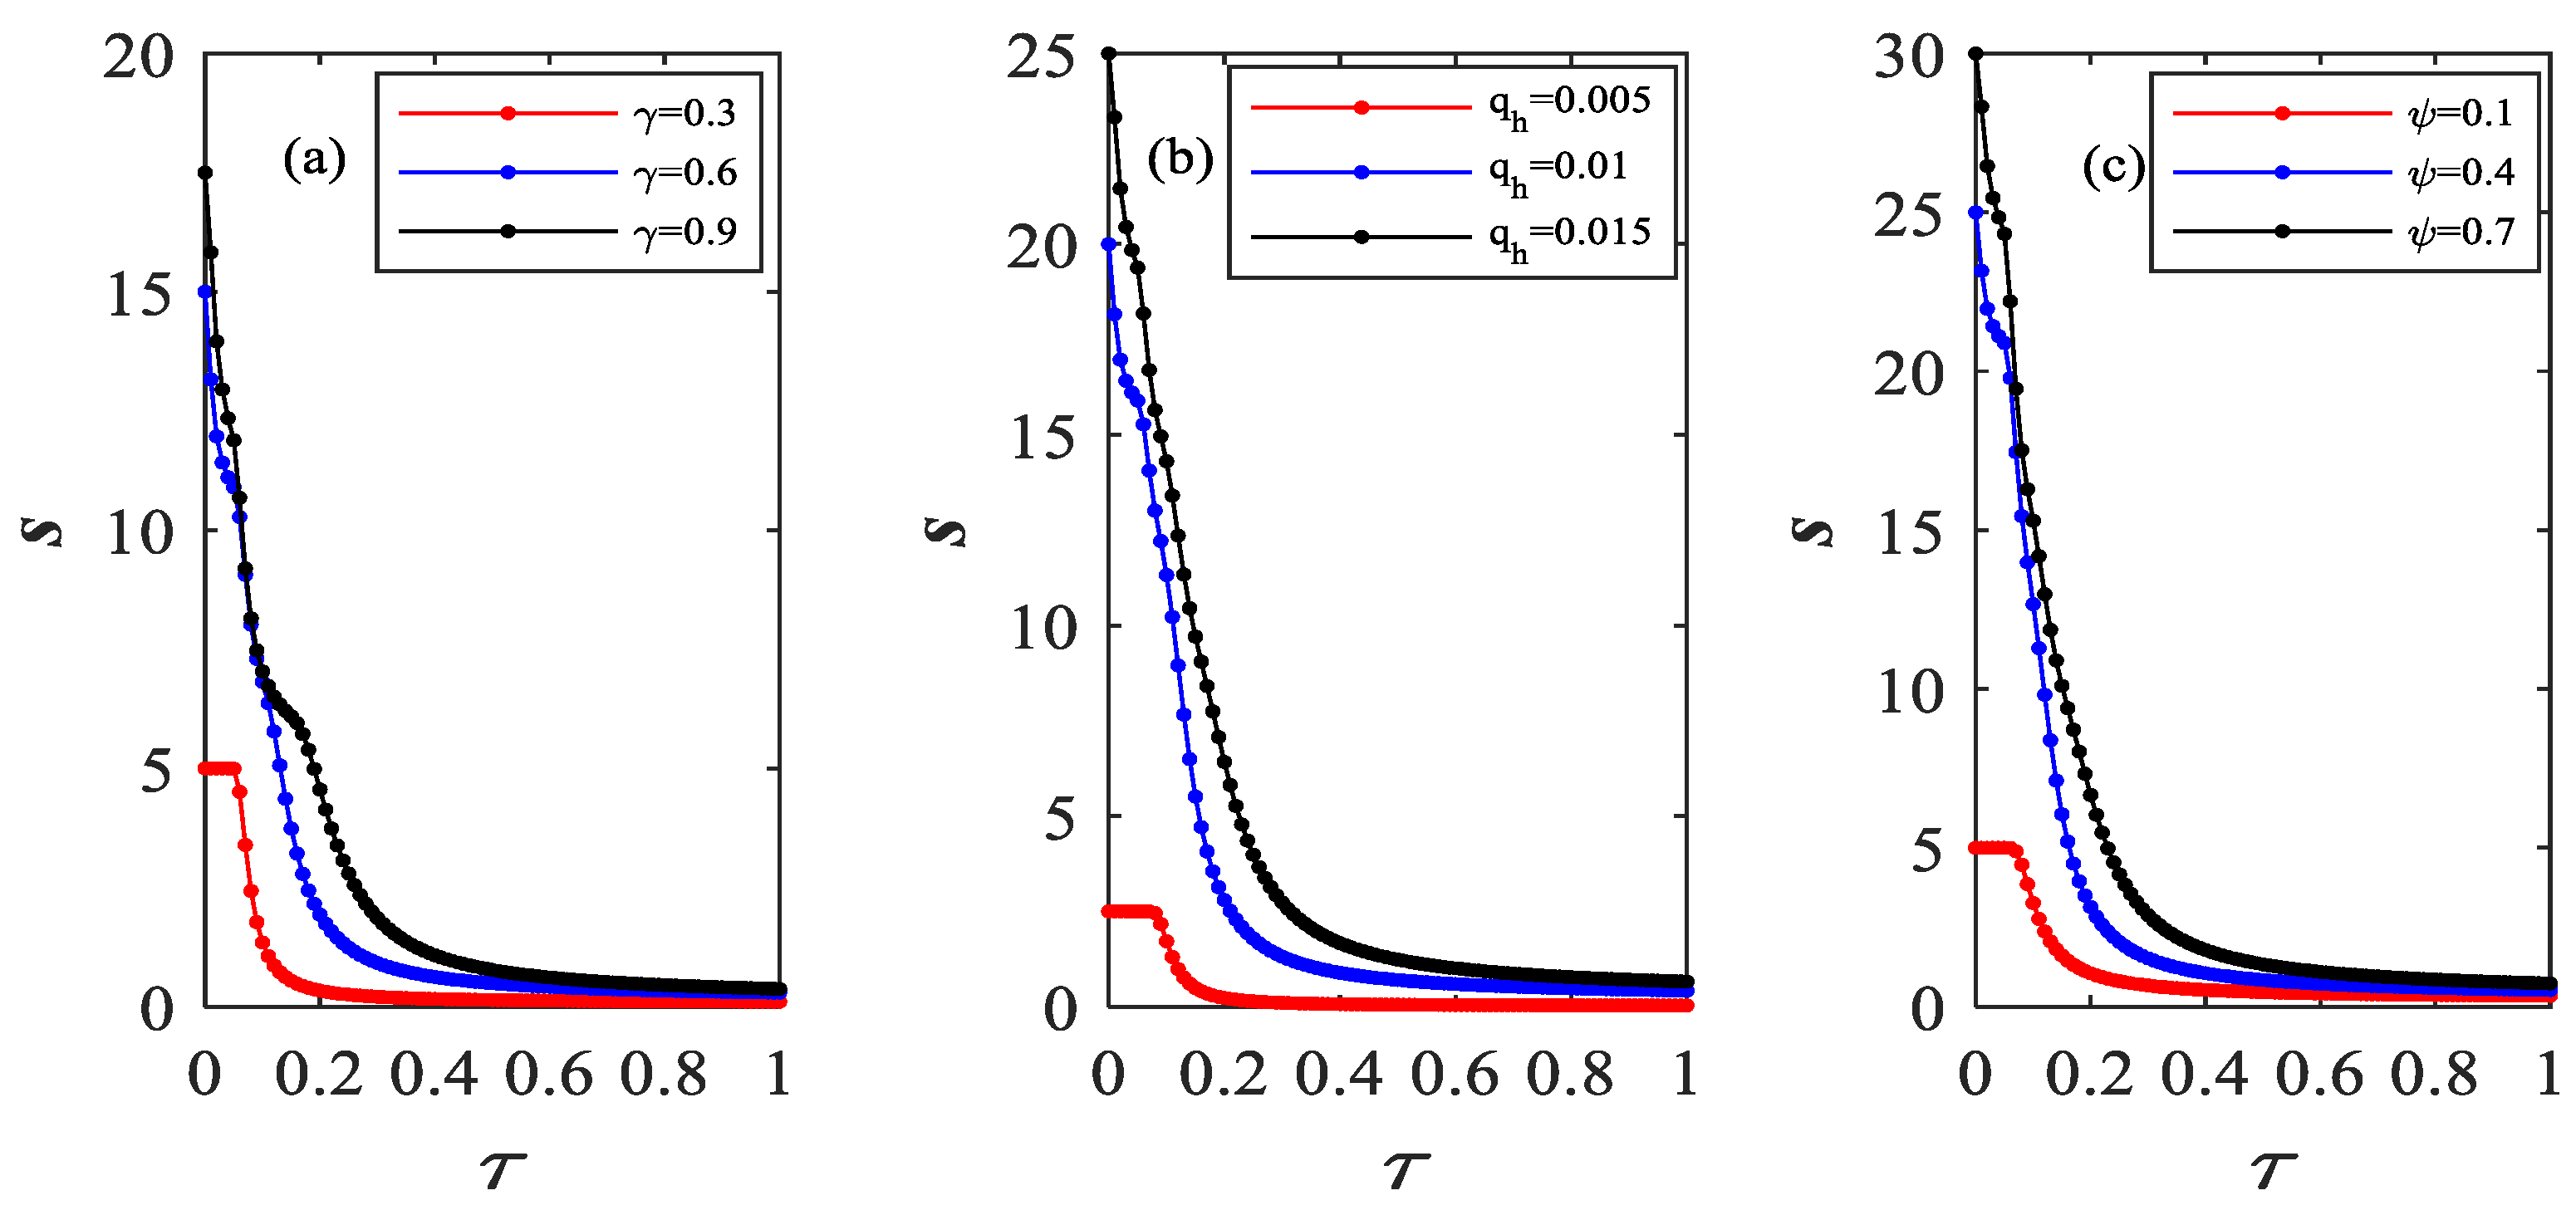
5.2. Risk Contagion Effect of Carbon Quota Counterparties

In order to describe the evolution characteristics of the risk contagion effect of carbon quota counterparties, the evolution characteristics of the risk contagion effect of carbon quota counterparties are simulated by different parameter values of the carbon risk awareness α , carbon quota trading price P , corporate carbon performance γ , and total score of interfirm assessment F i j z .
Figure 8 depicts the correlation between the risk contagion probability of carbon quota counterparties and the corporate carbon risk awareness, the trading price of carbon quota, the corporate carbon performance, and the total score of interfirm assessment. It also verifies some of the conclusions of Theorems 2 and 3. As shown in Figure 8a,b, the risk contagion probability of the carbon quota counterparty in the interfirm debt network shows a decreasing marginal feature with the increase in the carbon risk awareness α and carbon quota trading price P . As shown in Figure 8c,d, the risk contagion probability of the carbon quota counterparty in the interfirm debt network shows a marginally increasing feature with the increase in the carbon performance γ and the total score of interfirm assessment F i j z . The analysis of Figure 8 shows that the probability of the risk contagion of carbon quota counterparties does not start from 0, and the variation range of the carbon quota counterparty risk in the interfirm debt network does not change significantly. Hence, the influencing factors of the credit risk contagion of single carbon quota transactions cannot play a leading role in the influence of the risk contagion of carbon quota counterparties in the interfirm debt network. Moreover, if the strategy of preventing and controlling the risk contagion of carbon quota counterparties is based on a single influencing factor, then it can easily cause deviation and has a limited effect.
Figure 9 depicts the correlation between the risk contagion probability of carbon quota counterparties and the corporate carbon risk awareness when the trading price of the carbon quota, the total score of the interfirm assessment, and the corporate carbon performance interact with the corporate carbon risk awareness. Figure 9 also verifies part of the conclusion of Theorem 2. According to Figure 9, when the trading price of the carbon quota P , the total score of the interfirm assessment F i j z , and the corporate carbon performance γ interact with the corporate carbon risk awareness α , the risk contagion probability of the carbon quota counterparties in the interfirm debt network presents a decreasing marginal feature with the increase in the corporate carbon risk awareness. Figure 9a shows that the higher the trading price of the carbon quota is, the higher the risk contagion probability of the carbon quota counterparties will be when the trading price of the carbon quota P intersects with corporate carbon risk awareness α . However, in the interfirm debt network, the risk contagion probability of the carbon quota counterparties is not significantly affected by the trading price of carbon quota. Figure 9b,c shows that, when the total score of the interfirm assessment F i j z and the corporate carbon performance γ interact with the corporate carbon risk awareness α , the higher the total score of interfirm assessment and the higher the corporate carbon performance are, the higher the contagion probability of carbon quota counterparties risk will be. The contagion of the carbon quota counterparties risk changes with the increase in the total score of the interfirm assessment in the debt interfirm network. Thus, a single influencing factor in the debt interfirm network has little impact on the risk contagion effect of carbon quota counterparties. However, with the intersection of the corporate carbon performance and the total score of interfirm assessment, the correlation of debt, such as carbon quotas between firms, has increased, which has a greater effect on the risk contagion of carbon quota counterparties. Conversely, the trading price of the carbon quota is affected by the market supply and demand, and the influence of its change on the risk contagion of carbon quota counterparties tends to be consistent.
Figure 10 depicts the correlation between the risk contagion probability of carbon quota counterparties and the corporate carbon performance when the trading price of the carbon quota, the total score of the interfirm assessment, and the corporate carbon risk awareness interact with corporate carbon performance. Figure 10a,b verifies the conclusion of Theorem 2. As shown in Figure 10a,c, when the trading price of the carbon quota P and the corporate risk consciousness α interact with the corporate carbon performance γ in the debt interfirm network, the risk contagion probability of carbon quota counterparties shows a marginal incremental characteristic in the increase in the corporate carbon performance. The higher the trading price of the carbon quota and the carbon risk awareness are, the lower the risk contagion probability of the carbon quota counterparties will be. Moreover, in the debt interfirm network, the risk contagion probability of the carbon quota counterparties does not change significantly because of the influence of the carbon quota trading price and carbon risk awareness. Figure 10b shows that, when the total score of interfirm assessment F i j z interacts with the corporate carbon performance γ and the total score of the interfirm assessment is less than 0, the risk contagion probability of the carbon quota counterparties in the debt interfirm network presents a decreasing marginal feature with the increase in the corporate carbon performance. When the total score of the interfirm assessment is greater than 0, in the debt interfirm network, the risk contagion probability of the carbon quota counterparties shows an increasing marginal feature with the increase in the corporate carbon performance. Moreover, a positive or negative total score of the interfirm assessment will change the trend in the risk contagion of carbon quota counterparties in the debt interfirm network. In addition, when the total score of the interfirm assessment is lower, the change range of the probability of the risk contagion of carbon quota counterparties in the debt interfirm network will accelerate with the change in corporate carbon performance. Thus, when firms trade with firms with small assets and low correlation degrees, firms are more likely to have credit events due to the lack of understanding of counterparties information and the small size of counterparties assets. Given that small-scale firms do not have a strong capital base, firms that trade with them are less resistant to risks. As a result, the risk contagion of the carbon quota counterparties in the debt interfirm network is intensified.
Figure 11 depicts the correlation between the risk contagion probability of carbon quota counterparties and the trading price of the carbon quota when the corporate carbon performance, the total score of the interfirm assessment, and the corporate carbon risk awareness interact with the trading price of the carbon quota. Figure 11a,b verifies Theorem 2. As shown in Figure 11a,c, when the corporate carbon performance γ and corporate carbon risk awareness α interact with the trading price of the carbon quota P , the risk contagion probability of the carbon quota counterparties in the debt interfirm network presents a decreasing marginal feature with the increase in the trading price of the carbon quota. The higher the corporate carbon performance is, the higher the risk contagion probability of carbon quota counterparties will be. Further, the higher the carbon risk awareness is, the lower the risk contagion probability of carbon quota counterparties in the debt interfirm network will be. Figure 11b shows that, when the total score of the interfirm assessment F i j z interacts with the trading price of the carbon quota P , and the total score of interfirm assessment is less than 0, the risk contagion probability of the carbon quota counterparties in the debt interfirm network presents an increasing marginal feature with the increase in the trading price of the carbon quota. When the total score of the interfirm assessment is greater than 0, in the debt interfirm network, the risk contagion probability of the carbon quota counterparties shows a decreasing marginal feature with the increase in the carbon quota trading price. Moreover, when the corporate carbon performance, the total score of the interfirm assessment, and the corporate carbon risk awareness interact with the carbon quota trading price, the change trend in the probability of the risk contagion of carbon quota counterparties in the debt interfirm network does not change significantly with the change in the carbon quota trading price. Thus, the trading price of the carbon quota is influenced by the market supply and demand, and its price is always fluctuating around a fixed value. Therefore, the intersection of the corporate carbon performance, the total score of the interfirm assessment, the corporate carbon risk awareness, and the trading price of the carbon quota tend to be consistent with the influence of the risk contagion of carbon quota counterparties.
Figure 12 depicts the correlation between the risk contagion probability of carbon quota counterparties and the total score of the interfirm assessment when the corporate carbon performance, the trading price of the carbon quota, and the corporate carbon risk awareness interact with the total score of the interfirm assessment. It also validates Theorem 3. As shown in Figure 12a, when the corporate carbon performance γ interacts with the total score of the interfirm assessment F i j z , the risk contagion probability of the carbon quota counterparties in the debt interfirm network shows an increasing marginal feature with the increase in the total score of the interfirm assessment. Moreover, when the corporate carbon performance is 0.3, the probability of contagion of the carbon quota counterparties risk does not change with the change curve of the total score of the interfirm assessment. When the corporate carbon performance is greater than 0.3, the risk contagion probability of the carbon quota counterparties changes significantly with the change curve of the total score of interfirm assessment. When the total score of the interfirm assessment is 0, it indicates the inflection point of the change curve, and the curve of the probability of risk contagion of carbon quota counterparties becomes increasingly significant with the increase in the corporate carbon performance. Thus, the corporate carbon performance has a significantly positive incentive effect on the occurrence of carbon quota trading, innovation and invention, and other emission reduction measures of firms. When the corporate carbon performance is small, the possibility of carbon quota transactions between firms is also small, so the influence of the debt correlation between firms is insignificant. Thus, when the corporate carbon performance and the total score of the interfirm assessment is small and intersecting, the curve of change in the probability of risk contagion of carbon quota counterparties is not significantly bumpy.
Figure 12b,c shows that, when the trading price of the carbon quota P and the total score of the interfirm assessment F i j z interact with each other, the probability of the risk contagion of carbon quota counterparties in the debt interfirm network shows an increasing marginal feature with the increase in the total score of the interfirm assessment. When the corporate carbon risk awareness α and the total score of the interfirm assessment F i j z interact with each other, the risk contagion probability of carbon quota counterparties in the debt interfirm network shows a marginally increasing feature with the increase in the total score of interfirm assessment, and the greater the carbon risk awareness is, the smaller the risk contagion probability of the carbon quota counterparties will be. Moreover, with the increase in the carbon quota price, the starting point of the change curve of the risk contagion probability of carbon quota counterparties and the total score of the interfirm assessment increases slightly, and the change curve of the change range decreases slightly. However, generally, the probability of the risk contagion of the carbon quota counterparties in the debt interfirm network does not change significantly with the change curve of the total score of the interfirm assessment. With the increase in the corporate carbon risk awareness, the starting point floating degree of the change curve of the contagion probability of the carbon quota counterparties risk with the change in the corporate carbon risk awareness is larger. However, in general, in the debt interfirm network, the change curve of the contagion probability of the carbon quota counterparties risk and the corporate carbon risk awareness has a significant upward shift, but no significant changes are observed in the trends. Thus, regulating the market price of the carbon quota alone by the government is insufficient, and firms must improve their awareness of carbon risk and their capacity to resist risks. Therefore, the strategy of preventing and controlling the risk contagion of carbon quota counterparties based on multiple factors is more effective.
Figure 8, Figure 9, Figure 10, Figure 11 and Figure 12 verify Theorems 2 and 3. The findings show that a single factor cannot explain the risk formation and contagion effects of the carbon quota counterparties. Instead, studying the risk formation and contagion effects of the carbon quota counterparties risk by examining the cross-interaction of multiple factors is more significant and in line with the actual financial market and trading environment.

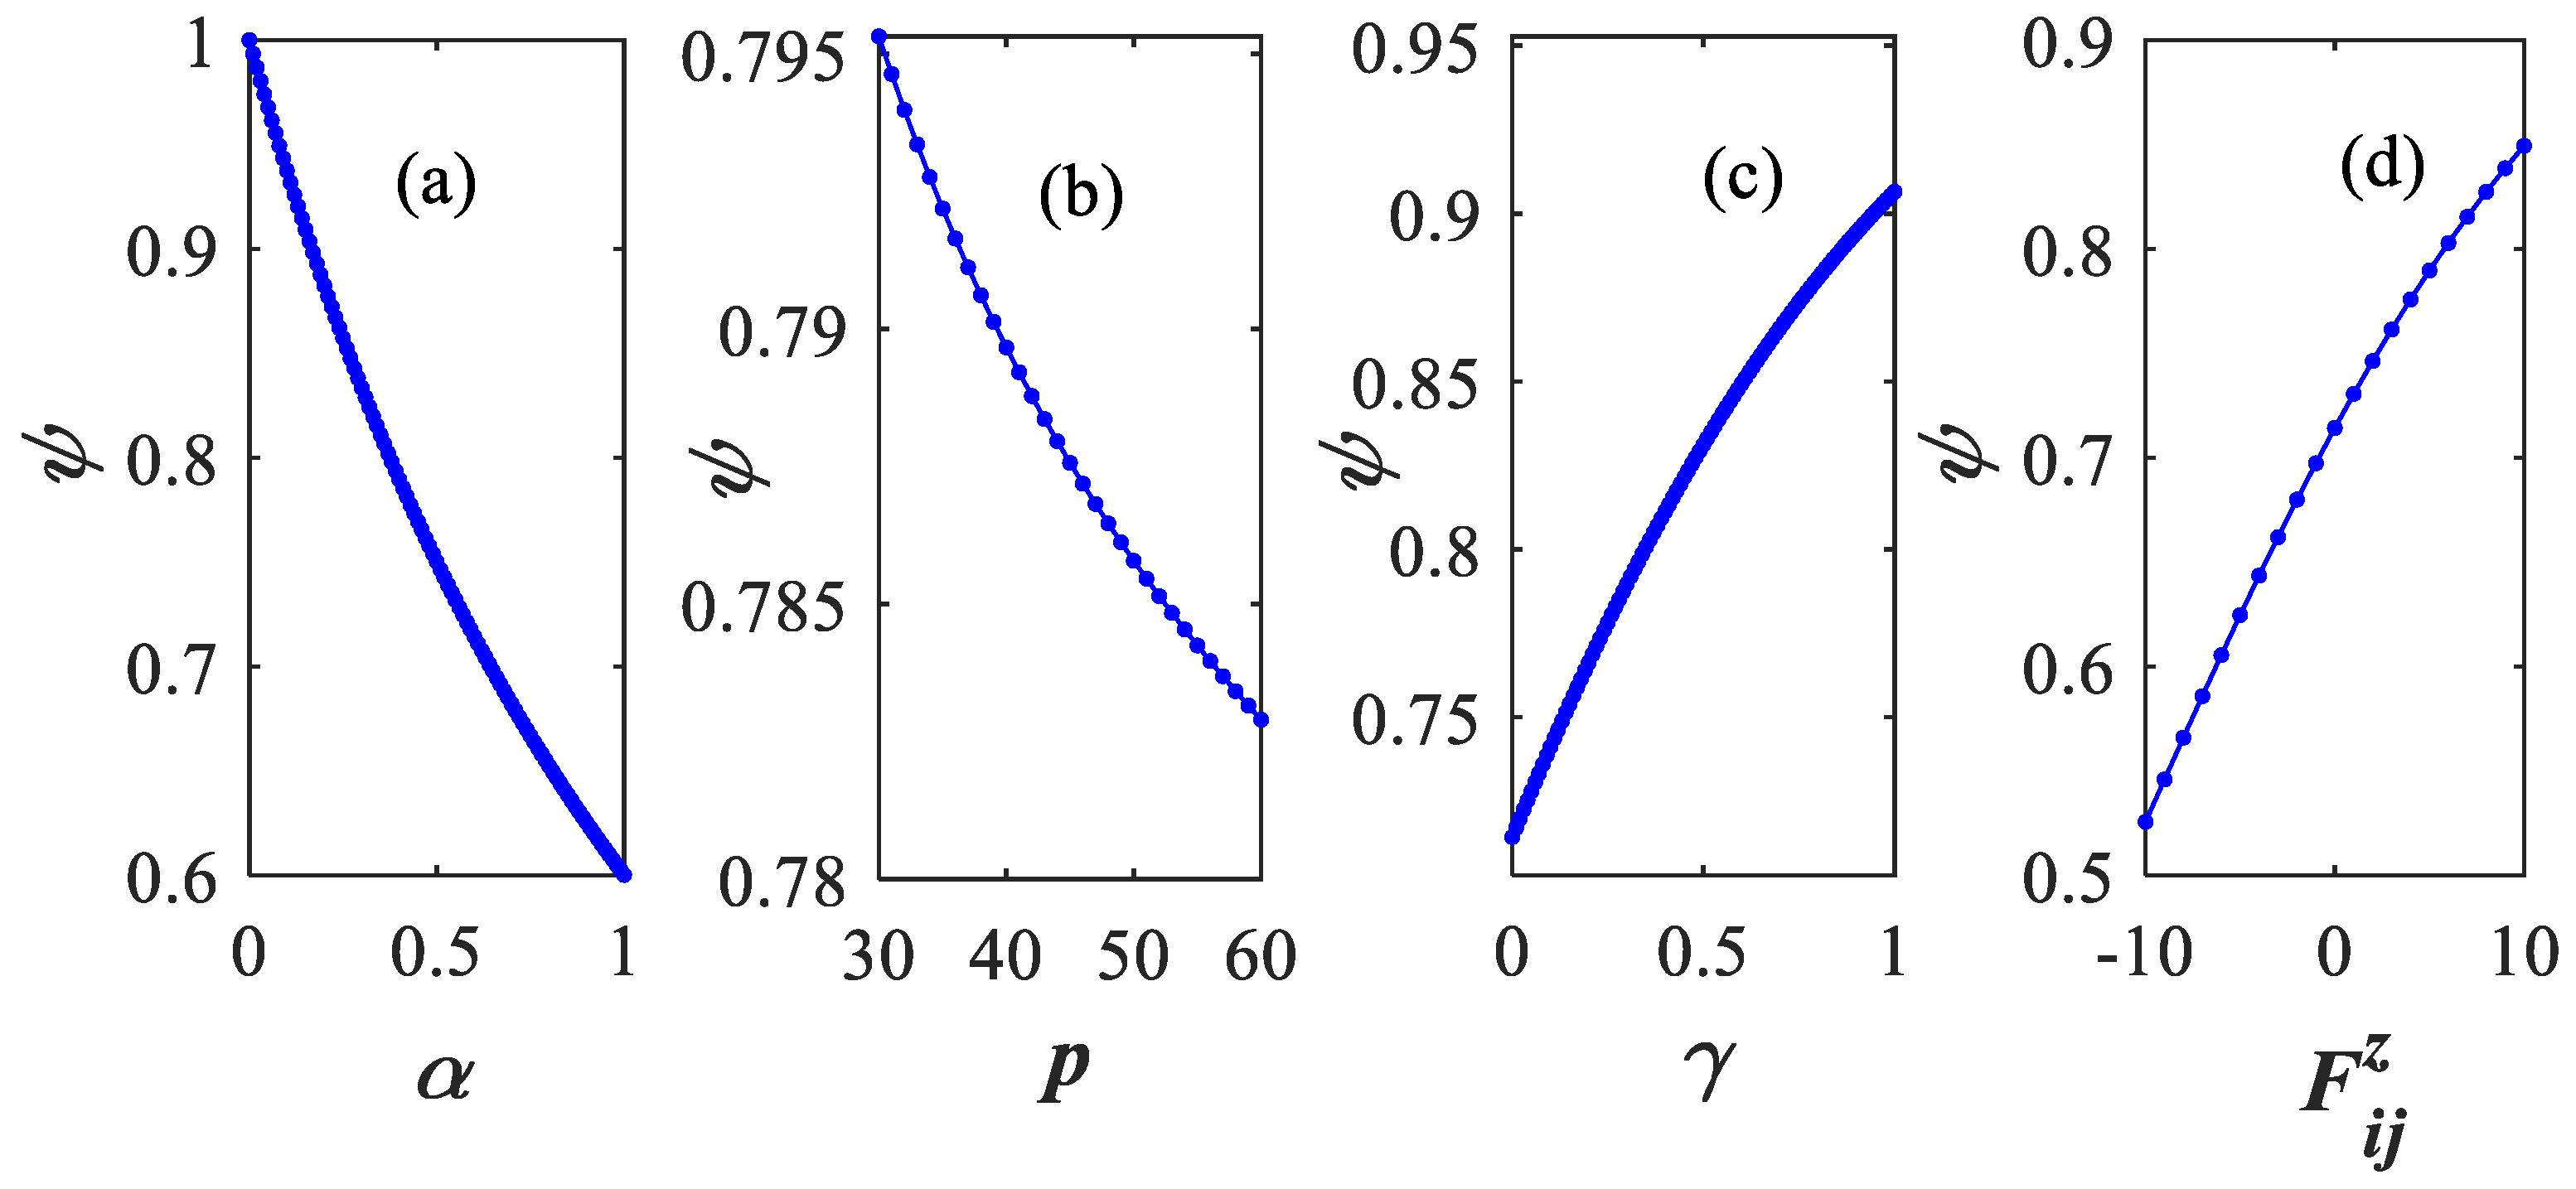
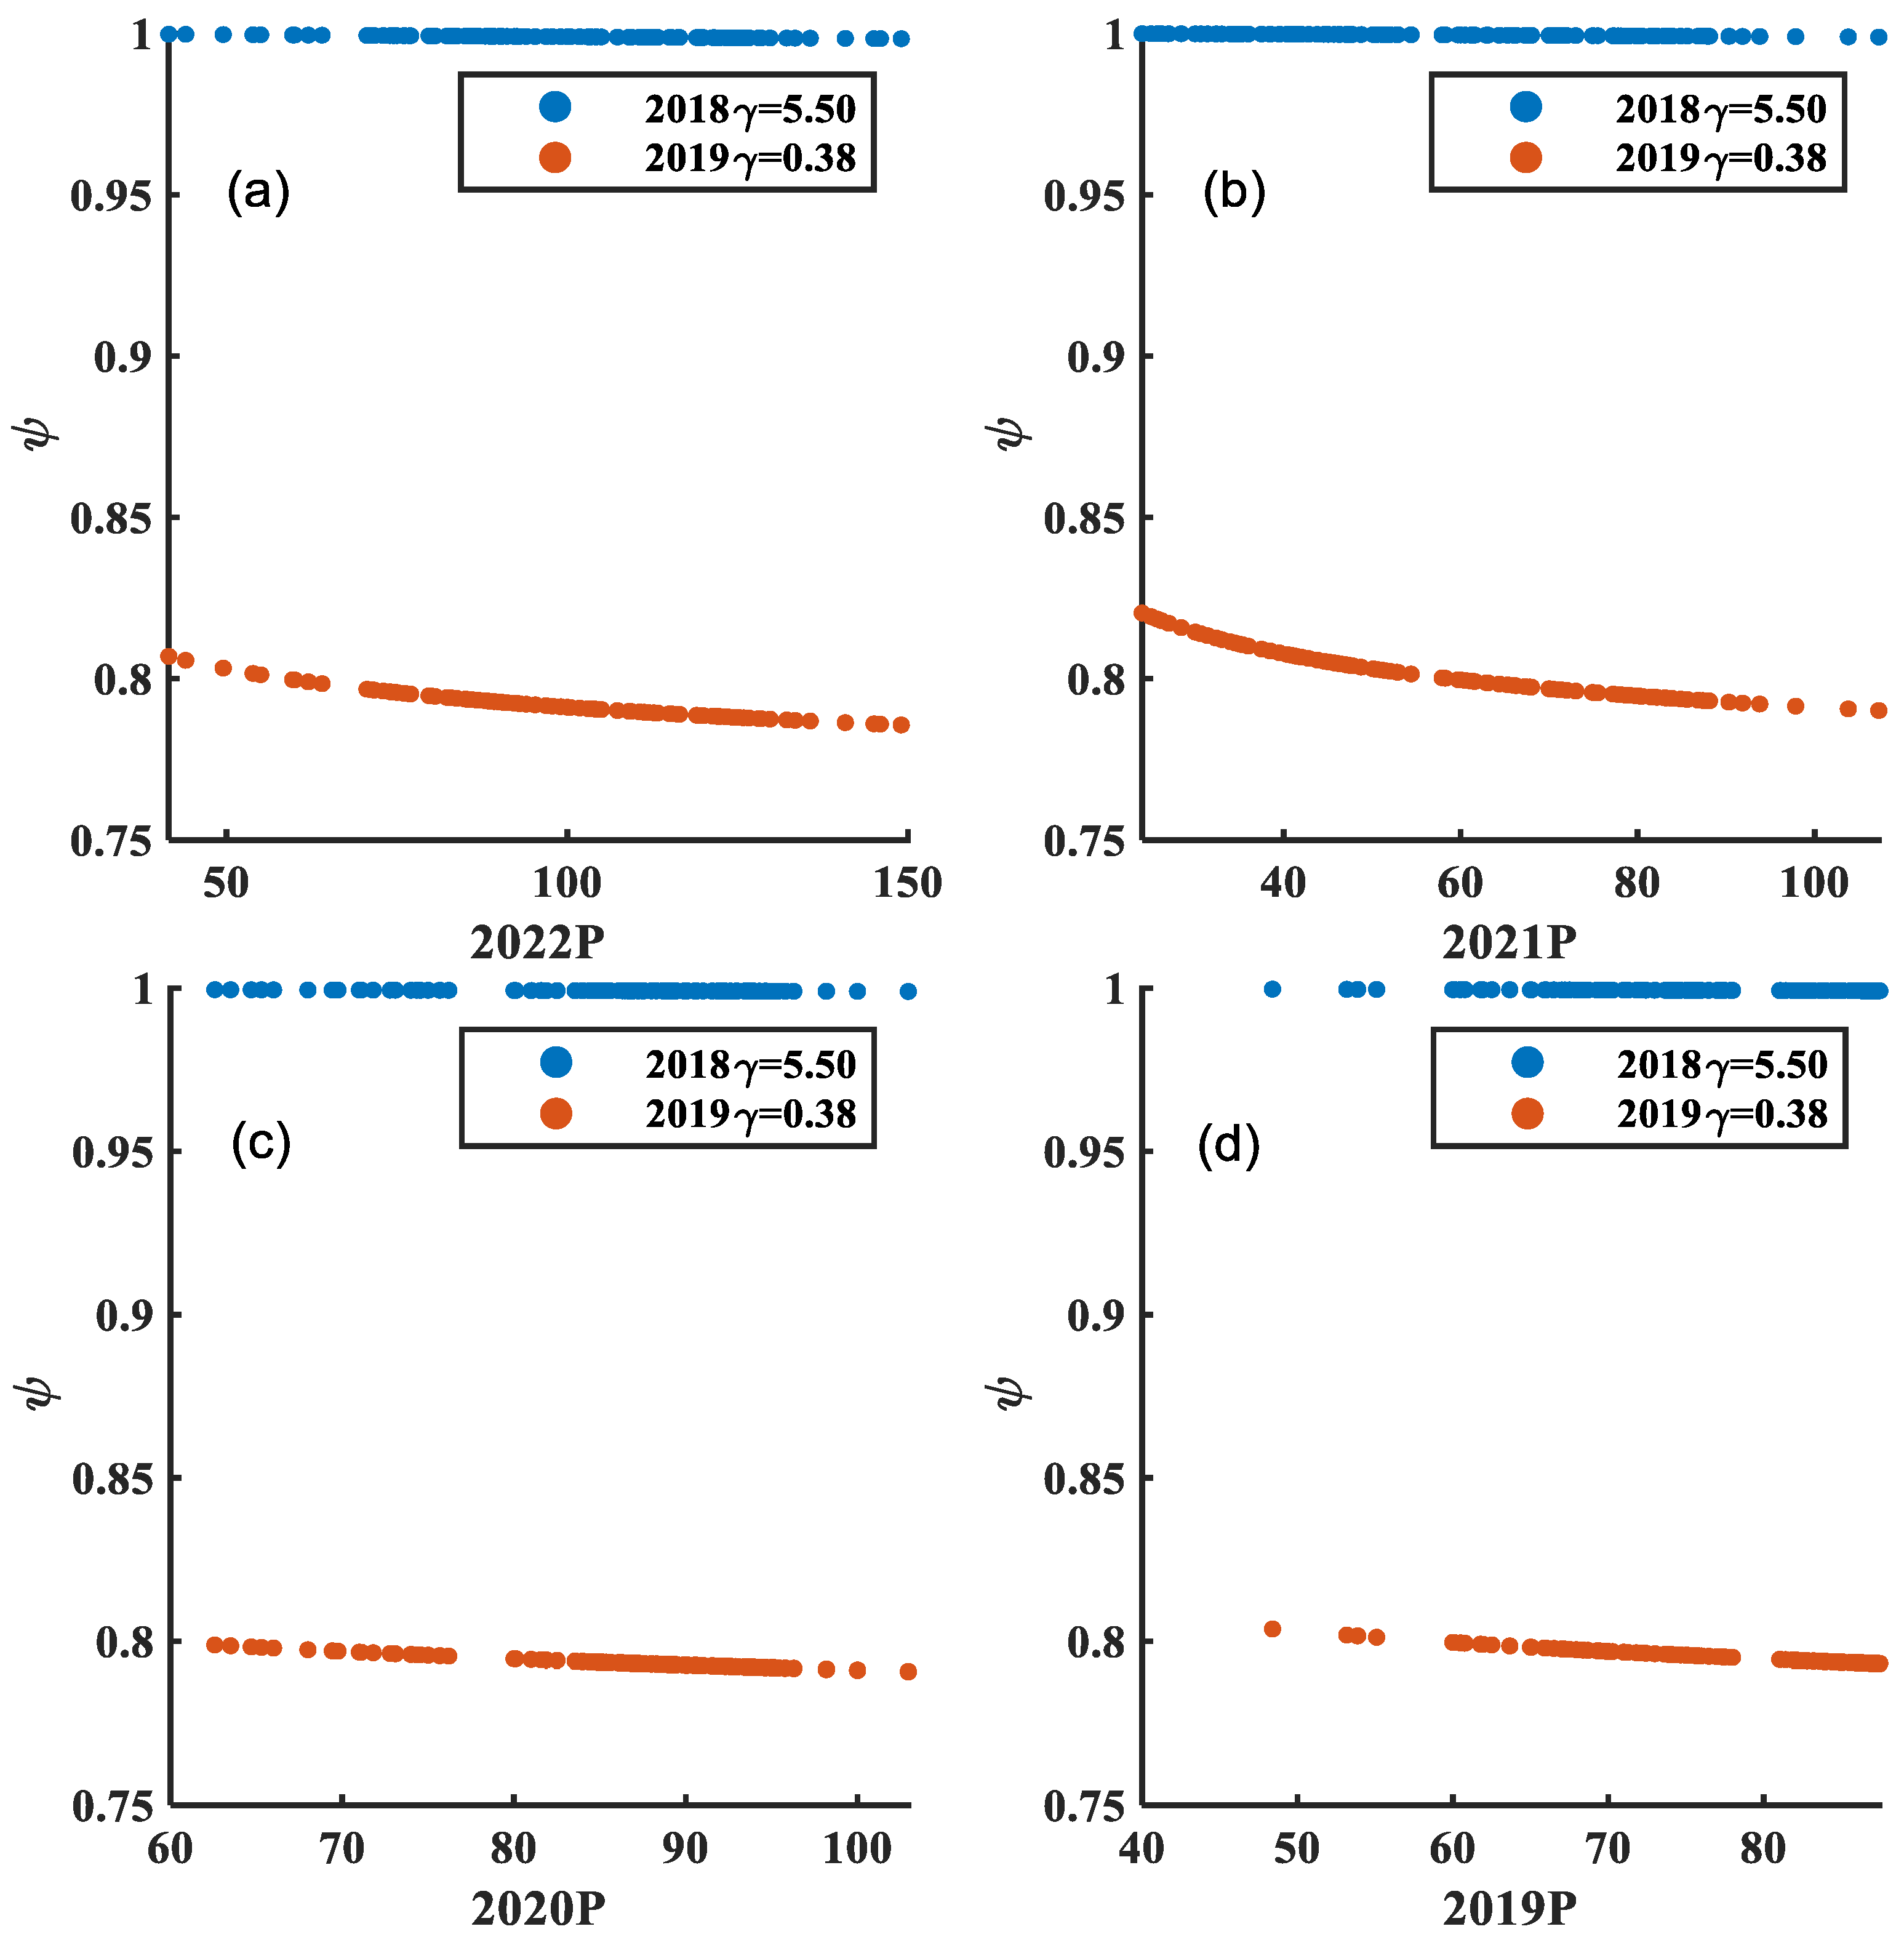
5.3. Carbon Quota Counterparty Risk Contagion Effect Based on Carbon Trading Data and Corporate Carbon Emission Intensity

In order to better verify the network model of the counterparty risk contagion of the carbon quota, this part of this paper uses the average daily transaction price of carbon emission allowances from 2019 to 2022 of the Beijing Green Exchange and the data of more than 230 chemical firms, and simulates the evolution characteristics of counterparty risk contagion effects through different parameter values of the carbon quota trading price P and corporate carbon performance γ .
Figure 13 depicts the correlation between the risk contagion probability of carbon quota counterparties and the corporate carbon performance under the interaction between the corporate carbon performance and carbon quota trading price in 2018–2019. Figure 13 better verifies Theorem 3. From Figure 13, under the interaction between the corporate carbon performance and carbon quota trading price, the risk contagion probability of carbon quota counterparties in the debt interfirm network shows a marginally increasing characteristic with the increase in the corporate carbon performance. This is consistent with the results in Figure 8 and Figure 10. Furthermore, Figure 13a,b shows that the higher the trading price of the carbon quota is, the lower the probability of contagion of counterparty risks of the carbon quota will be. In 2018, the corporate carbon performance was generally high, which had a greater impact on the risk contagion of carbon quota counterparties. This is because, in 2018, in the early stage of the development of low-carbon green emission reduction, firms could obtain greater emission reduction benefits through the implementation of emission reduction strategies, and, in 2019, with the introduction and popularization of green emission reduction policies, the marginal benefits of green emission reduction strategies in firms decreased, so the carbon performance of firms gradually decreases with the popularity of green emission reduction strategies, and the impact on the risk contagion of carbon quota counterparties also decreases.
Figure 14 depicts the correlation between the risk contagion probability of the carbon quota counterparties and the price of carbon quota trading from 2019 to 2022 under the interaction between the trading price of the carbon quota and the corporate carbon performance. Figure 14 better verifies Theorem 2. Figure 14 shows that, under the interaction between the corporate carbon performance and carbon quota trading price, the risk contagion probability of the carbon quota counterparties in the debt interfirm network shows a marginally decreasing characteristic with the increase in the carbon quota trading price. This is consistent with the results shown in Figure 8 and Figure 11. Furthermore, Figure 14 shows that the interaction between the carbon quota trading price and the corporate carbon performance in 2018 had a great impact on the risk contagion effect of carbon quota counterparties, but there is no obvious change trend. Conversely, the interaction between carbon quotas and the corporate carbon performance in 2019 had a more obvious marginal diminishing impact on the change trend of counterparties risks of the carbon quota between firms. This shows that, under the “dual carbon” goal, in the early stage of green and low-carbon development, the low-carbon emission reduction behavior of firms can bring greater benefits, stimulate carbon trading behavior between firms, increase the risk contagion channel of carbon counterparties between firms, and aggravate the contagion of risks, but with the development of green and low-carbon, low-carbon emission reduction of firms has become a common behavior, so the benefits brought by this behavior to firms show marginal decreasing characteristics, thereby reducing the risk contagion of carbon quota counterparties. This is consistent with the results of Figure 13. Therefore, for the current general understanding of green and low-carbon firms, the impact of the carbon performance carbon quota trading price on the risk contagion of carbon quota counterparties in 2019 is of more significance as a reference.
Figure 13 and Figure 14 verify Theorems 2 and 3. The findings show the impact of the interaction between the corporate carbon performance and carbon trading price on the risk contagion of carbon quota counterparties. With the development of green and low-carbon, the carbon performance of firms and the impact on the risk contagion of carbon counterparties is gradually decreasing.

5.4. Robustness Analysis

To test the robustness of factors which affect counterparties risk formation and contagion in carbon quota trading, this article performs a sensitivity analysis of the parameters (Table 3, Table 4, Table 5, Table 6 and Table 7). The variation trend of the same parameter is basically the same under different values, indicating strong robustness.
The sensitivity analysis in Table 3 further validates Theorem 1. It shows that the higher the initial market price of the class h asset is, the higher the carbon quota counterparties risk and the greater the volatility of the carbon quota counterparties risk will be, and the latter is more sensitive to the initial market price of the asset. The higher the sensitivity of a firm to the price of financial assets sold is, the lower the risk of carbon quota counterparties and the smaller the volatility of the risk of carbon quota counterparties will be, is the latter being less sensitive to the price sensitivity of a firm to the price of financial assets sold. Thus, when the sensitivity of the firm to the price of selling financial assets increases to a certain extent, the marginal benefit of the firm’s sensitivity to the price of selling financial assets to the risk of the carbon quota counterparties does not change significantly, which is consistent with the analysis in Figure 5.
Theorem 1 is further verified by the sensitivity analyses in Table 4 and Table 5. The findings indicate that the higher the corporate carbon performance is, the greater the carbon quota counterparties risk and the larger the degree of fluctuation of the carbon quota counterparties risk will be, with the latter being more sensitive to the corporate carbon performance. The larger the proportion of rational investors in the market is, the smaller the risk of carbon quota counterparties will be, the smaller the degree of fluctuation of carbon quota counterparties risk will be, and the less the sensitivity to the proportion of rational investors in the market will be. The higher the contagion probability of credit risk contagion of the carbon quota among firms is, the smaller the carbon quota counterparties risk will be. When the proportion of rational investors in the market is small, the carbon quota counterparties risk is more sensitive to the proportion of rational investors in the market, and the degree of fluctuation is larger, which is consistent with the analysis in Figure 7.
Theorems 2 and 3 are further verified by the sensitivity analyses in Table 6 and Table 7. The findings show that the higher the corporate carbon risk awareness is, the lower the risk contagion probability of carbon quota counterparties will be. However, the volatility of the carbon quota counterparties risk is not obvious, indicating that the risk contagion probability of carbon quota counterparties is not significantly sensitive to the corporate carbon risk awareness; this is because the factors which influence the risk of carbon quota counterparties are complex and changeable, and the most important influencing factors are policy uncertainty and the volatility of carbon asset trading prices, etc., while corporate carbon risk awareness mainly plays a role in avoiding corporate carbon counterparties risk, in addition to carbon risk awareness, carbon performance, financial performance, and other factors which also affect corporate the carbon quota counterparties risk; the single factor of firms has no significant impact on carbon quota counterparties risk, Which is consistent with the analysis in Figure 9. When the corporate carbon performance is more than 0, the greater the corporate carbon performance is, the greater the risk contagion probability of the carbon quota counterparties will be, and the smaller the volatility of the risk contagion of carbon quota counterparties and its sensitivity to the corporate carbon performance will be, which is consistent with the analyses in Figure 10 and Figure 12a. At the same time, Table 5 and Table 6 reflect that the change in the carbon quota trading price does not make the probability of the risk contagion of carbon quota counterparties fluctuate greatly, but the probability of the risk contagion of carbon quota counterparties is more sensitive to the positive or negative total score of the interfirm assessment. These findings are consistent with the analyses in Figure 9, Figure 10, Figure 11 and Figure 12.

6. Conclusions

On the basis of the perspective of green finance, this paper analyzes the contagion mechanism of the carbon quota counterparties risk, constructs a network contagion model of the carbon quota counterparties risk with the help of complex network theory, and then simulates and analyzes the evolution characteristics of the formation and contagion effects of the carbon quota counterparties risk. Through theoretical analysis and simulation, the following main conclusions are obtained:
(1) In terms of carbon quota counterparties risk, in the interfirm debt network, the risk of carbon quota counterparties decreases with the increase in the price sensitivity of firms to the sale of financial assets, the proportion of rational investors in financial markets, the probability of credit risk contagion of carbon quotas among firms, and the cumulative proportion of assets sold. The rational investors in financial markets have the greatest effect on the risk of carbon quota counterparties, followed by the price sensitivity of firms to the sale of financial assets. The risk of carbon quota counterparties increases with the increase in the corporate carbon performance, but its range of change is the smallest. Therefore, for the government and other relevant regulatory authorities, the formulation of counterparties risk prevention and control strategies for carbon quotas should focus on controlling the information liquidity of the financial market, such as disclosing relevant news through information sharing platforms and official media and reducing the impact of information asymmetry in the market, so as to achieve the purpose of increasing the proportion of rational investors in the financial market and enhancing the sensitivity of firms to asset sale prices, and to effectively regulate the counterparties risk of carbon quotas. For firms, formulating a counterparties risk prevention and control strategy for carbon allowances involves adopting multi-channel, multi-dimensional, and multi-party information collection methods, classifying information according to the relevance of the information, and adding different attention to grasp and analyze market information, which can effectively increase the rational decision-making of firms and enhance the sensitivity of selling asset prices.
(2) In terms of carbon quota counterparties risk contagion, in the interfirm debt network, the risk contagion probability of the carbon quota counterparties decreases with the increase in carbon risk awareness and the trading price of carbon quota, and increases with the increase in the corporate carbon performance and the total score of interfirm assessment. The trading price of the carbon quota has the least influence on the risk contagion probability of carbon quota counterparties. The corporate carbon risk awareness has the greatest effect on the risk contagion probability of carbon quota counterparties. When the total score of the interfirm assessment interacts with the carbon performance, the trading price of the carbon quota, and carbon risk awareness, it will not only change the trend of the risk contagion probability of the carbon quota counterparties but also its range. With the development of green and low-carbon, the impact of carbon performance change on the risk contagion of carbon quota counterparties between firms becomes smaller. Therefore, for the government and other relevant regulatory authorities, the strategy of “one focus, two supervision” should be adopted when formulating strategies to prevent and control the risk contagion of carbon quota counterparties, that is, focusing on cultivating firms’ awareness of carbon risks, such as strengthening green and low-carbon publicity, increasing support for green projects, and establishing green and low-carbon typical firms, as well as supervising the carbon trading price in the carbon trading market and adjusting the carbon trading price in a timely manner through relevant carbon policies such as quota ratios and carbon subsidies; at the same time, it supervises the carbon performance of firms, formulates differentiated preferential policies according to carbon performance, and encourages firms to reduce green emissions. For firms, when formulating strategies to prevent and control the risk contagion of carbon quota counterparties, they can adopt the prevention and control strategy of “one focus and one assessment,” that is, identifying relevant knowledge and information about carbon risks through multiple information channels, absorbing and cultivating carbon talents at the same time, and cooperating with universities to carry out the training of carbon risk talents, focusing on improving firms’ awareness of carbon risks, as well as strengthening the evaluation of carbon counterparties, setting up “asset-credit” dual-dimensional assessment of carbon counterparties, and selecting firms with strong assets, high credit, and close business of firms to cooperate.
The conclusions of this paper not only enrich the research results of interfirm debt network and carbon quota risk contagion but also provide a theoretical reference for the government and firms to formulate strategies to prevent and defuse carbon quota counterparty risk and prevent and control the risk contagion of carbon quota counterparties. However, this research has focused on carbon trading counterparty risk, carbon quota only from carbon trading price, and the influence of the carbon tax on carbon trading. It does not fully consider the effects of mixed policies on carbon trading and carbon taxes on corporate behavior, carbon performance, carbon risk awareness, and other factors, which will be the focus of future research.

Author Contributions

Methodology, Y.H., L.W. and Y.H.; Formal analysis, T.C. and Z.L.; Writing—original draft, T.C. and Y.H.; Writing—review & editing, L.W. and Z.L.; Project administration, T.C.; Funding acquisition, T.C. All authors have read and agreed to the published version of the manuscript.

Funding

This work was supported by the Major projects of the National Social Fund [No. 22&ZD122], the National Natural Science Foundation of China [No. 71871115], General Project of Social Science Foundation of Jiangsu Province [No. 22GLB032], Humanities and Social Science Planning Foundation of the Ministry of Education of China [No. 22YJC790128], Soft Science Research Program General Project of Jiangsu Province [No. BR2022057], the Key Supporting Project of Social Science Application Research Excellent Program of Jiangsu Province [No. 22SYA-010] and the General Project of Philosophy and Social Science Research in Colleges and Universities of Jiangsu Province [No. 2022SJYB0215], Postgraduate Research & Practice Innovation Program of Jiangsu Province [No. KYCX23_1521].

Data Availability Statement

The method in this article is computer mathematical simulation. Numerical simulation analysis is the most effective way to test real-time dynamic data without a large number of empirical validations. The authors simulate to analyzes the evolution characteristics of the formation and contagion effects of carbon quota counterparty risk by using Matlab2019a software. This paper does not have the data that can be obtained because they directly use the plot function of Matlab2019a software to make the images and tables.

Conflicts of Interest

The authors declare no conflict of interest.

References

  1. Wu, M.; Li, K.; Xiao, Y.; Yuen, K. Carbon Emission Trading Scheme in the shipping sector: Drivers, Challenges, and Impacts. Mar. Policy 2022, 138, 140989. [Google Scholar]
  2. Arora, N.; Gandhi, P.; Longstaff, F.A. Counterparty credit risk and the credit default swap market. J. Financ. Econ. 2012, 103, 280–293. [Google Scholar]
  3. Li, G.; Zhang, C. Counterparty credit risk and derivatives pricing. J. Financ. Econ. 2019, 134, 647–668. [Google Scholar]
  4. Wang, L.; Li, S.; Chen, T. Investor behavior, information disclosure strategy and counterparty credit risk contagion. Chaos Solitons Fractals 2019, 119, 37–49. [Google Scholar]
  5. Chen, T.; Yang, Q.; Wang, Y.; Wang, S. Double-layer network model of bank-enterprise counterparty credit risk contagion. Complexity 2020, 2020, 1–25. [Google Scholar]
  6. Liu, Y.; Cui, Y.; Yu, B. Threshold of Credit Risk Contagion within Firm Groups. J. Coast. Res. 2020, 104, 198–202. [Google Scholar]
  7. Cao, Y.; Wu, D.; Li, L. Debt risk analysis of non-financial corporates using two-tier networks. Ind. Manag. Data Syst. 2020, 120, 1287–1307. [Google Scholar]
  8. Sui, X.; Li, L.; Chen, X. Risk contagion caused by interactions between credit and guarantee networks. Phys. A Stat. Mech. Appl. 2020, 539, 122867. [Google Scholar]
  9. Chen, T.; Wang, S. Incomplete Information Model of Credit Default of Micro and Small Firms. Int. J. Financ. Econ. 2023, 28, 2956–2974. [Google Scholar] [CrossRef]
  10. Pan, H.; Hong, F. The Stability of Banking System with Shadow Banking on Different Interbank Network Structures. Discrete Dyn. Nat. Soc. 2021, 2021, 665037. [Google Scholar]
  11. Qian, Q.; Feng, H.; Gu, J. The influence of Risk Attitude on credit risk contagion-Perspective of Information Dissemination. Phys. A Stat. Mech. Appl. 2021, 582, 126226. [Google Scholar]
  12. Mu, P.; Chen, T.; Pan, K.; Liu, M. A Network Evolution Model of Credit Risk Contagion between Banks and Firms Based on Agent-Based Model. J. Math. 2021, 2021, 6593218. [Google Scholar]
  13. Zhang, Y. How Economic Performance of OECD economies influences through Green Finance and Renewable Energy Investment Resources? J. Resour. Policy 2022, 79, 102925. [Google Scholar]
  14. Ling, X.; Yan, L.; Dai, D. Green Credit Policy and Investment Decisions: Evidence from China. Sustainability 2022, 14, 7088. [Google Scholar]
  15. Zhou, X.; Caldecott, B.; Hoepner, A.; Wang, Y. Bank green lending and credit risk: An Empirical analysis of China’s Green Credit Policy. Bus. Strategy Environ. 2022, 31, 1623–1640. [Google Scholar]
  16. Song, M.; Zheng, H.; Shen, Z. Whether the carbon emissions trading system improves energy efficiency—Empirical testing based on China’s provincial panel data. Energy 2023, 275, 127456. [Google Scholar]
  17. Wang, Y.; Liu, J.; Zhao, Z.; Ren, J.; Chen, X. Research on carbon emission reduction effect of China’s regional digital trade under the “double carbon” target—Combination of the regulatory role of industrial agglomeration and carbon emissions trading mechanism. J. Clean. Prod. 2023, 405, 137049. [Google Scholar]
  18. Zhou, Y. Influencing Factors and Forecast of Carbon Emission Trading Price in Beijing. J. Glob. Econ. Bus. Financ. 2023, 5, 137668. [Google Scholar]
  19. Dong, Q.; Huo, D.; Wang, K. Risk measurement and application of the international carbon market in the era of global conflict: A data-driven study using FCM. J. Environ. Manag. 2023, 342, 118251. [Google Scholar]
  20. Nier, E.; Yang, J.; Yorulmazer, T. Network models and financial stability. J. Econ. Dyn. Control 2007, 31, 2033–2060. [Google Scholar]
  21. Ding, D.; Han, L.; Yin, L. Systemic risk and dynamics of contagion: A duplex inter-bank network. Quant. Financ. 2017, 17, 1435–1445. [Google Scholar]
  22. Chen, T.; He, J. A network model of credit risk contagion. Discret. Dyn. Nat. Soc. 2012, 2012, 327–337. [Google Scholar]
  23. Chen, T.; Wang, J.; Liu, H.; He, Y. Contagion model on counterparty credit risk in the CRT market by considering the heterogeneity of counterparties and preferential—Random mixing attachment. Phys. A Stat. Mech. Appl. 2019, 520, 458–480. [Google Scholar]
  24. Mizuno, T.; Ohnishi, T.; Watanabe, T. Structure of global buyer-supplier networks and its implications for conflict minerals regulations. EPJ Data Sci. 2016, 5, 1–15. [Google Scholar]
  25. Ohsung, K.; Sung, Y.; Hun, H.S.; Hon, C.Y.; Hee, L.D. Network Topology and Systemically Important Firms in the Interfirm Credit Network. Comput. Econ. 2018, 51, 847–864. [Google Scholar]
  26. Pi, X.; Tang, L.; Chen, X. A directed weighted scale-free network model with an adaptive evolution mechanism. Phys. A Stat. Mech. Appl. 2021, 572, 125897. [Google Scholar]
  27. Peng, D.; Peng, B.; Wang, T. Reconfiguring IVHF-TOPSIS decision making method with parameterized reference solutions and a novel distance for Corporate Carbon Performance Evaluation. J. Ambient Intell. Humaniz. Comput. 2020, 11, 3811–3832. [Google Scholar]
  28. Chen, T.; Wang, Y.; Zeng, Q.; Luo, J. Network model of credit risk contagion in the interbank market by considering bank runs and the fire sale of External assets. Phys. A Stat. Mech. Appl. 2020, 542, 123006. [Google Scholar]
  29. Yang, C.; Li, J. Investor sentiment, information and asset pricing model. Econ. Model. 2013, 35, 436–442. [Google Scholar]
  30. Su, C.; Cai, X.; Tao, R. Can Stock Investor Sentiment Be Contagious in China? J. Sustain. 2020, 12, 1571. [Google Scholar]
  31. Song, Z.; Yu, C. Investor sentiment indices based on k-step PLS algorithm: A Group of Powerful predictors of Stock Market Returns. Int. Rev. Financ. Anal. 2022, 83, 102321. [Google Scholar]
  32. Tang, H.; Liu, J.; Wu, J. The impact of command-and-control environmental regulation on firm total factor productivity: A quasi-natural experiment-based on China’s “the Two Control zones” policy. J. Clean. Prod. 2020, 254, 120011. [Google Scholar]
  33. Cai, W.; Ye, P. How does environmental regulation influence firms’ total factor productivity? A quasi-natural experiment based on China’s new environmental protection law. J. Clean. Prod. 2020, 276, 124105. [Google Scholar]
  34. Luo, W.; Guo, X.; Zhong, S.; Wang, J. Environmental information disclosure quality, media attention and debt financing costs: Evidence from Chinese heavy polluting listed companies. J. Clean. Prod. 2019, 231, 268–277. [Google Scholar]
  35. Siddique, M.; Akhtaruzzaman, M.; Afzalur, R.; Helmi, H. Carbon disclosure, carbon performance and financial performance. Int. Rev. Financ. Anal. 2021, 75, 101734. [Google Scholar]
  36. Jia, Z.; Lin, B. Rethinking the choice of carbon tax and carbon trading in China. Technol. Forecast. Soc. Chang. 2020, 159, 120187. [Google Scholar]
  37. Hu, X.; Yang, Z.; Sun, J.; Zhang, Y. Carbon tax or cap-and-trade: Which is more viable for Chinese remanufacturing industry? J. Clean. Prod. 2020, 243, 118606. [Google Scholar]
  38. Jung, J.; Herbohn, K.; Clarkson, P. Carbon Risk, Carbon Risk Awareness and the Cost of Debt Financing. J. Bus. Ethics 2018, 150, 1151–1171. [Google Scholar]
  39. Chen, Y.; Xu, Z.; Zhang, Z.; Ye, W.; Yang, Y.; Gong, Z. Does the carbon emission trading scheme boost corporate environmental and financial performance in China? J. Clean. Prod. 2022, 368, 133151. [Google Scholar]
  40. Liu, A.; Paddrik, M.; Steve, Y.; Zhang, X. Interbank contagion: An agent-based model approach to endogenously formed networks. J. Bank. Financ. 2020, 112, 105191. [Google Scholar]
  41. Danai, L.; Nopadon, K.; Karawan, W.; Chakrin, P. The Accuracy of Risk Measurement Models on Bitcoin Market during COVID-19 Pandemic. Risks 2021, 9, 222. [Google Scholar]
  42. Cifuentes, R.; Ferrucci, G.; Shin, H. Liquidity and Contagion. J. Eur. Econ. Assoc. 2005, 3, 556–566. [Google Scholar]
  43. He, J.; Sui, X.; Li, S. An endogenous model of the credit network. Phys. A Stat. Mech. Appl. 2016, 441, 1–14. [Google Scholar]
Figure 1. Flowchart of credit risk formation process among carbon quota counterparties.
Sustainability 15 11377 g001
Figure 2. Flowchart of credit risk contagion process among carbon quota counterparties.
Sustainability 15 11377 g002
Figure 3. Single effect of different influencing factors on carbon quota counterparty risk. (a) the effect of the proportion of rational investors on carbon quota counterparty risk; (b) the effect of the probability of credit risk contagion of the carbon quota among firms on carbon quota counterparty risk; (c) the effect of the corporate carbon performance on carbon quota counterparty risk; (d) the effect of the sensitivity of firms to the price of financial assets sold on carbon quota counterparty risk.
Sustainability 15 11377 g003
Figure 4. The interaction between different influencing factors and the price sensitivity to selling financial assets on carbon quota counterparty risk. (a) the interaction between the initial market price of the class h assets and the price sensitivity to selling financial assets on carbon quota counterparty risk; (b) the interaction between the cumulative proportion of class h assets sold and the price sensitivity to selling financial assets on carbon quota counterparty risk.
Sustainability 15 11377 g004
Figure 5. The interaction between different influencing factors and the probability of credit risk contagion of the carbon quota among firms on carbon quota counterparty risk. (a) the interaction between the proportion of rational investors and the probability of credit risk contagion of the carbon quota among firms on carbon quota counterparty risk. (b) the interaction between the cumulative proportion of class h assets sold and the probability of credit risk contagion of the carbon quota among firms on carbon quota counterparty risk; (c) the interaction between the corporate carbon performance and the probability of credit risk contagion of the carbon quota among firms on carbon quota counterparty risk.
Sustainability 15 11377 g005
Figure 6. The interaction between different influencing factors and corporate carbon performance on carbon quota counterparty risk. (a) the interaction between the proportion of rational investors and the corporate carbon performance on carbon quota counterparty risk. (b) the interaction between the cumulative proportion of class h assets sold and the corporate carbon performance on carbon quota counterparty risk; (c) the interaction between the probability of credit risk contagion of the carbon quota among firms and the corporate carbon performance on carbon quota counterparty risk.
Sustainability 15 11377 g006
Figure 7. The effects of interaction between different influencing factors and the proportion of rational investors on carbon quota counterparty risk. (a) the interaction between the corporate carbon performance and the proportion of rational investors on carbon quota counterparty risk. (b) the interaction between the cumulative proportion of class h assets sold and the proportion of rational investors on carbon quota counterparty risk; (c) the interaction between the probability of credit risk contagion of the carbon quota among firms and the proportion of rational investors on carbon quota counterparty risk.
Sustainability 15 11377 g007
Figure 8. Single effect of different influencing factors on the risk contagion effect of carbon quota counterparties. (a) the effect of the corporate carbon risk awareness on the risk contagion effect of carbon quota counterparties; (b) the effect of the carbon quota trading price on the risk contagion effect of carbon quota counterparties; (c) the effect of the corporate carbon performance on the risk contagion effect of carbon quota counterparties; (d) the effect of the total score of interfirm assessment on the risk contagion effect of carbon quota counterparties.
Sustainability 15 11377 g008
Figure 9. The interaction between different influencing factors and corporate carbon risk awareness on the risk contagion effect of carbon quota counterparties. (a) the interaction between the carbon quota trading price and the corporate carbon risk awareness on the risk contagion effect of carbon quota counterparties; (b) the interaction between the total score of the interfirm assessment and the corporate carbon risk awareness on the risk contagion effect of carbon quota counterparties; (c) the interaction between the corporate carbon performance and the corporate carbon risk awareness on the risk contagion effect of carbon quota counterparties.
Sustainability 15 11377 g009
Figure 10. The interaction between different influencing factors and corporate carbon performance on the risk contagion effect of carbon quota counterparties. (a) the interaction between the carbon quota trading price and the corporate carbon performance on the risk contagion effect of carbon quota counterparties; (b) the interaction between the total score of the interfirm assessment and the corporate carbon performance on the risk contagion effect of carbon quota counterparties; (c) the interaction between the corporate carbon risk awareness and the corporate carbon performance on the risk contagion effect of carbon quota counterparties.
Sustainability 15 11377 g010
Figure 11. The interaction between different influencing factors and the trading price of carbon quota on the risk contagion effect of carbon quota counterparties. (a) the interaction between the corporate carbon performance and the carbon quota trading price on the risk contagion effect of carbon quota counterparties; (b) the interaction between the total score of the interfirm assessment and the carbon quota trading price on the risk contagion effect of carbon quota counterparties; (c) the interaction between the corporate carbon risk awareness and the carbon quota trading price on the risk contagion effect of carbon quota counterparties.
Sustainability 15 11377 g011
Figure 12. The interaction between different influencing factors and the total score of interfirm assessment on the risk contagion effect of carbon quota counterparties. (a) the interaction between the corporate carbon performance and the total score of interfirm assessment on the risk contagion effect of carbon quota counterparties; (b) the interaction between the carbon quota trading price and the total score of interfirm assessment on the risk contagion effect of carbon quota counterparties; (c) the interaction between the corporate carbon risk awareness and the total score of interfirm assessment on the risk contagion effect of carbon quota counterparties.
Sustainability 15 11377 g012
Figure 13. The interaction between the corporate carbon performance and the price of carbon quota trading from 2018 to 2022 on the risk contagion effect of carbon quota counterparties. (a) the interaction between the corporate carbon performance in 2018 and the price of carbon quota trading from 2018 to 2022 on the risk contagion effect of carbon quota counterparties. (b) the interaction between the corporate carbon performance in 2019 and the price of carbon quota trading from 2018 to 2022 on the risk contagion effect of carbon quota counterparties.
Sustainability 15 11377 g013
Figure 14. The interaction between the price of carbon quota trading and the corporate carbon performance from 2018 to 2019 on the risk contagion effect of carbon quota counterparties. (a) the interaction between the price of carbon quota trading in 2022 and the corporate carbon performance from 2018 to 2019 on the risk contagion effect of carbon quota counterparties. (b) the interaction between the price of carbon quota trading in 2021 and the corporate carbon performance from 2018 to 2019 on the risk contagion effect of carbon quota counterparties. (c) the interaction between the price of carbon quota trading in 2020 and the corporate carbon performance from 2018 to 2019 on the risk contagion effect of carbon quota counterparties. (d) the interaction between the price of carbon quota trading in 2019 and the corporate carbon performance from 2018 to 2019 on the risk contagion effect of carbon quota counterparties.
Sustainability 15 11377 g014
Table 1. Corporate balance sheet.
Assets A i ( t ) Liabilities L i ( t )
Carbon quota accounts receivables A Y i ( t )
Trading financial assets A R i ( t )
Cash C i ( t )
Carbon quota accounts payables L Y i ( t )
Trading financial liabilities L R i ( t )
Owner’s equity E i ( t )
Table 2. Benchmark values of parameters.
ParameterDescriptionBenchmark ValueRange of Variation
N Total number of firms300Positive integer
k Business degree5 1 ,   10
Memory decay function0.1 0 ,   1
π Weight of the relationship scores in the overall rating system0.5 0 ,   1
ρ ( h , t ) Market prices of class h assets at moment t 50 0 ,   ρ ( h , 0 )
ρ ( h , 0 ) Initial market price the class h assets50 40 ,   100
τ Proportion of rational investors 0.5 0 ,   1
m Types of marketable financial asset 10Positive integer
ψ Probability of credit risk contagion of carbon quota among firms0.4 0 ,   1
γ Corporate carbon performance0.3 0 ,   1
η Price sensitivity of the firm to the sale of financial assets0.5 0 ,   1
q h Cumulative proportion of class h assets sold 0.01 0 ,   d h
d h Market to class h asset market capacity0.02 0 ,   1
P Trading price of carbon quota40 30 ,   60
α Corporate carbon risk awareness0.4 0 ,   1
F i j z Total score of interfirm assessment 5 10 ,   10
Table 3. Sensitivity analysis of the initial market price of class h asset, the price sensitivity of the firm to the sale of financial assets, and the cumulative proportion of class h assets sold on the evolution characteristics of firm carbon quota counterparties formation.
P ( h , 0 ) η ExpectationVariance
0.10.20.30.40.50.60.70.80.91.0
q h = 0.005
40.00.0980.0490.0330.0250.0200.0170.0140.0120.0110.0100.0290.001
43.00.1050.0530.0360.0270.0210.0180.0150.0130.0120.0110.0310.001
46.00.1120.0570.0380.0290.0230.0190.0160.0140.0130.0110.0330.001
49.00.1190.0600.0400.0300.0240.0200.0170.0150.0140.0120.0350.001
52.00.1270.0640.0430.0320.0260.0220.0190.0160.0140.0130.0380.001
55.00.1340.0680.0450.0340.0270.0230.0200.0170.0150.0140.0400.001
58.00.1410.0720.0480.0360.0290.0240.0210.0180.0160.0140.0420.002
61.00.1490.0750.0500.0380.0300.0250.0220.0190.0170.0150.0440.002
64.00.1560.0790.0530.0400.0320.0270.0230.0200.0180.0160.0460.002
67.00.1630.0830.0550.0420.0330.0280.0240.0210.0190.0170.0480.002
70.00.1710.0860.0580.0430.0350.0290.0250.0220.0190.0170.0510.002
73.00.1780.0900.0600.0450.0360.0300.0260.0230.0200.0180.0530.002
76.00.1850.0940.0630.0470.0380.0320.0270.0240.0210.0190.0550.003
79.00.1930.0980.0650.0490.0390.0330.0280.0250.0220.0200.0570.003
82.00.2000.1010.0680.0510.0410.0340.0290.0260.0230.0200.0590.003
85.00.2070.1050.0700.0530.0420.0350.0300.0260.0240.0210.0610.003
88.00.2150.1090.0730.0550.0440.0370.0310.0270.0240.0220.0640.004
91.00.2220.1120.0750.0570.0450.0380.0320.0280.0250.0230.0660.004
94.00.2290.1160.0780.0580.0470.0390.0330.0290.0260.0230.0680.004
97.00.2370.1200.0800.0600.0480.0400.0350.0300.0270.0240.0700.004
100.00.2440.1230.0830.0620.0500.0410.0360.0310.0280.0250.0720.005
Expectation0.1710.0860.0580.0430.0350.0290.0250.0220.0190.017
Variance0.0020.0010.0000.0000.0000.0000.0000.0000.0000.000
q h = 0.01
40.00.3810.1950.1310.0990.0790.0660.0570.0500.0440.0400.1140.011
43.00.4090.2100.1410.1060.0850.0710.0610.0530.0480.0430.1230.013
46.00.4380.2240.1510.1140.0910.0760.0650.0570.0510.0460.1310.015
49.00.4660.2390.1610.1210.0970.0810.0700.0610.0540.0490.1400.017
52.00.4950.2540.1700.1280.1030.0860.0740.0650.0570.0520.1480.019
55.00.5230.2680.1800.1360.1090.0910.0780.0680.0610.0550.1570.021
58.00.5520.2830.1900.1430.1150.0960.0820.0720.0640.0580.1650.023
61.00.5800.2980.2000.1510.1210.1010.0870.0760.0670.0610.1740.026
64.00.6090.3120.2100.1580.1270.1060.0910.0800.0710.0640.1830.028
67.00.6380.3270.2200.1650.1330.1110.0950.0830.0740.0670.1910.031
70.00.6660.3410.2290.1730.1390.1160.0990.0870.0770.0700.2000.034
73.00.6950.3560.2390.1800.1450.1210.1040.0910.0810.0730.2080.037
76.00.7230.3710.2490.1880.1500.1260.1080.0940.0840.0760.2170.040
79.00.7520.3850.2590.1950.1560.1310.1120.0980.0870.0790.2250.043
82.00.7800.4000.2690.2020.1620.1360.1160.1020.0910.0820.2340.046
85.00.8090.4150.2790.2100.1680.1400.1210.1060.0940.0850.2430.050
88.00.8370.4290.2880.2170.1740.1450.1250.1090.0970.0880.2510.054
91.00.8660.4440.2980.2250.1800.1500.1290.1130.1010.0910.2600.057
94.00.8950.4580.3080.2320.1860.1550.1330.1170.1040.0940.2680.061
97.00.9230.4730.3180.2390.1920.1600.1380.1200.1070.0970.2770.065
100.00.9520.4880.3280.2470.1980.1650.1420.1240.1100.1000.2850.069
Expectation0.6660.3410.2290.1730.1390.1160.0990.0870.0770.070
Variance0.0310.0080.0040.0020.0010.0010.0010.0010.0000.000
q h = 0.015
40.00.8360.4340.2930.2210.1770.1480.1270.1110.0990.0890.2540.053
43.00.8980.4660.3150.2370.1910.1590.1370.1200.1070.0960.2730.061
46.00.9610.4990.3370.2540.2040.1700.1460.1280.1140.1030.2920.070
49.01.0240.5310.3580.2710.2170.1810.1560.1370.1210.1090.3110.080
52.01.0860.5640.3800.2870.2310.1930.1650.1450.1290.1160.3300.090
55.01.1490.5960.4020.3040.2440.2040.1750.1530.1360.1230.3490.100
58.01.2120.6290.4240.3200.2570.2150.1840.1620.1440.1300.3680.112
61.01.2750.6610.4460.3370.2700.2260.1940.1700.1510.1360.3870.123
64.01.3370.6940.4680.3530.2840.2370.2040.1780.1590.1430.4060.136
67.01.4000.7260.4900.3700.2970.2480.2130.1870.1660.1500.4250.149
70.01.4630.7590.5120.3860.3100.2590.2230.1950.1740.1560.4440.163
73.01.5250.7910.5340.4030.3240.2700.2320.2030.1810.1630.4630.177
76.01.5880.8240.5560.4200.3370.2810.2420.2120.1880.1700.4820.192
79.01.6510.8560.5780.4360.3500.2930.2510.2200.1960.1760.5010.207
82.01.7130.8890.6000.4530.3640.3040.2610.2280.2030.1830.5200.223
85.01.7760.9210.6220.4690.3770.3150.2700.2370.2110.1900.5390.240
88.01.8390.9540.6440.4860.3900.3260.2800.2450.2180.1970.5580.257
91.01.9010.9860.6660.5020.4030.3370.2890.2540.2260.2030.5770.275
94.01.9641.0190.6880.5190.4170.3480.2990.2620.2330.2100.5960.293
97.02.0271.0510.7100.5360.4300.3590.3080.2700.2400.2170.6150.312
100.02.0891.0840.7320.5520.4430.3700.3180.2790.2480.2230.6340.332
Expectation1.4630.7590.5120.3860.3100.2590.2230.1950.1740.156
Variance0.1510.0410.0190.0110.0070.0050.0040.0030.0020.002
Table 4. Sensitivity analysis of the carbon performance, the proportion of rational investors in the market, and the cumulative proportion of class h assets sold on the evolution characteristics of firm carbon quota counterparties formation.
γ τ ExpectationVariance
0.10.20.30.40.50.60.70.80.91.0
qh = 0.005 ψ = 0.4
0.10.0530.0320.0270.0250.0240.0230.0220.0220.0220.0210.0270.000
0.20.1400.0530.0380.0320.0290.0270.0260.0250.0240.0240.0420.001
0.30.3630.0860.0530.0410.0350.0320.0300.0280.0270.0260.0720.011
0.40.8680.140W0.0530.0430.0380.0340.0320.0300.0290.1340.068
0.51.7160.2270.1010.0670.0530.0450.0400.0360.0340.0320.2350.274
0.62.3930.3630.1400.0860.0640.0530.0460.0410.0380.0350.3260.537
0.72.5000.5700.1940.1100.0780.0620.0530.0460.0420.0390.3690.586
0.82.5000.8680.2660.1400.0950.0730.0610.0530.0470.0430.4150.600
0.92.5001.2630.3630.1790.1150.0860.0700.0590.0530.0480.4730.644
1.02.5001.7160.4920.2270.1400.1010.0800.0670.0590.0530.5430.731
Expectation1.5530.5320.1750.0960.0680.0540.0460.0410.0380.035
Variance1.1610.3340.0240.0050.0020.0010.0000.0000.0000.000
qh = 0.01 ψ = 0.4
0.10.2080.1270.1080.0990.0950.0910.0890.0880.0870.0860.1080.001
0.20.5450.2080.1500.1270.1150.1080.1030.0990.0970.0950.1650.019
0.31.3470.3380.2080.1630.1400.1270.1180.1120.1080.1040.2770.146
0.42.8700.5450.2880.2080.1710.1500.1360.1270.1200.1150.4730.726
0.54.5080.8670.3970.2650.2080.1770.1570.1440.1340.1270.6981.842
0.64.9911.3470.5450.3380.2530.2080.1810.1630.1500.1400.8322.270
0.75.0002.0200.7440.4300.3070.2450.2080.1840.1670.1550.9462.350
0.85.0002.8701.0070.5450.3720.2880.2390.2080.1860.1711.0892.564
0.95.0003.7751.3470.6890.4510.3380.2750.2350.2080.1891.2512.936
1.05.0004.5081.7730.8670.5450.3970.3160.2650.2320.2081.4113.337
Expectation3.4471.6600.6570.3730.2660.2130.1820.1630.1490.139
Variance4.0902.4840.3140.0660.0230.0110.0060.0040.0020.002
qh = 0.015 ψ = 0.4
0.10.4630.2840.2410.2220.2120.2050.2000.1970.1940.1920.2410.007
0.21.1930.4630.3350.2840.2580.2410.2300.2220.2160.2120.3650.090
0.32.8160.7480.4630.3630.3140.2840.2650.2510.2410.2340.5980.632
0.45.4141.1930.6380.4630.3810.3350.3050.2840.2690.2580.9542.536
0.57.2691.8630.8750.5890.4630.3940.3510.3210.3000.2841.2714.670
0.67.4992.8161.1930.7480.5610.4630.4030.3630.3350.3141.4695.066
0.77.5004.0491.6100.9460.6800.5440.4630.4100.3730.3461.6925.433
0.87.5005.4142.1471.1930.8220.6380.5310.4630.4160.3811.9516.161
0.97.5006.5912.8161.4950.9910.7480.6100.5220.4630.4202.2167.038
1.07.5007.2693.6121.8631.1930.8750.6990.5890.5150.4632.4587.633
Expectation5.4653.0691.3930.8170.5870.4730.4060.3620.3320.310
Variance8.2506.8301.3060.3040.1090.0510.0280.0170.0120.008
Table 5. Sensitivity analysis of the corporate carbon performance, the proportion of rational investors in the market, and the probability of credit risk contagion of carbon quota among firms on the evolution characteristics of corporate carbon quota counterparties risk formation.
γ τ ExpectationVariance
0.10.20.30.40.50.60.70.80.91.0
qh = 0.01 ψ = 0.2
0.10.3640.2240.1900.1750.1670.1610.1580.1550.1530.1510.1900.004
0.20.9280.3640.2630.2240.2030.1900.1810.1750.1700.1670.2870.054
0.32.1380.5850.3640.2860.2470.2240.2090.1980.1900.1840.4620.361
0.43.9030.9280.5000.3640.3000.2630.2400.2240.2120.2030.7141.304
0.54.9191.4350.6840.4620.3640.3100.2760.2530.2360.2240.9162.113
0.65.0002.1380.9280.5850.4410.3640.3170.2860.2630.2471.0572.249
0.75.0003.0071.2450.7390.5330.4270.3640.3220.2930.2721.2202.457
0.85.0003.9031.6480.9280.6430.5000.4170.3640.3270.3001.4032.810
0.95.0004.5902.1381.1580.7730.5850.4780.4100.3640.3301.5833.168
1.05.0004.9192.7051.4350.9280.6840.5470.4620.4050.3641.7453.363
Expectation3.7252.2091.0660.6360.4600.3710.3190.2850.2610.244
Variance3.4703.1940.7330.1800.0650.0310.0170.0110.0070.005
qh = 0.01 ψ = 0.4
0.10.2080.1270.1080.0990.0950.0910.0890.0880.0870.0860.1080.001
0.20.5450.2080.1500.1270.1150.1080.1030.0990.0970.0950.1650.019
0.31.3470.3380.2080.1630.1400.1270.1180.1120.1080.1040.2770.146
0.42.8700.5450.2880.2080.1710.1500.1360.1270.1200.1150.4730.726
0.54.5080.8670.3970.2650.2080.1770.1570.1440.1340.1270.6981.842
0.64.9911.3470.5450.3380.2530.2080.1810.1630.1500.1400.8322.270
0.75.0002.0200.7440.4300.3070.2450.2080.1840.1670.1550.9462.350
0.85.0002.8701.0070.5450.3720.2880.2390.2080.1860.1711.0892.564
0.95.0003.7751.3470.6890.4510.3380.2750.2350.2080.1891.2512.936
1.05.0004.5081.7730.8670.5450.3970.3160.2650.2320.2081.4113.337
Expectation3.4471.6600.6570.3730.2660.2130.1820.1630.1490.139
Variance4.0902.4840.3140.0660.0230.0110.0060.0040.0020.002
qh = 0.01 ψ = 0.6
0.10.1590.0970.0820.0760.0720.0700.0680.0670.0660.0650.0820.001
0.20.4210.1590.1150.0970.0880.0820.0790.0760.0740.0720.1260.011
0.31.0630.2600.1590.1240.1070.0970.0910.0860.0820.0800.2150.092
0.42.3900.4210.2210.1590.1310.1150.1040.0970.0920.0880.3820.508
0.54.1460.6750.3050.2040.1590.1350.1200.1100.1030.0970.6051.578
0.64.9591.0630.4210.2600.1940.1590.1380.1240.1150.1070.7542.267
0.75.0001.6290.5780.3310.2360.1880.1590.1410.1280.1180.8512.336
0.85.0002.3900.7870.4210.2860.2210.1830.1590.1430.1310.9722.476
0.95.0003.2881.0630.5340.3470.2600.2110.1800.1590.1441.1192.780
1.05.0004.1461.4190.6750.4210.3050.2420.2040.1780.1591.2753.203
Expectation3.3141.4130.5150.2880.2040.1630.1400.1240.1140.106
Variance4.3342.0300.2010.0400.0140.0060.0030.0020.0010.001
Table 6. Sensitivity analysis of the corporate carbon performance, corporate carbon risk awareness, and carbon quota trading price in the carbon trading market on the evolution characteristics of the risk contagion of corporate carbon quota counterparties.
γ α ExpectationVariance
0.10.20.30.40.50.60.70.80.91.0
P = 40   F i j z = 5
0.10.9200.8510.7920.7410.6960.6560.6210.5890.5600.5340.6960.017
0.20.9290.8680.8140.7660.7240.6860.6520.6210.5930.5670.7220.015
0.30.9380.8820.8330.7900.7500.7150.6820.6520.6250.6000.7470.013
0.40.9450.8960.8510.8110.7750.7410.7110.6830.6560.6320.7700.011
0.50.9520.9080.8680.8310.7980.7660.7380.7110.6860.6630.7920.009
0.60.9580.9190.8830.8490.8190.7900.7630.7380.7150.6930.8130.008
0.70.9630.9280.8960.8660.8380.8110.7870.7630.7420.7210.8310.007
0.80.9670.9370.9080.8810.8550.8310.8090.7870.7670.7470.8490.005
0.90.9710.9440.9190.8940.8710.8500.8290.8090.7900.7720.8650.004
1.00.9750.9510.9280.9070.8860.8660.8470.8290.8120.7950.8800.004
Expectation0.9520.9080.8690.8340.8010.7710.7440.7180.6950.673
Variance0.0000.0010.0020.0030.0040.0050.0060.0070.0070.008
P = 50   F i j z = 5
0.10.9190.8500.7910.7400.6940.6540.6190.5870.5580.5320.6940.017
0.20.9280.8660.8110.7630.7210.6830.6480.6170.5890.5640.7190.015
0.30.9360.8800.8300.7860.7460.7100.6770.6470.6200.5950.7430.013
0.40.9430.8930.8480.8070.7690.7350.7040.6760.6490.6250.7650.011
0.50.9500.9050.8630.8260.7910.7590.7300.7030.6780.6550.7860.010
0.60.9560.9150.8780.8430.8120.7820.7550.7290.7050.6830.8060.008
0.70.9610.9240.8910.8590.8300.8030.7780.7540.7310.7100.8240.007
0.80.9650.9330.9030.8740.8480.8220.7990.7770.7550.7350.8410.006
0.90.9690.9400.9130.8880.8630.8400.8190.7980.7780.7600.8570.005
1.00.9730.9470.9230.9000.8780.8570.8370.8180.8000.7820.8710.004
Expectation0.9500.9050.8650.8290.7950.7650.7370.7110.6860.664
Variance0.0000.0010.0020.0030.0040.0050.0050.0060.0070.007
P = 60   F i j z = 5
0.10.9190.8500.7900.7390.6930.6530.6170.5850.5570.5300.6930.017
0.20.9270.8650.8100.7610.7190.6800.6460.6150.5870.5610.7170.015
0.30.9350.8780.8280.7830.7430.7060.6730.6430.6160.5910.7400.013
0.40.9420.8910.8450.8030.7650.7310.7000.6710.6440.6200.7610.012
0.50.9480.9020.8600.8220.7860.7540.7250.6970.6720.6480.7810.010
0.60.9540.9120.8740.8390.8060.7760.7480.7220.6980.6750.8010.009
0.70.9590.9220.8870.8550.8250.7970.7710.7460.7230.7020.8180.007
0.80.9640.9300.8990.8690.8420.8160.7910.7690.7470.7270.8350.006
0.90.9680.9380.9090.8820.8570.8330.8110.7900.7690.7500.8510.005
1.00.9710.9440.9190.8940.8720.8500.8290.8090.7900.7720.8650.004
Expectation0.9490.9030.8620.8250.7910.7600.7310.7050.6800.658
Variance0.0000.0010.0020.0030.0040.0040.0050.0060.0060.007
Table 7. Sensitivity analysis of corporate carbon performance, corporate carbon risk awareness, and total score of interfirm assessment on the evolution characteristics of the risk contagion of corporate carbon quota counterparties.
γ α ExpectationVariance
0.10.20.30.40.50.60.70.80.91.0
P = 40   F i j z = 8
0.10.8900.8010.7290.6680.6170.5730.5350.5020.4720.4460.6230.020
0.20.8660.7640.6840.6180.5640.5190.4810.4480.4190.3930.5760.022
0.30.8390.7230.6350.5660.5110.4650.4270.3950.3670.3430.5270.024
0.40.8080.6770.5830.5120.4570.4120.3750.3440.3180.2960.4780.025
0.50.7720.6280.5300.4580.4030.3600.3260.2970.2730.2530.4300.026
0.60.7310.5760.4760.4050.3530.3120.2800.2540.2320.2140.3830.025
0.70.6870.5230.4220.3540.3050.2680.2380.2150.1960.1800.3390.024
0.80.6380.4690.3700.3060.2610.2270.2010.1810.1640.1500.2970.022
0.90.5870.4150.3210.2620.2210.1910.1690.1510.1360.1240.2580.019
1.00.5330.3640.2760.2220.1860.1600.1400.1250.1130.1030.2220.017
Expectation0.7350.5940.5030.4370.3880.3490.3170.2910.2690.250
Variance0.0150.0230.0240.0230.0220.0200.0180.0170.0150.014
P = 40   F i j z = 5
0.10.8970.8140.7440.6860.6360.5930.5930.5220.4920.4660.6440.018
0.20.8840.7920.7180.6560.6040.5600.5600.4880.4590.4330.6150.020
0.30.8690.7690.6890.6250.5710.5260.5260.4540.4250.4000.5860.021
0.40.8530.7440.6600.5920.5380.4920.4920.4210.3930.3680.5550.022
0.50.8350.7170.6290.5590.5040.4580.4580.3880.3610.3370.5250.024
0.60.8160.6890.5960.5260.4700.4250.4250.3570.3300.3070.4940.024
0.70.7950.6590.5630.4920.4360.3920.3920.3260.3010.2790.4640.025
0.80.7720.6280.5300.4580.4030.3600.3600.2970.2730.2530.4340.025
0.90.7470.5960.4960.4250.3710.3300.3300.2700.2470.2280.4040.025
1.00.7210.5630.4620.3920.3400.3010.3010.2440.2230.2050.3750.024
Expectation0.8190.6970.6090.5410.4870.4440.4440.3770.3500.327
Variance0.0040.0070.0090.0100.0100.0100.0100.0090.0080.008
P = 40   F i j z = 5
0.10.9200.8510.7920.7410.6960.6560.6210.5890.5600.5340.6960.015
0.20.9290.8680.8140.7660.7240.6860.6520.6210.5930.5670.7220.013
0.30.9380.8820.8330.7900.7500.7150.6820.6520.6250.6000.7470.011
0.40.9450.8960.8510.8110.7750.7410.7110.6830.6560.6320.7700.010
0.50.9520.9080.8680.8310.7980.7660.7380.7110.6860.6630.7920.008
0.60.9580.9190.8830.8490.8190.7900.7630.7380.7150.6930.8130.007
0.70.9630.9280.8960.8660.8380.8110.7870.7630.7420.7210.8310.006
0.80.9670.9370.9080.8810.8550.8310.8090.7870.7670.7470.8490.005
0.90.9710.9440.9190.8940.8710.8500.8290.8090.7900.7720.8650.004
1.00.9750.9510.9280.9070.8860.8660.8470.8290.8120.7950.8800.003
Expectation0.9520.9080.8690.8340.8010.7710.7440.7180.6950.673
Variance0.0000.0010.0020.0030.0040.0050.0060.0070.0070.008
P = 40   F i j z = 8
0.10.9250.8610.8050.7560.7130.6740.6400.6080.5800.5540.7120.014
0.20.9390.8850.8370.7940.7550.7200.6880.6590.6320.6070.7520.011
0.30.9500.9060.8650.8270.7930.7620.7320.7060.6800.6570.7880.009
0.40.9600.9230.8880.8560.8260.7990.7730.7480.7260.7040.8200.007
0.50.9670.9370.9080.8810.8550.8310.8090.7870.7670.7470.8490.005
0.60.9740.9480.9250.9020.8800.8600.8400.8210.8030.7860.8740.004
0.70.9790.9580.9380.9190.9010.8840.8670.8510.8350.8200.8950.003
0.80.9830.9660.9500.9340.9190.9040.8900.8760.8630.8500.9140.002
0.90.9860.9720.9590.9460.9340.9210.9100.8980.8870.8760.9290.001
1.00.9890.9780.9670.9560.9460.9360.9260.9160.9070.8970.9420.001
Expectation0.9650.9330.9040.8770.8520.8290.8070.7870.7680.750
Variance0.0000.0020.0030.0050.0060.0080.0090.0110.0120.014
Disclaimer/Publisher’s Note: The statements, opinions and data contained in all publications are solely those of the individual author(s) and contributor(s) and not of MDPI and/or the editor(s). MDPI and/or the editor(s) disclaim responsibility for any injury to people or property resulting from any ideas, methods, instructions or products referred to in the content.

