Article

Effects of Soybean–Corn Rotation on Crop Yield, Economic Benefits, and Water Productivity in the Corn Belt of Northeast China

Institute of Environment and Sustainable Development in Agricultural, Chinese Academy of Agricultural Sciences (CAAS), Beijing 100081, China
Sustainability 2023, 15(14), 11362; https://doi.org/10.3390/su151411362
Submission received: 8 June 2023 / Revised: 9 July 2023 / Accepted: 19 July 2023 / Published: 21 July 2023
(This article belongs to the Special Issue Agricultural Product Quality Safety and Sustainable Development)

Abstract

:
The Corn Belt of Northeast China (CBNC) is the most important commercial grain base in China. However, long-term intensive cultivation has caused the productivity of black soil to decline. The sustainable development of corn and soybean is seriously threatened. Field experiments of a corn–soybean rotation were conducted to evaluate the crop yields, economic returns, and water productivity in the CBNC from 2017 to 2020. The field treatments included continuous soybean (CS), continuous corn (CC), soybean–corn (SC), and soybean–corn–corn (SCC). The total yield for 2017–2020 is compared using the equivalent yield of corn, indicating that the crop yield of the CC treatment was the highest and that of the CS treatment was the lowest. The crop yield of the CS treatment was 0.58-fold lower than that of the CC treatment. The 4-year total income of the treatments showed that the total and net revenue of the CC treatment was the highest. The 4-year total net income of the CS treatment was 0.66- and 0.72-fold lower compared with those of the SC and SCC treatments, respectively. There was no significant difference between the treatments of rotation. The crop water productivity (WPC) and biomass water productivity (WPB) of the CS treatment were the lowest, at 0.30- and 0.54-fold lower than those of the CC treatment in 2017–2020, respectively. The WPC and WPB of the CC treatment were the largest. If soybean–corn rotation was implemented in the CBNC, the SC treatment would be a better choice than the SCC treatment for the CBNC, and farmers would need to be subsidized at least USD 1047.5 ha−1 to equal the income from growing corn. In considering production, financial gains, and water productivity, the CC treatment was, as a result, still the best planting pattern for the CBNC under the test site’s conditions.

1. Introduction

The corn (Zea mays L.) belt of northeast China (CBNC) includes Heilongjiang, Jilin, and Liaoning Provinces [1]. The CBNC is known as China’s most important production area of corn and soybean (Glycine max L.) [2], accounting for 45% of the total soybeans and 32% of the total corn produced in China in 2020 [3]. Soil erosion and long-term high-intensity use have restricted the development of sustainable agriculture in this region [4,5,6], which results in thinner topsoil, a reduction in organic matter, soil acidification, structural deterioration, and the degradation of function [7,8]. The CBNC is home to a lot of black soil, one of the most fertile soil types. A corn–soybean rotation is the most commonly used rotation in the CBNC.
Soybean is a significant grain crop worldwide due to its ability to provide large amounts of protein for food and feed [9,10]. In 2018, 125 M t of soybeans were produced in just the United States [11]. More than 7.3 M t of soybeans were reportedly produced in Canada in 2018, with central Canada accounting for the majority of that production [12]. In 2015, there were 15.1 M t of soybeans produced in China, and that increased to 22.9 M t in 2020 [3]. Soybeans played an important role in the agricultural development of China. However, more than 80% of the soybean supply in China currently depends on imports, which has seriously threatened the security of the national supply of edible oil. The planting area of corn in China has been increasing and reached more than 41 M ha. The planting area of soybean in 2015 and 2020 was 65% and 90% of the maximum planting area in 2005 (1995–2020), respectively, although that increased from 2015 to 2020 [3]. The United States produces about 30% of the world’s soybeans, with Iowa leading the pack with an estimated 14 million tons of soybeans produced annually in 2014 [11]. In Iowa, soybean is typically planted in rotation with corn in either C–S or C–C–S rotations [13]. Farmers are curious about the effects of various crop rotation and tillage strategies on soybean yields [13].
Researchers showed that a rotation of corn–soybean could significantly increase the yield of soybeans compared with soybean continuous cropping. A rotation includes two or more crops, which frequently have different needs for soil moisture. The crops could complement each other in a rotation system [14,15]. Soybean not only affects the soil environment but also affects the yield of the next crop of corn [16,17]. Zhang et al. (2010) showed that under the same fertilization conditions, the water use efficiency (WUE) of rotation was higher than that of continuous cropping [18]. WUE is the expression of the authors. WUE will be redefined as crop water productivity (WPC) as described by Fernández et al. (2020) [19]. The rotation experiments on corn and soybean conducted by Pikul et al. (2012) showed that the crop WUE under a corn–soybean rotation was significantly higher than that under corn continuous cropping in a no-till rotation [20]. There have been different comprehensive studies on corn–soybean crop rotations on the yields, economic benefits, and WUE in the CBNC [6,8,21,22]. Two of the most important elements to consider when choosing a cropping system are crop production and economic profitability, which is heavily reliant on local crop management, soil qualities, and weather patterns [15]. The increased risk of soil erosion, nitrate loss owing to leaching, and loss of organic matter due to bare soil over the winter in temperate regions are the main reasons why the corn–soybean rotation has a detrimental impact on the health of the soil [23,24]. Therefore, it was necessary to research the effects of the corn–soybean rotation for sustainable agricultural development in the black soil area.
The decision of local farmers to plant soybean or corn in the CNBC depends on the crop’s economic benefit, which is based on market demand, prices, and governmental policies. The prices of corn and soybean vary each year, which affects the choice of crops planted by farmers. Further study is required to determine whether this strategy will be effective in the region, considering that the government is encouraging farmers to produce more soybeans. By comparing crop yields, production costs, net revenues, and water productivity across various crop rotation systems, we sought to identify cropping systems that were both economically and environmentally sustainable. These aims can confirm whether or not the measures of “corn to soybean” are suited to the CNBC and whether or not the crops are consistent with the local resource allocation law and economic benefit.

2. Materials and Methods

2.1. Site Description

Field experiments were carried out in Lishu County, Jilin Province, China (43.29° N, 124.44° E, and altitude 184 m) from 2017 to 2020. The study area has a semi-humid continental monsoon climate. Based on meteorological data obtained from the Lishu Country Meteorological Service that covered a 40-year period (1981–2020), the mean annual temperature (°C) was 5.9 °C, cumulative temperature (≥10 °C) was 2136 °C, frost-free duration was 142 d, precipitation was 573 mm, and evaporation was 808 mm, respectively. The climatic characteristics are summarized in Table 1. Early May to the end of September had the most precipitation, which was the crop growing season, with amounts of 478, 465, 533, and 558 mm in 2017, 2018, 2019, and 2020, respectively. The mean amount of precipitation for the growing season from 1980 to 2020 was 479.3 mm (Figure 1). According to the precipitation anomaly percentage (PAP) ([actual precipitation-average precipitation]/average precipitation × 100%), the precipitation years were characterized as dry (PAP < −15%), normal (−15% ≤ PAP ≤ 15%), and wet (PAP > 15%) precipitation years (Standardization Administration of the People’s Republic of China, 2008). The total precipitation during the 2017, 2018, 2019, and 2020 growing seasons was 478 mm (PAP = −0.2%, normal year), 465 mm (PAP = −3%, normal year), 533 mm (PAP = 11%, normal year), and 558 mm (PAP = 16%, wet year), respectively, from early May to the end of September (Figure 1). In 2017, July and September were wet months, while June was a dry month. In 2018, August was a wet month, while May, June, and September were the dry months. In order to maintain crop growth, manual irrigation was performed at the time of sowing in May. Each treatment was irrigated at a depth of 20 mm. In 2019, May and August were wet months, while June and September were the dry months. In 2020, August and September were wet months, while June and July were the dry months.
The soil was a coarse–silty, mixed, superactive, and mesic Haplocryoll soil that contained 16% sand, 76% silt, and 8% clay, which was formed from alluvial deposits and defined as silt loam soil [25]. Furthermore, it had 1.45 g cm−3 bulk density, 0.32 cm3 cm−3 field capacity, 6.5 pH, 22.75 g kg−1 organic matter content, 1.54 g kg−1 total nitrogen, 30.06 mg kg−1 available phosphorus, and 110.88 mg kg−1 available potassium in the 0–38 cm soil layer. Table 1 summarizes the soil characteristics.

2.2. Experimental Design and Field Management

The study consisted of four experimental treatments of farming systems comprising continuous corn (CC), continuous soybean (CS), soybean–corn rotation (SC), and soybean–corn–corn rotation (SCC). Both treatments had a row spacing of 60 cm with three replications. Each plot was 10 m wide and 6 m long. All the plots were rotary plowed to a depth of 15 cm before planting in the spring of 2017. The experimental plots were arranged in a random block design with three replications.
Corn cultivar ‘Liangyu 99’ was used in this study and was provided by the Dandong Liangyu Seed Industry Co., Ltd. (Dandong, China). On 8 May 2017, 8 May 2018, 8 May 2019, and 10 May 2020, the seeds were manually planted 5 cm deep with a hole driller, with a row spacing of 60 cm, plant spacing of 28 cm, and a planting density of approximately 60,000 plants ha−1. A controlled-release fertilizer that contained 260 kg N ha−1, 44 kg P ha−1, and 100 kg K ha−1 was applied in 10 cm deep furrows located 10 cm from the corn rows before the corn was planted. The controlled-release fertilizer was named Tianyixing and was provided by Lishu-xian Zhongying Agricultural Production Materials Co., Ltd. (Lishu, China). The soybean cultivar ‘Jiyu 47’ was used and was produced by Jiyu Seed Industry Co., Ltd. (Changchun, China). On 9 May 2017, 14 May 2018, 16 May 2019, and 15 May 2020, the seeds were manually planted 5 cm deep with a hole driller, with a row spacing of 60 cm, plant spacing of 8.5 cm, and a planting density of approximately 200,000 plants ha−1. A controlled-release fertilizer that contained 48 kg N ha−1, 32 kg P ha−1, and 50 kg K ha−1 was applied in 10 cm deep furrows located 10 cm from the soybean rows before the soybean was planted. The controlled-release fertilizer was named Libaijia and produced by Heilongjiang Beifeng Agricultural Production Group (Haerbin, China).

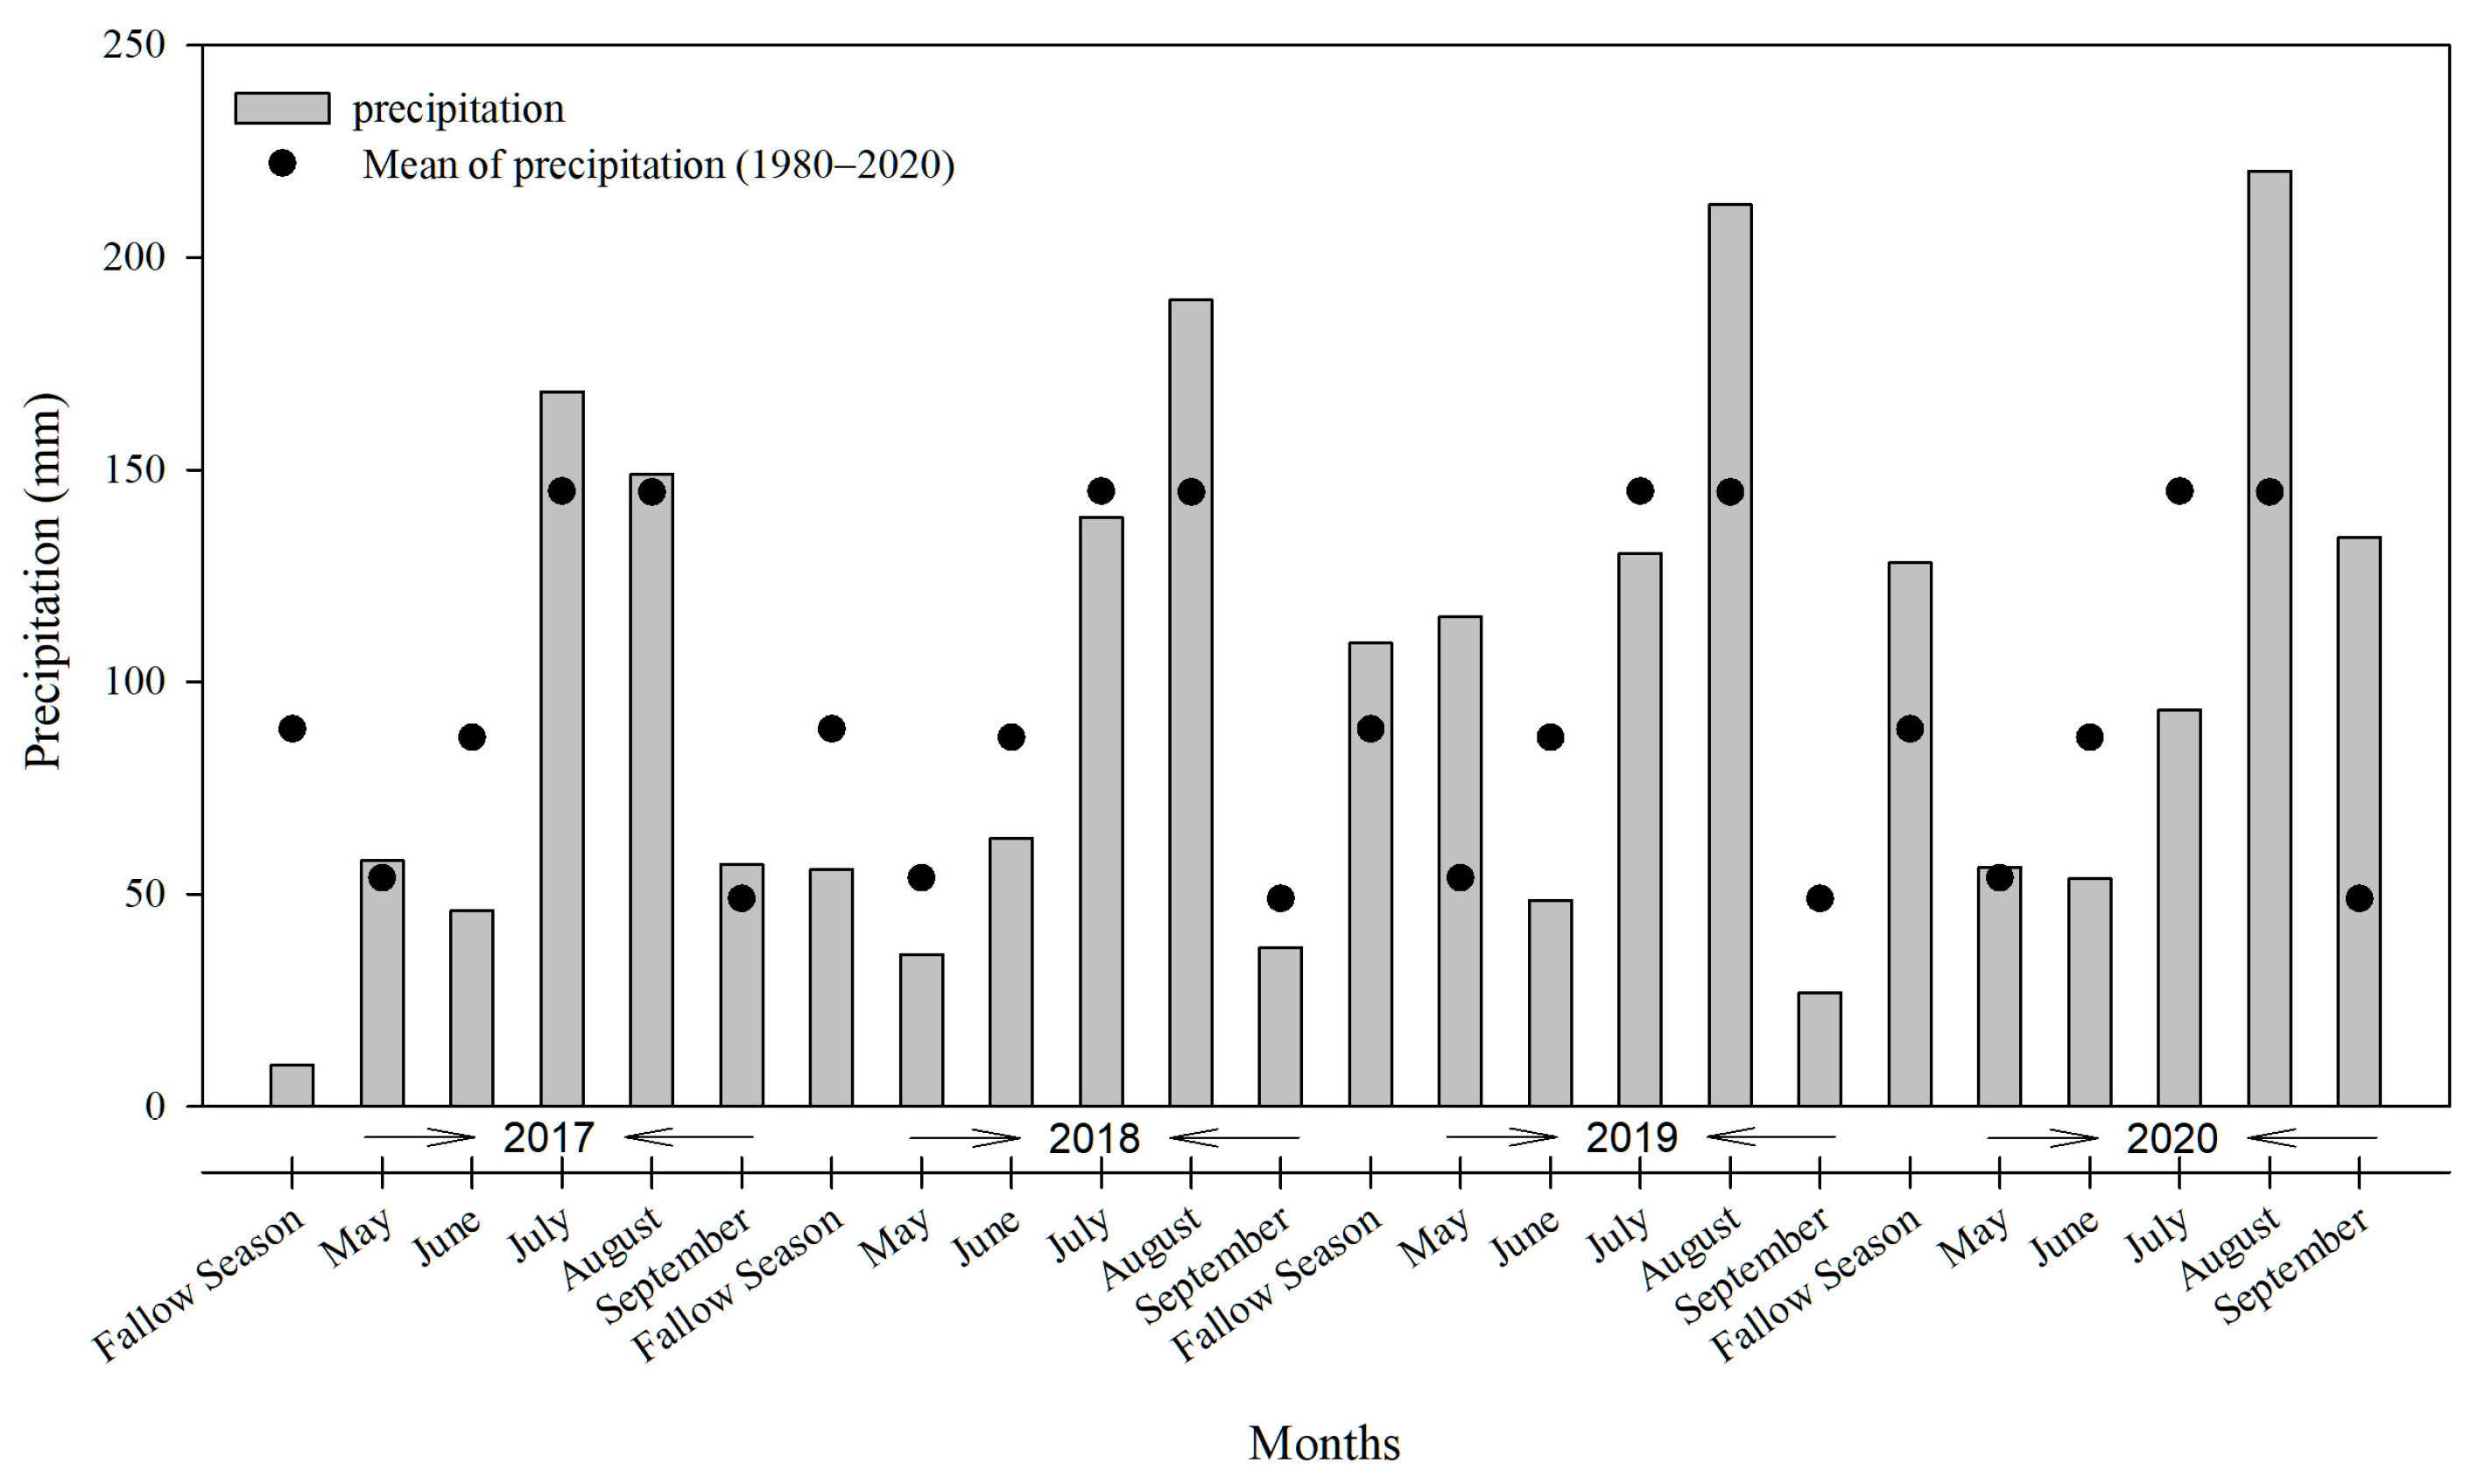
2.3. Measurements and Calculations

During the crop growth period, daily precipitation and radiation were obtained from the automatic weather station of experimental station and Lishu County Meteorological Bureau. The rainfall data were measured by a self-recording rain gauge placed in the field experiments.
At intra-row and inter-row positions of the corn or soybean in each plot, the soil volumetric water content was collected by a time-domain reflectometer (TRIME-PICO IPH, IMKO Micromodultechnik GmbH, Ettlingen, Germany) with probes that were 20 cm long and PVC tubes that were 2 m long (with a 44 mm outer diameter, 42 mm inner diameter, and steel cutting shoe). Each plot had two tubes, with one in the intra-row and one in the inter-row. Thus, the soil water content in seven 20 cm strata of the 0–140 cm soil profile was assessed. Every seven to ten days, as well as before and after periods of rainfall, the water was measured. The average of the soil water contents at the row and interrow positions in each plot served as the soil water content for each soil layer.
The following equations were used to compute the relative soil water content (RSWC) and soil water storage (SW, mm) of the crop root zone:
S W = i = 1 n θ v × Z i
RSWC = SW/SWFC
where Zi is the depth of the i-th soil layer (cm), and θv is soil volumetric water content of the ith layer. In Equation (2), SWFC is field capacity (mm). During the growing phase, the crop’s root zone was at different depths of 20, 40, and 60 cm, respectively [26,27,28]. The RSWC calculated three different water stress levels: a light stress level of 0.6, a medium stress level of 0.5, and a severe stress level of 0.4 [29].
By using reference evapotranspiration, crop coefficients, and soil water status, evapotranspiration can be indirectly estimated [30]. Based on our experimental results, evapotranspiration (ETc act) was calculated directly using the soil–water balance equation from References [31,32], as follows:
ETc act-d = ΔSW + P + IDR + CR
where ΔSW is the two-point average of the data on the volumetric water content of the soil and represents the difference in water storage in the 0–140 cm soil profile between sowing and harvest (mm). P stands for precipitation amount (mm), I for irrigation amount (mm), R for surface runoff (mm), and CR for capillary rise (mm). The soil surface was even, the groundwater table was 10 m below it, and the CR and R values were negligible. As stated earlier, the only irrigation utilized was 20 mm on 15 May 2018, which was applied to all the plots. D represents the drainage below the 140 cm soil layer. It was calculated that the extra water percolated into the deeper zones, when the sum of the soil water storage (SW) in the 0–140 cm deep soil profile plus the precipitation exceeded the field capacity (FC), according to the following equation:
D = 0 ,     S W + P F C 0 S W + P F C ,     S W + P F C > 0
WPC was calculated using the following equations [19]:
W P C = Y E T a   a c t v
W P B = Y B E T
E T c   a c t v = E T c   a c t d / 1000 × 10000  
where WPC is the crop water productivity (kg m−3); Y represents the yield of commercial grain of corn or soybean (kg ha−1); WPC is the biomass water productivity (kg m−3); YB represents the final corn or soybean biomass (kg ha−1); and ETc act-v is the actual evapotranspiration representing the water volume per hectare (m3 ha−1) during the entire growing season.
Plant samples were collected to determine the aboveground biomass, and enzyme activity was eliminated through drying the samples at 105 °C over 30 min. The samples were then dried to a constant weight at 80 °C and weighed. The samples were then converted to weight per hectare. The final yields of corn and soybean grain were determined by harvesting all the plants in the 12 m2 sampling area, which was composed of 4 rows 5 m long. The yields of commercial grain included 14% water content.
The soybean yield was also converted to the corn equivalent yield (YE) using Equation (8) [33,34]. Both the corn and soybean prices were determined by the market prices at harvest month of every year.
YE (kg ha−1) = soybean yield (kg ha−1) × soybean price (USD kg−1)/Corn price (USD ha−1)
The prices of corn and soybean prices were set by the market prices at harvest each year in order to calculate the economic benefits of each treatment. The total inputs included labor and machinery costs as well as fertilizers, seeds, and pesticides, which are shown in Table 2. The economic benefit was calculated using the following equations:
Total revenue (USD ha−1) = yield (kg ha−1) × price (USD kg−1)
Net revenue = Total revenue − Total inputs

2.4. Data Analysis

With treatment and block as the primary effects, all the data were arranged in MS Excel 2019 (Redmond, WA, USA) and examined for normality of distribution using the PROC UNIVARIATE and GLM procedure in SAS version 9.2 (SAS Institute, Inc., Cary, NC, USA). Each crop year’s data were analyzed separately. At the p < 0.05 level of significance, Fisher’s protected least significant difference (LSD) test was used to compare the means. All the images were diagramed using SigmaPlot version 12.5 (SYSTAT Software, Inc., San Jose, CA, USA). All the tables were prepared in MS Excel 2019 (Redmond, WA, USA).

3. Results

3.1. Commercial Crop Yield and Corn Equivalent Yield

The commercial yield performance of continuous corn and soybean varied among different years from 2017 to 2020 (Figure 2). The yield of the commercial grain of continuous soybean (CS) in 2017 was lower than that of the other years. The yield of the commercial grain of the CS treatment was the highest in 2018 and began to decrease from 2019 onward. The yields of commercial grain in 2018 were 1.14- and 1.16-fold compared with those in 2019 and 2020, respectively. The treatments performed differently under different types of years, and there was no significant difference between the continuous crops and rotation crops. The yield of the commercial grain of continuous corn (CC) in 2019 was lower than that of the other years, and there was no significant difference in the yield of commercial grain in the other years.
The annual soybean yield from 2017 to 2020 was calculated into equivalent corn yield for statistical comparison (Figure 3). In 2017, the highest yield of commercial grain of the CC treatment was higher than that of all the other treatments, which was 2.74-fold higher than that of the CS treatment. The commercial yield of the grain of the CC, SC, and SCC treatments of corn in 2018 was higher than that of the CS treatment, and the yield of the commercial grain of the CS treatment was 0.66-fold lower than that of the CC treatment. In 2019, the CC and SCC treatments had the highest yield of commercial grain, which was higher than that of the CS and SC treatments. The yield of the commercial grain of the CS treatment was 0.65-fold lower than that of the CC treatment. In 2020, the yield of the commercial grain of the CC and SC treatments was higher than that of the CS and SCC treatments, and the yield of the commercial grain of the CS treatment was 0.64- and 0.61-fold lower than that of the CC and SC treatments, respectively. The yield of the commercial grain of the CC and SC treatment was the highest. After a comprehensive analysis of the four-year rotation of 2017–2020, the yield of the commercial grain of the CS treatment was determined to be 0.58-, 0.78-, and 0.76-fold lower than that of the CC, SC, and SCC treatments, respectively. There was no difference in the yield of the commercial grain between the SC and SCC treatments.

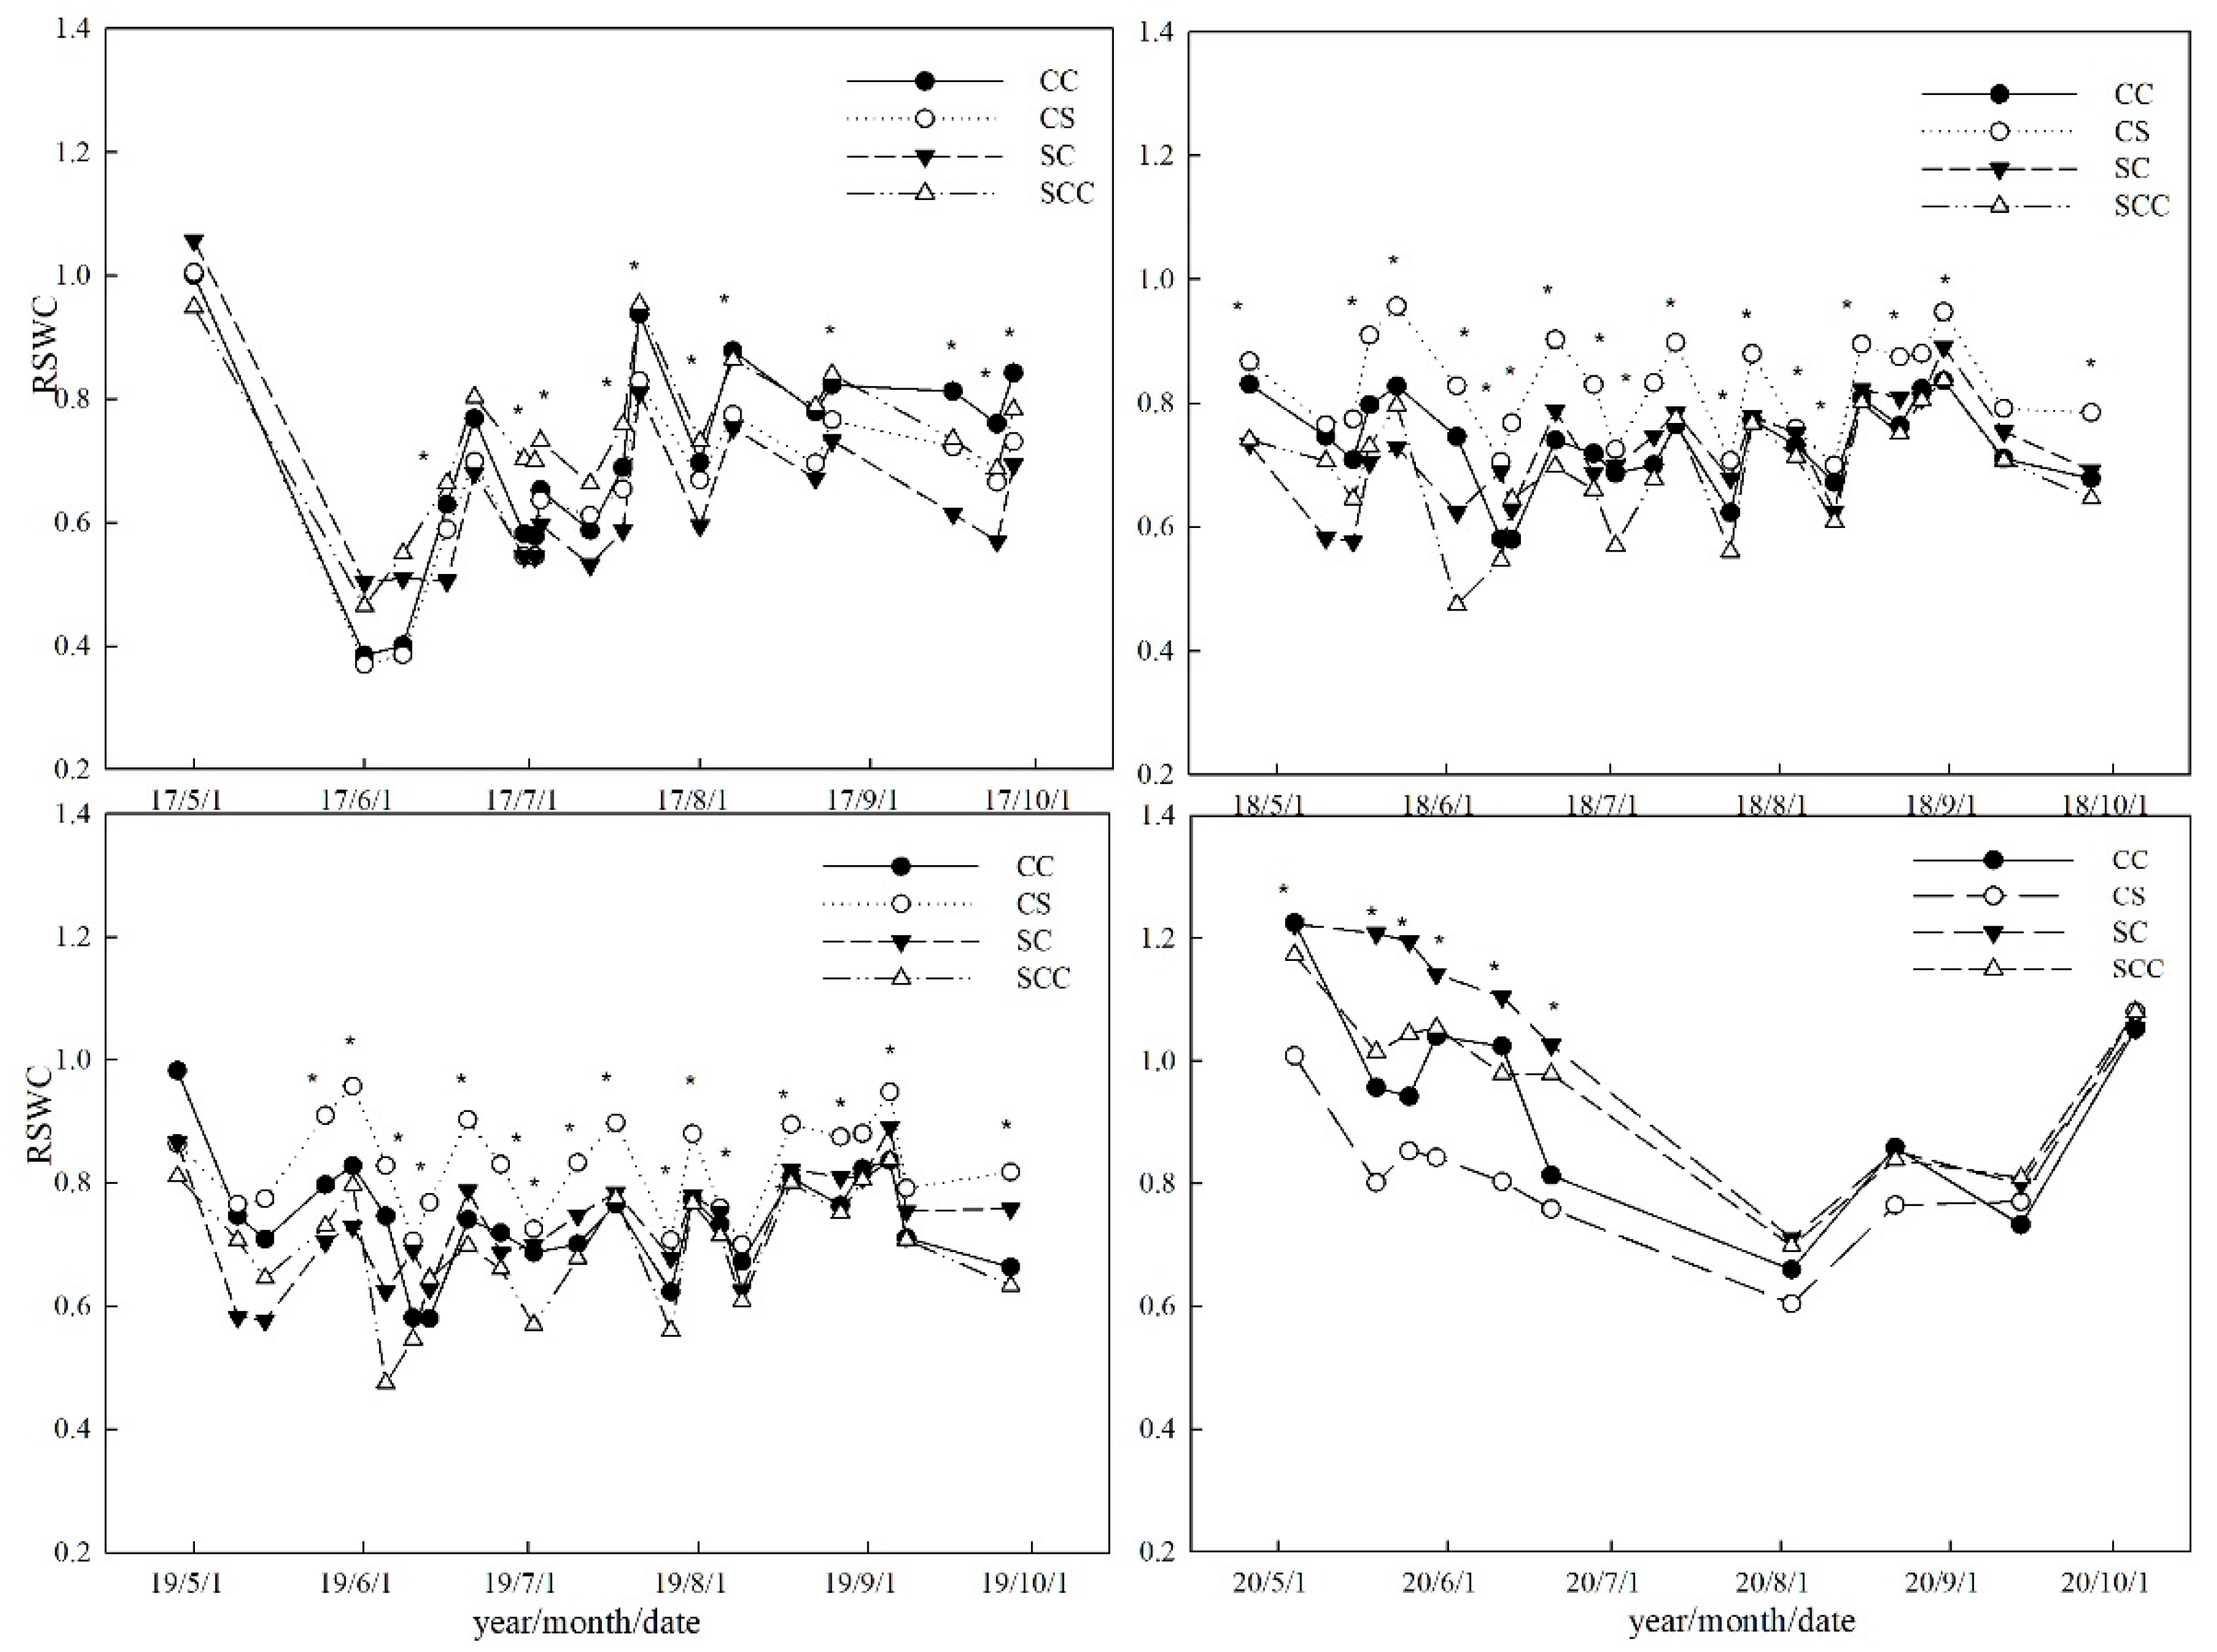
3.2. Relative Soil Water Content and Evapotranspiration

The tube and soil in 2017 had a fitting process until the fifth measurement, when the results became accurate, but the trend of each treatment could still be noticed in the first four times because the experiment had just begun treatment (Figure 4). Moisture test measurements are impacted by persistent typhoon rainfall at the experiment site from June to August 2020. From 2017 to 2020, all treatments took place under low-stress conditions for a shorter period of growing time (Figure 4). The RSWC of the CC treatment was higher than the other treatments (soybean) in 2017. The RSWC of the CS treatment was higher than the other treatments in the normal year (2018 and 2019), with the CC treatment being higher than the rotational crop treatment (SC and SCC). All soybean crop treatments (CS and SC) had a higher relative water content than corn crop treatments (CC and SCC) in 2019. The RSWC of the CS treatment was lower than the other treatments in the wet year (2020), with the CC treatment being lower than the rotation treatments (SC and SCC). The relative soil water content of the treatments with soybean and corn exhibited different results in each year.
The CS treatment consumed less water from 2017 to 2020 than the CC treatment, but the ETc act-d of the CC treatments was lower from 2017 to 2020 (Table 3). In 2017, the ETc act-d of the CC treatment was the smallest of all the treatments because the ΔSW of the CC treatment was the smallest of all the treatments. The ETc act-d of the SC treatment was higher than those of the CC and CS treatments, and the ΔSW of the SC treatment was higher than that of the CC and CS treatments. The D of SC treatment was significantly smaller than that of all the other treatments. In 2018, the ETc act-d of the CS treatment was smaller than that of the other treatments. The ΔSW of the CC and SCC treatment was positive; the ΔSW of other treatments was negative, and the ΔSW of the CS treatment reached −31.1 mm. In 2019, the ETc act-d of all the treatments did not differ significantly. In 2020, the ETc act-d of the SC treatment was the largest because the ΔSW was the largest, and D was the smallest. The ETc act-d of the CS treatment was the smallest, and there was no difference between the CC and SCC treatments.

3.3. Water Productivity

The WPC and WPB of the CC treatment were higher than those of the CS treatment each year. However, the WPC and WPB of soybean under the rotation did not differ from those of soybean under a continuous rotation (Figure 5). In 2017, the WPC of the CC treatment was 6.73-, 7.24-, and 6.71-fold higher than those of the CS, SC, and SCC treatments, respectively. The WPC of soybean treatments did not differ significantly. In 2018, the WPC of the CS treatment was 0.43-fold lower than that of the CC treatment. The WPC of the CC treatment was higher than that of the SCC treatment. In 2019, the WPC of the CC and SCC treatments for corn planting was larger than that of the CS and SC treatments. The WPC of the CS treatment was 0.31-fold lower than that of the CC treatment. The WPC of the CS and SC treatments was smaller than those of the CC and SCC treatments. In 2020, the WPC of the CC and SC treatments were larger than those of the CS and SCC treatments. The WPC of the CS treatment was 0.35-fold lower than that of the CC treatment. The average WPC of the CS treatment was the lowest after thoroughly examining the four-year rotation from 2017 to 2020. It was 0.30, 0.50, and 0.54 times lower than that of the CC, SC, and SCC treatments. The CC treatment had the largest WPC.
In 2017, the WPB of the CS treatment was 0.67-fold lower than that of the CC treatment. The WPB of the SC treatment was the lowest. The WPB of the CC treatment was the largest. In 2018, the WPB of the CS treatment was 0.51-fold lower than that of the CC treatment. The WPB of the CC and SC treatments was higher than that of the SCC treatment. In 2019, the WPB of the CC and SCC treatments for corn planting was higher than that of the CS and SC treatments. The WPB of the CS treatment was 0.39-fold lower than that of the CC treatment. In 2020, the WPB of the CC and SC treatment was higher than that of the CS and SCC treatments. The WPB of the CS treatment was 0.56-fold lower than that of the CC treatment. A comprehensive analysis of the four-year rotation of 2017–2020 indicated that the WPB of the CS treatment was the lowest and was 0.54-, 0.77-, and 0.74-fold lower than that of the CC, SC, and SCC treatments. The WPB of the CS treatment was the smallest treatment. The WPB of the CC treatment was the largest treatment.

3.4. Economic Benefits

The economic benefits of each treatment were evaluated statistically from 2017 to 2020. The total income and the net income of the corn were higher than those of the soybean each year (Table 2). The total income of the CC treatment was 2.77-, 2.72-, and 2.70-fold higher than that of the CS, SC, and SCC treatments in 2017. In 2018, the total income of the CC, SC, and SCC treatments was 1.50-, 1.50-, and 1.46-fold higher than that of the CS treatment. In 2019, the total income of the CC and SCC treatments was the highest, while the total income and net income of the CS and SC treatments of the soybean crops were the lowest. The total income of the CC and SCC treatments was 1.54- and 1.56-fold higher than that of the CS treatment. In 2020, the total income of the CC and SC treatments was 1.57- and 1.63-fold higher than that of the CS treatment. The total 4-year income of the treatments from 2017 to 2020 varied between crops. Although there was less input of soybean planting, the total income of the CC treatment was the highest and significantly higher than that of the CS, SC, and SCC treatments. The 4-year total income of the CC treatment was 1.72-, 1.25-, and 1.32-fold higher than that of the CS, SC, and SCC treatments, respectively. The 4-year total income of the CS treatment was the lowest. There was no significant difference between the SC and SCC treatments.
The same pattern of the net income of all the treatments was found from 2017 to 2020. The net income of the CC treatment was 6.26-, 1.59-, 1.65-, and 1.65-fold higher than that of the CS treatment in 2017, 2018, 2019, and 2020, respectively. The 4-year total net income of the CC treatment was 1.96-, 1.29-, and 1.42-fold higher than that of the CS, SC, and SCC treatments. A comprehensive analysis of the four-year rotation from 2017 to 2020 indicated that the total income and net income of the corn were higher than that of the soybean each year. The total income and net income under the rotation of corn (soybean) did not differ compared with the continuous planting of corn (soybean).

4. Discussion

4.1. Yield and Economic Benefits under the Rotation of Soybean and Corn

Yield or equivalent yield and the economic benefits are important indices for analyzing crop productivity, and they have been widely utilized in rotation cropping systems. The soybean–corn rotation mode is the most common in Heilongjiang Province, China. The field experiments were established in Lishu, Jilin Province, China (the middle of the northeast corn belt), during the growing season from 2017 to 2020. In 2019, the yield of the CC treatment was lower than that of the other years, which was found to be related to the climatic conditions in 2019. Rainfall during the anthesis and kernel-filling periods was found to be positively correlated with corn yield under the corn–soybean rotation [35]. In the study of Yuan et al. (2022), a similar trend was obtained for rainfall from May to September, with the yields of corn and soybean appearing to decline as precipitation decreased from 410.9 mm in 2015 to 282.2 mm in 2016 [36]. In the current study, the rainfall in May, June, and July was 2.14, 0.56, and 0.90 times that of the average rainfall in 1980–2020, which could have had some impact on the growth and development of corn in 2019. The yield of the commercial grain of the continuous cropping soybean (CS) in 2017 was significantly lower than that in other years in particular, which was related to the planting density of that year. The yield under the rotation of corn (soybean) did not differ compared with that under the continuous cultivation of corn (soybean) (Figure 2). The equivalent yield of corn was higher than that of soybean each year (Figure 3). Therefore, the effects of the corn–soybean rotation may not have had significant effects in the short term, which was similar to the findings of a study by Wang (2019), who found that the grain yield of rotated maize was significantly higher than that of continuous maize only after five years of crop rotation [22]. This was similar to the results of Ru et al. (2021), where there was some increase but no significant difference in yield and biomass in the maize and soybean rotation pattern compared with the maize continuous crop [37]. However, since the adjustment of measures to local conditions is the key, we cannot blindly adopt the same measures.
In this study, the yield of soybean did not decrease from 2018 to 2020, and the yield of soybean under rotation did not improve (Figure 2). A different result was also reported by Agomoh et al. (2021), who showed that the soybean yield was reduced when it was grown continuously, but it was higher when grown in rotation with cereal crops [38]. One of the reasons was that the comparatively low aboveground and belowground biomass of soybean could reduce the levels of soil organic C [34]. The conditions of the test field ensured a high yield of crops (Table 1). The same phenomenon was found in the corn rotation as in soybean, i.e., the yield of corn under rotation did not improve (Figure 2). The yields of rotated crops vary in different places. These field experiments were established in the middle of the northeast corn belt, where the tillage layer is 38 cm deep, and the organic matter content is as high as 22.75 g kg−1. This experiment showed that the yields of corn and soybean increased by 1.0 and 0.4 t ha−1, respectively, compared with the continuous cropping of corn and soybean in Illinois, USA [39]. When wheat (Triticum aestivum L.) was added as the third crop of the corn–soybean rotation, the yield of soybean and corn increased compared with that of continuous cropping [40]. Compared with the soybean–corn rotation system, the yield of corn in the soybean–corn rotation system increased by 0.4 t ha−1, and the yield of soybean increased by 0.7 t ha−1. Research conducted by the South African Grain Research Laboratory NPC (Pretoria, South Africa) showed that the yield of corn could increase by 11–13% when corn was planted in soybean stubble under traditional plowing [39]. The important factors for the yield of soybeans were sowing time, density, and row spacing. Long-term experiments in Missouri (USA) also showed that the yield of soybean in soybean–corn rotation was higher than that in soybean continuous cropping, with an average annual increase of 7.3%. Copeland et al. (1992) found that a two-year rotation of soybean and a one-year rotation of corn resulted in the highest yields of soybean and corn [16]. Han et al. (2016) found similar results in Hailun (Heilongjiang Province, China) and Gongzhuling (Jilin Province, China). The results showed that the rotation of the corn–soybean treatment and the corn–corn–soybean treatment could improve the yield of both systems by 8.8% and 11.2% compared with the continuous corn treatment [41].
After a statistical evaluation of the economic benefits of each round of continuous cropping treatment from 2017 to 2020, the total income of corn was significantly higher than that of soybean during the same year, and there was no significant impact on the economic benefits between rotation corn and continuous cropping corn in the same year. If the government subsidies for planting soybeans were not considered, the economy of the CC treatment was the best crop-planting pattern. The yield and economic benefit of crops are the two key factors that affect whether or not farmers adopt rotation and no-till farming. The combination of no-till and C–S rotation was a high-yield and high-benefit system, which was suitable for the black soil in northeast China, in which droughts frequently occur in the spring [6]. The rotation of C–S had both yield and benefit advantages compared with those of C–C–C and C–C–S. In drought years, the advantages of no-till were more obvious [42]. However, the research of Zhou et al. (2015) was conducted in the Dehui Experimental Base, Northeast Institute of Geography and Agroecology, Chinese Academy of Sciences (44.2° N, 125.6° E), which belongs to a mid-temperate continental monsoon climate with an average annual temperature of 4.4 °C and an average annual precipitation of 471 mm [42]. These conditions were only the same for other regions with similar soil types and climatic conditions. This experiment was conducted in Lishu County, Siping City, Jilin Province (43.3° N, 124.4° E). The average annual temperature was 5.9 °C, and the average annual precipitation was 572.8 mm.
Similarly, the research of Canalli et al. (2020) showed that incomes increased as the rotation systems became more diversified. That study was conducted in the experimental station of the Agricultural Research Institute of Parana State, Pontagolsa City, Parana State, Brazil (25.1° S, 50.1° W), with an average annual temperature of 18 °C and an average annual precipitation of 1550 mm [21]. The economic benefit of the rotation system with low diversity was negative. The rotation system, including soybeans, had the highest economic benefit. Therefore, even in other regions with similar soil types and climatic conditions, the yield and economic benefits results of soybean–corn rotation were not the same, but they also differed in different countries. The continuous cropping of corn was a better choice in terms of yield and economic benefits in the Corn Belt of Northeast China, particularly in the central Jilin region.

4.2. Water Productivity under the Rotation of Soybean and Corn

Many studies showed that the improvement in crop water productivity was closely related to the process of crop growth and development in China and throughout the world [21,43,44,45,46]. The WPC and WPB of the CC treatment during 2017–2020 were the highest in all the treatments, while those of the CS treatment were the lowest. The WPC and WPB of each treatment of rotation did not differ from the CC treatment each year from 2017 to 2020. These results were not quite the same as those obtained by many other researchers. These results were similar to those obtained by Yang et al. (2019). Their results indicated that the WUE of soybean was significantly lower than that of corn because soybean consumes large amounts of water [46]. The crop yield did not improve during rotation (2017–2020). It is difficult to improve the water productivity of crops if the crop yield cannot be increased during a rotation [8]. At crop anthesis in the rotations, spring wheat and corn had different densities of root lengths [47], which may have caused variations in the uptake of water and nutrients by crops [48] and changes in the amount and activity of microorganisms, ultimately leading to different grain yields for the crops that were subsequently planted [15]. This is also the focus of future research on the rotation of corn and soybean in the CBNC.

5. Conclusions

The yield of the commercial grain of the CC treatment was higher than that of the CS treatment each year. By comparing the equivalent yield of corn, the yield of the commercial grain of the CS treatment was 0.37-, 0.66-, 0.65-, and 0.64-fold higher than that of the CC treatment in 2017, 2018, 2019, and 2020, respectively. There was no continuous cropping obstacle in the commercial yield of the CC and CS treatment in the experimental conditions for four years. The 4-year total income and net income of the CC treatment were the highest and were significantly higher than those of all the other treatments, although there was less investment in planting soybeans. The 4-year total income and net income of the CC treatment were 1.72- and 1.96-fold higher than those of the CS treatment, respectively. The farmers that planted corn earned USD 1048 more annually per hectare per year than those that planted soybeans under the conditions of this experiment. The waste and consumption of local resources should also be considered in addition to the economic benefits to farmers. The CS treatment consumed less water from 2017 to 2020 than the CC treatment, but the ETc act-d of the CC treatments was not the highest each year. The WPC and WPB of the CC treatment were higher than those of the CS treatment in each year. The WPC and WPB of soybean under the rotation did not differ from those of soybean under continuous cultivation. Therefore, the continuous cropping corn (CC) was the best planting pattern in CBNC. If the soybean–corn rotation is implemented in the CBNC, the SCC treatment is a better choice than the SC treatment.

Funding

This work was financially supported by the National Key Research and Development Program of China (grant number 2021YFD1500802 and 2016YFD0300203), the NSFC-Jilin Joint Fund Project of China (grant number U19A2035), the National Natural Science Foundation of China (grant number U19A2048) and the Science Innovation Project of the Chinese Academy of Agricultural Science (CAAS-ASTIP-2021-IEDA).

Institutional Review Board Statement

Not applicable.

Informed Consent Statement

Not applicable.

Data Availability Statement

The data that were used are confidential.

Acknowledgments

The author sincerely thank the anonymous editors and the reviewers, especially for their efforts to improve the quality of the work. We are grateful to China Agricultural University (CAU) for providing the experimental base and testing platform, to Li Zizhong (CAU) for providing ideas and guidance, and to everyone (Zhang Shuai, Zhang Feixia, Zhang Yan, Pan Yafei et al.) involved in the experiments investigation and editing of the article.

Conflicts of Interest

The author declares no conflict of interest.

References

  1. Li, Z.Z.; Sun, Z.H. Optimized single irrigation can achieve high corn yield and water use efficiency in the Corn Belt of Northeast China. Eur. J. Agron. 2016, 75, 12–24. [Google Scholar] [CrossRef]
  2. Zheng, X. China’s Food Security Research in Future Based on Balance of Supply and Demand; Guangdong University of Technology: Guangzhou, China, 2019. [Google Scholar] [CrossRef]
  3. National Bureau of Statistics of China. China Statistical Yearbook; National Bureau of Statistics of China: Beijing, China, 2021. (In Chinese)
  4. Liang, A.Z.; Yang, X.M.; Zhang, X.P.; Mclaughlin, N.; Shen, Y.; Li, W.F. Soil organic carbon changes in particle-size fractions following cultivation of Black soils in China. Soil Tillage Res. 2009, 105, 21–26. [Google Scholar] [CrossRef]
  5. Liu, S.X.; Zhao, L.P.; Liu, J.S.; Wu, J.G.; Qin, Z.J. Organic mineral complex component and distribution character of organic carbon of black soil under various cultivation pattern. J. Soil Water Conserv. 2007, 21, 105–108. [Google Scholar] [CrossRef]
  6. Han, X.Z.; Zou, W.X. Effects and suggestions of black soil protection and soil fertility increase in northeast China. Bull. Chin. Acad. Sci. 2018, 33, 206–212. [Google Scholar] [CrossRef]
  7. Wang, J.K.; Xu, X.R.; Pei, J.B.; Li, S.Y. Current situations of black soil quality and facing opportunities and challenges in northeast China. Chin. J. Soil Sci. 2021, 52, 695–701. [Google Scholar] [CrossRef]
  8. Li, B.G.; Liu, Z.; Huang, F.; Yang, X.G.; Liu, Z.J.; Wan, W.; Wang, J.K.; Xu, Y.D.; Li, Z.Z.; Ren, T.S. Ensuring national food security by strengthening high-productivity black soil granary in northeast China. Chin. J. Soil Sci. 2021, 36, 1184–1193. [Google Scholar] [CrossRef]
  9. Bilyeu, K.; Ratnaparkhe, M.B.; Kole, C. (Eds.) Genetics, Genomics, and Breeding of Soybean; CRC Press: Boca Raton, FL, USA, 2010; pp. 1–18. [Google Scholar] [CrossRef]
  10. Pagano, M.C.; Miransari, M. The importance of soybean production worldwide. In Abiotic and Biotic Stresses in Soybean Production; Miransari, M., Ed.; Academic Press: Cambridge, MA, USA, 2016; pp. 1–26. [Google Scholar] [CrossRef]
  11. USDA-NASS. USDA-NASS Agricultural Statistics 2018. Available online: https://www.nass.usda.gov (accessed on 1 July 2020).
  12. Statistics Canada. Production of Principal Field Crops, November 2018. (Catalogue number 11-001X). Available online: https://www150.statcan.gc.ca/n1/daily-quotidien/181206/dq181206b-eng.pdf (accessed on 1 July 2020).
  13. Al-Kaisi, M.M.; Archontoulis, S.; Kwaw-Mensah, D. Soybean spatiotemporal yield and economic variability as affected by tillage and crop rotation. Agron. J. 2016, 108, 1267–1280. [Google Scholar] [CrossRef] [Green Version]
  14. Islam, N.; Wallender, W.W.; Mitchell, J.; Wicks, S.; Howitt, R.E. A comprehensive experimental study with mathematical modeling to investigate the effects of cropping practices on water balance variables. Agric. Water Manag. 2006, 82, 129–147. [Google Scholar] [CrossRef]
  15. Feng, H.X.; Wang, T.; Osborne, S.L.; Kumar, S. Yield and economic performance of crop rotation systems in South Dakota. Agrosyst. Geosci. Environ. 2021, 4, e20196. [Google Scholar] [CrossRef]
  16. Copeland, P.J.; Crookston, R.K. Crop sequence affects nutrient composition of corn and soybean grown under high fertility. Agron. J. 1992, 84, 503–509. [Google Scholar] [CrossRef]
  17. Zou, W.X.; Yan, J.; Yuan, Y.R.; You, M.Y.; Zhang, Z.M.; Yang, C.B.; Wang, Y.; Han, X.Z. A review on world soybean research conference ix in south Africa on the rotation and fertilization of soybean. Soybean Sci. 2013, 32, 852–853+861. (In Chinese) [Google Scholar]
  18. Zhang, Y.W.; Liu, W.Z.; Wang, J.; Yang, Y.L. Effects of long-term rotation and fertilization on the growth, yield and water use of spring maize. Bull. Soil Water Conserv. 2010, 30, 124–128. [Google Scholar] [CrossRef]
  19. Fernández, J.E.; Alcon, F.; Diaz-Espejo, A.; Hernandez-Santana, V.; Cuevas, M.V. Water use indicators and economic analysis for on-farm irrigation decision: A case study of a super high density olive tree orchard. Agric. Water Manag. 2020, 237, 106074. [Google Scholar] [CrossRef]
  20. Pikul, J.J.L.; Osborne, S.L.; Riedell, W.E. Corn yield and nitrogen- and water-use under no-tillage rotations. Commun. Soil Sci. Plant Anal. 2012, 43, 2722–2734. [Google Scholar] [CrossRef]
  21. Canalli, L.B.D.; da Costa, G.V.; Volsi, B.; Leocadio, A.L.M.; Neves, C.S.V.J.; Telles, T.S. Production and profitability of crop rotation systems in southern Brazil. Semin.-Cienc. Agrar. 2020, 6, 2541–2554. [Google Scholar] [CrossRef]
  22. Wang, H.Y. Comparative Study on Planting Mode of Spring Maize in Northeast of China; Jilin University: Changchun, China, 2019. [Google Scholar] [CrossRef]
  23. Agomoh, I.V.; Drury, C.F.; Phillips, L.A.; Reynolds, W.D.; Yang, X.M. Increasing crop diversity in wheat rotations increases yields but decreases soil health. Soil Sci. Soc. Am. J. 2020, 84, 170–181. [Google Scholar] [CrossRef] [Green Version]
  24. Blanco-Canqui, H. Cover crops and water quality. Agron. J. 2018, 110, 1633–1647. [Google Scholar] [CrossRef]
  25. USDA—Natural Resources Conservation Service. Soil Survey Staff, Keys to Soil Taxonomy, 12th ed.; USDA—Natural Resources Conservation Service: Washington, DC, USA, 2014.
  26. Sun, T.; Li, Z.Z. Alfalfa-corn rotation and row placement affects yield, water use, and economic returns in Northeast China. Field Crops Res. 2018, 241, 107558. [Google Scholar] [CrossRef]
  27. Song, Z.Z.; Peng, Y.X.; Li, Z.Z.; Zhang, S.; Liu, X.T.; Tan, S.W. Two irrigation events can achieve relatively high, stable corn yield and water productivity in aeolian sandy soil of northeast China. Agric. Water Manag. 2022, 260, 107291. [Google Scholar] [CrossRef]
  28. Mohammadi, A.; Besharat, S.; Abbasi, F. Effects of irrigation and fertilization management on reducing nitrogen losses and increasing corn yield under furrow irrigation. Agric. Water Manag. 2019, 213, 1116–1129. [Google Scholar] [CrossRef]
  29. Standardization Administration of the People’s Republic of China. Grade of Agricultural Drought. 2015. Available online: http://openstd.samr.gov.cn/bzgk/gb (accessed on 1 July 2020). (In Chinese)
  30. Valipour, M.; Bateni, S.M.; Sefidkouhi, M.A.; Raeini-sarjaz, M.; Singh, V.P. Complexity of forces driving trend of reference evapotranspiration and signals of climate change. Atmosphere 2020, 11, 1081. [Google Scholar] [CrossRef]
  31. Allen, R.G.; Pereira, L.S.; Raes, D.; Smith, M. Crop evapotranspiration: Guidelines for computing crop water requirements-FAO Irrigation and drainage paper 56. Fao Rome 1998, 300, D05109. [Google Scholar]
  32. Mansour, E.; Desoky, E.M.; Ali, M.M.; Abdul-Hamid, M.I.; Ullah, H.; Attia, A.; Datta, A. Identifying drought-tolerant genotypes of faba bean and their agro-physiological responses to different water regimes in an arid Mediterranean environment. Agric. Water Manag. 2021, 247, 1067754. [Google Scholar] [CrossRef]
  33. Majumder, B.; Mandal, B.; Bandyopadhyay, P.K. Soil organic carbon pools and productivity in relation to nutrient management in a 20-year-old rice-berseem agroecosystem. Biol. Fertil. Soils 2008, 44, 451–461. [Google Scholar] [CrossRef]
  34. Pradhan, A.; Chan, C.; Roul, P.K.; Halbrendt, J.; Sipes, B. Potential of conservation agriculture (CA) for climate change adaptation and food security under rainfed uplands of India: A transdisciplinary approach. Agric. Syst. 2018, 163, 27–35. [Google Scholar] [CrossRef]
  35. Wilhelm, W.; Wortmann, C.S. Tillage and rotation interactions for corn and soybean grain yield as affected by precipitation and air temperature. Agron. J. 2004, 96, 425–432. [Google Scholar] [CrossRef] [Green Version]
  36. Yuan, M.; Bi, Y.D.; Han, D.W.; Wang, L.; Wang, L.X.; Fan, C.; Zhang, D.; Wang, Z.; Liang, W.W.; Zhu, Z.J.; et al. Long-term corn–soybean rotation and soil fertilization: Impacts on yield and agronomic traits. Agron. J. 2022, 12, 2554. [Google Scholar] [CrossRef]
  37. Ru, J.R.; Liu, L.L.; Sun, J.Y.; Ma, Z.J.; Wang, H.P.; Qiu, G.W. Effects of different crop rotation patterns on major agronomic traits and yield of maize in alpine regions. Bull. Agric. Sci. Technol. 2021, 1, 229–230+289. (In Chinese) [Google Scholar]
  38. Agomoh, I.V.; Drury, C.F.; Yang, X.M.; Phillips, L.A.; Reynolds, W.D. Crop rotation enhances soybean yields and soil health indicators. Soil Sci. Soc. Am. J. 2021, 85, 1185–1195. [Google Scholar] [CrossRef]
  39. Han, X.Z.; Zou, W.X.; Lu, X.C. Recent research progress on the effect of fertilization—Rotation—Tillage on soybean yield in USA and Brazil. Soybean Sci. Technol. 2015, 3, 14–15. (In Chinese) [Google Scholar]
  40. Gagnon, B.; Pouleur, S.; Lafond, J.; Parent, G.; Pageau, D. Agronomic and economic benefits of rotating corn with soybean and spring wheat under different tillage in Eastern Canada. Agron. J. 2019, 111, 3109–3118. [Google Scholar] [CrossRef]
  41. Han, T.F.; Han, X.Z. On the agricultural development road of balanced and high yield of grain—Bean rotation. Soybean Sci. Technol. 2016, 1, 1–3. (In Chinese) [Google Scholar]
  42. Zhou, G.Y.; Zhang, X.P.; Fan, R.Q.; Liang, A.Z.; Huang, D.D.; Yang, X.M. No-tillage effects on corn and soybean yield and profitability: Based on a long-term field trial of black soil in northeast China. J. Jilin Agric. Univ. 2015, 37, 260–267. [Google Scholar] [CrossRef]
  43. Cattivelli, L.; Rizza, F.; Badeck, F.W.; Mazzucotelli, E.; Mastrangelo, A.M.; Francia, E.; Mare, C.; Tondelli, A.; Stanca, A.M. Drought tolerance improvement in crop plants: An integrated view from breeding to genomics. Field Crops Res. 2008, 105, 1–14. [Google Scholar] [CrossRef]
  44. Shearman, V.J.; Sylvesterbradley, R.; Scott, R.K.; Foulkes, M.J. Physiological processes associated with wheat yield progress in the UK. Crop Sci. 2005, 45, 175–185. [Google Scholar] [CrossRef]
  45. Zhang, X.Y.; Chen, S.Y.; Liu, M.Y.; Pei, D.; Sun, H.Y. Improved water use efficiency associated with cultivars and agronomic management in the North China Plain. Agron. J. 2005, 97, 783–790. [Google Scholar] [CrossRef]
  46. Yang, Y.; Zhang, H.; Gao, L.L.; Wang, J.Y.; Yang, J.H. Study on soil moisture utilization in different rotation patterns of maize and soybean. Anhui Agric. Sci. Bull. 2019, 25, 38–40. [Google Scholar] [CrossRef]
  47. Osborne, S.L.; Chim, B.K.; Riedell, W.E.; Schumacher, T.E. Root length density of cereal and grain legume crops grown in diverserotations. Crop Sci. 2020, 60, 2611–2620. [Google Scholar] [CrossRef] [Green Version]
  48. Zhang, F.X.; Sun, T.; Li, Z.Z.; Peng, Y.X.; Sheng, T.T.; Du, M.Y.; Wu, Q. Alfalfa stand age at termination influences soil properties, root characteristics, and subsequent maize yield. Eur. J. Agron. 2023, 148, 126879. [Google Scholar] [CrossRef]
Figure 1. Monthly rainfall and fallow season distribution from 2017 to 2020 and the mean historical precipitation from 1980 to 2020 in Lishu County, Jilin Province, China.
Sustainability 15 11362 g001
Figure 2. Yield of commercial grain of each treatment from 2017 to 2020. CC: continuous corn, CS: continuous soybean, SC: one year of soybean followed by one year of corn, and SCC: one year of soybean followed by two years of corn. Different capital letters indicate the significance of continuous cropping in different years (p < 0.05). “ns” indicates no significant difference among different treatments at the p < 0.05 probability level.
Sustainability 15 11362 g002
Figure 3. Equivalent yield of commercial corn of each treatment from 2017 to 2020. CC: continuous corn, CS: continuous soybean, SC: one year of soybean followed by one year of corn, and SCC: one year of soybean followed by two years of corn. Different lowercase letters refer to the significance of the difference in yield of commercial grain between different treatments each year (p < 0.05). “ns” indicates no significant difference among different treatments at the p < 0.05 probability level.
Sustainability 15 11362 g003
Figure 4. Relative soil water content (RSWC) in the corn root zone in different treatments from 2017 to 2020. CC: continuous corn, CS: continuous soybean, SC: one year of soybean followed by one year of corn, and SCC: one year of soybean followed by two years of corn. “*” refers to the significance of the difference in RSWC between different treatments (p < 0.05). No labels indicate no significant difference among different treatments at the p < 0.05 probability level.
Sustainability 15 11362 g004
Figure 5. Crop water productivity (WPC) and biomass water productivity (WPB) of each treatment during 2017–2020. Different lowercase letters refer to the significance of the difference in yield of commercial grain between different treatments each year (p < 0.05). CC: continuous corn, CS: continuous soybean, SC: one year of soybean followed by one year of corn, and SCC: one year of soybean followed by two years of corn.
Sustainability 15 11362 g005
Table 1. Primary soil properties of the study site.
DepthSiltClaySandBDθFCTNOMAPAKpH
cm——%——g cm−3cm−3——g kg−1————mg kg——
0–38768161.450.321.5422.7530.06110.886.50
38–75781661.370.351.0214.3810.79103.506.45
75–108831341.520.350.807.636.20104.816.87
108–200781391.610.330.745.353.45100.536.70
Note: The percentages of sand, silt, and clay were the composition ratio of particles; BD, bulk density, measured using the undisturbed soil core method; θFC, field capacity; TN, total nitrogen, determined using the Kjeldahl method; OM, organic matter, measured using the K dichromate titrimetric method; AP, available phosphorus, measured using the Olsen method; AK, available potassium, measured using the ammonium acetate extraction flame photometric method; and pH (1:2.5 soil/water), measured using a pH meter.
Table 2. Economic benefits of each treatment from 2017 to 2020.
YearsTreatmentsTotal InputTotal IncomeNet Income
---------------- USD ha−1 ---------------
2017CC1057 a3004 a1948 a
CS773 b1084 b311 b
SC773 b1103 b330 b
SCC773 b1114 b341 b
2018CC1009 a2921 a1912 a
CS734 b1936 b1202 b
SC1009 a2904 a1895 a
SCC1009 a2832 a1822 a
2019CC989 a2708 a1719 a
CS719 b1762 b1043 b
SC719 b1974 b1255 b
SCC989 a2742 a1753 a
2020CC1042 a4019 a2977 a
CS757 b2566 b1808 b
SC1042 a4178 a3136 a
SCC757 b2878 b2121 b
2017–2020CC4097 a12,653 a8556 a
CS2983 d7348 c4366 c
SC3543 b10,159 b6616 b
SCC3528 c9565 b6037 b
Note: CC: continuous corn, CS: continuous soybean, SC: one year of soybean followed by one year of corn, SCC: one year of soybean followed by two years of corn. Different lowercase letters refer to the significance of the difference in economic benefits between different treatments each year (p <0.05).
Table 3. Soil–water balance of each treatment from 2017 to 2020.
2017201820192020
ΔSWCC59.9 b17.1 a47.0 ab−24.2 ab
CS68.9 b−31.1 b60.8 a−26.2 b
SC104.4 a−8.1 ab38.2 b−10.1 a
SCC84.1 ab10.2 a48.6 ab−46.4 c
DCC30.2 a33.9 a146.10.0 b
(mm)CS14.0 ab31.2 a114.918.3 a
SC0.0 b1.5 b84.60.0 b
SCC18.0 a0.2 b97.30.0 b
PCC473.8480.6543.6554.8
(mm)CS473.8463.4537.2554.8
SC473.8480.6537.2554.8
SCC473.8480.6543.6554.8
ETc act-dCC503.5 b483.8 a444.4530.6 ab
(mm)CS528.7 b421.2 b483.1510.3 b
SC578.2 a491.0 a490.8544.7 a
SCC540.0 ab510.6 a494.9508.4 b
Note: CC: continuous corn, CS: continuous soybean, SC: one year of soybean followed by one year of corn, SCC: one year of soybean followed by two years of corn. ΔSW is the change in soil water storage in the 0–140 cm deep soil profile during the season of corn growth; P is the precipitation during the entire corn growth season; D is the drainage below 140 cm; and ETc act-d is the actual total evapotranspiration. Different lowercase letters refer to the significance of the difference between treatments (p < 0.05).
Disclaimer/Publisher’s Note: The statements, opinions and data contained in all publications are solely those of the individual author(s) and contributor(s) and not of MDPI and/or the editor(s). MDPI and/or the editor(s) disclaim responsibility for any injury to people or property resulting from any ideas, methods, instructions or products referred to in the content.

