Article

The Factors Affecting the Quality of the Temperature Vegetation Dryness Index (TVDI) and the Spatial–Temporal Variations in Drought from 2011 to 2020 in Regions Affected by Climate Change

1
School of Civil and Architectural Engineering, Shandong University of Technology, Zibo 255000, China
2
Guangzhou Institute of Geography, Guangdong Academy of Sciences, Guangzhou 510070, China
*
Authors to whom correspondence should be addressed.
Sustainability 2023, 15(14), 11350; https://doi.org/10.3390/su151411350
Submission received: 27 February 2023 / Revised: 26 May 2023 / Accepted: 19 July 2023 / Published: 21 July 2023
(This article belongs to the Special Issue Climate Change and Enviromental Disaster)

Abstract

:
The temperature vegetation dryness index (TVDI) is widely used for the monitoring of global or regional drought because of its strong drought-monitoring capabilities and ease of implementation. However, the temporal errors in the land surface temperature (LST) and normalized difference vegetation index (NDVI) can affect warm and cold edges, thus determining the quality of the TVDI, especially in regions affected by climate change, such as Shandong Province. This paper explores this issue in the region in 2011, using daily MODIS MOD09GA and MOD11A1 data products. For each image acquisition time, the warm and cold edges of the NDVI–LST were extracted based on the NDVI, derived from red and near-infrared reflectance data, and the LST, derived from the MOD11A1 dataset. Then, the variations in the warm and cold edges with the LST and NDVI were analyzed. Subsequently, the influence of warm and cold edges, based on the daily values of the temperature, NDVI and precipitation during the observed period, was assessed using a linear regression. The soil moisture (SM) data obtained from the Global Land Data Assimilation System (GLDAS) datasets and the crop water stress index (CWSI) obtained from the MOD16A2 products were used for the assessment. The spatial and temporal variations in drought in Shandong Province from 2011 to 2020 were measured based on Theil–Sen median trend analysis and the Mann–Kendall test. The results show that apparently random variations were evident in the temporal evolution of the slope of the warm edge, indicating that daily data were appropriate to determine the boundary of the warm edge. Daily data were also appropriate to determine the boundary of the cold edge in a similar way. Additionally, the temperature, NDVI and precipitation in this region affected by climate change had a negative correlation with the slope and a positive correlation with the intercept. The validation results show that there was a significant negative correlation between the observed TVDI and GLDAS soil moisture values (R2 > 0.62) in 12 scatter plots. Therefore, we deduced that the monthly or yearly TVDI product produced by the daily MODIS data has a higher precision than that produced by 8-day or monthly data in regions affected by climate change. The spatial and temporal variations show that the trend of slight and moderate droughts first increased and then decreased, and, in particular, some areas presented severe drought from 2011 to 2015. The results obtained in this study are important for the scheduling of irrigation and drought warnings.

1. Introduction

Drought is a common natural disaster that seriously threatens agricultural production, aquatic resources, natural ecosystems and society [1]. With the intensification of global warming, climate change has altered precipitation patterns and triggered more intensive droughts in recent years [2,3]. The detrimental impacts of drought affect large areas of crop production and natural ecosystems and, therefore, have high socioeconomic costs. These impacts have led to increasing attention being paid to drought monitoring [4]. A considerable number of approaches have been proposed to detect and monitor drought, particularly based on remote sensing observations.
Compared with the conventional meteorological measurements available from ground-based stations, satellite observations present significant advantages as they provide a vast amount of coherent information at various spatial and temporal scales [2,5,6,7]. Remote sensing technology has been recognized as a useful tool for the large-scale area monitoring of droughts in terms of the moisture content in the top few centimeters of soil. For example, the brightness temperatures measured by the passive microwave sensors of the Advanced Microwave Scanning Radiometer-Earth Observing System (AMSR-E) onboard the Aqua satellite can be converted to surface soil moisture values [8] and used for global drought monitoring. However, the spatial resolution of the AMSR-E soil moisture data is coarse (25 km resolution), making these data unsuitable for drought monitoring at the regional scale [9,10]. Based on both visible and near-infrared (VNIR) and thermal infrared (TIR) remote sensing data, a number of remote sensing indices have been devised and used to detect and monitor droughts effectively [11]. Notably, the normalized difference vegetation index (NDVI) has been used to evaluate drought conditions [12]. However, the NDVI has two main limitations in drought monitoring applications: first, the apparent time lag between rainfall and the NDVI response and, second, the little influence that significant precipitation events later in the growing season (plant seed production period) have on the NDVI [13]. To overcome these problems, approaches combining land surface temperature (LST) and vegetation indices have been proposed for determining the canopy water status [14]. Combination indices, such as the crop water stress index (CWSI), have been developed to address the problem of the scheduling of irrigation [15]. Due to the soil background and mixed pixels, it has some problems when used at larger scales [16]. Using other approaches has been necessary in order to solve the above-mentioned problem [17]. Nemani et al. [18] used the fact that the NDVI is an indicator of green vegetation cover within the pixels, applying the NDVI and LST in the assessment of environmental conditions and in order to calculate the radiation budget. Goetz [19] reported that there is a negative correlation between the LST and NDVI, and indicated that the surface temperature can increase rapidly with water stress. The temperature vegetation dryness index (TVDI) and vegetation temperature condition index (VTCI) are two representative drought indices based on the NDVI–LST space [20]. Their usefulness has been widely investigated by using satellite data, such as those obtained from the Moderate-resolution Imaging Spectroradiometer (MODIS) and Sentinel Sea and Land Surface Temperature Radiometer (SLSTR) [11,17]. According to Carlson et al. [21], PRiCE [22], the scatter diagram of the NDVI and LST, presents a trapezoid shape. Sandholt et al. [23] proposed the TVDI based on the LST-NDVI triangle model, and the warm edge was considered to be a parallel line. The NDVI and LST are strongly correlated and their interaction normally creates a negative curve corresponding to the warm edge (e.g., Tang et al., 2010; Liang et al., 2014; Liu et al., 2015; Liu and Yue, 2018; Wan et al., 2021; Bian et al., 2023) [24,25,26,27,28,29]. However, Lambin and Ehrlich [30] observed a positive relationship in which, over time, vegetation conditions change with the surface temperature. This positive correlation is expected to shift due to climate change, particularly as seasons progress into drier months. This phenomenon may increase the uncertainty of the TVDI for larger areas and higher NDVI values [31].
With the ability to combine information from the visible, near-infrared and thermal infrared bands of light, the TVDI evaluates soil moisture by combining vegetation indices and the surface temperature. Therefore, the TVDI is better suited to monitor drought in changeable climates and varying topography. According to the concept of TVDI, a hypothesis for the stability constants of the slope and intercept of the warm and cold edges was established under the conditions of a relatively stable relationship between evaporation and transpiration, that is, a small climate change. However, this hypothesis is not valid when the climate is extremely changeable. There is a popular saying to characterize drought in Shandong Province: “nine droughts in ten years”. This region is part of the lower reaches of the Yellow River Basin and is heavily influenced by a monsoon climate. The Shandong Province has a fairly complex terrain and changeable climate. As a major agricultural province, the region is an important area for its capacity to ensure the national grain supply. However, droughts have the characteristics of high frequency, a wide distribution, obvious seasons, and a great impact on economic and social development and the ecological environment [32], having a significant negative influence on the lives of urban and rural residents and industrial and agricultural production [33].
This study explores the variations in the slope and intercept and the influencing factors of warm and cold edges in the NDVI–LST feature space in areas affected by climate change. The warm and cold edges of the NDVI–LST space were extracted using the triangle model. Then, the evaluations were conducted using the Global Land Data Assimilation System (GLDAS) datasets and the annual average CWSI for 2011. Furthermore, the spatial and temporal variations in drought in Shandong Province from 2011 to 2020 were measured based on Theil–Sen median trend analysis and the Mann–Kendall test. This study can improve the applicability of the existing triangle model by using VNIR and TIR remote sensing data.

2. Materials and Methods
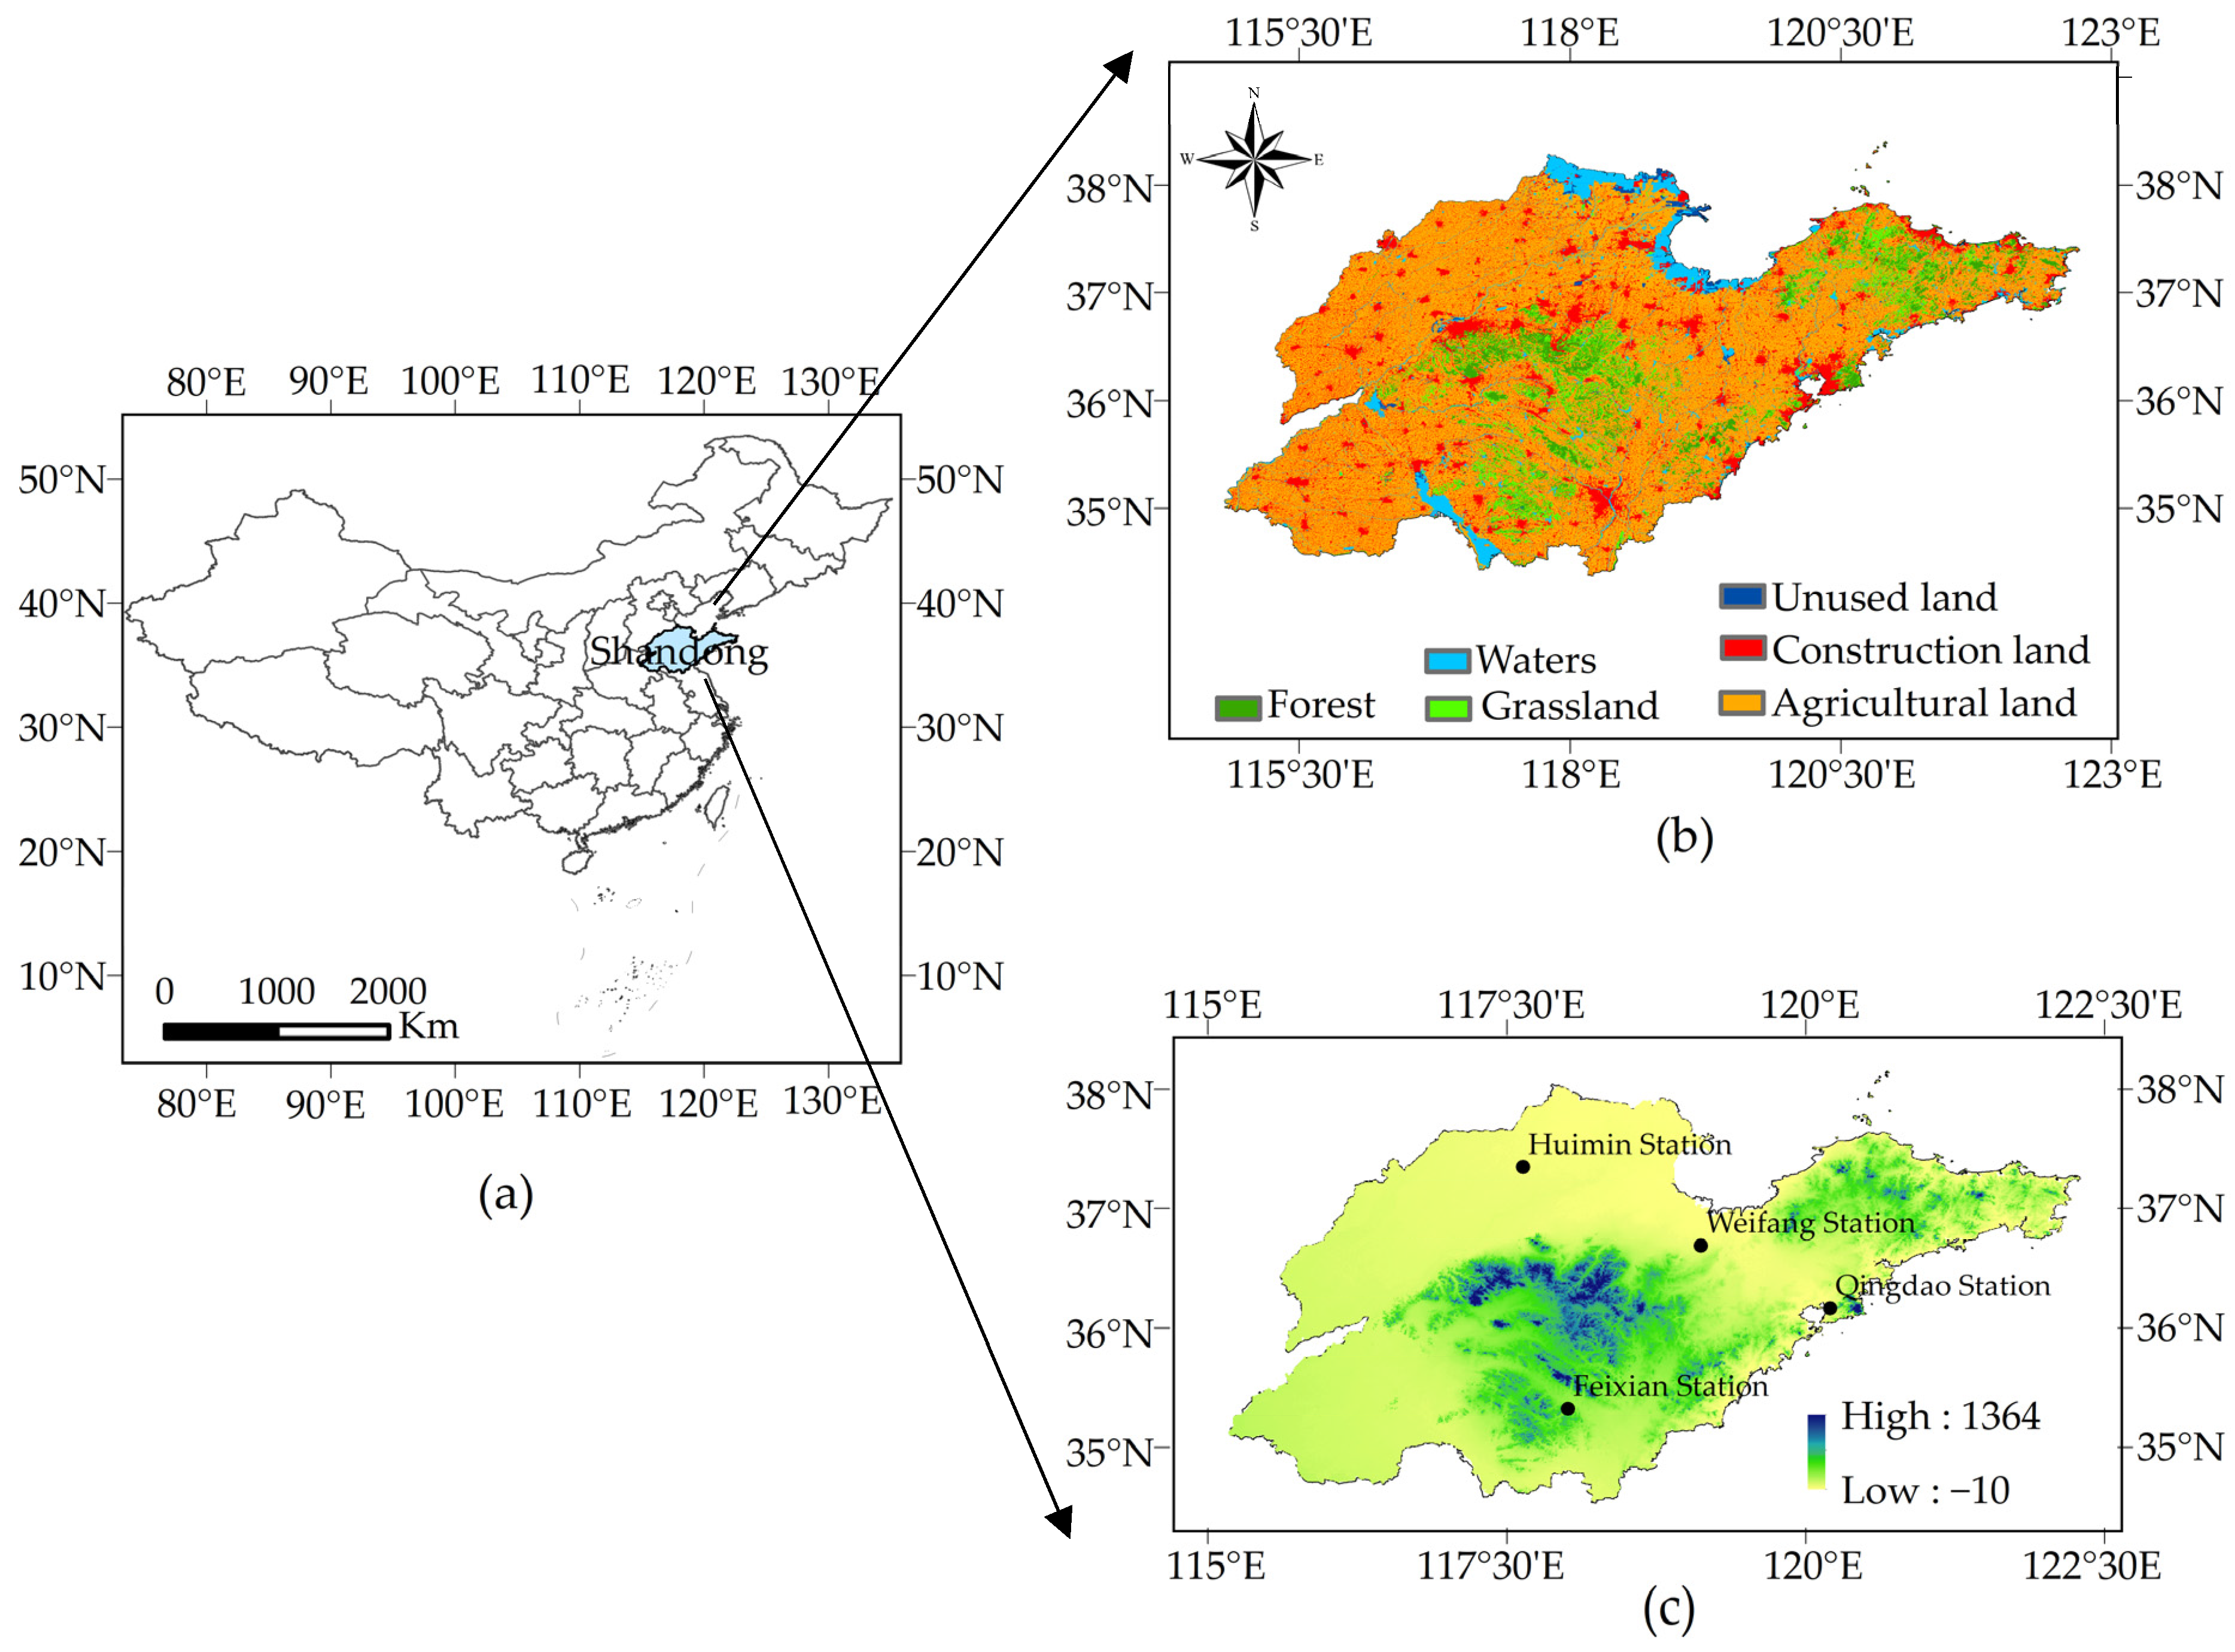
2.1. Research Area

Shandong Province is located in the eastern coastal area of China, and has the following geographical coordinates: the longitude stretches from 114°47.5′ to 122°42.3′ E, and the latitude spans from 34°42′ to 39°35′ N. It covers an area of about 15.58 million square kilometers (Figure 1). Cultivated land, forest land, grassland and construction land account for 48.17%, 13.94%, 10.8% and 18.01% of the total area of the province, respectively. Shandong Province has a temperate continental monsoon climate, which is greatly affected by the ocean monsoon. The average temperature in January is −5 °C, the average temperature in July is 25–34 °C, and the annual average temperature is 10–14 °C. The average annual precipitation is between 550 and 950 mm, with the rainy season (July–August) accounting for 60–70% of the total annual precipitation. Precipitation is unevenly distributed in time and space, resulting in droughts in Shandong Province in all periods except summer, which has a great impact on people’s lives and economic development [34].

2.2. Data Selection

The data used in this paper included remote sensing data, meteorological data and other auxiliary materials.
The main data used to compute the TVDI were derived from the MOD09GA and MOD11A1 data products. The NASA website “https://ladsweb.modaps.eosdis.nasa.gov/ (accessed on 10 January 2023)” provides these data products free of charge. MOD09GA provides MODIS bands 1–2 for daily surface reflectance at 500 m resolution, and band 1 covers a spectral range of 0.62–0.67 µm and band 2 covers a range of 0.84–0.87 µm. These reflective data were used to compute the NDVI [35]. MOD11A1 products provide daily LST data and MOD11A2 products provide 8-day synthesis LST data [27]. MOD09GA and MOD11A1 daily data products from 2011 were used to extract the slope and intercept of the warm and cold edges. These products were used to analyze the drought trend in spring from 2011 to 2020. MOD11A2 datasets were used to compute the slope and intercept of the warm and cold edges, which were compared with the daily product results. Evapotranspiration (ET) and the potential evapotranspiration (PET) were obtained from Google Earth Engine platform’s MOD16A2 product “https://code.earthengine.google.com (accessed on 12 January 2023)”, with a spatial resolution of 500 m and a temporal resolution of 8 d in 2011. CWSI data were obtained using ET and PET. To cover the entirety of Shandong Province, we needed to obtain the scene at the locations of ‘h27v05’. All MODIS datasets from 2011 to 2020 were pre-processed (i.e., format transformed, mosaicked, resampled and reprojected) using the MODIS Reprojection Tool (MRT). The calculation and analysis were conducted in ArcGIS 10.2 and MATLAB R2018b.
To assess the capacity of the dryness indices used in this study, soil moisture (SM) production data at a 10 cm depth in 2011, with a temporal resolution of one day and a spatial resolution of 0.25° × 0.25°, obtained from the Global Land Data Assimilation System (GLDAS), were used “https://disc.gsfc.nasa.gov/ (accessed on 18 January 2023)”.
The temperature and precipitation data were derived from the daily datasets of the China Meteorological Data Network “https://data.cma.cn/ (accessed on 15 January 2023)” in 2011. On the basis of the record duration, four meteorological stations in Shandong Province (Figure 1b) were chosen to verify the factors in response to the TVDI.
GlobeLand30, a product with global coverage and a spatial resolution of 30 m, developed by the National Geomatics Center of China, was produced using over 20,000 images from the Landsat satellite and Chinese HJ-1; its overall classification accuracy has been found to be greater than 80% (Chen et al., 2017) [36]. This study used the 2010 LULC map adopted from GlobeLand30 and used ArcGIS 10.2 software to reclassify the quantity of agricultural land, forest, grassland, construction land and other unused land, which accounted for 15.61%, 13.74%, 13.11%, 41.88% and 1.59% of Shandong Province, respectively.

2.3. Methodology

(1)
Normalized Difference Vegetation Index (NDVI)
The NDVI, as a commonly used index for vegetation analysis, is the most suitable indicator of vegetation growth and coverage. Its value ranges from −1 to 1. In addition, the larger the positive value, the better the vegetation growth, and vice versa. The index can be defined as expressed [37,38] in Formula (1):
N D V I = N I R Re d N I R + Re d
where NIR represents the near-infrared reflectance and Red denotes the red band reflectance. In the present study, the NDVI value was calculated by considering MODIS band 1 as the red band (620–670 nm) and MODIS band 2 as the near-infrared band (841–876 nm) reflectance.
(2)
Temperature Vegetation Drought Index (TVDI)
As revealed by Sandholt et al. [23], there are a series of soil moisture isolines in the feature space. They intersect approximately at the intersection of the warm edge (dry edge) and cold edge (wet edge), and the slope of the straight line shows a linear relationship with the soil moisture. The calculation formula is expressed as follows:
T V D I = L S T L S T min L S T max L S T min
L S T max = a + b N D V I
L S T min = c + d N D V I
The LST is a parameter that reflects the water shortage and soil moisture conditions during the vegetation growth period. The definition of the TVDI is shown in Figure 2, according to the NDVI and LST two-dimensional spatial scatter plot. For each NDVI pixel value of a single image in the region, we extracted the minimum and maximum values of the land surface temperature corresponding to each NDVI pixel (LSTmin and LSTmax, respectively). All LSTmax and LSTmin values were linearly fitted separately to obtain the warm edge and cold edge Equations (3) and (4), respectively. In the feature space, a and c are the intercepts of the warm and cold edges, respectively, and b and d are the slopes of the warm and cold edges, respectively.
In Figure 2, the scatter plot of the NDVI and LST is presented as a triangle model, where LSTmax and LSTmin are linearly fitted. The TVDI can be defined as follows:
T V D I = L S T ( c + d × N D V I ) a + b × N D V I c + d × N D V I
The TVDI values are negatively correlated with soil moisture, ranging from 0 to 1. When TVDI = 1, the pixels are on the warm edge, implying the lowest soil moisture and a high degree of drought. When TVDI = 0, the pixels are located on the cold edge, and the soil is less affected by drought. The classification of the TVDI values is shown in Table 1, according to the common division rules of TVDI values for MODIS data [30]. In addition, the influence of clouds needs to be considered in the TVDI calculation process. Therefore, we deleted all cloud contamination pixels in order to calculate the TVDI.
(3)
Trend analysis methodology
This paper used the Sen slope method to analyze the trend in the TVDI in Shandong Province in recent years. The significance of Sen trend analysis was considered using a Mann–Kendall test. The calculation formula for Sen is as follows:
β = m e d i a n x j x i j i ,   j > i
where β is the trend in drought change; median is the median function; and xi and xj are the changing TVDI values at times i and j, respectively. When β < 0, the TVDI shows an increasing trend; when β > 0, the TVDI tends to decrease.
(4)
Crop water stress index (CWSI)
The PET is a measure of the atmosphere’s ability to remove water from the surface through evapotranspiration, assuming no water supply constraints. The actual ET is the amount of water removed from a surface via evapotranspiration. The ratio between the actual ET and PET is considered as the scale for the CWSI. The CWSI was proposed by Idso et al. [39] based on energy balance, and the classification of the CWSI values is shown in Table 1 [30]. The calculation is as follows:
C W S I = 1 E T P E T
(5)
Statistical analysis
In this study, we used the linear correlation analysis function in MATLAB R2018b to show the trend in the correlation between the NDVI and LST as the latter increased, and used a linear regression model to show the variation trend. In addition, a linear correlation analysis was then applied to examine the relationship between the TVDI and soil moisture at a depth of 10 cm. Furthermore, we used an R-squared (R2) and a p-value with a significance level of 0.05 to evaluate the effect of a single linear regression model.
R 2 = 1 i y ^ i y i 2 i y i y ¯ 2
where y i represents the actual measured value; y ^ i represents the predicted value; and y ¯ represents the mean value.

3. Results and Discussion

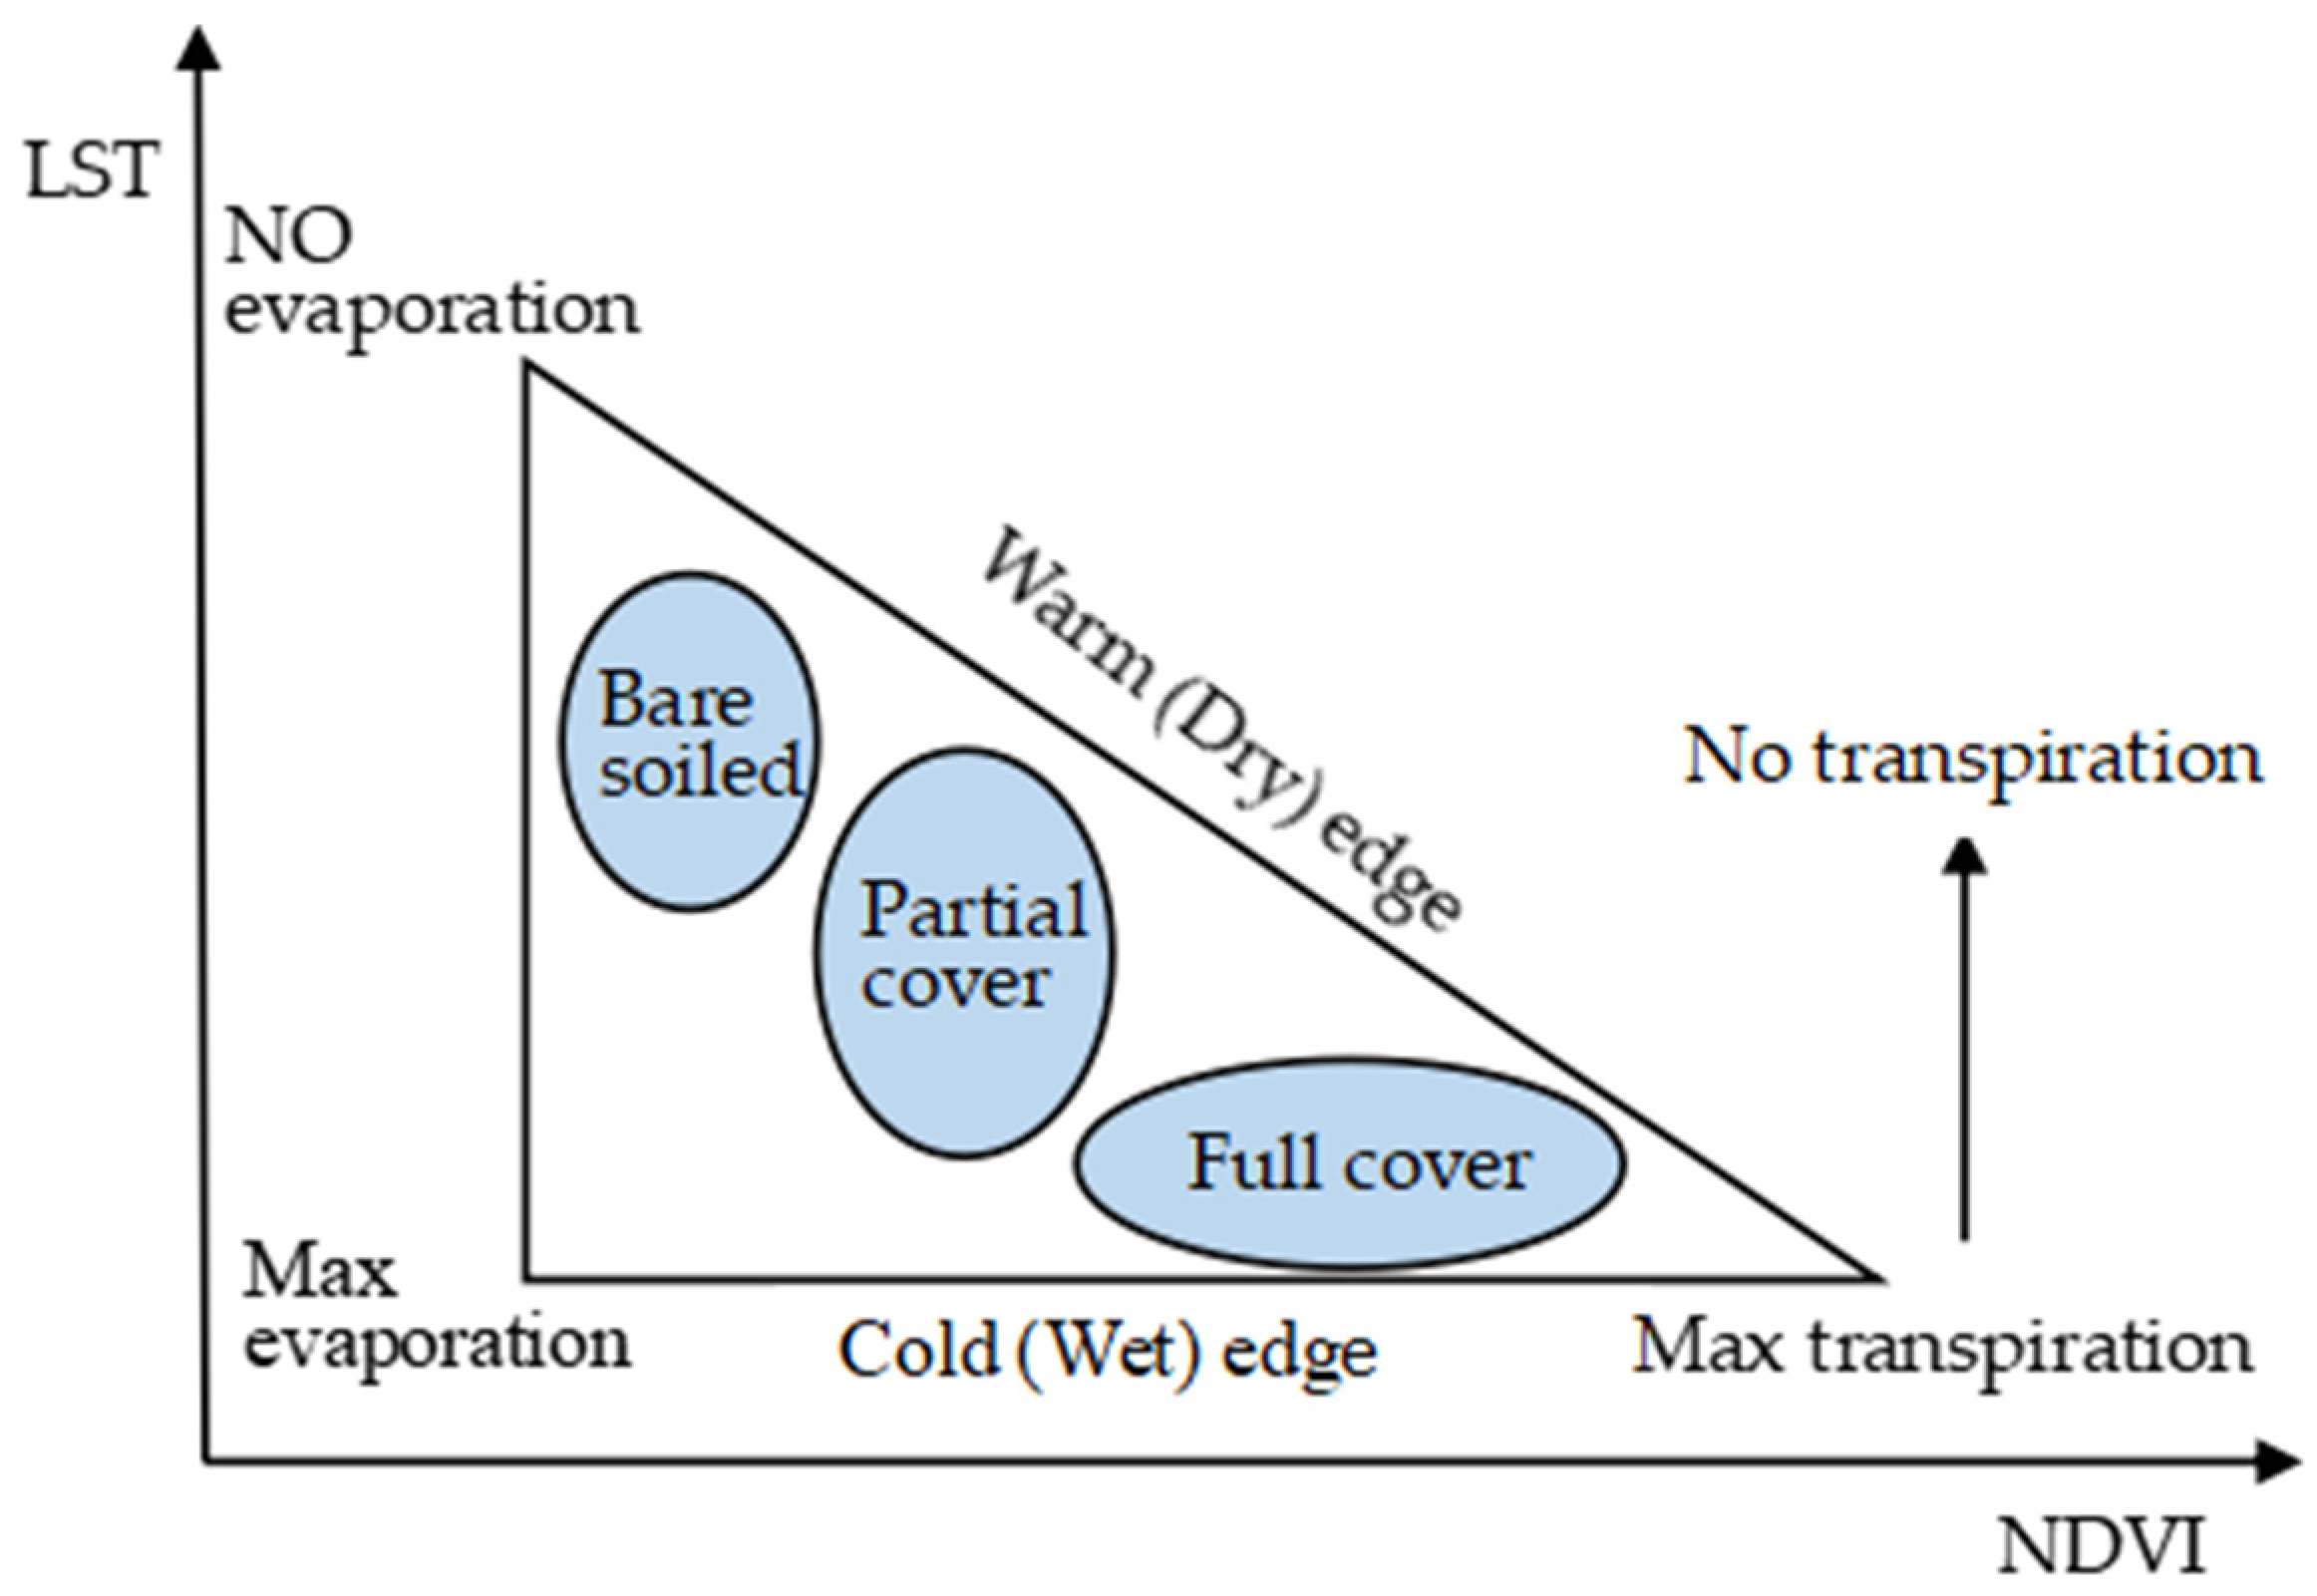
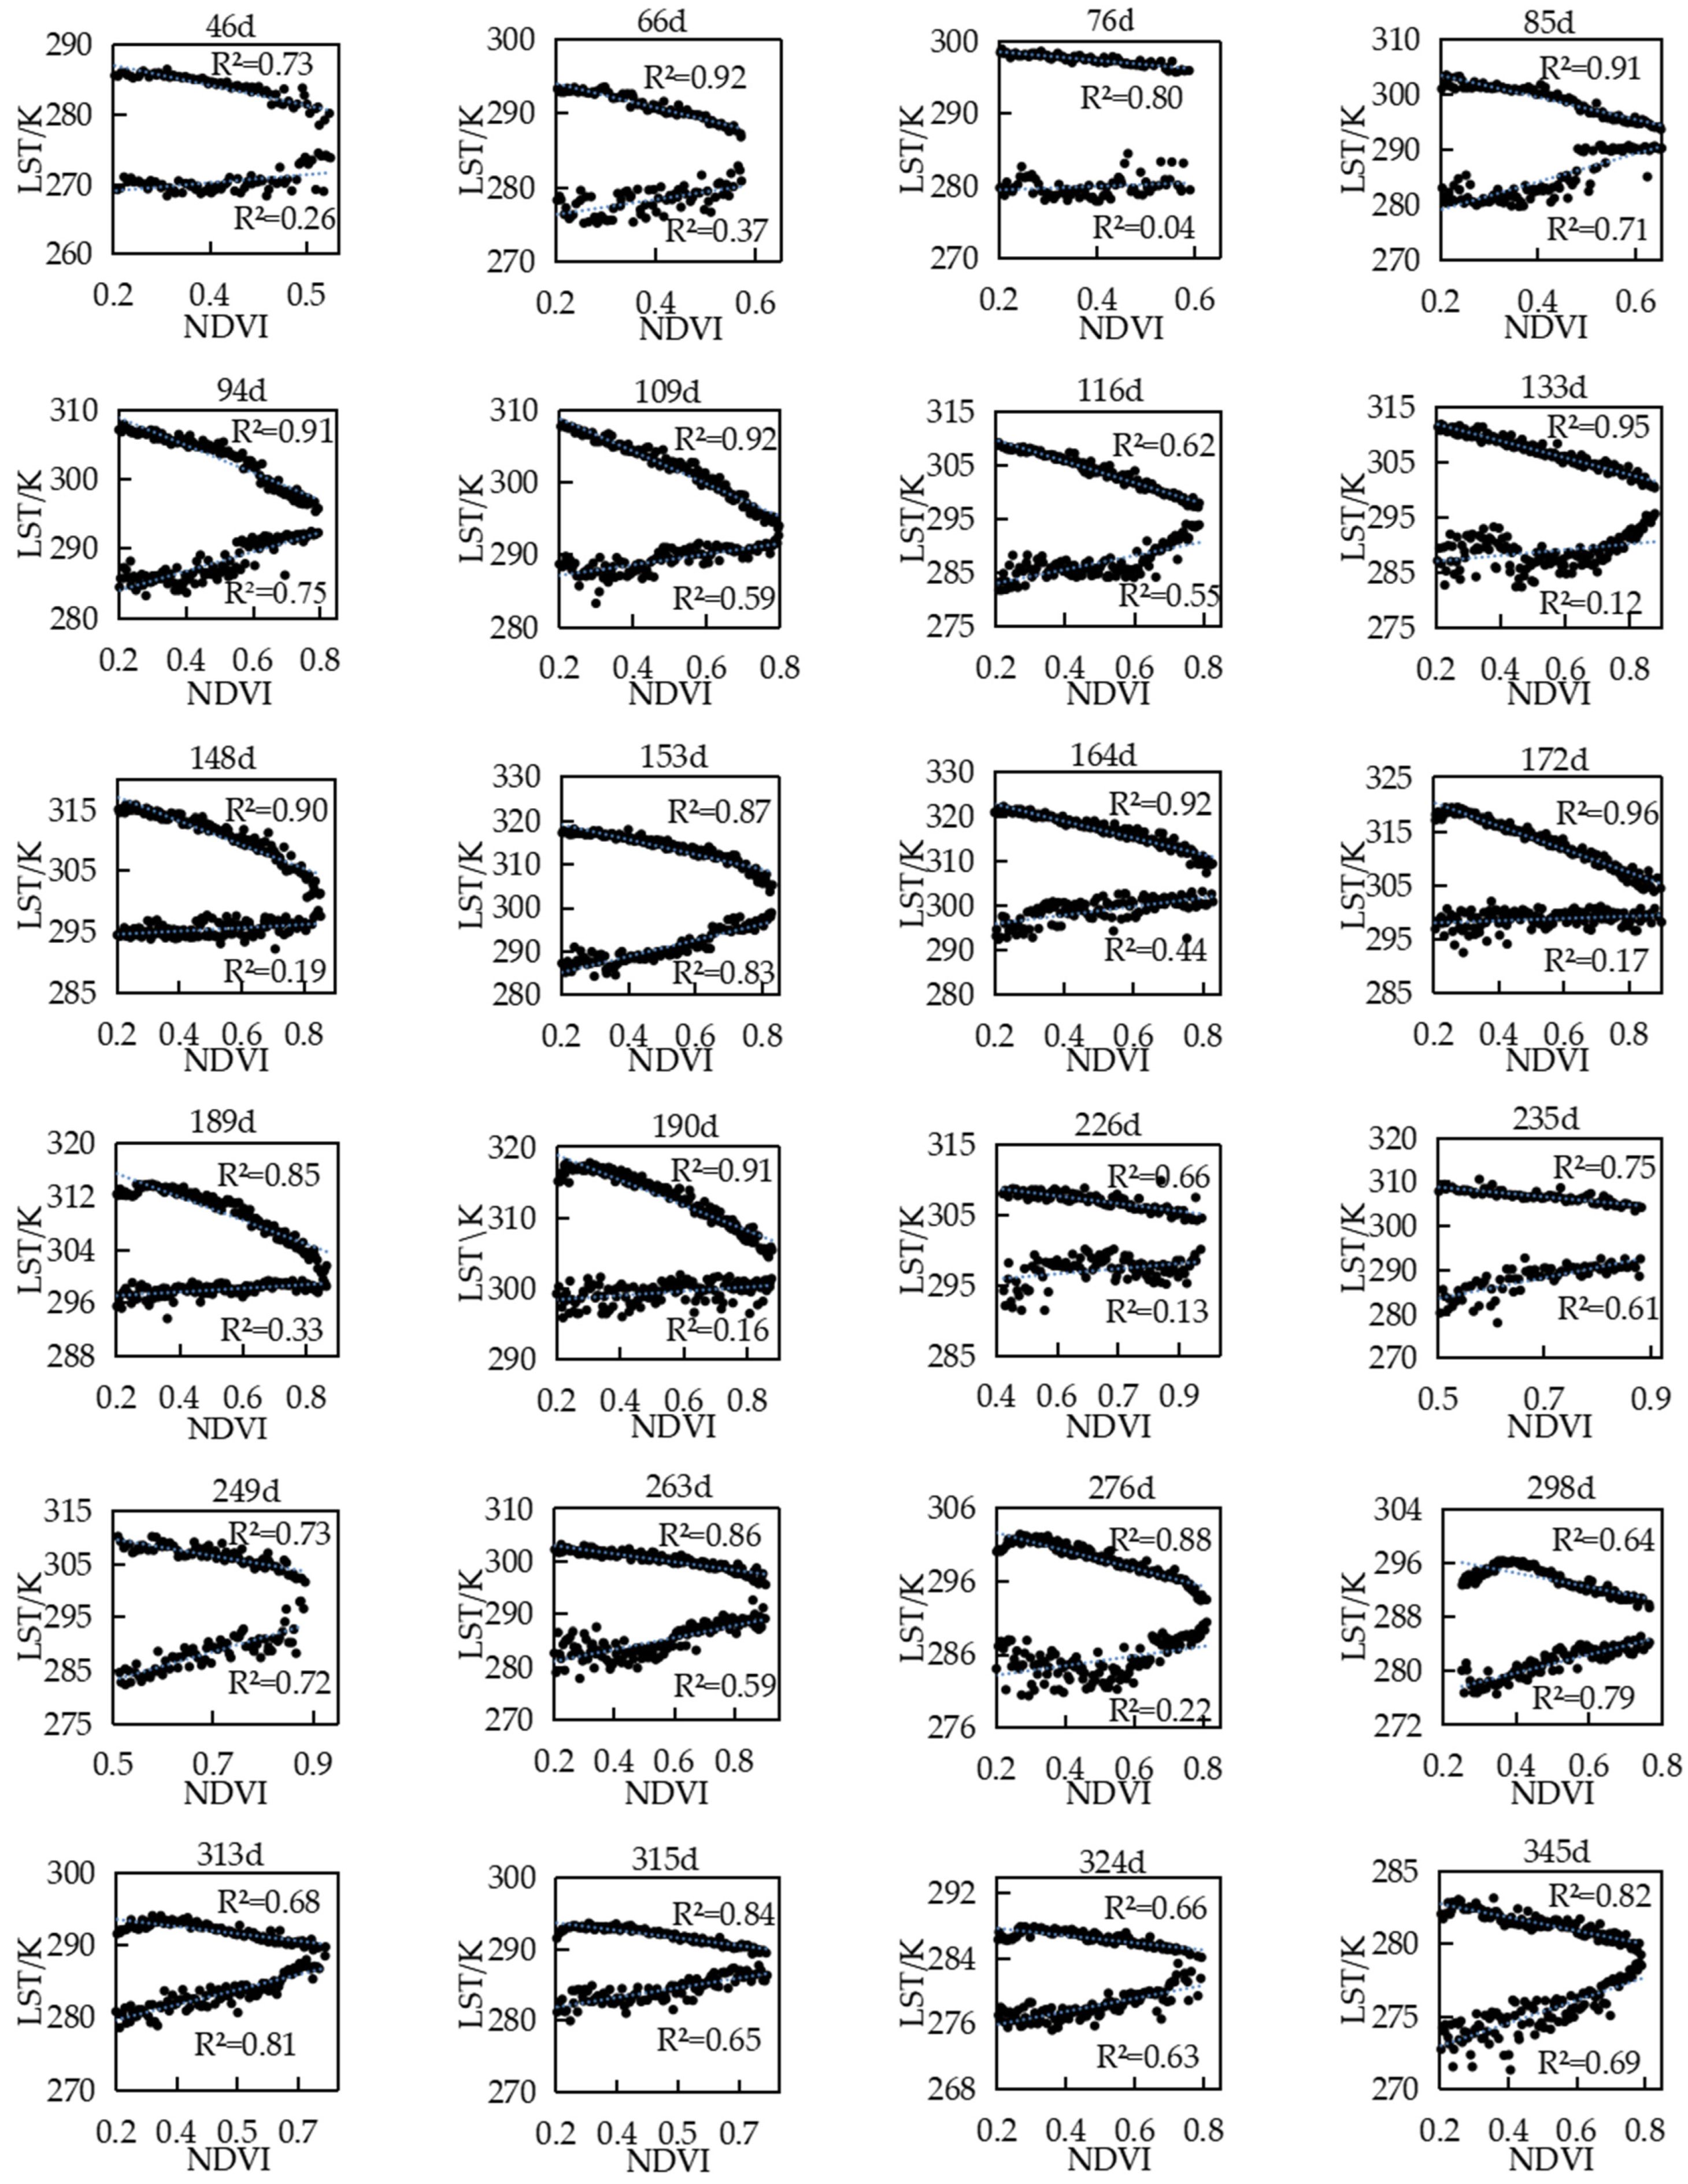
3.1. NDVI–LST Characteristic Space

The 30 NDVI–LST scatter plots for 2011 (Figure 3) show that the pixels in each day’s scatter plot clearly form a triangle, indicating a wide range of surface soil moisture areas in Shandong Province. These observations were consistent with the TVDI concept stipulating that the NDVI increases with a decrease in the LST. In order to determine the parameters that describe the warm and cold edges, least-squares regression fits were applied to the maximum LST (LSTmax) values for the small intervals of the NDVI extracted from the NDVI–LST triangle; this was performed in order to obtain the parameters described as the warm edge. The cold edge was extracted in a similar manner by using the minimum LSTs at each subinterval. The fitting results for the warm edge show a significant correlation (R2 > 0.5), except in January. Figure 3 shows that the LSTmax was lower and presented a lower horizontal line with the slight increase in the NDVI in January compared with other months. In this study, the results of the NDVI–LST scatter plots indicate that daily products can meet the TVDI concept regardless of whether the season shows stable or changing temperatures.
However, some studies have reported that the characteristic NDVI–LST space does not have a triangle shape when considering the changes in the vegetation conditions according to the surface temperature using the 8-day, 16-day or monthly products [30]. The reason for this is that, during January, the amount of solar energy that supports photosynthesis decreases and the low temperatures limit the growth of plants, thereby leading to sparse vegetation; at certain times, the snow cover also affects the NDVI–LST (Hu et al., 2019) [40]. None of the thirty cold edges are horizontal, which is consistent with the definition of the TVDI. In addition, the fitting coefficients of the cold edge fluctuate considerably and are unstable, because the LSTmin is sensitive to the land surface cover, atmospheric conditions and residual cloud cover and noise in remote sensing data (Kwon, et al., 2020) [41]. Relevant studies have reported that a low coefficient for the cold edge does not have a considerable impact on the TVDI (e.g., Liang, 2014; Ryu et al., 2021) [25,42]. Therefore, daily products are more suitable for the calculation of the TVDI in areas affected by climate change or during dry seasons, in comparison with the 8-day, 16-day or monthly products.

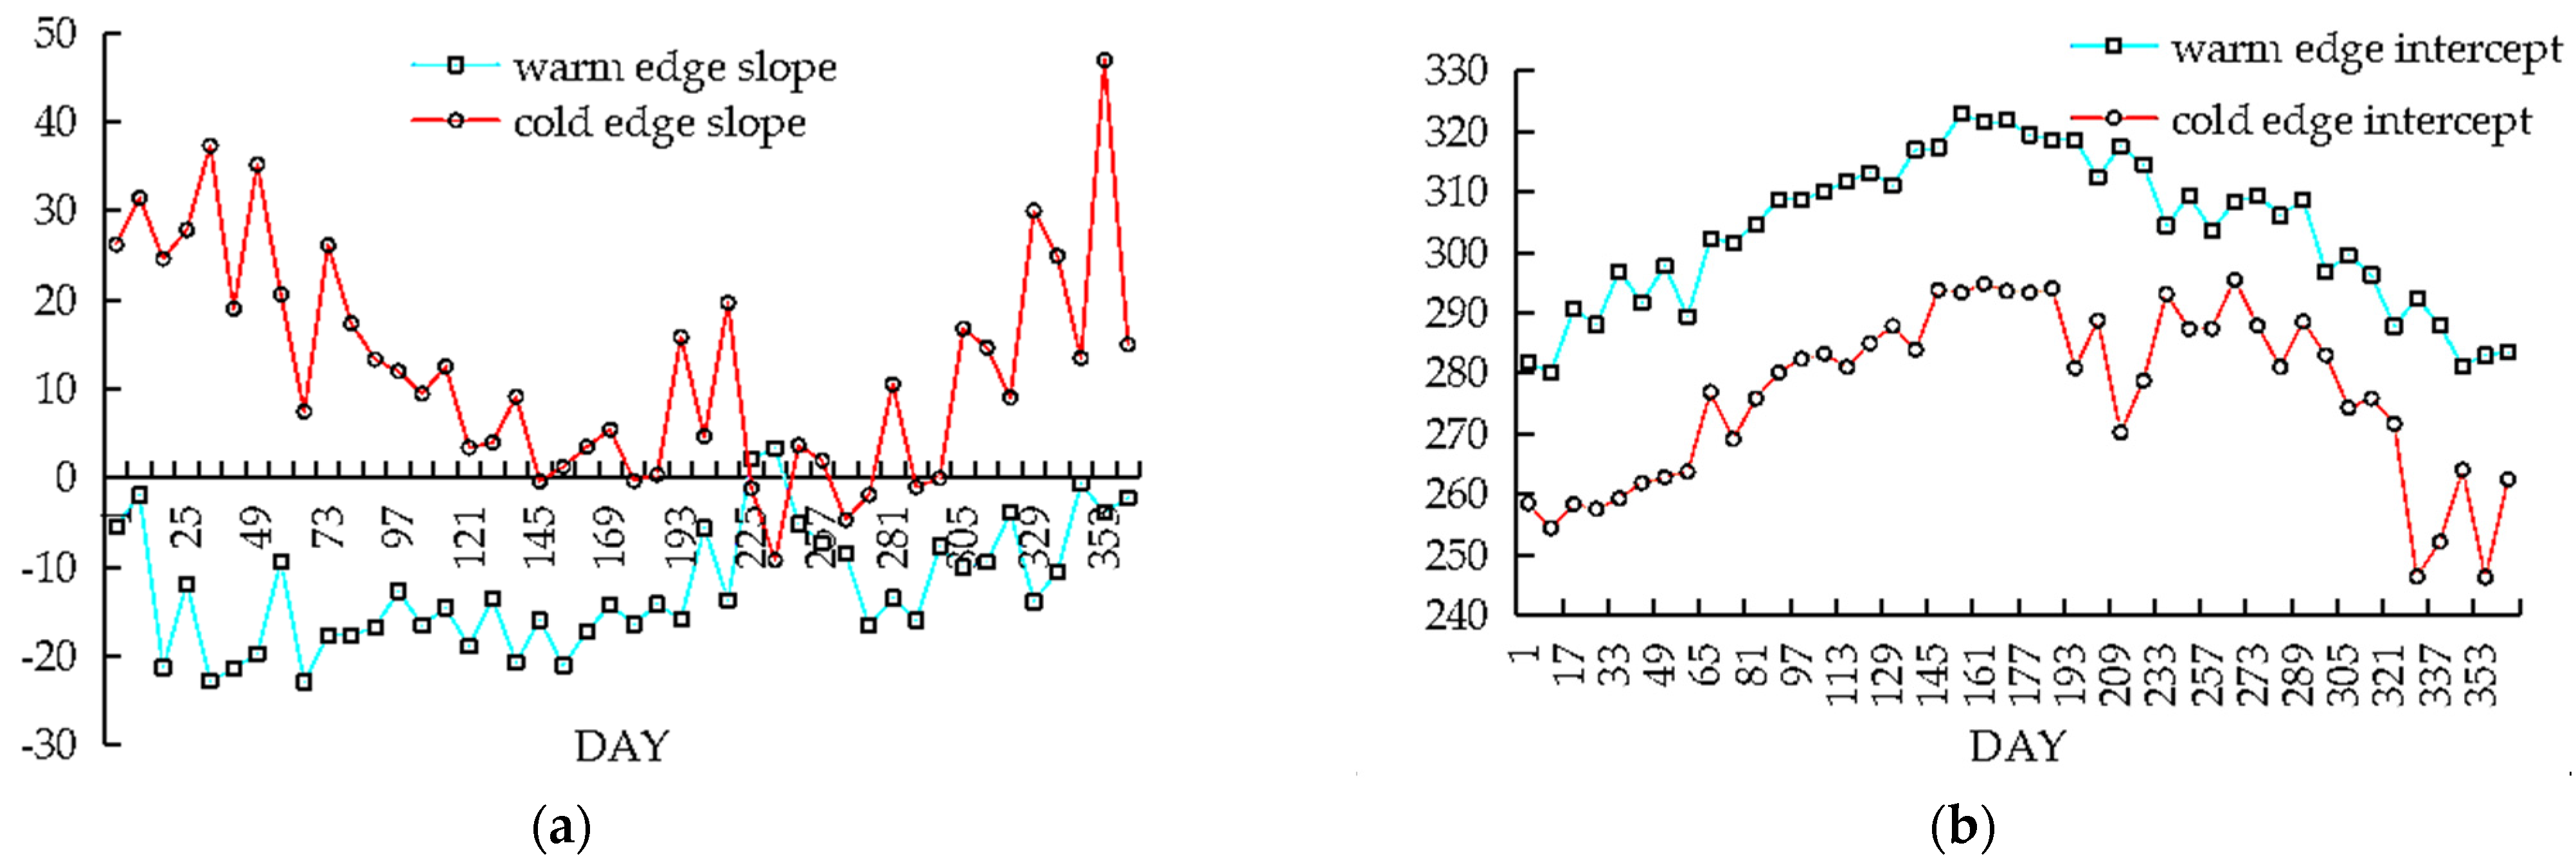
3.2. Analysis of the Variation Trends of the Warm and Cold Edges

The variation trends observed in the slope and intercept of the warm and cold edges for 2011 were plotted as a function of time in Shandong Province (Figure 4). Apparently random variations are evident in the temporal evolution of the slope of the warm edge. Most slope values of the warm edge fluctuate between −22.69 and −1.23; the negative values for the slope every day of the year conform to the triangle concept. The intercept of the warm edge increased in positive values from January to June, and then decreased in positive values from June to December. There is also no clear variation trend for the slope of the cold edge. Its slope is positive, and its value fluctuates between 2.07 and 23.13. The intercept of the warm edge has values that fluctuate from 281 K on day 16 to approximately 326 K on day 164; then, the value decreases to approximately 283 K on day 345, and finally it fluctuates between 279 K and 283 K from day 350 to day 359. A similar variation trend to that for the warm edge was observed for the intercept of the cold edge, and was approximately 10 K lower than the warm edge.
The lack of correlation and distinct trends for the slope of the warm and cold edges may be caused by certain factors, including a complex land surface cover and highly variable atmospheric forcing [23]. These results are in agreement with the findings of a previous study [43]. The variation trend observed in the warm and cold edges indicates that the use of daily products is preferable when aiming to calculate the parameters of the TVDI. The warm and cold edges determine the quality of the TVDI, so the analysis of the variation trend and the influencing factors of the warm and cold edges is of great significance when aiming to improve the accuracy of the TVDI. Other studies reported that the temporal variation in the slope of the warm and cold edges presented a similar behavior in the northern part of Senegal, where the variability in rainfall is high [23]. However, Chen et al. [43] and Son et al. [44] reported that the slope was increasingly negative in the dry season (from November to April), the intercept showed a good agreement with the slope, the slope assumed increasingly negative values and the intercept assumed increasingly positive values in the tropical monsoon climate region. Ryu et al. [42] found that the slope for both East Asia and Australia showed sinusoidal seasonal variations, which decreased relatively quickly from winter to early summer, and increased during other seasons. The results of this study do not correlate with the results of earlier studies due to this study region belonging to a temperate continental monsoon climate that is greatly affected by ocean monsoons, and other studies being conducted in areas with a tropical monsoon climate or other climates with two distinct seasons (a dry season and a rainy season). Therefore, we deduced that the climate is the main factor that influences the warm and cold edges.
Monthly or 8-day synthesized data are commonly used to establish the characteristic space of the NDVI–LST in regions with a tropical monsoon climate or other climates with two distinct seasons (Chen et al. and Son et al.) [43,44]. Our results show that the NDVI–LST scatter plot clearly formed a triangle, and the slope and intercept of the warm edge presented slight and gradual changes. However, when 8-day synthesized data were used in this study area, a positive relationship was observed, in which, over time, the vegetation conditions changed with the surface temperature (Figure 5). This positive correlation is expected to change due to the effects of climate change. This finding is consistent with the results presented by Lambin and Ehrlich [30]. The reason for this positive phenomenon is that the warm and cold edges are sensitive to the land surface cover, atmospheric conditions and residual clouds and noise in remote sensing data. When daily data (MOD11A1 and MOD09GA) were used to establish the characteristic space of the NDVI-LST, this positive phenomenon disappeared. The NDVI–LST scatter plot in each day clearly formed a triangle, and the slope and intercept presented a significant variation trend. This result indicates that daily data can partly eliminate the effects of climate change, the hysteretic trend between the NDVI and LST, and the factors of the residual clouds and noise in the images. The monthly or yearly TVDI product produced by daily MODIS data has a higher precision than the product obtained using 8-day or monthly data in regions affected by climate change. In addition, several studies have reported that the land surface cover and terrain factors also exert an effect on the slope and intercept of the warm and cold edges (Ryu et al. and Liu et al.) [27,42]. Limited by time and data factors, we did not consider the effects of land surface cover and terrain factors on the slope and intercept of the warm and cold edges.

3.3. Factors That Affect the TVDI

Rainfall and the decrease in the index values after rain events are the main factors that affect the characteristic space of the TVDI. The temporal evolution of the TVDI for the pixels representing the four rain gauge stations (Figure 1c) in the 30 images is shown in Figure 6, along with the recorded rainfall. The TVDI was generally sensitive to rainfall and the index decreases after rain events (e.g., day 133 for Feixian and Weifang, day 235 for Qingdao, and between days 263 and 324 for Huimin). However, there are exceptions on day 313 at Feixian and day 189 at Qingdao. Overall, the trend in the TVDI sees high values presented in the dry days and low values presented after rainy days, with a greater variability in spring and winter.
The TVDI is highly affected by precipitation and has an obvious hysteresis [45]. Usually, the TVDI decreases within 1–2 days after rainfall events. The NDVI value mainly reflects the growth in vegetation, but the process of vegetation growth using atmospheric precipitation and the vegetation absorption of water requires time, which leads to hysteresis [46]. During the precipitation period, the vegetation utilizes the water in the root zone and inhibits the TVDI, but after precipitation, the degree of drought is aggravated due to the evaporation of water on the soil surface [47]. Exceptions occur on day 313 at Feixian and day 189 at Qingdao because of the lower temperatures and precipitation. This result is similar to that of previous studies but is not equal, which indicates that rainfall and decreases in the index are important factors that influence the TVDI. Simultaneously, the complexity of the climate aggravates the changes in the TVDI.
Land surface cover is another factor that affects the characteristic space of the TVDI. Compared with the results of previous research, this study found that the drought level mainly presented slight and moderate drought. The degree of slight and moderate drought corresponded to an area ranging between 80% and 92%. Different land surface covers showed different degrees of drought. In the four seasons, the areas covered by agricultural land and grassland had a relatively higher degree of drought than forest land (Figure 7).
This result corresponds to the discrepancies regarding the agricultural land increasing the evapotranspiration of the land surface moisture, which aggravates the evaporation of the surface moisture and leads to the promotion of drought. The forest land has a certain ability to maintain water and can contribute to drought resistance [48]. Shandong Province has a temperate continental monsoon climate with four distinctive seasons and changes considerably [49]. This leads to the vegetation presenting obvious seasonal characteristics and significant differences, which makes the TVDI more complex under different land surface covers.
The correlation curves between the different factors and the slope and intercept of the daily warm and cold edges in 2011, shown in Figure 8, are illustrative and representative, and further clarify the effects of the temperature, NDVI and precipitation on the slope and intercept. Evidently, the temperature, NDVI and precipitation were negatively correlated with the slope and positively correlated with the intercept in 2011. The correlation was most significant with the intercept of the warm and cold edges; only the correlation between the NDVI and precipitation with the cold edge intercept was around 0.4710, and the correlation with the other intercepts was greater than 0.5612. Different factors show slopes with different degrees of warm and cold edges. The temperature and precipitation had significant impacts on the warm edge slope, and the correlation coefficients were 0.5360 and 0.6391, respectively, but the relationship between the NDVI and the slope of the warm edge was relatively weak. In terms of the cold edge slope, the temperature, NDVI and precipitation had little effect on the wet edge slope, which is due to the fact that there is no clear variation trend for the slope of the cold edge. Therefore, for the slope and intercept changes in the warm and cold edges, different factors affecting the slope and intercept showed different degrees of correlation in 2011, indicating that changes in the temperature, NDVI and precipitation affect the slope and intercept, which are especially sensitive to the temperature and precipitation.

3.4. Comparison of the Soil Moisture with the TVDI and CWSI

In order to examine the relationship between soil moisture and the TVDI, the daily values of the TVDI (observed TVDI) were calculated using MOD11A1 and MOD09GA in 2011 and by synthesizing the monthly mean. The observed TVDI was spatially averaged in the GLDAS soil moisture grid after being collocated between the observed TVDI and the GLDAS soil moisture data. The monthly mean CWSI calculated from the 8 d MOD16A2 data was calculated using the same method. Figure 9 shows the relationship between the observed TVDI and GLDAS soil moisture and the relationship between the CWSI and GLDAS soil moisture per month in 2011. There is a significant negative correlation between the observed TVDI and GLDAS soil moisture (R2 > 0.62) in the 12 scatter plots. Previous studies showed that the decision coefficient (R2) ranged from 0.30 to 0.80 between the TVDI and soil moisture at a soil moisture depth of 10 cm. However, there was no significant correlation between the CWSI and GLDAS soil moisture. The correlation coefficient was only 0.57 in May and 0.001–0.29 in other months. Even in June, the CWSI was positively correlated with the soil moisture.
Under the same soil moisture conditions, the reason for the large difference in R2 between the observed TVDI and CWSI is the use of products in regions affected by climate change [50]. Compared with the TVDI calculated using daily products, the CWSI was calculated using 8 d synthetic data. Due to the soil background and mixed pixels, it presents some problems when used at larger scales and longer monitoring periods [16]. The results of this study indicate that there is a close relationship between the observed TVDI and GLDAS soil moisture. In another words, the daily parameters describing the warm and cold edges can improve the accuracy of the retrieved TVDI.

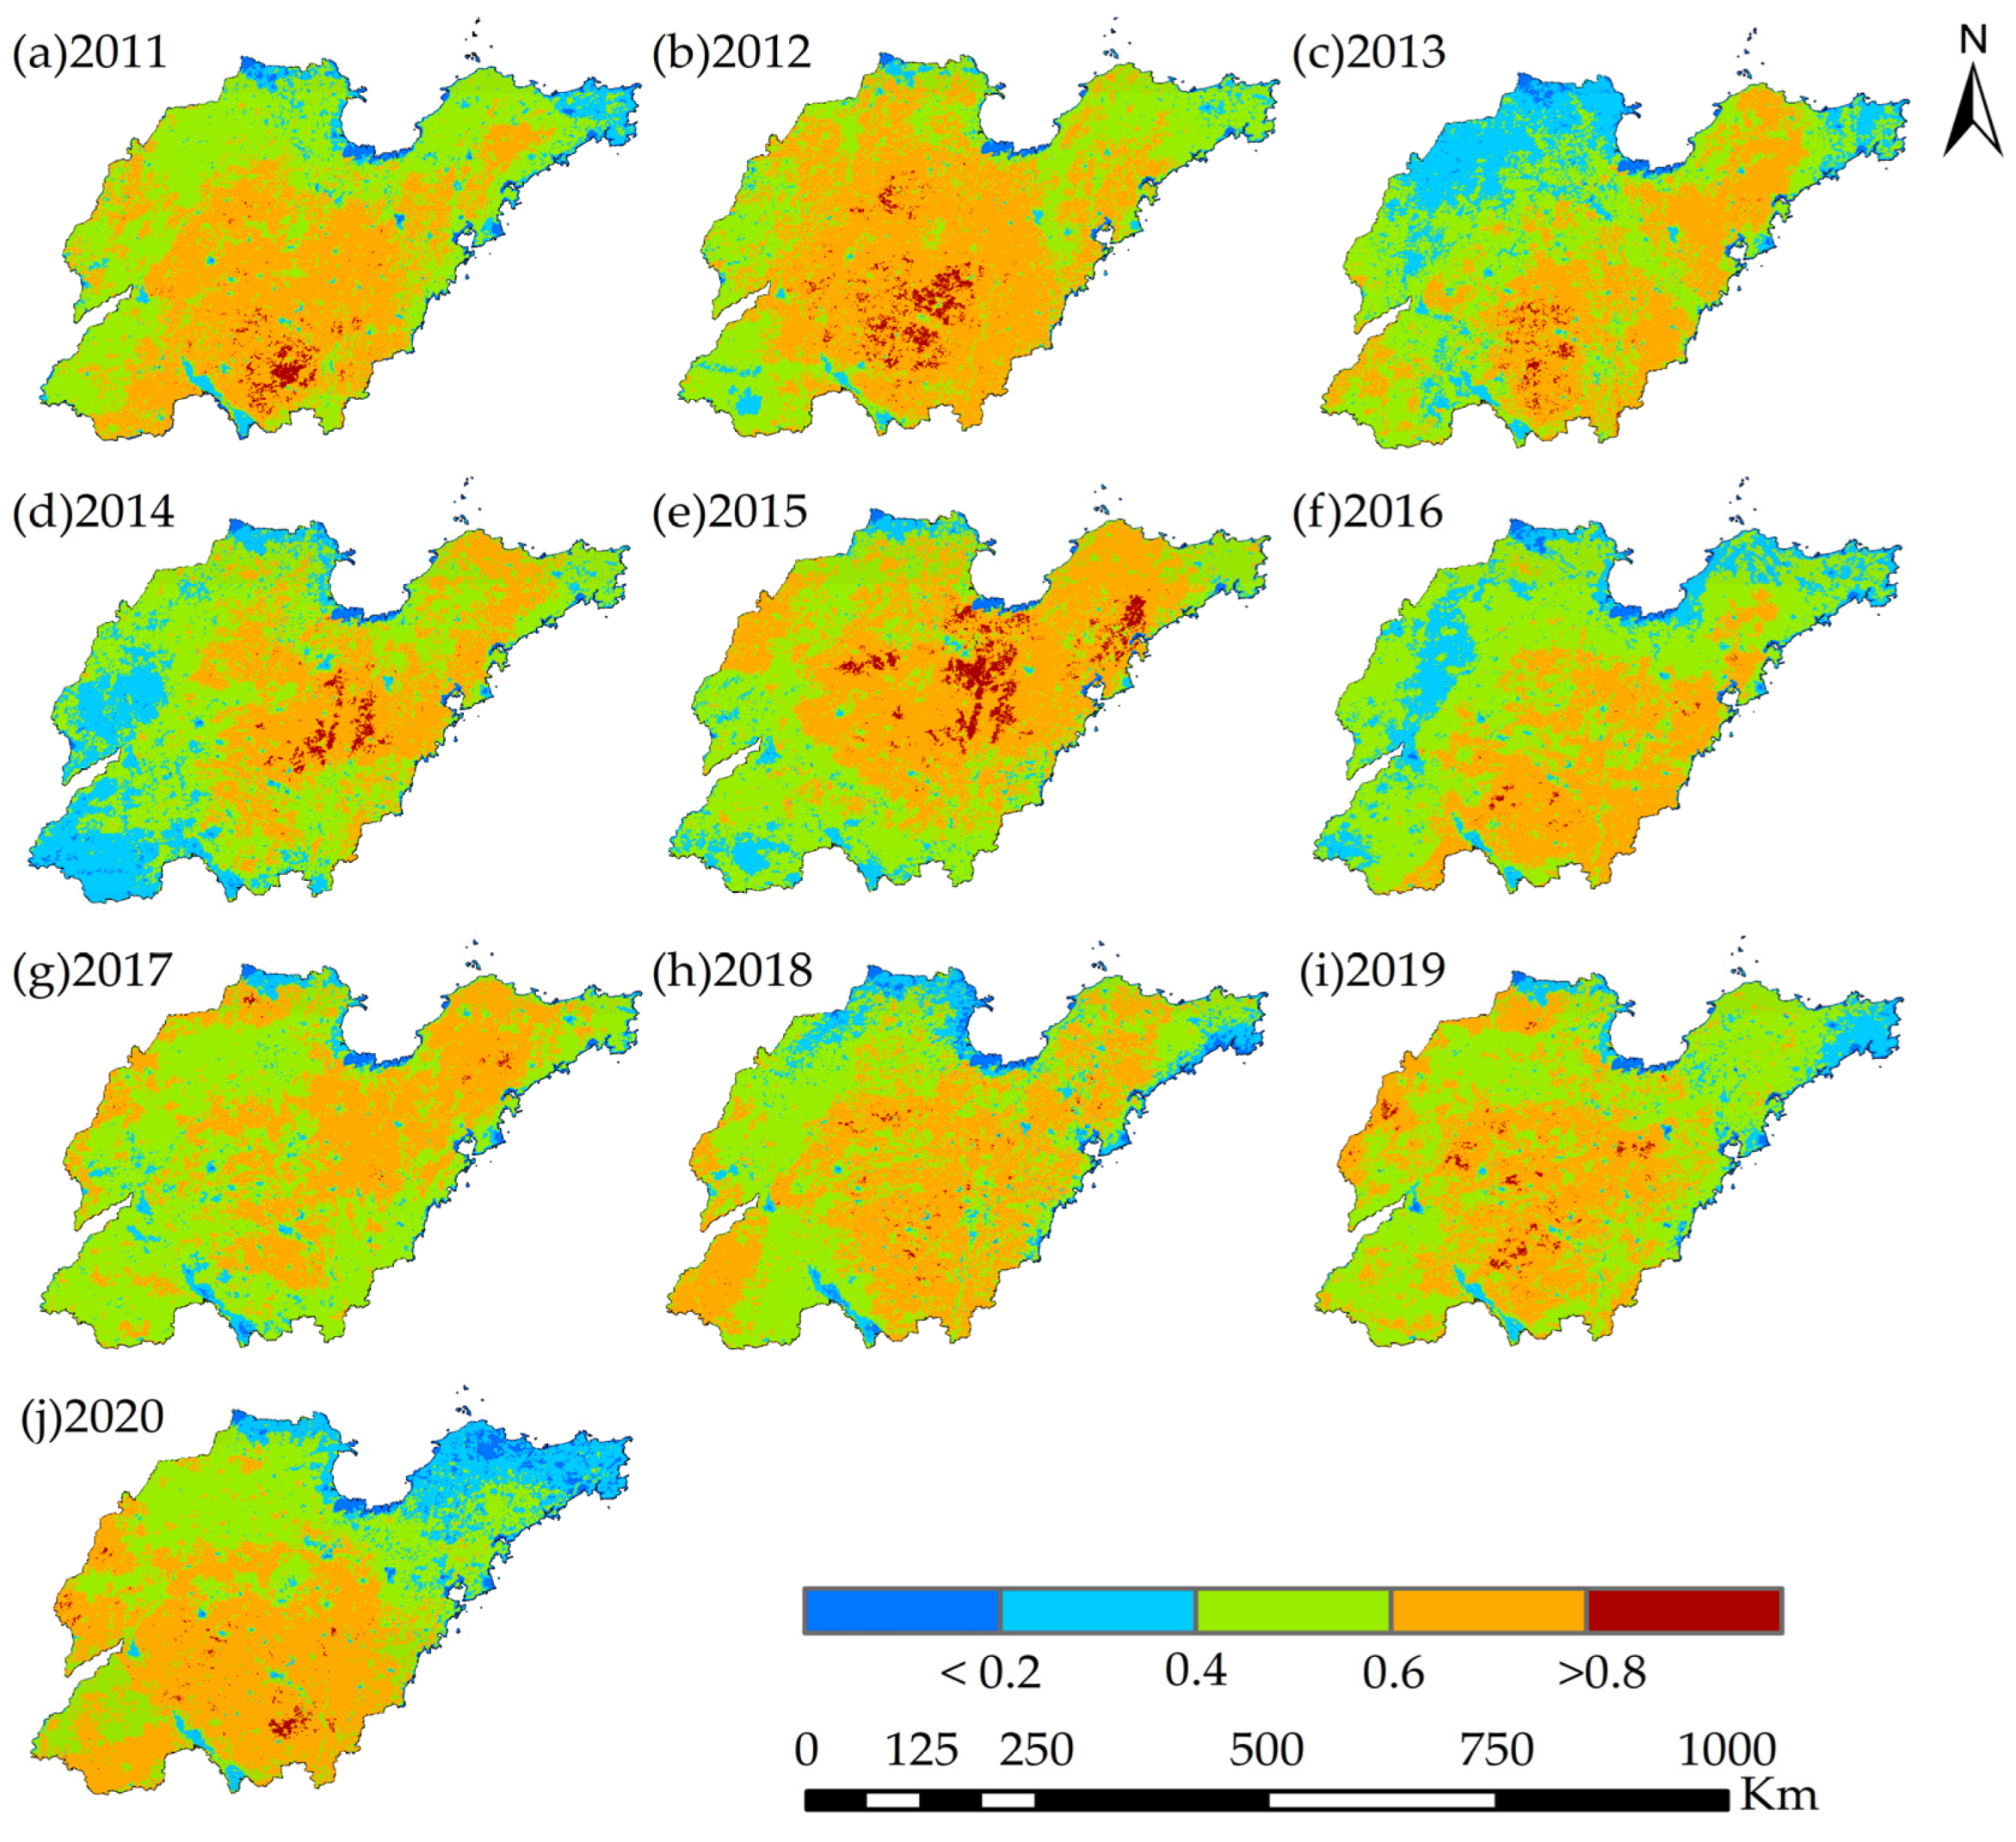
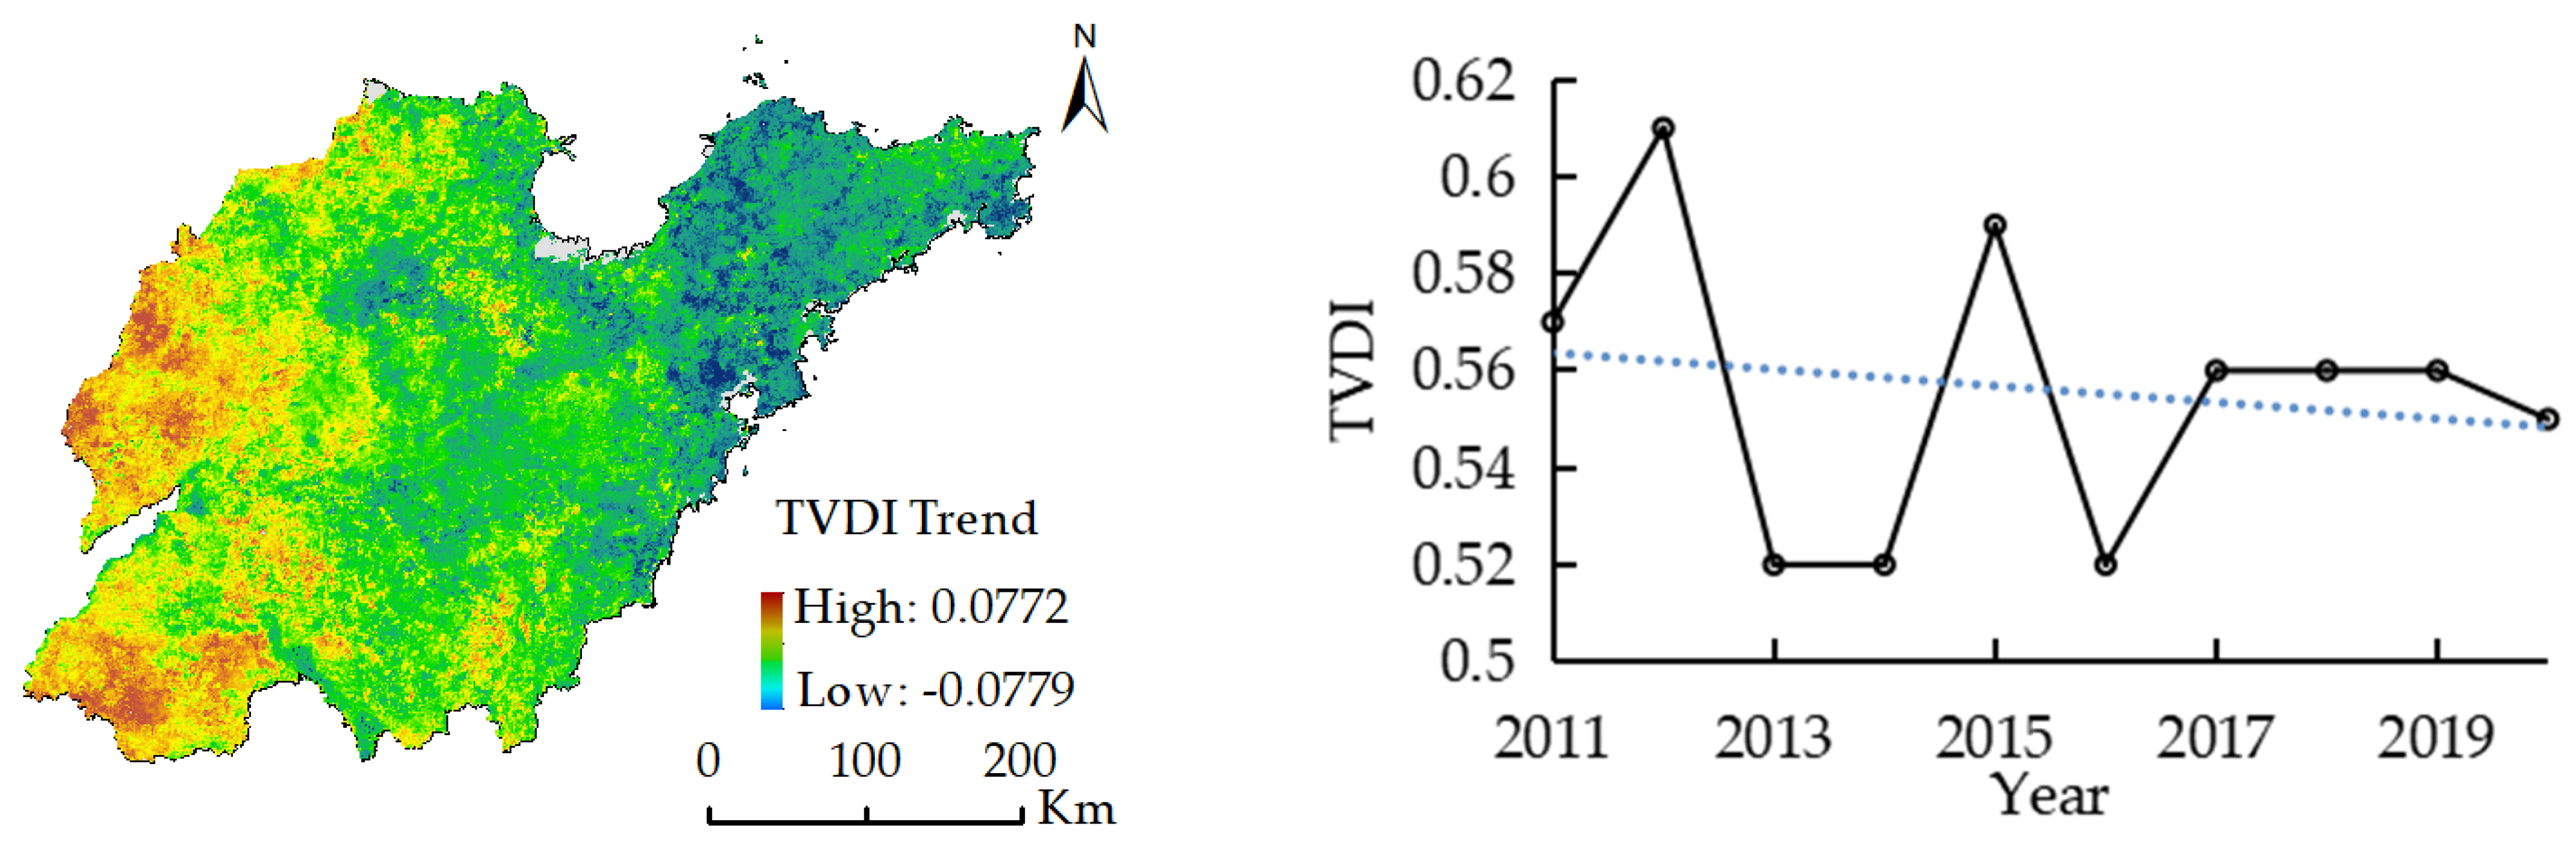
3.5. Spatial–Temporal Evolution of Droughts in Shandong from 2011 to 2020

The spatiotemporal evolution of droughts in spring from 2011 to 2020 (Figure 10) shows that there was a large degree of variation in droughts over space and time. Severe droughts were spatially scattered over the region but were more common in the middle of Shandong Province. Slight and moderate droughts clustered together and covered most of the study area. The temporal evolution of droughts showed that the trend of slight and moderate droughts first increased and then decreased, and, in particular, some areas experienced severe droughts from 2011 to 2015. The finding of moderate droughts during this period means that detrimental impacts may have been had on the agriculture. This finding can provide support for local authorities to avoid the possible impacts of droughts on crop production. To study the overall trend in the TVDI of Shandong Province, the non-parametric Mann–Kendall test method was used to analyze the drought change trend in spring from 2011 to 2020. Generally, the rate of change in the TVDI had obvious spatial heterogeneity (Figure 11). The TVDI value showed an insignificant upward trend (p < 0.05), and the rate of decrease was concentrated at −0.0779/a, accounting for 55.55% of Shandong Province, concentrated in the eastern and central regions of Shandong Province. The areas with an increasing trend are concentrated in parts of the western region, with a decline rate of 0~0.0772/a (Figure 12).
An investigation of the total area of moderate and severe drought in spring in 2011–2020 shows that spring in 2011–2015 experienced moderate and severe drought over large areas. The largest area affected by severe drought was observed in 2015. These results are in agreement with the observations reported by Wang et al. [50], stating that Shandong province experienced droughts from 2014 that lasted until December 2015. Because of an increase in precipitation in 2016, the degree of drought in this year is obviously weakened [51]. These results are reaffirmed by the analyses of rainfall derived from NASA for 2011–2015, showing that the mean regional rainfall over the Shandong Province was only 60% of the normal rainfall estimated from the rain gauge stations over Shandong Province from 2007 to 2010 [52].

4. Conclusions

This study explored the use of daily MODIS NDVI and LST data for drought monitoring in Shandong Province. The data were processed for the year of 2011 using the TVDI triangle method. The comparisons between the results (TVDI) and GLDAS 0–10 cm soil moisture indicated close relationships between the two datasets. Additionally, the CWSI and TVDI were strongly correlated, indicating that the TVDI calculated the temporal and spatial patterns and variations in the drought conditions in Shandong Province using daily data. When using the triangle model to study the extraction of the warm and cold edges via the TVDI in 2011, the results show that there was a certain regularity between the slope and the intercept over time. The slope and intercept of the warm edge, the intercept of the cold edge and the LST showed the characteristics of first increasing and then decreasing in one year, and swung slightly in the same season. In the study of the influencing factors of the TVDI, it was found that the temperature and precipitation had a great influence on the slope and intercept of the warm and cold edges, and the influence of the precipitation on the TVDI had a certain lag; meanwhile, the NDVI only affected the intercept. In the analysis of the different surface types, the frequency of drought in the agricultural land was higher and the degree of drought was more serious, which was consistent with the actual situation in Shandong Province.
In addition, this paper used a non-parametric Mann–Kendall test to analyze the trend in the drought index time series. The results show that the central and eastern region of Shandong Province in the last 10 years experienced severe drought, with an insignificant downward trend of 0.0772/a, and that the eastern region showed an upward trend. In light of the changing trend in the geographical distribution of drought, the relevant departments should create appropriate measures, including water conservation measures and scientific water resource allocation, in order to ensure normal social and economic growth. The results obtained from this study could be important for the scheduling of irrigation and drought warnings.

Author Contributions

L.H. conceived and designed the research ideas; D.Z., G.S., J.F. and X.R. collected the data; Y.G. and L.H. carried out experiments and wrote the manuscript. All authors have read and agreed to the published version of the manuscript.

Funding

This research is supported by the Guangdong Academy of Sciences to build a domestic first-class research institutions special fund project (2019GDASYL-0103003), Natural Science Foundation of Shandong Province (ZR2020MD018 and ZR2020MD015) and National Natural Science.

Informed Consent Statement

This study did not involve humans.

Data Availability Statement

All MODIS datasets were obtained from the NASA website (https://ladsweb.modaps.eosdis.nasa.gov, accessed on 10 January 2023); GLDAS datasets were download from the Goddard Earth Sciences Data and Information Services Center (https://www.earthdata.nasa.gov, accessed on 10 January 2023).

Conflicts of Interest

The authors declare no conflict of interest.

References

  1. Javed, T.; Li, Y.; Rashid, S.; Li, F.; Hu, Q.Y.; Feng, H.; Chen, X.G.; Ahmad, S.; Liu, F.G.; Pulatov, B. Performance and relationship of four different agricultural drought indices for drought monitoring in China’s mainland using remote sensing data. Sci. Total Environ. 2021, 759, 143530. [Google Scholar] [CrossRef]
  2. Sirisena, J.; Augustijn, D.; Nazeer, A.; Bamunawala, J. Use of Remote-Sensing-Based Global Products for Agricultural Drought Assessment in the Narmada Basin, India. Sustainability 2022, 14, 13050. [Google Scholar] [CrossRef]
  3. Chen, L.; Chen, X.; Cheng, L.; Zhou, P.; Liu, Z.Y. Compound hot droughts over China: Identification, risk patterns and variations. Atmos. Res. 2019, 227, 210–219. [Google Scholar] [CrossRef]
  4. Zhao, C.; Brissette, F.; Chen, J.; Martel, J.L. Frequency change of future extreme summer meteorological and hydrological droughts over North America. J. Hydrol. 2020, 584, 124316. [Google Scholar] [CrossRef]
  5. Rahimzadeh-Bajgiran, P.; Berg, A.A.; Champagne, C.; Omasa, K. Estimation of soil moisture using optical/thermal infrared remote sensing in the Canadian Prairies. ISPRS J. Photogramm. Remote Sens. 2013, 83, 94–103. [Google Scholar] [CrossRef]
  6. Jung, H.; Won, J.; Kang, S.; Kim, S. Characterization of the Propagation of Meteorological Drought Using the Copula Model. Water 2022, 14, 3293. [Google Scholar] [CrossRef]
  7. Salvacion, A.R. Mapping meteorological drought hazard in the Philippines using SPI and SPEI. Spat. Inf. Res. 2021, 29, 949–960. [Google Scholar] [CrossRef]
  8. Afshar, M.H.; Al-Yaari, A.; Yilmaz, M.T. Comparative evaluation of microwave L-band VOD and optical NDVI for agriculture drought detection over central Europe. Remote Sens. 2021, 13, 1251. [Google Scholar] [CrossRef]
  9. Guo, N.; Wang, X.P.; Wang, W.; Wang, L.J.; Hu, D.; Sha, S. Drought remote sensing monitoring technology progress. Meteorol. Sci. Technol. Prog. 2020, 10, 10–20. [Google Scholar]
  10. Gerhards, M.; Schlerf, M.; Mallick, K.; Udelhoven, T. Challenges and future perspectives of multi-/Hyperspectral thermal infrared remote sensing for crop water-stress detection: A review. Remote Sens. 2019, 11, 1240. [Google Scholar] [CrossRef] [Green Version]
  11. Refati, D.C.; Silva, J.L.B.; Macedo, R.S.; Lima, R.C.C.; Silva, M.V.; Pandorfi, H.; Silva, P.C.; Oliveira-Júnior, J.F. Influence of drought and anthropogenic pressures on land use and land cover change in the brazilian semiarid region. J. South Am. Earth Sci. 2023, 126, 104362. [Google Scholar] [CrossRef]
  12. Nanzad, L.; Zhang, J.; Tuvdendorj, B.; Nabil, M.; Zhang, S.; Bai, Y. NDVI anomaly for drought monitoring and its correlation with climate factors over Mongolia from 2000 to 2016. J. Arid. Environ. 2019, 164, 69–77. [Google Scholar] [CrossRef]
  13. Lei, T.J.; Li, S.C.; Li, X.H.; Feng, J.; Lu, J.X.; Qu, W. Research progress on drought remote sensing monitoring indicators. Water Conserv. Hydropower Technol. 2019, 50, 25–31. [Google Scholar]
  14. Wang, Z.K.; Guo, J.; Ling, H.B.; Han, F.F.; Kong, Z.J.; Wang, W.Q. Function zoning based on spatial and temporal changes in quantity and quality of ecosystem services under enhanced management of water resources in arid basin. Ecol. Indic. 2022, 137, 108725. [Google Scholar] [CrossRef]
  15. Ali, S.; Basit, A.; Makanda, T.A.; Inamullah; Khan, F.U.; Sajid, M.; Riaz, T.; Abbasi, H.F.; Manzoor; Sohail, A. Improving drought mitigation strategies and disaster risk reduction through MODIS and TRMM-based data in relation to climate change over Pakistan. Environ. Sci. Pollut. Res. Int. 2023, 30, 40563–40575. [Google Scholar] [CrossRef] [PubMed]
  16. Ma, Z.C.; Sun, P.; Zhang, Q.; Hu, Y.Q.; Jiang, W. Characterization and evaluation of MODIS-derived crop water stress index (CWSI) for monitoring drought from 2001 to 2017 over Inner Mongolia. Sustainability 2021, 13, 916. [Google Scholar] [CrossRef]
  17. West, H.; Quinn, N.; Horswell, M. Remote sensing for drought monitoring & impact assessment: Progress, past challenges and future opportunities. Remote Sens. Environ. 2019, 232, 111291. [Google Scholar]
  18. Nemani, R.; Pierce, L.; Running, S.; Goward, S. Developing satellite-derived estimates of surface moisture status. J. Appl. Meteorol. Climatol. 1993, 32, 548–557. [Google Scholar] [CrossRef]
  19. Goetz, S.J. Multi-sensor analysis of NDVI, surface temperature and biophysical variables at a mixed grassland site. Int. J. Remote Sens. 1997, 18, 71–94. [Google Scholar] [CrossRef]
  20. Zhou, X.; Wang, P.; Tansey, K.; Zhang, S.; Wang, L. Developing a fused vegetation temperature condition index for drought monitoring at field scales using Sentinel-2 and MODIS imagery. Comput. Electron. Agric. 2020, 168, 105144. [Google Scholar] [CrossRef]
  21. Carlson, T.N.; Perry, E.M.; Schmugge, T.J. Remote estimation of soil moisture availability and fractional vegetation cover for agricultural fields. Agric. For. Meteorol. 1990, 52, 45–69. [Google Scholar] [CrossRef]
  22. PRiCE, J.C. Using spatial context in satellite data to infer regional scale evapotranspiration. IEEE Trans. Geosci. Remote Sens. 1990, 28, 940–948. [Google Scholar] [CrossRef] [Green Version]
  23. Sandholt, I.; Rasmussen, K.; Andersen, J. A simple interpretation of the surface temperature/vegetation index space for assessment of surface moisture status. Remote Sens. Environ. 2002, 79, 213–224. [Google Scholar] [CrossRef]
  24. Tang, R.; Li, Z.L.; Tang, B. An application of the Ts–VI triangle method with enhanced edges determination for evapotranspiration estimation from MODIS data in arid and semi-arid regions: Implementation and validation. Remote Sens. Environ. 2010, 114, 540–551. [Google Scholar] [CrossRef]
  25. Liang, L.; Zhao, S.; Qin, Z.; Xun, H.K.; Chen, C.; Luo, Y.X.; Zhou, X.D. Drought change trend using MODIS TVDI and its relationship with climate factors in China from 2001 to 2010. J. Integr. Agric. 2014, 13, 1501–1508. [Google Scholar] [CrossRef]
  26. Liu, L.; Liang, L.; Schwartz, M.D.; Donnelly, A.; Wang, Z.S.; Schaaf, C.B.; Liu, L.Y. Evaluating the potential of MODIS satellite data to track temporal dynamics of autumn phenology in a temperate mixed forest. Remote Sens. Environ. 2015, 160, 156–165. [Google Scholar] [CrossRef]
  27. Liu, Y.; Yue, H. The temperature vegetation dryness index (TVDI) based on Bi-parabolic NDVI-Ts space and gradient-based structural similarity (GSSIM) for long-term drought assessment across Shaanxi province, China (2000–2016). Remote Sens. 2018, 10, 959. [Google Scholar] [CrossRef] [Green Version]
  28. Wan, W.; Han, Y.; Wu, H.; Liu, F.; Liu, Z. Application of the source–sink landscape method in the evaluation of agricultural non-point source pollution: First estimation of an orchard-dominated area in China. Agric. Water Manag. 2021, 252, 106910. [Google Scholar] [CrossRef]
  29. Bian, Z.; Roujean, J.L.; Fan, T.Y.; Dong, Y.D.; Hu, T.; Cao, B.; Li, H.; Du, Y.M.; Xiao, Q.L.; Liu, Q.H. An angular normalization method for temperature vegetation dryness index (TVDI) in monitoring agricultural drought. Remote Sens. Environ. 2023, 284, 113330. [Google Scholar] [CrossRef]
  30. Ehrlich, D.; Lambin, E.F. Broad scale land-cover classification and interannual climatic variability. Int. J. Remote Sens. 1996, 17, 845–862. [Google Scholar] [CrossRef]
  31. Jia, K.; Liang, S.; Wei, X.Q.; Yao, Y.J.; Su, Y.R.; Jiang, B.; Wang, X.X. Land cover classification of Landsat data with phenological features extracted from time series MODIS NDVI data. Remote Sens. 2014, 6, 11518–11532. [Google Scholar] [CrossRef] [Green Version]
  32. Jiang, H.H. Variation characteristics and correlation analysis of drought disasters in Shandong Province. Disasterology 2000, 15, 51–55. [Google Scholar]
  33. Ahmad, M.M.; Yaseen, M.; Saqib, S.E. Climate change impacts of drought on the livelihood of dry land smallholders: Implications of adaptation challenges. Int. J. Disaster Risk Reduct. 2022, 80, 103210. [Google Scholar] [CrossRef]
  34. Jiang, M.Y.; Xue, X.P.; Zhang, L.J.; Chen, Y.Y.; Zhao, C.; Song, H.Y.; Wang, N. Peanut Drought Risk Zoning in Shandong Province, China. Sustainability 2022, 14, 3322. [Google Scholar] [CrossRef]
  35. Tucker, C. Red and photographic infrared linear combinations for monitoring vegetation. Remote Sens. Environ. 1979, 8, 127–150. [Google Scholar] [CrossRef] [Green Version]
  36. Chen, H.M.; Zhao, Y.; Fu, X.; Tang, M.F.; Guo, M.J.; Zhang, S.Q.; Zhu, Y.; Qu, L.Y.; Wu, G. Impacts of regional land-use patterns on ecosystem services in the typical agro-pastoral ecotone of northern China. Ecosyst. Health Sustain. 2022, 8, 2110521. [Google Scholar] [CrossRef]
  37. Kumar, V.; Sharma, A.; Bhardwaj, R.; Thukral, A.K. Comparison of different reflectance indices for vegetation analysis using Landsat-TM data. Remote Sens. Appl. Soc. Environ. 2018, 12, 70–77. [Google Scholar] [CrossRef]
  38. Szabó, S.; Elemér, L.; Kovács, Z.; Püspöki, Z.; Kertész, Á.; Singh, S.K.; Balázs, B. NDVI dynamics as reflected in climatic variables: Spatial and temporal trends—A case study of Hungary. GIScience Remote Sens. 2019, 56, 624–644. [Google Scholar] [CrossRef]
  39. Idso, S.B.; Jackson, R.D.; Pinter Jr, P.J.; Reginato, R.J.; Hatfield, J.L. Normalizing the stress-degree-day parameter for environmental variability. Agric. Meteorol. 1981, 24, 45–55. [Google Scholar] [CrossRef]
  40. Hu, X.; Ren, H.; Tansey, K.; Zheng, Y.T.; Ghent, D.; Liu, X.F.; Yan, Y. Agricultural drought monitoring using European Space Agency Sentinel 3A land surface temperature and normalized difference vegetation index imageries. Agric. For. Meteorol. 2019, 279, 107707. [Google Scholar] [CrossRef]
  41. Kwon, Y.J.; Ryu, S.; Cho, J.; Lee, Y.W.; Park, N.W.; Chung, C.Y.; Hong, S. Infrared Soil Moisture Retrieval Algorithm Using Temperature-Vegetation Dryness Index and Moderate Resolution Imaging Spectroradiometer Data. Asia-Pac. J. Atmos. Sci. 2020, 56, 275–289. [Google Scholar] [CrossRef]
  42. Ryu, S.; Kwon, Y.J.; Kim, G.; Hong, S. Temperature vegetation dryness index-based soil moisture retrieval algorithm developed for Geo-KOMPSAT-2A. Remote Sens. 2021, 13, 2990. [Google Scholar] [CrossRef]
  43. Chen, C.F.; Son, N.T.; Chang, L.Y.; Chen, C.C. Monitoring of soil moisture variability in relation to rice cropping systems in the Vietnamese Mekong Delta using MODIS data. Appl. Geogr. 2011, 31, 463–475. [Google Scholar] [CrossRef]
  44. Son, N.T.; Chen, C.F.; Chen, C.R.; Chang, L.Y.; Minh, V.Q. Monitoring agricultural drought in the Lower Mekong Basin using MODIS NDVI and land surface temperature data. Int. J. Appl. Earth Obs. Geoinf. 2012, 18, 417–427. [Google Scholar] [CrossRef]
  45. Ji, Z.; Pan, Y.; Li, N. Integrating the temperature vegetation dryness index and meteorology parameters to dynamically predict crop yield with fixed date intervals using an integral regression model. Ecol. Model. 2021, 455, 109651. [Google Scholar] [CrossRef]
  46. Shashikant, V.; Mohamed Shariff, A.R.; Wayayok, A.; Kamal, M.R.; Lee, Y.P.; Takeuchi, W. Utilizing TVDI and NDWI to classify severity of agricultural drought in Chuping, Malaysia. Agronomy 2021, 11, 1243. [Google Scholar] [CrossRef]
  47. Liu, Y.; Yue, H.; Li, Y.; Lu, Y. Remote Sensing Monitoring of Spring Drought in Henan Province Based on MODIS. Agric. Res. Arid. Areas 2018, 36, 218–223. [Google Scholar]
  48. Li, C.; Adu, B.; Wu, J.; Qin, G.X.; Li, H.H.; Han, Y.D. Spatial and temporal variations of drought in Sichuan Province from 2001 to 2020 based on modified temperature vegetation dryness index (TVDI). Ecol. Indic. 2022, 139, 108883. [Google Scholar] [CrossRef]
  49. Zhao, J.P. Drought Analysis of Hunan Province Based on Temperature Vegetation Drought Index. Master’s Thesis, Hunan Normal University, Changsha, China, 2018. [Google Scholar]
  50. Wang, Z.D.; Guo, P.; Wan, H.; Yang, G. Drought monitoring and analysis of Shandong Province from 2014 to 2016 based on MODIS data. Soil Water Conserv. Res. 2019, 26, 330–336. [Google Scholar]
  51. Zhang, F.; Zhang, L.W.; Shi, J.J.; Huang, J.F. Soil moisture monitoring based on land surface temperature-vegetation index space derived from MODIS data. Pedosphere 2014, 24, 450–460. [Google Scholar] [CrossRef]
  52. Du, L.T.; Tian, Q.J.; Wang, L.; Huang, Y.; Nan, L. Construction of comprehensive drought monitoring model based on multi-source remote sensing data. J. Agric. Eng. 2014, 30, 126–132. [Google Scholar]
Figure 1. (a) The geographical position of Shandong Province; (b) a map of the types of vegetation; and (c) a topographical map and the distribution of the meteorological stations in Shandong Province.
Sustainability 15 11350 g001
Figure 2. The conceptual representation of the scatter plot between the LST and NDVI under different vegetation and moisture conditions [23].
Sustainability 15 11350 g002
Figure 3. NDVI–LST scatter plots of DOYs in 2011 (30 pictures), the blue dotted line is the predicted regression line.
Sustainability 15 11350 g003aSustainability 15 11350 g003bSustainability 15 11350 g003c
Figure 4. Temporal evolution of the slope (a) and intercept (b) of the warm edge; the slope (c) and intercept (d) of the cold edge; and the maximum LST (e) and minimum LST (f). The black dotted line is the average value of each data.
Sustainability 15 11350 g004aSustainability 15 11350 g004b
Figure 5. Temporal evolution of the slope (a) and intercept (b) of the warm and cold edges, calculated using 8-day synthesized data.
Sustainability 15 11350 g005
Figure 6. Relationship between the TVDI and precipitation data collected at (a) Feixian, (b) Weifang, (c) Qingdao and (d) Huimin rain gauge stations throughout the Shandong Province in 2011.
Sustainability 15 11350 g006
Figure 7. The statistics of the TVDI under different land surface covers (agricultural land (I), forest (II), grassland (III), construction land (IV) and other unused land (V)).
Sustainability 15 11350 g007
Figure 8. Correlation curves between the different factors (temperature, NDVI and precipitation) and the slope and intercept of the warm and cold edges based on the daily datasets of Shandong Province in 2011. Significance test passed at p < 0.05. (I) The correlation curves of the warm edge slope; (II) the correlation curves of the cold edge slope; (III) the correlation curves of the warm edge intercept; and (IV) the correlation curves of the cold edge intercept. (a) Relationship between temperature and the slope of warm and cold edges; (b) Relationship between temperature and the intercept of warm and cold edges; (c) Relationship between the NDVI and the slope of warm and cold edges; (d) Relationship between the NDVI and the intercept of warm and cold edges; (e) Relationship between precipitation and the slope of warm and cold edges; (f) Relationship between precipitation and the intercept of warm and cold edges.
Sustainability 15 11350 g008
Figure 9. Correlation analysis results of the TVDI and CWSI with soil moisture at a depth of 10 cm in each month in 2011. (I) The relationships of the GLDAS soil moisture with the observed TVDI; and (II) the relationships of the GLDAS soil moisture with the CWSI.
Sustainability 15 11350 g009aSustainability 15 11350 g009b
Figure 10. Spatial distribution of the TVDI in Shandong Province.
Sustainability 15 11350 g010
Figure 11. Trend analysis and time series curve of the TVDI. The black line indicates the average change of TVDI from 2011 to 2020, the blue dotted line indicates the change trend of TVDI mean value from 2011 to 2020.
Sustainability 15 11350 g011
Figure 12. The trend analysis of the TVDI in spring with a significant p = 0.05 level.
Sustainability 15 11350 g012
Table 1. Intensity of drought based on the TVDI and CWSI [30].
Drought LevelSoil Moisture StatusTVDICWSI
WetnessSurface moist(0, 0.2](0, 0.4]
NormalNormal soil moisture or near-surface dry air(0.2, 0.4](0.4, 0.6]
Slight droughtSoil surface dry, dry yellow leaves(0.4, 0.6](0.6, 0.7]
Moderate droughtDry soil layer in soil, dry yellow leaves(0.6, 0.8](0.7, 0.8]
Severe droughtExtremely dry soil layer in soil, dry yellow leaves(0.8, 1](0.8, 1.0]
Disclaimer/Publisher’s Note: The statements, opinions and data contained in all publications are solely those of the individual author(s) and contributor(s) and not of MDPI and/or the editor(s). MDPI and/or the editor(s) disclaim responsibility for any injury to people or property resulting from any ideas, methods, instructions or products referred to in the content.

