
Land Use Optimization and Carbon Storage Estimation in the Yellow River Basin, China


Abstract
1. Introduction
2. Materials
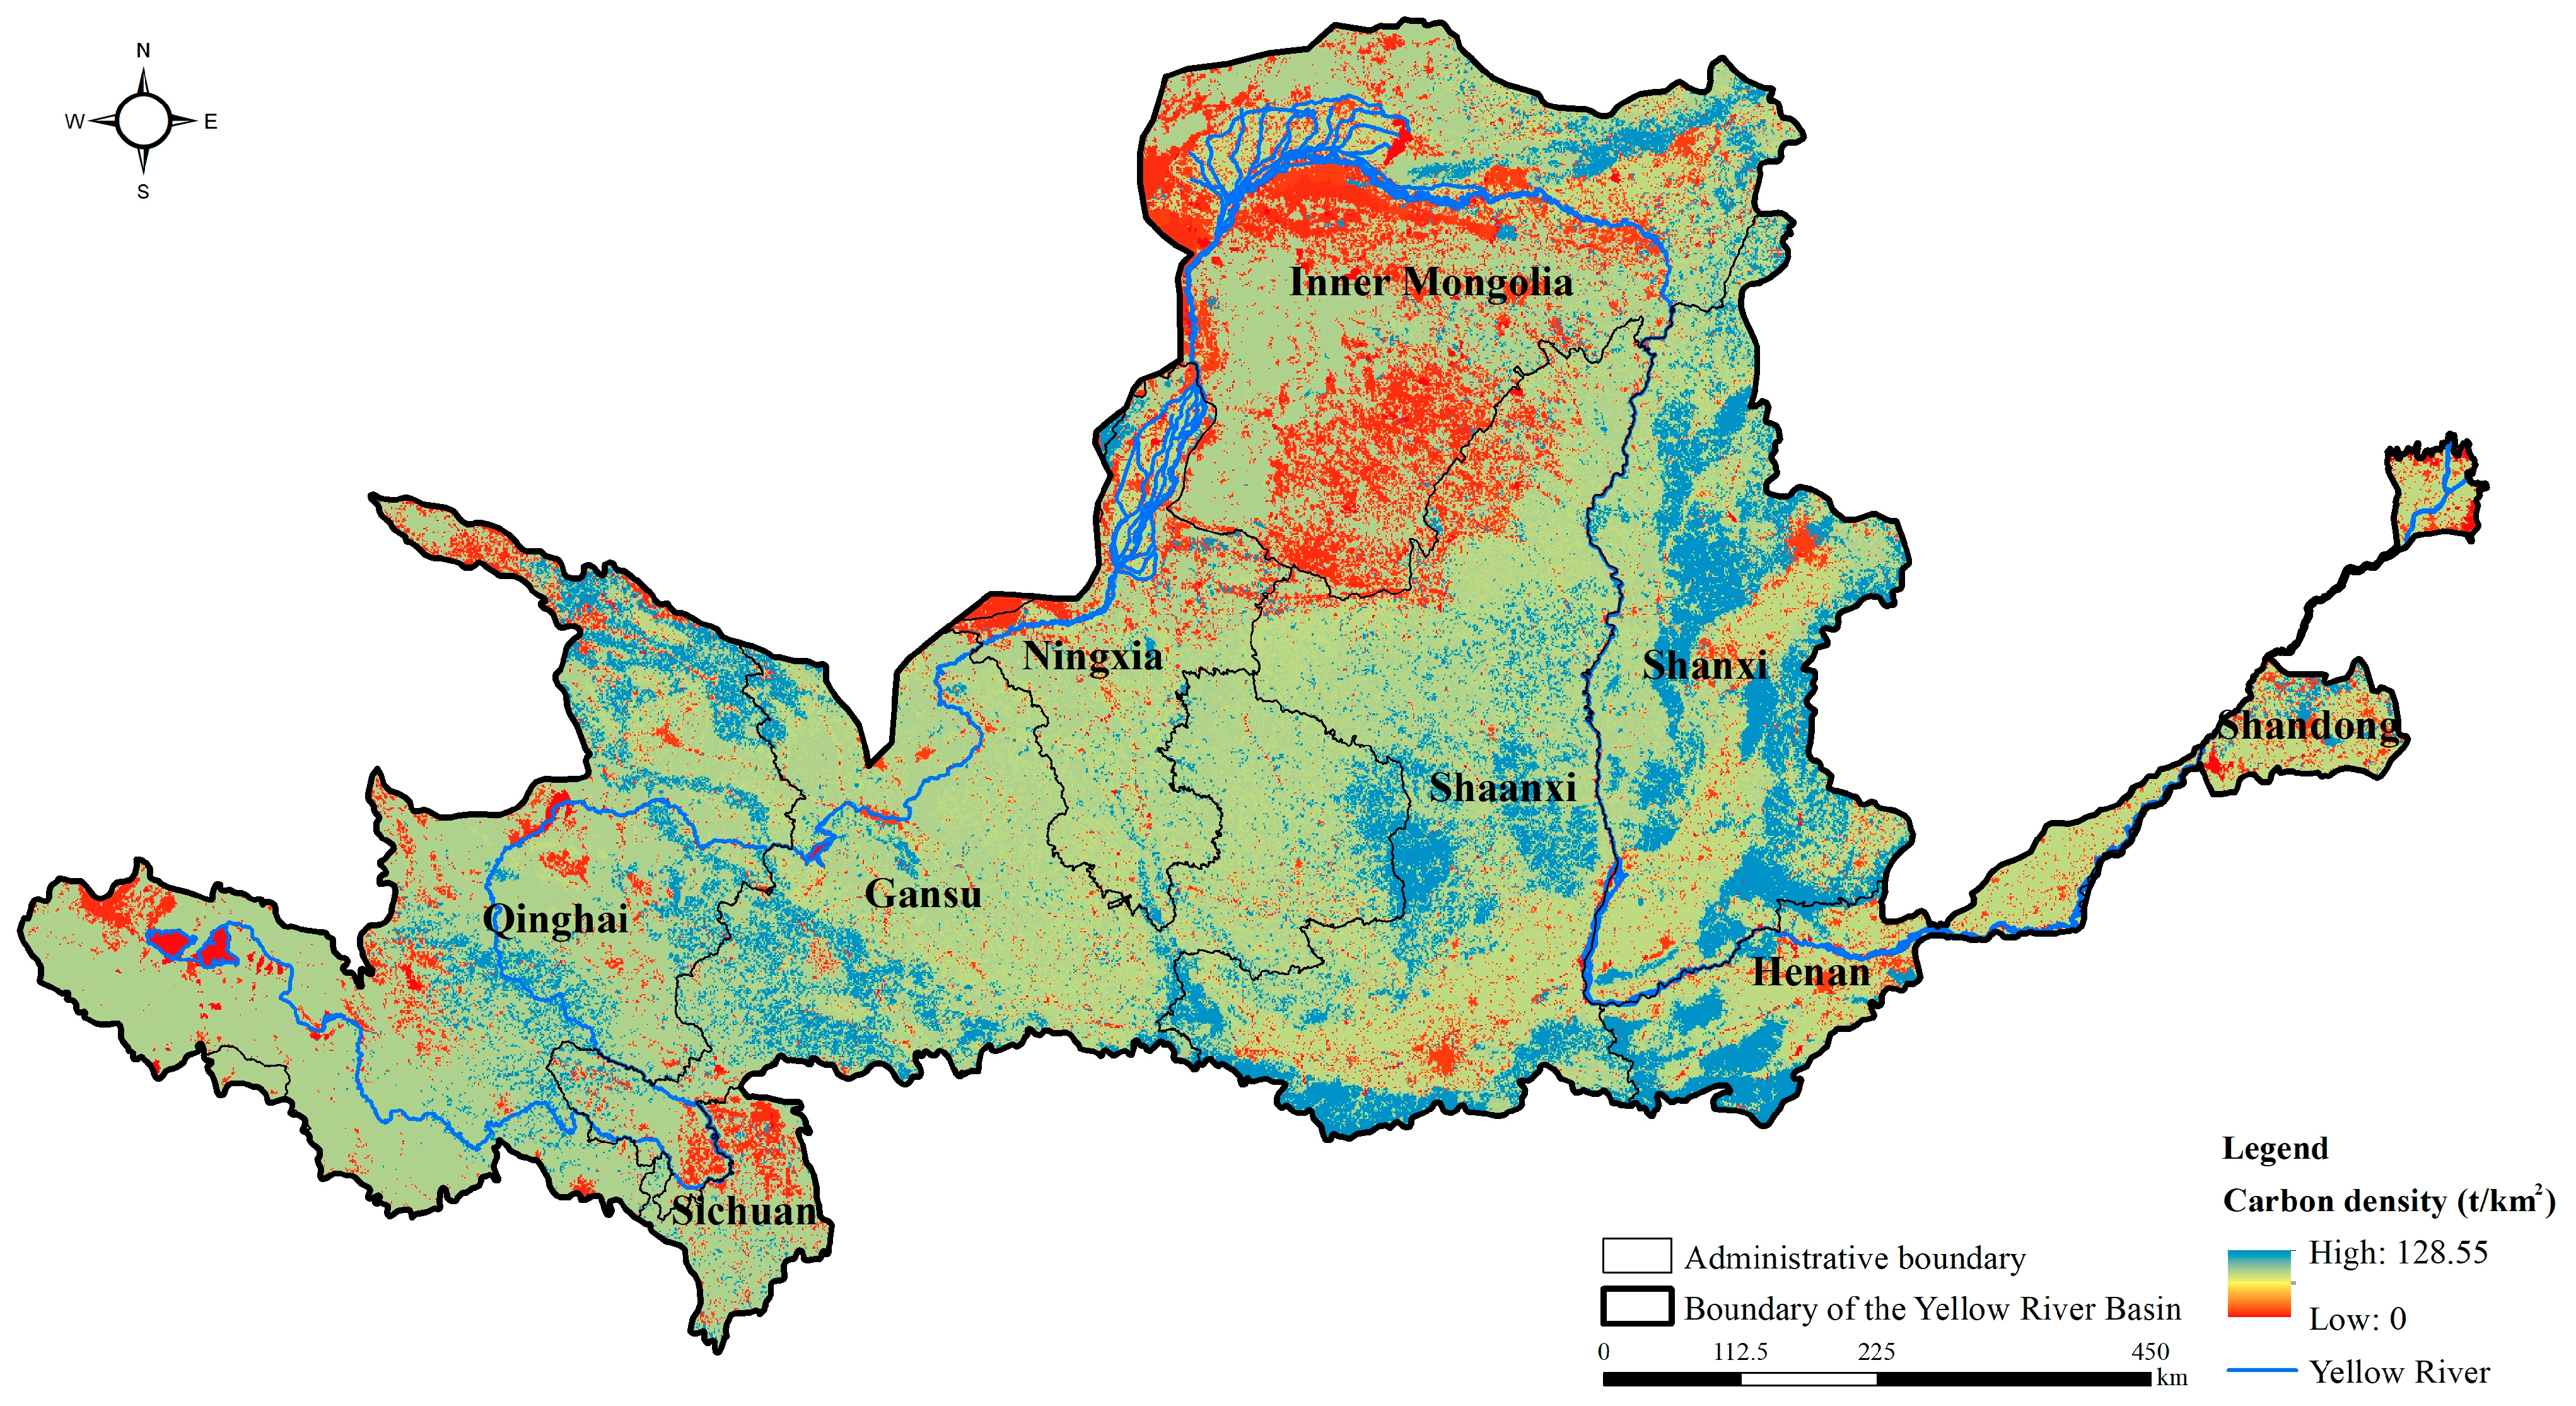
2.1. Study Area
2.2. Materials
3. Methods
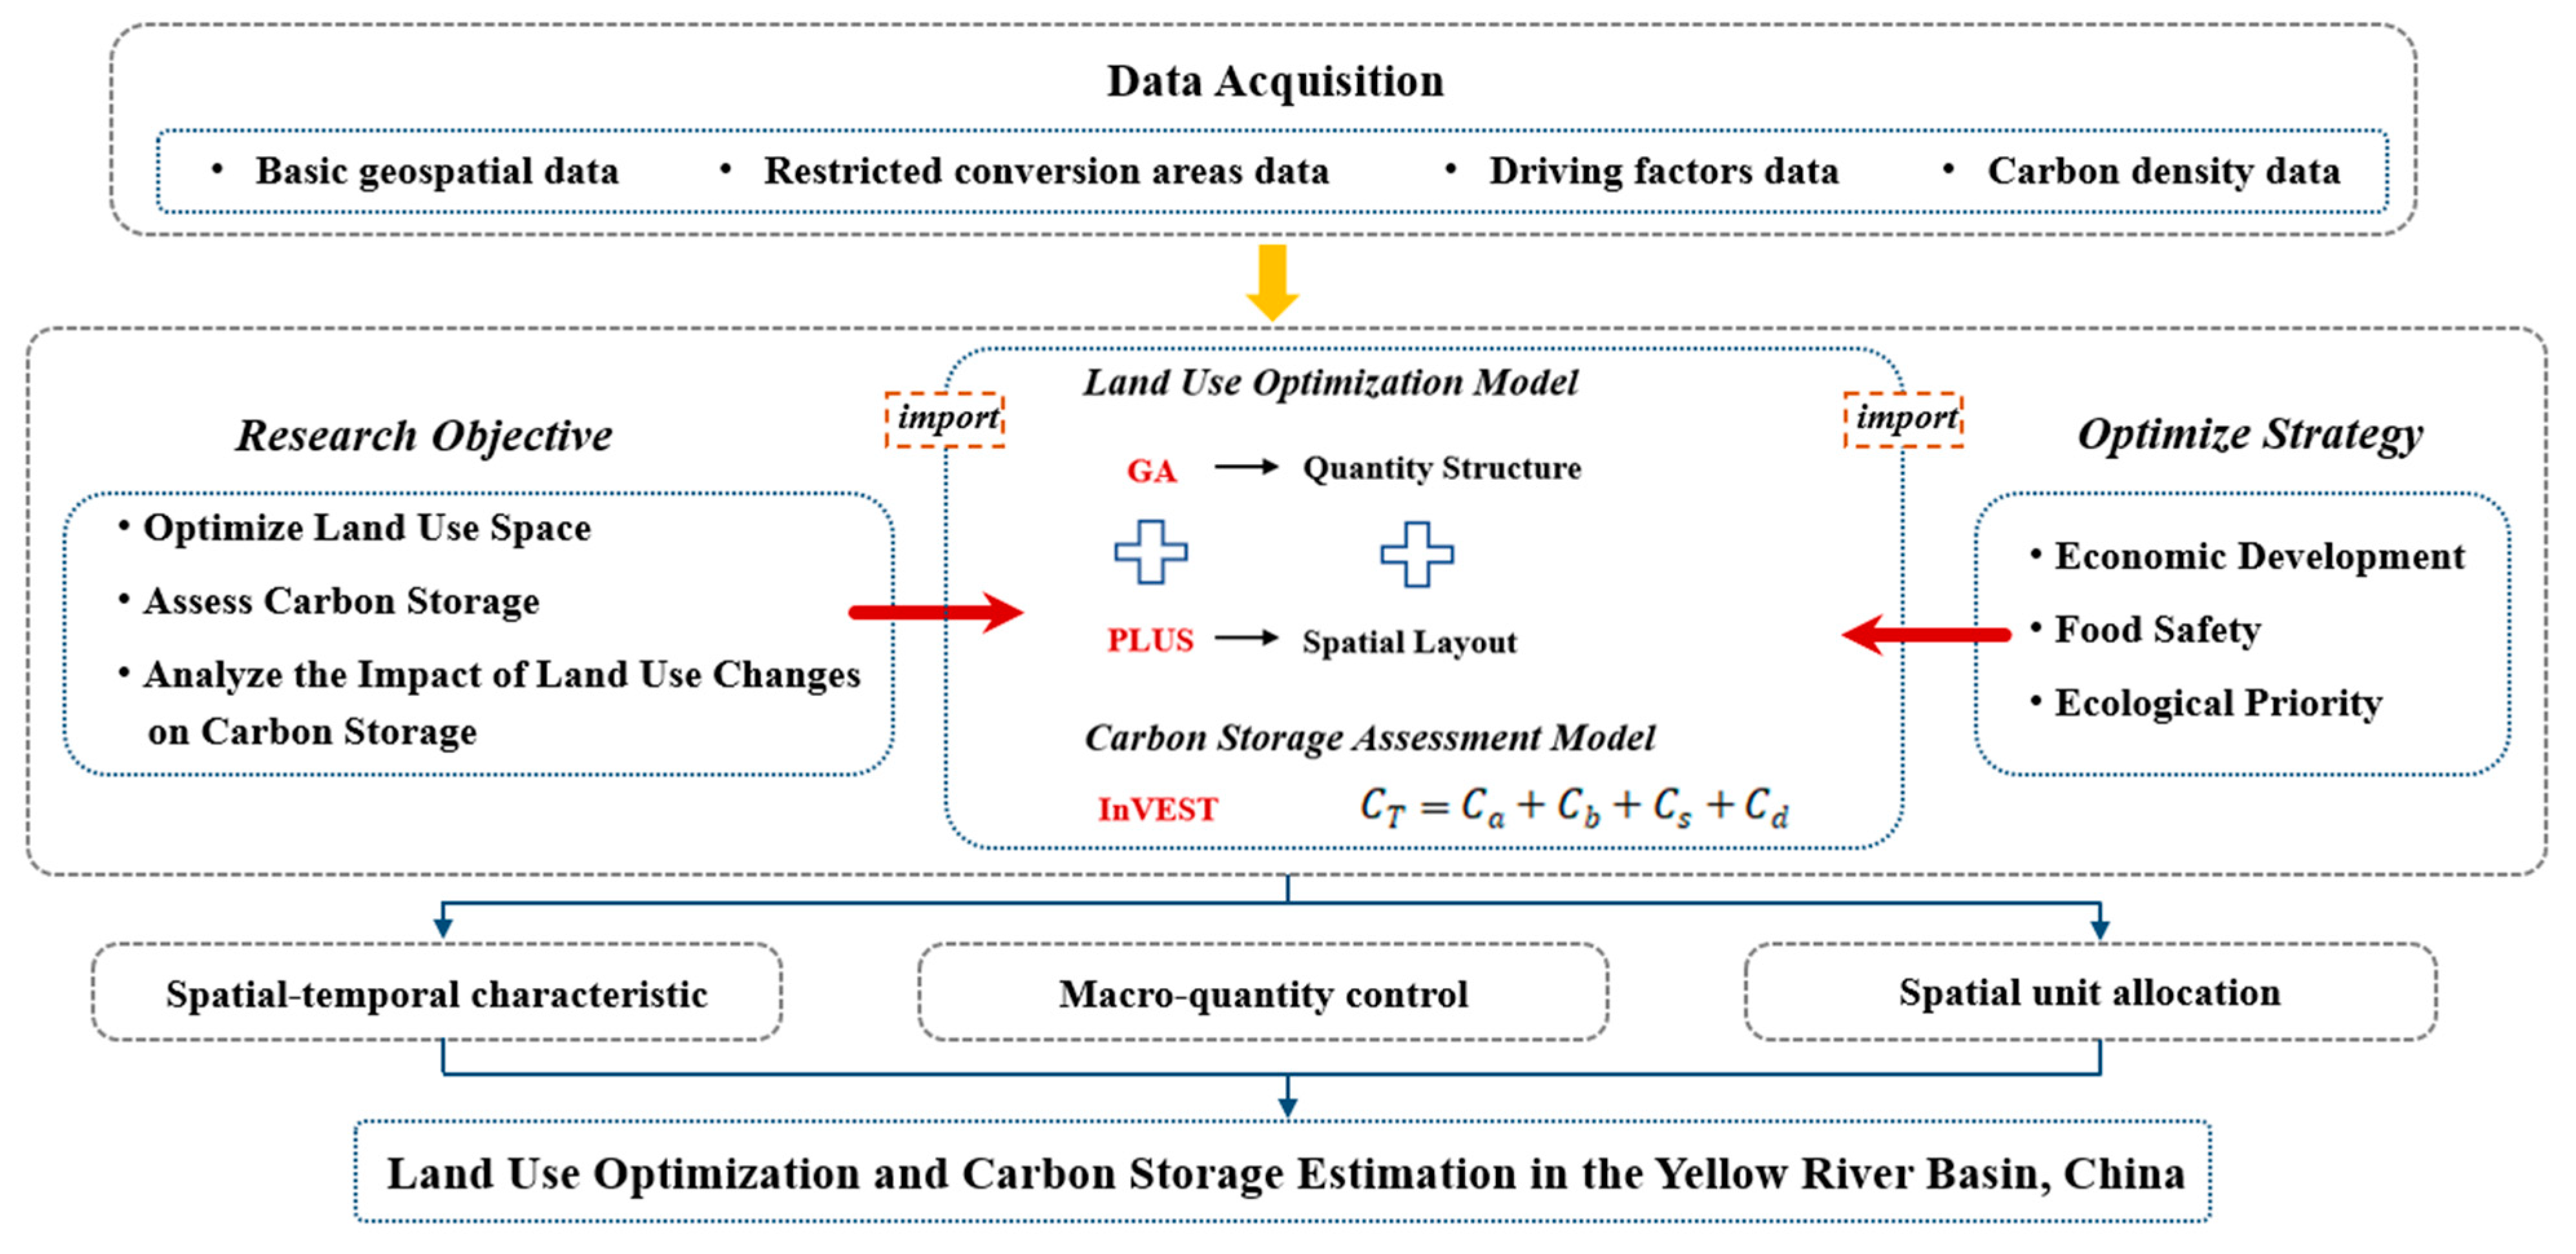
3.1. Research Procedures
3.2. Genetic Algorithms (GA)
3.3. Patch-Generating Land Use Simulation (PLUS) Model
3.3.1. Model Principles
3.3.2. Parameter Settings
- (1)
- Drive factor selection
- (2)
- LEAS parameter settings
- (3)
- CARS parameter setting
3.4. The InVEST Model
4. Results
4.1. Analysis of the Evolutionary Characteristics of LULC
4.2. Analysis of LULC Optimization Results
4.3. Analysis of the Spatiotemporal Evolution of Carbon Storage
5. Discussion
5.1. Discussion of the Main Results
5.2. The Relationship between Carbon Storage and LULC Changes
5.3. Limitations
6. Conclusions
Author Contributions
Funding
Institutional Review Board Statement
Informed Consent Statement
Data Availability Statement
Acknowledgments
Conflicts of Interest
References
- Vadrevu, K.; Ohara, T.; Justice, C. Land cover, land use changes and air pollution in Asia: A synthesis. Environ. Res. Lett. 2017, 12, 120201. [Google Scholar] [CrossRef] [PubMed]
- Naz, A.; Chowdhury, A.; Chandra, R.; Mishra, B.K. Potential human health hazard due to bioavailable heavy metal exposure via consumption of plants with ethnobotanical usage at the largest chromite mine of India. Environ. Geochem. Health 2020, 42, 4213–4231. [Google Scholar] [CrossRef] [PubMed]
- Zhu, Z.; Wang, G.; Dong, J. Correlation Analysis between Land Use/Cover Change and Air Pollutants—A Case Study in Wuyishan City. Energies 2019, 12, 2545. [Google Scholar] [CrossRef]
- Ito, A.; Nishina, K.; Noda, H.M. Impacts of future climate change on the carbon budget of northern high-latitude terrestrial ecosystems: An analysis using ISI-MIP data. Polar Sci. 2016, 10, 346–355. [Google Scholar] [CrossRef]
- Tang, X.; Zhao, X.; Bai, Y.; Tang, Z.; Wang, W.; Zhao, Y.; Wan, H.; Xie, Z.; Shi, X.; Wu, B.; et al. Carbon pools in China’s terrestrial ecosystems: New estimates based on an intensive field survey. Proc. Natl. Acad. Sci. USA 2018, 115, 4021–4026. [Google Scholar] [CrossRef]
- Zhu, G.; Qiu, D.; Zhang, Z.; Sang, L.; Liu, Y.; Wang, L.; Zhao, K.; Ma, H.; Xu, Y.; Wan, Q. Land-use changes lead to a decrease in carbon storage in arid region, China. Ecol. Indic. 2021, 127, 107770. [Google Scholar] [CrossRef]
- Lai, L.; Huang, X.; Yang, H.; Chuai, X.; Zhang, M.; Zhong, T.; Chen, Z.; Chen, Y.; Wang, X.; Thompson, J.R. Carbon emissions from land-use change and management in China between 1990 and 2010. Sci. Adv. 2016, 2, e1601063. [Google Scholar] [CrossRef]
- Zhang, D.; Ge, W.; Zhang, Y. Evaluating the vegetation restoration sustainability of ecological projects: A case study of Wuqi County in China. J. Clean. Prod. 2020, 264, 121751. [Google Scholar] [CrossRef]
- Chang, X.; Xing, Y.; Wang, J.; Yang, H.; Gong, W. Effects of land use and cover change (LUCC) on terrestrial carbon stocks in China between 2000 and 2018. Resour. Conserv. Recycl. 2022, 182, 106333. [Google Scholar] [CrossRef]
- Jin, G.; Chen, K.; Wang, P.; Guo, B.; Dong, Y.; Yang, J. Trade-offs in land-use competition and sustainable land development in the North China Plain. Technol. Forecast. Soc. Chang. 2019, 141, 36–46. [Google Scholar] [CrossRef]
- Zhang, L.; Jin, G.; Wan, Q.; Liu, Y.; Wei, X. Measurement of ecological land use/cover change and its varying spatiotemporal driving forces by statistical and survival analysis: A case study of Yingkou City, China. Sustainability 2018, 10, 4567. [Google Scholar] [CrossRef]
- Li, J.; Guo, X.; Chuai, X.; Xie, F.; Yang, F.; Gao, R.; Ji, X. Reexamine China’s terrestrial ecosystem carbon balance under land use-type and climate change. Land Use Policy 2021, 102, 105275. [Google Scholar] [CrossRef]
- Zhao, R.; Huang, X.; Liu, Y.; Zhong, T.; Ding, M.; Chuai, X. Carbon emission of regional land use and its decomposition analysis: Case study of Nanjing City, China. Chin. Geogr. Sci. 2015, 25, 198–212. [Google Scholar] [CrossRef]
- Dong, Z.; Bi, F.; Ji, Y. Current status, problems and suggestions of terrestrial ecosystems carbon sink in China. Sci. Technol. Rev. 2022, 40, 15–24. [Google Scholar]
- Heimann, M.; Reichstein, M. Terrestrial ecosystem carbon dynamics and climate feedbacks. Nature 2008, 451, 7176. [Google Scholar] [CrossRef] [PubMed]
- Lin, Q.; Zhang, L.; Qiu, B.; Zhao, Y.; Wei, C. Spatiotemporal analysis of land use patterns on carbon emissions in China. Land 2021, 10, 141. [Google Scholar] [CrossRef]
- Yang, J.; Li, Y.; Hay, I.; Huang, X. Decoding national new area development in China: Toward new land development and politics. Cities 2019, 87, 114–120. [Google Scholar] [CrossRef]
- Liu, Z.; Deng, Z.; Davis, S.J.; Giron, C.; Ciais, P. Monitoring global carbon emissions in 2021. Nat. Rev. Earth Environ. 2022, 3, 217–219. [Google Scholar] [CrossRef]
- Yang, F.; He, F.; Li, S.; Li, M.; Wu, P. A new estimation of carbon emissions from land use and land cover change in China over the past 300 years. Sci. Total Environ. 2023, 863, 160963. [Google Scholar] [CrossRef]
- Chuai, X.; Huang, X.; Lai, L.; Wang, W.; Peng, J.; Zhao, R. Land use structure optimization based on carbon storage in several regional terrestrial ecosystems across China. Environ. Sci. Policy 2013, 25, 50–61. [Google Scholar] [CrossRef]
- Xi, J. Statement at the General Debate of the 75th Session of the United Nations General Assembly. Gaz. State Counc. People’s Repub. China 2020, 28, 5–7. [Google Scholar]
- National Development and Reform Commission (NDRC). Enhanced Actions on Climate Change: China’s Intended Nationally Determined Contributions. Available online: http://www.china.org.cn/environment/2015-06/30/content_35950951.htm (accessed on 25 May 2023).
- Piao, S.; He, Y.; Wang, X.; Chen, F. Estimation of China’s terrestrial ecosystem carbon sink: Methods, progress and prospects. Sci. China-Earth Sci. 2022, 65, 641–651. [Google Scholar] [CrossRef]
- Foley, J.A.; DeFries, R.; Asner, G.P.; Barford, C.; Bonan, G.; Carpenter, S.R.; Chapin, F.S.; Coe, M.T.; Daily, G.C.; Gibbs, H.K.; et al. Global consequences of land use. Science 2005, 309, 570–574. [Google Scholar] [CrossRef] [PubMed]
- Sun, J.; Zhang, Y.; Qin, W.; Chai, G. Estimation and simulation of forest carbon stock in Northeast China forestry based on future climate change and LUCC. Remote Sens. 2022, 14, 3653. [Google Scholar] [CrossRef]
- Yu, Z.; Lu, C.; Tian, H.; Canadell, J.G. Largely underestimated carbon emission from land use and land cover change in the conterminous United States. Glob. Chang. Biol. 2019, 25, 3741–3752. [Google Scholar] [CrossRef] [PubMed]
- Yu, Z.; Ciais, P.; Piao, S.; Houghton, R.A.; Lu, C.; Tian, H.; Agathokleous, E.; Kattel, G.R.; Sitch, S.; Goll, D.; et al. Forest expansion dominates China’s land carbon sink since 1980. Nat. Commun. 2022, 13, 5374. [Google Scholar] [CrossRef] [PubMed]
- Anindita, S.; Sleutel, S.; Vandenberghe, D.; De Grave, J.; Vandenhende, V.; Finke, P. Land use impacts on weathering, soil properties, and carbon storage in wet Andosols, Indonesia. Geoderman 2022, 423, 115963. [Google Scholar] [CrossRef]
- Li, X.; Fu, J.; Jiang, D.; Lin, G.; Cao, C. Land use optimization in Ningbo City with a coupled GA and PLUS model. J. Clean. Prod. 2022, 375, 134004. [Google Scholar] [CrossRef]
- Liu, C.; Deng, C.; Li, Z.; Liu, Y.; Wang, S. Optimization of Spatial Pattern of Land Use: Progress, Frontiers, and Prospects. Int. J. Environ. Res. Public Health 2022, 19, 5805. [Google Scholar] [CrossRef]
- Michel, O.O.; Yu, Y.; Fan, W.; Lubalega, T.; Chen, C.; Sudi Kaiko, C.K. Impact of land use change on tree diversity and aboveground carbon storage in the Mayombe Tropical Forest of the Democratic Republic of Congo. Land 2022, 11, 787. [Google Scholar] [CrossRef]
- Yang, R.; Chen, H.; Chen, S.; Ye, Y. Spatiotemporal evolution and prediction of land use/land cover changes and ecosystem service variation in the Yellow River Basin, China. Ecol. Indic. 2022, 145, 109579. [Google Scholar] [CrossRef]
- Huang, Y.; Li, X.; Yu, Q.; Huang, H. An analysis of land use change and driving forces in the Yellow River basin from 1995 to 2018. J. Gastroenterol. Hepatol. 2022, 37, 113–121. [Google Scholar]
- Mou, X.; Zhang, X.; Wang, X.; Wang, J.; Rao, S.; HUang, J.; Chai, H. Ecological change assessment and protection strategy in the Yellow River basin. Strateg. Study CAE 2022, 24, 113–121. [Google Scholar] [CrossRef]
- Xu, H.; Shi, N.; Wu, L.; Zhang, D. High-quality development level and its spatiotemporal changes in the Yellow River Basin. Ren. Fail. 2020, 42, 115–126. [Google Scholar] [CrossRef]
- Xi, J. Speech at the symposium on ecological protection and high-quality development in the Yellow River Basin. China Water Resour. 2019, 20, 1–3. [Google Scholar]
- Fu, L.; Chi, Y.; Yu, Y.; Zhang, L.; Liu, S.; Wang, X.; Xu, K.; Wang, J.; Zhang, X. Characteristics and driving forces of land use change in the Yellow River basin from 2000 to 2020. Energy Environ. Sci. 2022, 31, 1927–1938. [Google Scholar] [CrossRef]
- Xi, F.; Wang, R.; Shi, J.; Zhang, J.; Yu, Y.; Wang, N.; Wang, Z. Spatio-temporal pattern and conflict identification of production–living–ecological space in the Yellow River Basin. Land 2022, 11, 744. [Google Scholar] [CrossRef]
- De Reu, J.; Bourgeois, J.; Bats, M.; Zwertvaegher, A.; Gelorini, V.; De Smedt, P.; Chu, W.; Antrop, M.; De Maeyer, P.; Finke, P.; et al. Application of the topographic position index to heterogeneous landscapes. Geomorphology 2013, 186, 39–49. [Google Scholar] [CrossRef]
- Li, S.; Zhou, Q.; Wang, L. Road construction and landscape fragmentation in China. J. Geogr. Sci. 2005, 15, 123–128. [Google Scholar] [CrossRef]
- Xu, L.; He, N.; Yu, G. A dataset of carbon density in Chinese terrestrial ecosystems (2010s). China Sci. Data 2019, 4, 90–96. [Google Scholar]
- Chen, L.; Liu, G.; Li, H. Estimating net primary productivity of terrestrial vegetation in China using remote sensing. J. Remote Sens. 2002, 2, 129–135+164. [Google Scholar]
- Yang, J.; Xie, B.; Zhang, D. Spatio-temporal evolution of carbon stocks in the Yellow River Basin based on InVEST and CA-Markov models. Chin. J. Eco-Agric. 2021, 29, 1018–1029. [Google Scholar] [CrossRef]
- Liang, X.; Guan, Q.; Clarke, K.C.; Liu, S.; Wang, B.; Yao, Y. Understanding the drivers of sustainable land expansion using a patch-generating land use simulation (PLUS) model: A case study in Wuhan, China. Comput. Environ. Urban Syst. 2021, 85, 101569. [Google Scholar] [CrossRef]
- Luo, S.; Hu, X.; Sun, Y.; Yan, C.; Zhang, X. Multi-scenario land use change and its impact on carbon storage based on coupled Plus-Invest model. Chin. J. Eco-Agric. 2023, 31, 300–314. [Google Scholar]
- Sun, X.; Xue, J.; Dong, L. Spatiotemporal change and prediction of carbon storage in Nanjing ecosystem based on PLUS model and In-VEST model. J. Ecol. Rural Environ. 2023, 39, 41–51. [Google Scholar] [CrossRef]
- Thompson, T.M. Modeling the climate and carbon systems to estimate the social cost of carbon. Wiley Interdiscip. Rev. Clim. Chang. 2018, 9, e532. [Google Scholar] [CrossRef]
- Wang, Z.; Li, X.; Mao, Y.; Li, L.; Wang, X.; Lin, Q. Dynamic simulation of land use change and assessment of carbon storage based on climate change scenarios at the city level: A case study of Bortala, China. Ecol. Indic. 2022, 134, 108499. [Google Scholar] [CrossRef]


| Land Use Type | Cultivated Land | Woodland | Grassland | Water Bodies | Construction Land | Unused Land |
|---|---|---|---|---|---|---|
| Cultivated Land | 1 | 0 | 0 | 0 | 0 | 0 |
| Woodland | 1 | 1 | 1 | 0 | 1 | 0 |
| Grassland | 1 | 1 | 1 | 1 | 1 | 0 |
| Water Bodies | 1 | 0 | 0 | 1 | 0 | 0 |
| Construction Land | 0 | 0 | 0 | 0 | 1 | 0 |
| Unused Land | 1 | 1 | 1 | 1 | 1 | 1 |
| Land Use Type | Area of LULC in 2010 (103 km2) | The Proportion of the Area of LULC in 2010 | Area of LULC in 2020 (103 km2) | The Proportion of the Area of LULC in 2020 | Variable Area (103 km2) |
|---|---|---|---|---|---|
| Cultivated Land | 208.64 | 26.14% | 200.59 | 25.13% | −8.05 |
| Woodland | 106.35 | 13.32% | 107.34 | 13.45% | +1.00 |
| Grassland | 377.60 | 47.31% | 382.96 | 47.98% | +5.36 |
| Water Bodies | 13.90 | 1.74% | 15.25 | 1.91% | +1.35 |
| Construction Land | 19.37 | 2.43% | 28.97 | 3.63% | +9.60 |
| Unused Land | 72.35 | 9.06% | 63.09 | 7.90% | −9.26 |
| Land Use Type | Carbon Storage 2010 (106 t) | Proportion (%) | Carbon Storage 2010 (106 t) | Proportion (%) | Carbon Storage 2010 (106 t) | Proportion (%) | 2010–2020 Carbon Storage Changes (106 t) | 2020–Optimizing Carbon Storage Changes (106 t) |
|---|---|---|---|---|---|---|---|---|
| Cultivated Land | 1308.59 | 26.64% | 1258.10 | 25.63% | 1275.71 | 25.85% | −50.50 | 17.61 |
| Woodland | 1023.27 | 20.83% | 1032.87 | 21.04% | 1047.79 | 21.24% | 9.60 | 14.93 |
| Grassland | 2515.22 | 51.20% | 2550.91 | 51.96% | 2545.39 | 51.59% | 35.70 | −5.53 |
| Water Bodies | 0.13 | 0.00% | 0.14 | 0.00% | 0.15 | 0.00% | 0.01 | 0.01 |
| Construction Land | 16.84 | 0.34% | 25.26 | 0.51% | 29.43 | 0.60% | 8.43 | 4.17 |
| Unused Land | 48.18 | 0.98% | 42.02 | 0.86% | 35.66 | 0.72% | −6.17 | −6.35 |
Disclaimer/Publisher’s Note: The statements, opinions and data contained in all publications are solely those of the individual author(s) and contributor(s) and not of MDPI and/or the editor(s). MDPI and/or the editor(s) disclaim responsibility for any injury to people or property resulting from any ideas, methods, instructions or products referred to in the content. |
© 2023 by the authors. Licensee MDPI, Basel, Switzerland. This article is an open access article distributed under the terms and conditions of the Creative Commons Attribution (CC BY) license (https://creativecommons.org/licenses/by/4.0/).
Share and Cite
Xi, F.; Lin, G.; Zhao, Y.; Li, X.; Chen, Z.; Cao, C. Land Use Optimization and Carbon Storage Estimation in the Yellow River Basin, China. Sustainability 2023, 15, 11278. https://doi.org/10.3390/su151411278
Xi F, Lin G, Zhao Y, Li X, Chen Z, Cao C. Land Use Optimization and Carbon Storage Estimation in the Yellow River Basin, China. Sustainability. 2023; 15(14):11278. https://doi.org/10.3390/su151411278
Chicago/Turabian StyleXi, Furui, Gang Lin, Yanan Zhao, Xiang Li, Zhiyu Chen, and Chenglong Cao. 2023. "Land Use Optimization and Carbon Storage Estimation in the Yellow River Basin, China" Sustainability 15, no. 14: 11278. https://doi.org/10.3390/su151411278
APA StyleXi, F., Lin, G., Zhao, Y., Li, X., Chen, Z., & Cao, C. (2023). Land Use Optimization and Carbon Storage Estimation in the Yellow River Basin, China. Sustainability, 15(14), 11278. https://doi.org/10.3390/su151411278