Article

Assessment of Socioeconomic Resilience to Pandemic Disasters in Island Tourist Destinations

by
Adel Hafsi
1,
César Daniel Aguilar-Becerra
2,
Oscar Frausto-Martínez
1,* and
Alejandra Sarhai Rivas-Tapia
3
1
Sustainable Development Division, Universidad Autónoma del Estado de Quintana Roo, Andrés Quintana Roo S/N, Entre Calle 110 sur Frente a la Colonia San Gervasio, Cozumel 007600, Mexico
2
Facultad de Turismo, Universidad Autónoma de Guerrero, Cerrada de Papantla y Avenida Ruiz Cortínez S/N Colonia, Alta Progreso, Acapulco de Juárez 39610, Mexico
3
Centro Universitario de la Costa, Universidad de Guadalajara, Avenida Universidad de Guadalajara 203, Ixtapa 48280, Mexico
*
Author to whom correspondence should be addressed.
Sustainability 2023, 15(14), 11246; https://doi.org/10.3390/su151411246
Submission received: 29 May 2023 / Revised: 5 July 2023 / Accepted: 13 July 2023 / Published: 19 July 2023
(This article belongs to the Special Issue Climate Change Adaptation and Disaster Risk Assessments)

Abstract

:
The pandemic has led to a sharp contraction in economic activity with diverse businesses shutting down or reducing their operations. The COVID-19 pandemic is recognized as a challenge in the travel and tourism services industry. Therefore, this paper aims to evaluate the socioeconomic resilience of the island tourist destination of Cozumel and to determine its ability to manage a pandemic by identifying its strengths and weaknesses. This study was based on the Indicators of Socioeconomic Resilience in Island Destinations (ISRID) matrix adapted to the study territory to achieve this aim. As a result, 63 out of 890 research articles were reviewed, from which 1222 indicators were collected; nevertheless, only thirty-three indicators were selected. The assessment was also structured on a matrix of double data collection before and after the pandemic to analyze the evolution of the components essential to strengthening socioeconomic resilience. In this way, this study revealed that the island of Cozumel does not have good risk management in the presence of a pandemic phenomenon. Thus, the principal axes to reinforce abilities were implementing a comprehensive plan with multidisciplinary approaches containing themes like social participation, access to information, health, economic resources, gender inequalities, marginalization, environmental impacts, and endemic resources. Finally, the matrix developed can aid decision-makers in generating corresponding actions when designing, implementing, and evaluating socioeconomic resilience capacities to cope with a pandemic disaster in island tourist destinations.

1. Introduction

In recent years, there has been an increasing trend in the frequency of natural disasters [1], affecting more people and causing significant economic losses [2]. Multiple explanations can be made for the origin of these phenomena. Still, the experts point to factors like climate change, urbanization, and other human activities that can alter the natural environment and increase the likelihood of hazards occurring [3,4,5,6]. The global COVID-19 pandemic has recently been significant and widespread, affecting every country and sector of the global economy [7,8].
According to the IFRC [9], it was noted that 80% of emerging and developing economies recorded a recession during this year, of which, the most affected were those dependent on the tourism and services sectors, as well as countries dependent on exports of industrial products.
The pandemic has led to a sharp contraction in economic activity, with many businesses shutting down or reducing their operations, resulting in company bankruptcies, reduced private investment, lower economic growth, deterioration of productive capacity, breakdown of human capital, higher unemployment, lower wages, increased poverty, higher costs, and unequal access to health care [10]. According to Higgins-Desbiolles [11], the COVID-19 pandemic is recognized as a challenge in the travel and tourism services industry, forcing those involved to develop more sustainable, ethical, and responsible strategies. In the same way, the World Tourism Organization (UNWTO) pointed out tourism’s vulnerability to external factors and its highly fluctuating and vulnerable structure [12,13].
However, in the case of Island Tourism Destinations (ITD), being closed circuits, they have gone through a pandemic with different characteristics compared to other sun and beach tourism destinations due to their degree of isolation and high dependence on the income generated by tourism [14]. In this regard, Briguglio [15], McElroy [16], Mehmet and Tahiroglu [17], Worrell [18] point to three important development limitations of the ITD: economic limitations (limited movement of goods, economic development pressures, small domestic market, limited capacity to take advantage of economies of scale), human limitations (reduced human resource base, emigration of specialists to big cities, costly government functions per capita, impartiality problems due to proximity of agents, and community), and environment limitations (highly fragile ecosystems, prone to natural disasters, rapid depletion of agricultural land, intense use of the coastal zone for tourism and sea-related activities, accelerated generation of urban solid waste, increased demand for resources, limited natural resources).
In the case of Mexico, a recession of the gross domestic product GDP of 8.5% was recorded with a decrease of 30% in its tourism GDP during 2020 [19]. This generated the loss of 775 thousand jobs and 13.6 billion dollars in resources from international visitors [19]. Also, studies by Damián [20], Palafox-Muñoz and Rubí-González [21] pointed out the vulnerabilities of tourist destinations in Mexico and the socioeconomic impact of the pandemic due to a fluctuating industry, labor precarity, and irrational population growth.
The situation is even more catastrophic for specific territories, such as tourist island destinations like Cozumel, which highly depend on tourism, with 66.32% on the service sector and 20.06% on commerce. The rest of the activities are divided as follows: The primary industry is 0.97%, and the secondary sector is 11.22% [22]. In the same way, the island of Cozumel, as the first cruise destination in Mexico, registered a loss of 747.97 million dollars based on the year 2019 [23]. In addition, at the end of 2020, SEDETUR [23] published a report stating that hotel occupancy had reached a decrease of 26.9%, airport passenger movements by 50.9%, and cruise ship movements by 72.7%.
Despite the multitude of research on COVID-19 and its economic impact, very few studies have been found with a local focus. However, a couple of studies focused on island tourism destinations have been found with COVID-19 approaches on topics such as the food system on the Pacific Islands [24,25], tourism vulnerability on Spanish islands [26], coastal planning and beach management in Caribbean insular states [27], and organizational resilience in hotels on Spanish islands [28]. However, no studies on socioeconomic resilience to pandemic events for island tourist destinations were found.
In this sense, it is urgent to consider strategies to strengthen their capacities and abilities to anticipate and manage the negative effects of disasters, like pandemics, that risk both the short term (higher unemployment; lower wages and incomes; increased poverty; inequalities; and increased health costs) and the long term (business failures, reduced private investment, lower economic growth, less integration in value chains, deterioration of productive capacities and human capital) [10]. Therefore, socioeconomic resilience is introduced as a core construct to strengthen the capacities and abilities of an individual or community to be able to resist, reduce, and absorb the negative effects of asset losses, cope with economic impacts on their living conditions, and recover from a disaster [29,30]. Nevertheless, the political misuse and the multidisciplinary approach of the resilience concept have caused problems in its application, causing difficulties in integrating the different visions and confusing the definition of what constitutes resilience as an outcome, a property, or a process. According to [31], it is reported that there are two main views of resilience: process and property. However, process resilience and property resilience are not contradictory. Indeed, the intrinsic qualities of systems, combined with exogenous factors, are what will determine the resilience process and the trajectory of the system [31]. Therefore, Quenault [32] identifies two dimensions of resilience applied to risk and disaster management: The first dimension involves resilience with reactive responses in order to absorb, resist, and self-organize to face a disaster, and the second dimension implies proactive responses to strengthen the adaptive capacity and the learning capacity to be able to recover, transform, reorganize, or renew the system during and after a disaster.
Therefore, this paper aims to evaluate the socioeconomic resilience of the island tourist destination of Cozumel and find its ability to oversee a pandemic by identifying its strengths and weaknesses. Through this study, we look to propose a solid evaluation-support instrument that will allow island localities to address and develop reinforcement plans to reduce the direct and indirect socioeconomic impacts to cope with a pandemic event.

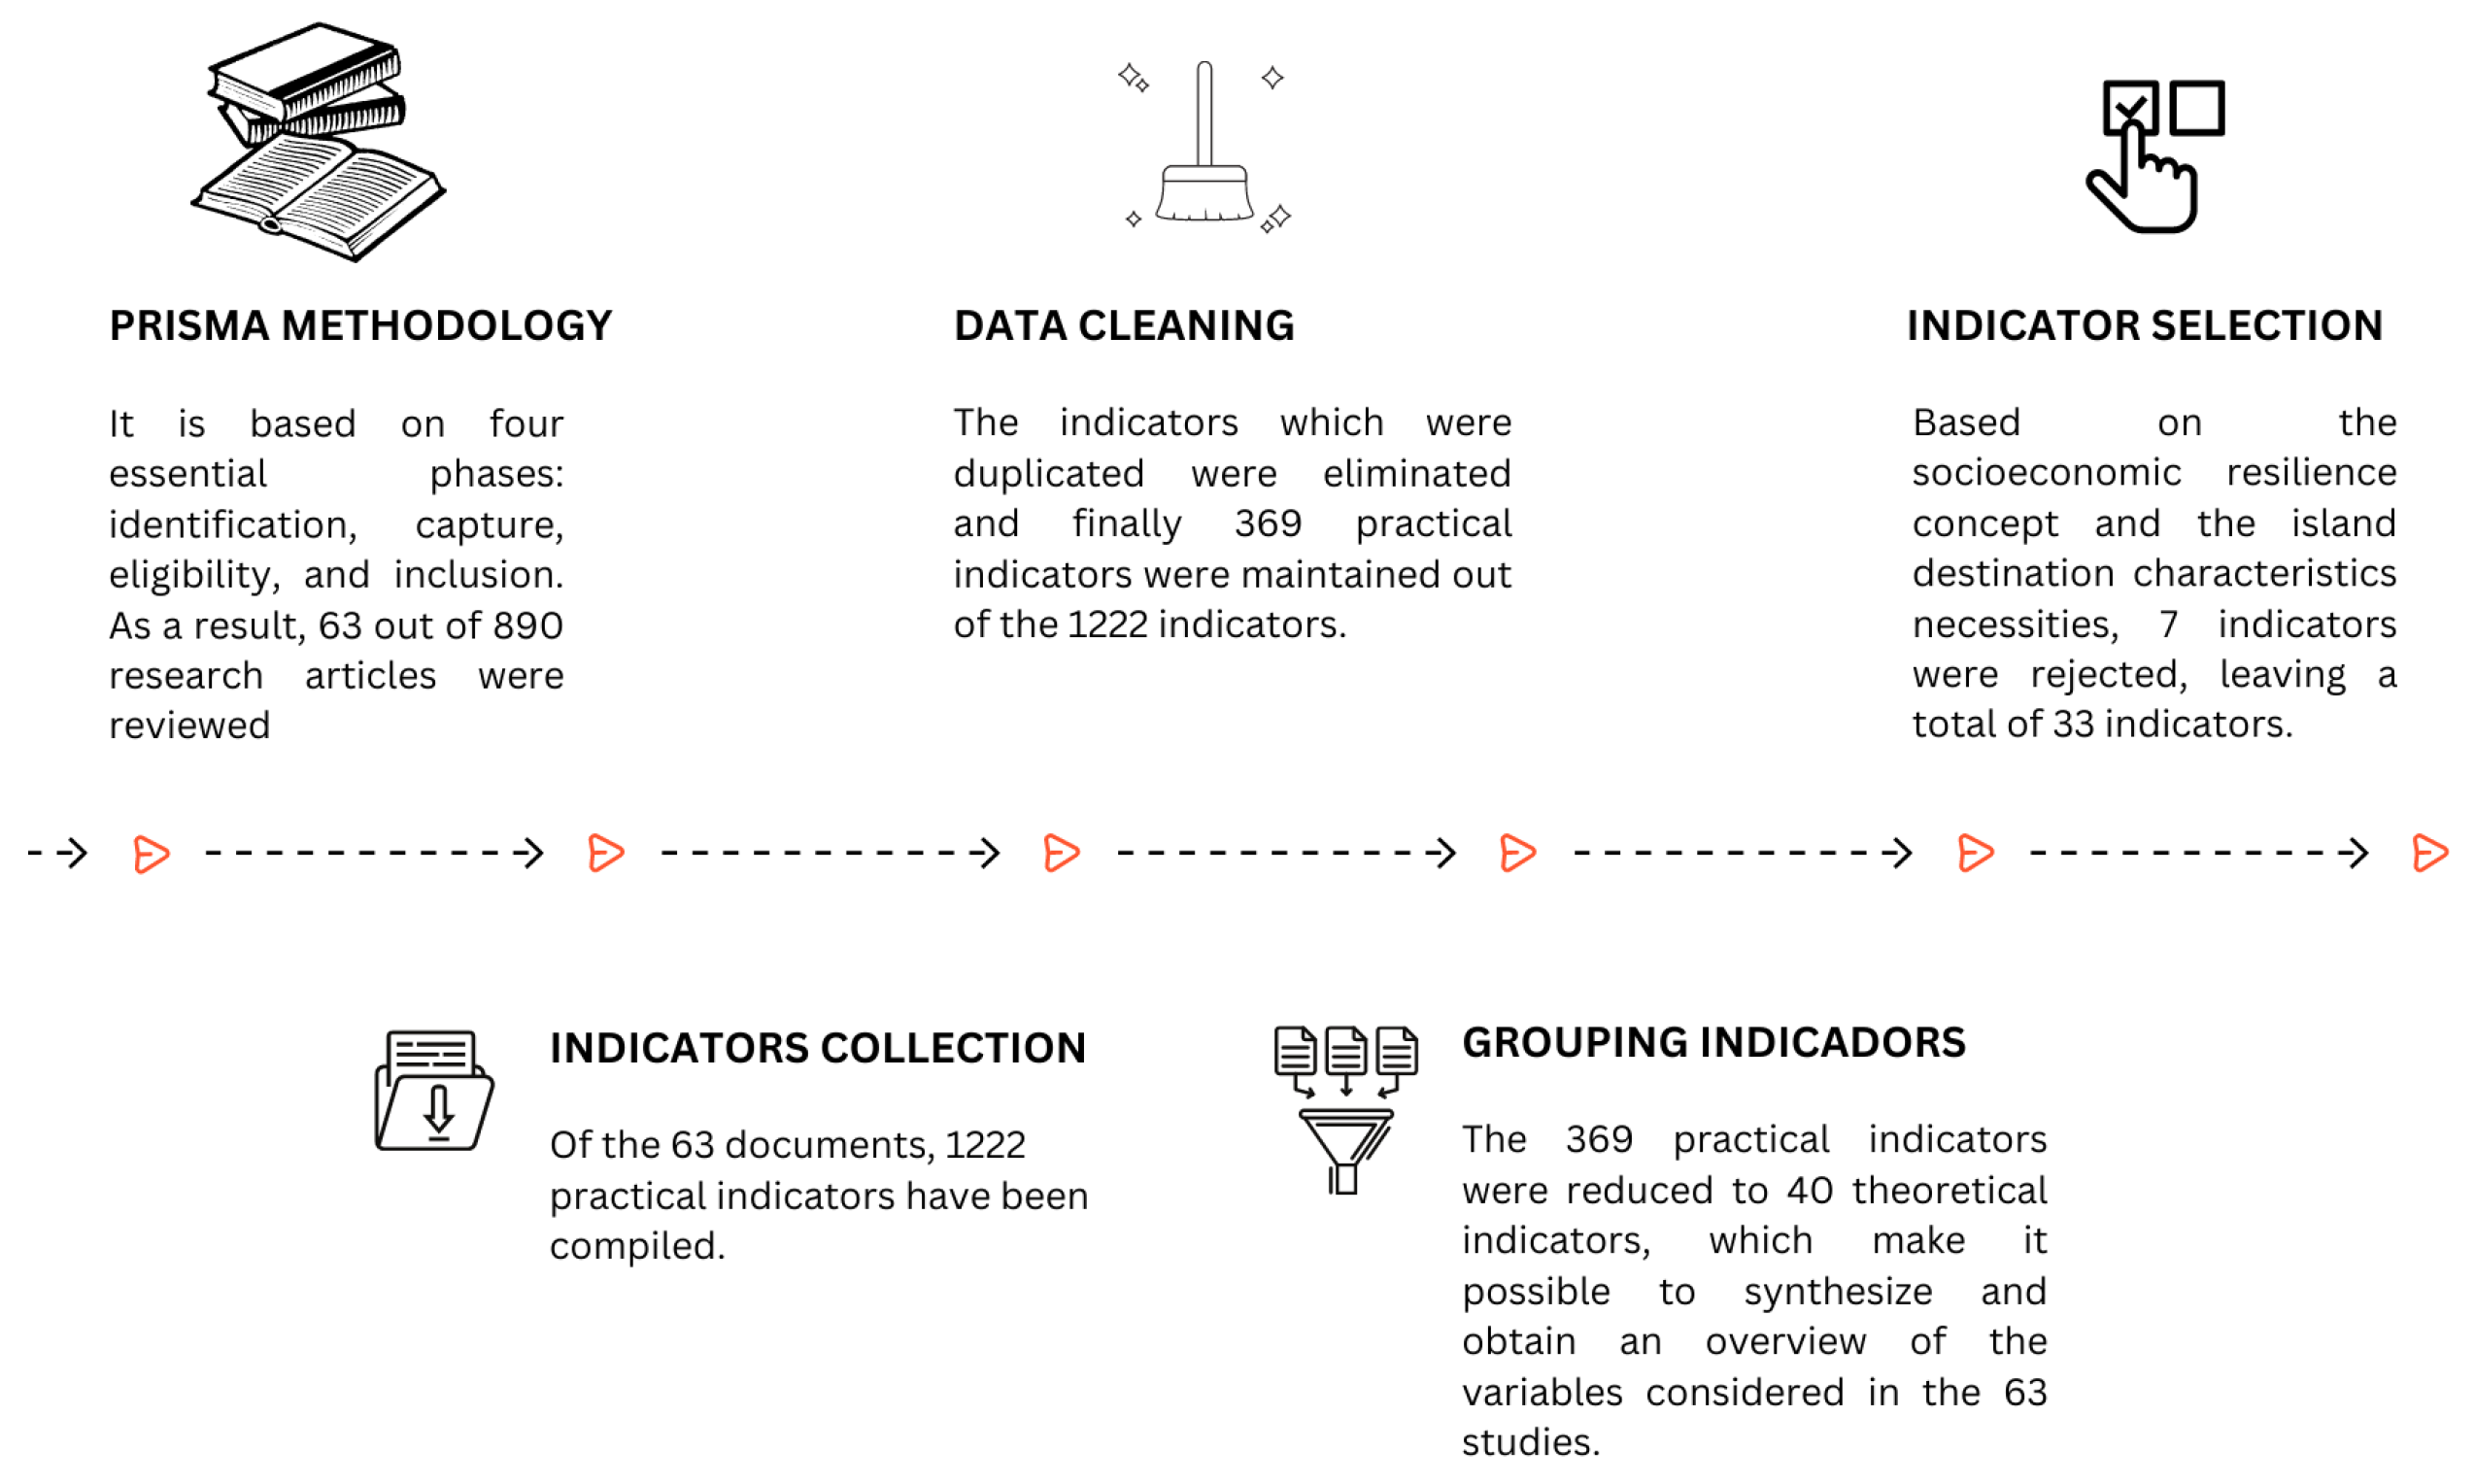
2. Materials and Methods

This work was conducted in three stages. The first stage consisted of designing and selecting indicators, which was conducted through a systematic literature review using the search terms resilience, risks, and disasters considering the databases of Scopus and Web OF Science databases (See Figure 1). The PRISMA method (2020) was used for the systematization, which is based on four essential phases: identification, capture, eligibility, and inclusion. As a result, 63 out of 890 research articles were reviewed, from which 1222 practical indicators were collected and homogenized into 40 theoretical indicators (See Figure 1). However, thirty-three indicators were selected based on the inherent factors of socioeconomic resilience to cope with a pandemic event in context of island tourist destination (See Table 1), and seven indicators were eliminated (household character, community services, land use diversity, climate, sturdier housing type, shelter capacity, location) since they did not meet the objective of this study or were similar in terms of expected results to other indicators in the matrix. Moreover, the matrix was divided into three dimensions: political structure (human and political resources), social structure (natural and social resources), economic structure (economic and physical resources) in order to understand the mechanism of marginalization that lead to vulnerability [33], as shown in Table 1 and Appendix A.
In the second stage, practical indicators have been chosen according to the database availability of statistical organisms, academic studies, and institutions at national and local scales (Table 1). The socioeconomic resilience indicators matrix (ISRID) Table 1 was used to structure the analysis. The matrix is composed of three dimensions, six sub-dimensions, thirty-three theoretical indicators, thirty-three practical indicators, and their sources. Moreover, the matrix supplies a new understanding of the endogenous and exogenous dynamics of the island system before and after a pandemic event.
Finally, the evaluation method was based on the concept of resilience as “The ability of a system, community or society exposed to hazards to resist, absorb, accommodate, adapt to, transform and recover from the effects of a hazard in a timely and efficient manner, including through the preservation and restoration of its essential basic structures and functions through risk management” [57]. However, we used the basis of the analytic model developed by Hafsi and Frausto-Martínez [45] based on a temporal evaluation before and after the disruptive events. Most data were collected through national and local statistical institutes or critical actors.
The results were analyzed according to the trends recorded between the first and last measurements and data availability. The evaluation criteria (Table 2) were based on knowledge, resistance, absorptive, adaptive, learning, and building back better capacities.

3. Results

From the thirty-three indicators, three results tables were generated standing for the three dimensions and six categories. The data were collected entirely through online sources or key actors to streamline the process of assessing and naming the abilities and vulnerabilities of Cozumel Island. In addition, the results were represented in two phases, the first with the collected data tables. Then, a spider diagram was added for each table to evaluate the trend of the results.

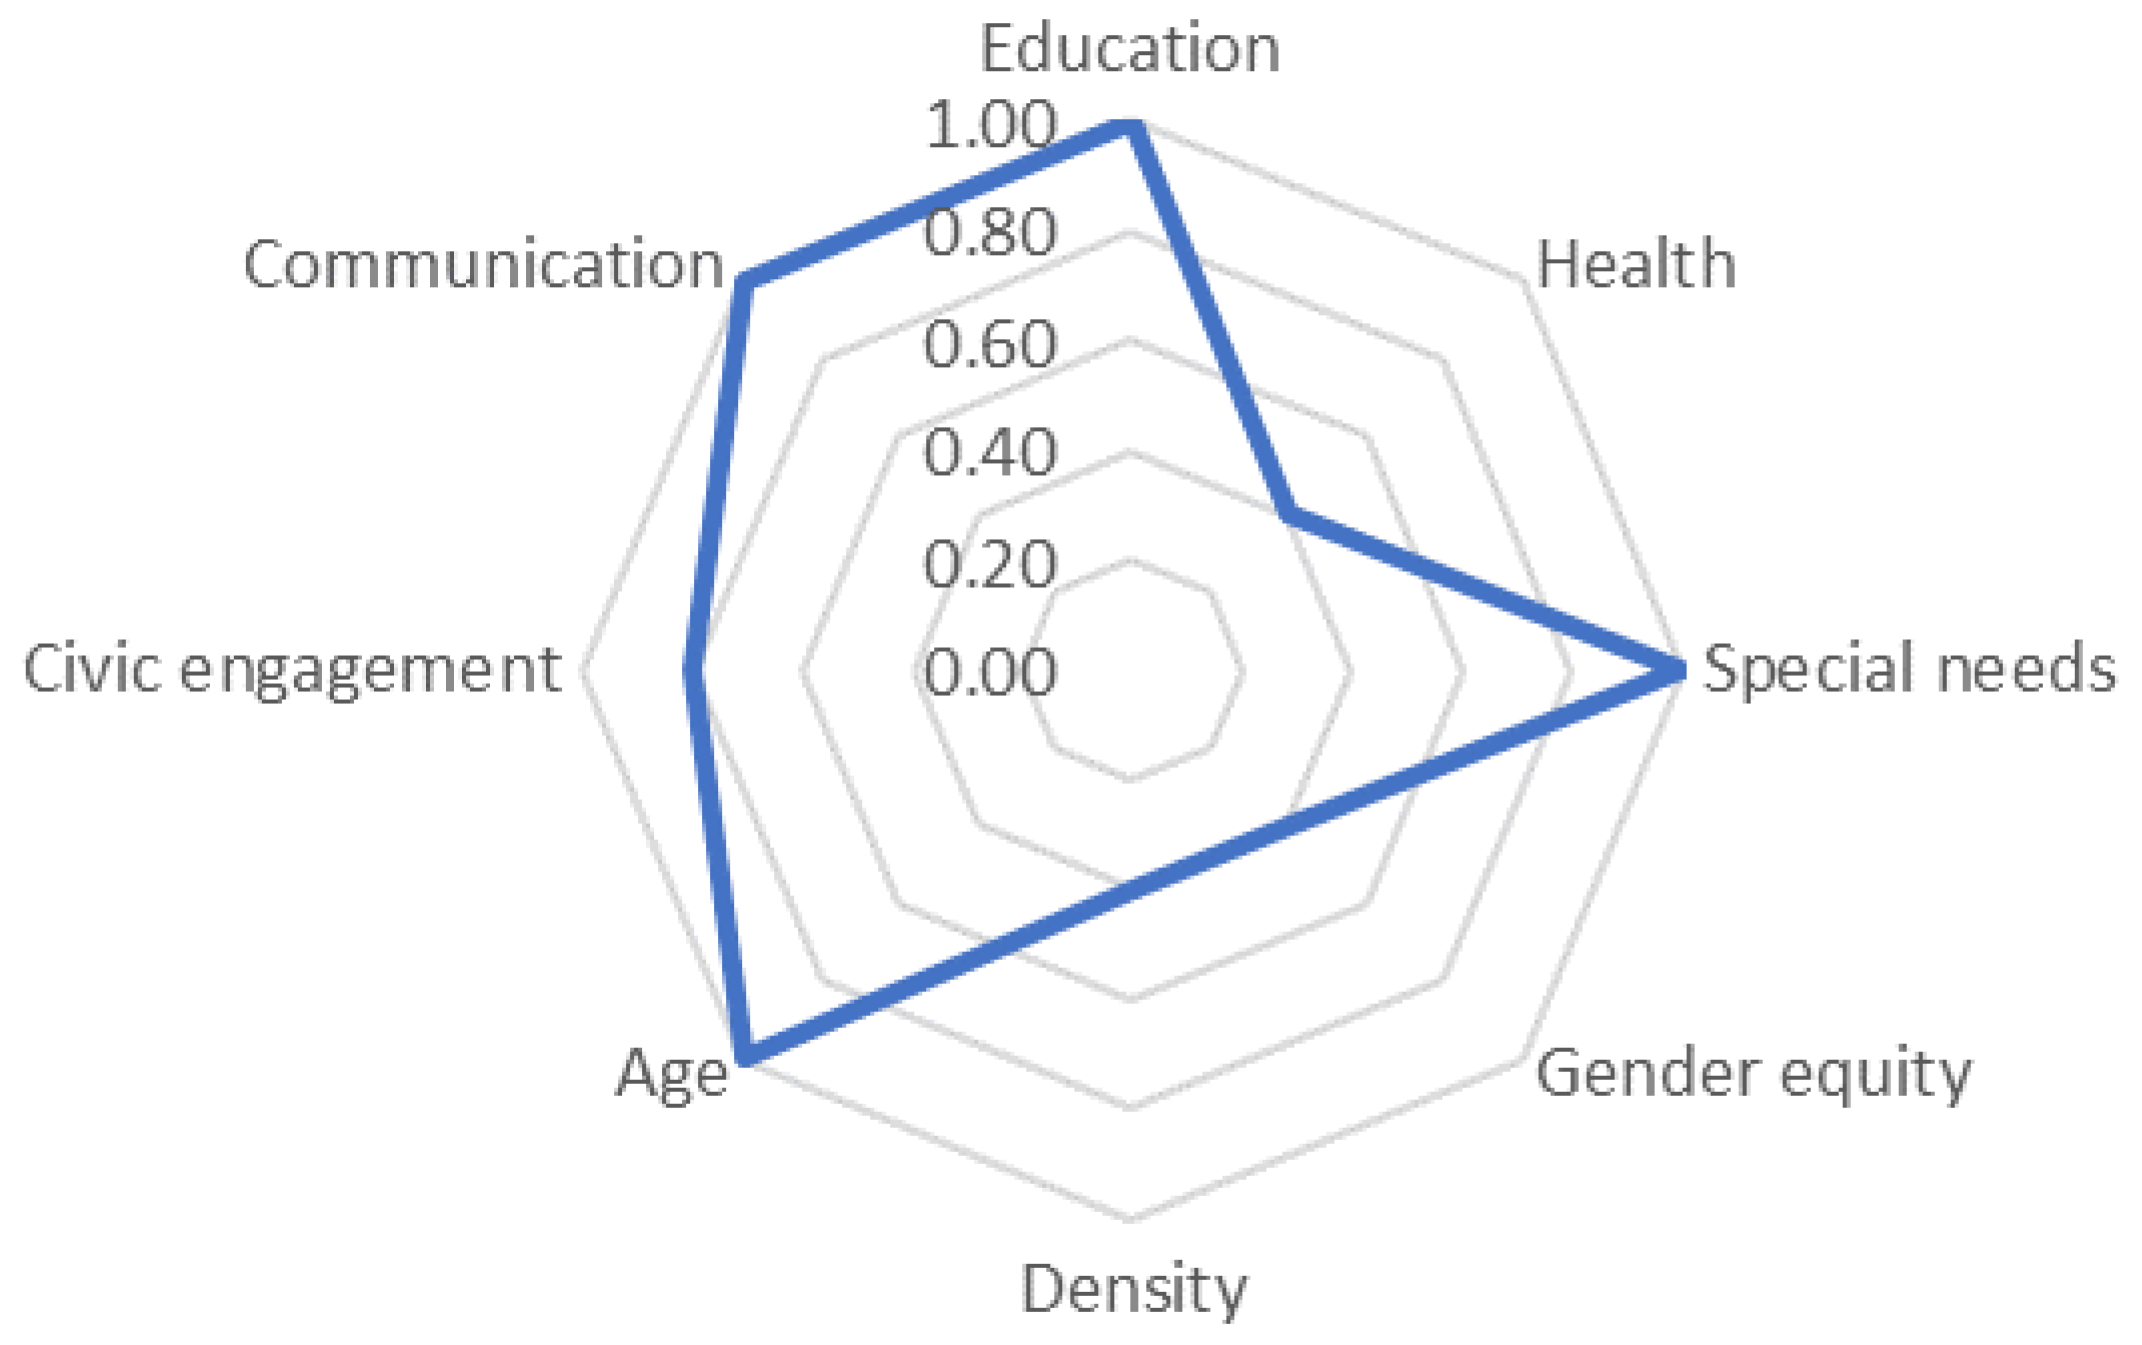
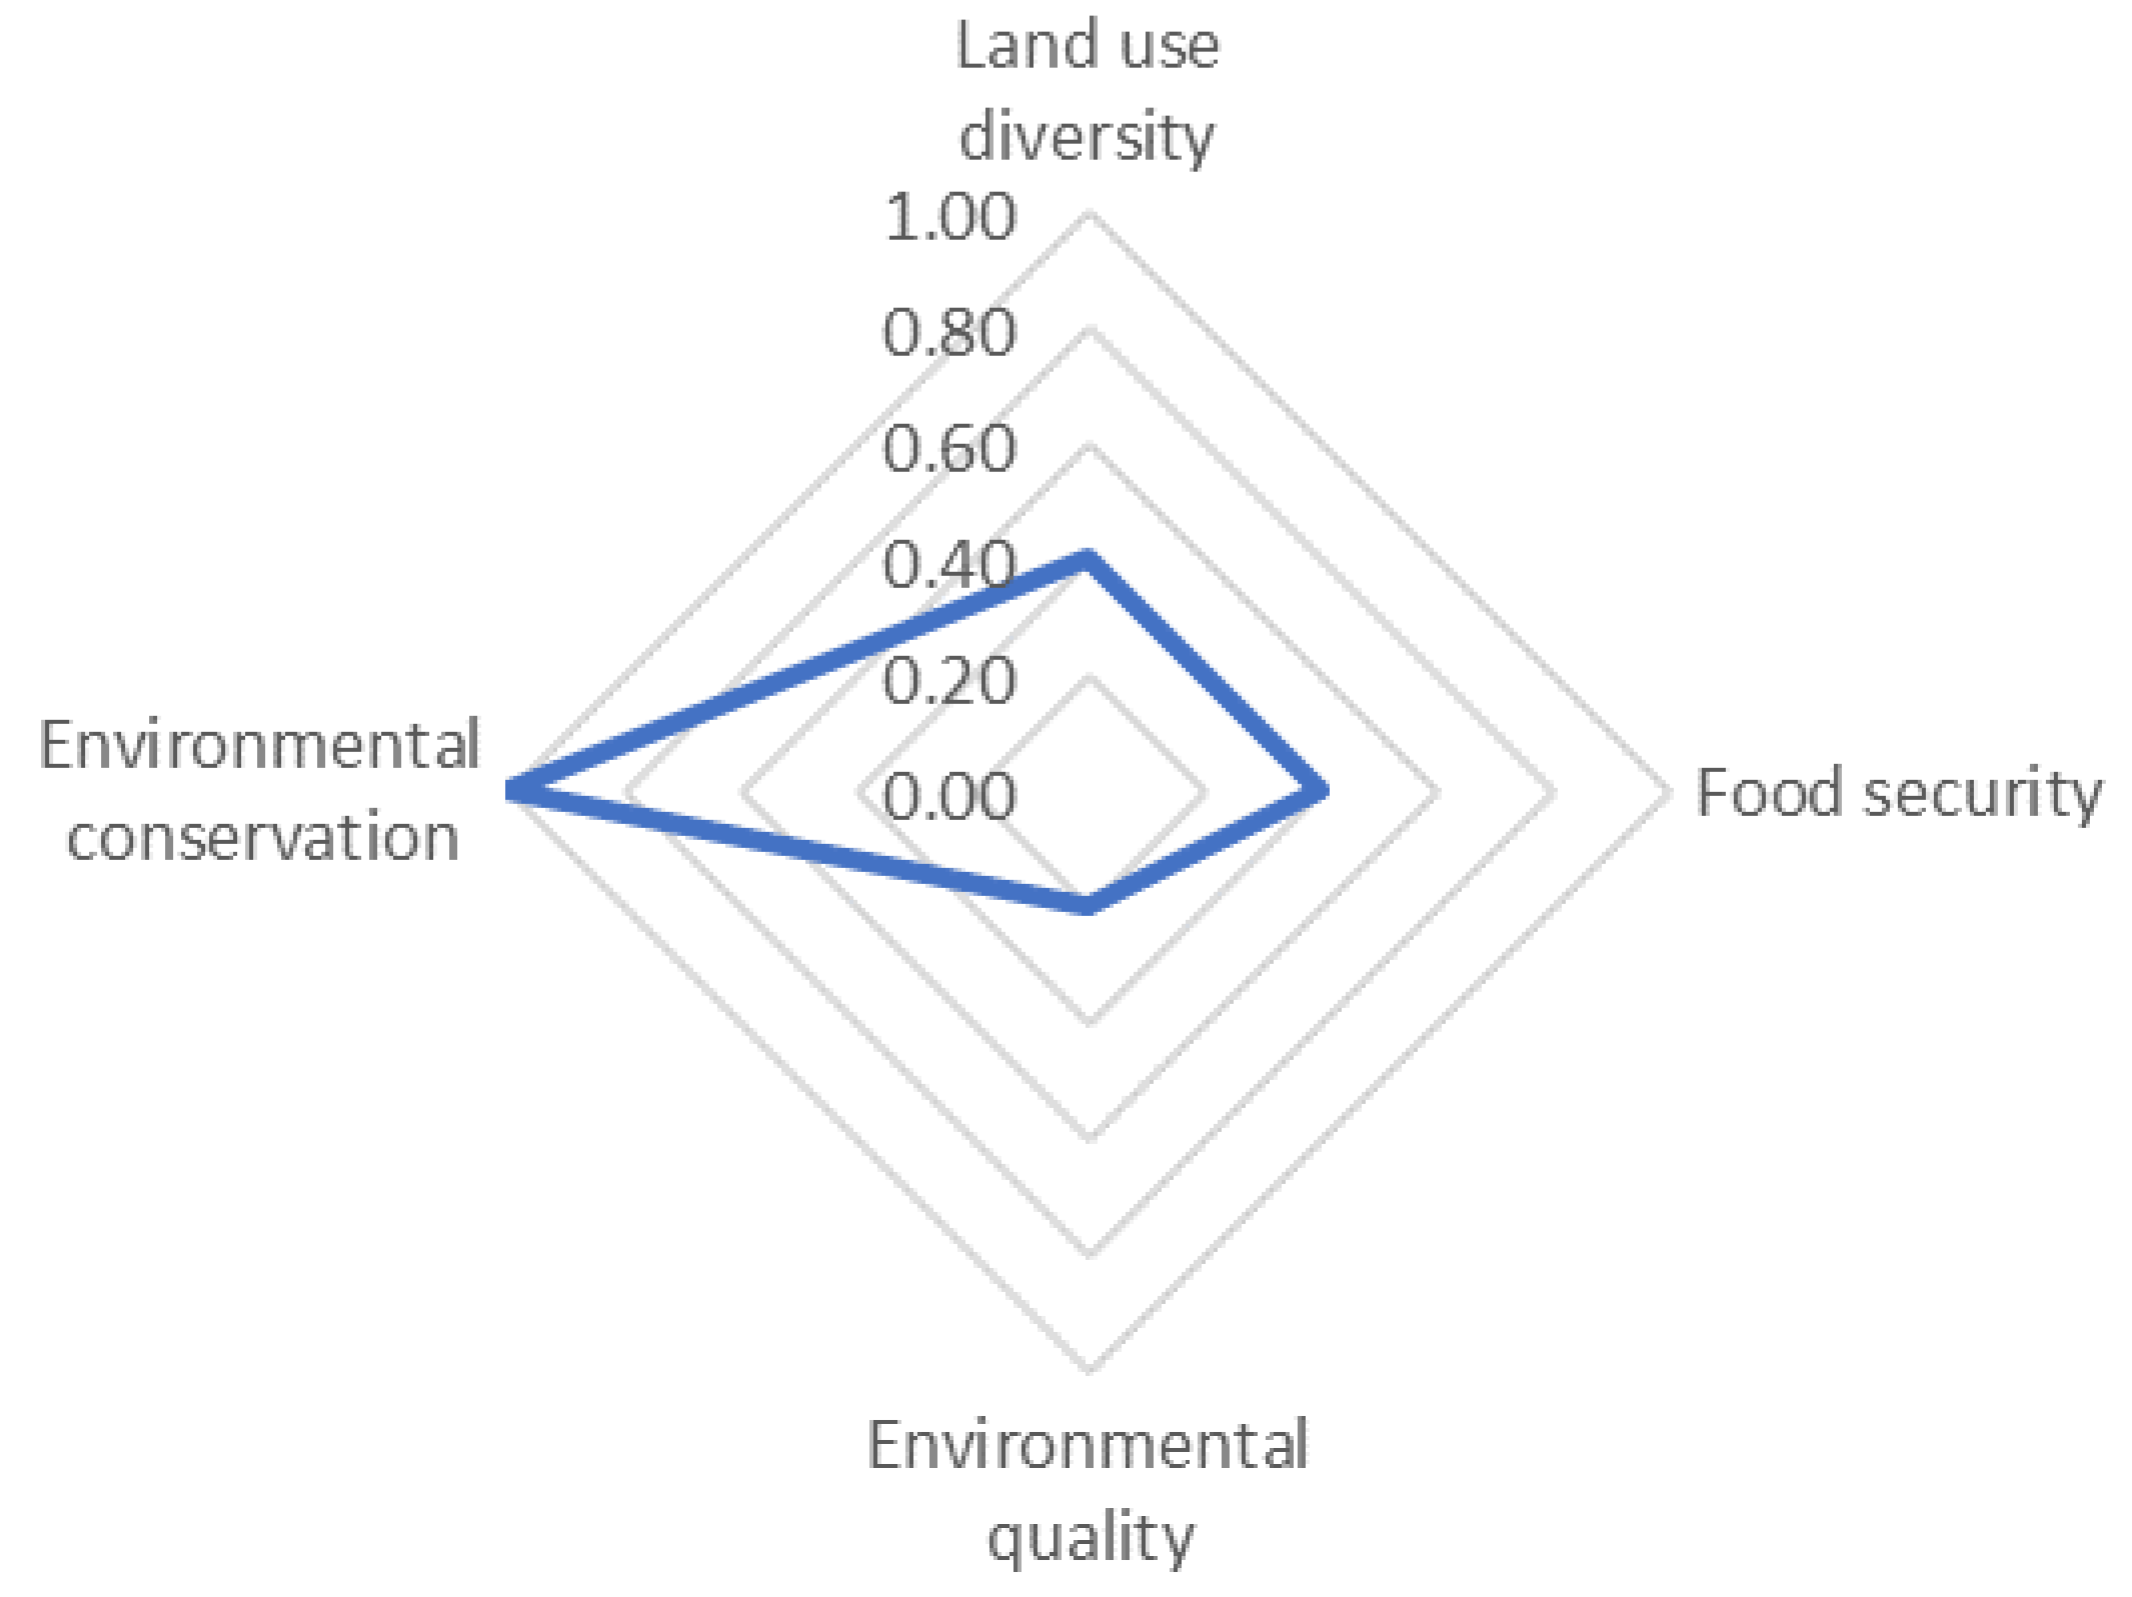
3.1. Social Dimension Results

The social dimension Table 3 is composed of two categories, social resources and natural resources, which focus on providing information on good risk awareness, access to essential services, and environmental capacities to cope with natural disasters. For the first one, the data were primarily quantitative, collected through national statistical agencies with a breakdown at the municipal level. On the other hand, the second category includes four indicators and refers to natural characteristics in terms of quantity, quality, and conservation. In this sense, the data collected are mixed and collected from national agencies’ websites at the municipal level with availability for all indicators before and after the disturbance event.
The results of the social resources category showed a positive trend in education, communication, civic engagement, and age; however, it is essential to note comments about specific data found from the official measurement agencies. Indeed, for the measurement of density, it was seen that it is measured based on the total surface of Cozumel Island, which will always reflect an increase due to the constantly growing population. The recommendation would be to consider the urban area’s character instead of the island’s total surface. Furthermore, regarding the data on the “Degree of Social Network Perception Index”, the national council for the Evaluation of Social Development Policy (CONEVAL in Spanish) has not yet provided data with a local scale breakdown, so we have used the data at the state level for this study.
Moreover, we see in Figure 2 that the gender equity, health, and density indicators show a negative trend, i.e., they are elements that could cause vulnerabilities in times of a pandemic for specific categories, such as women and people without access to health services.
In addition, the population’s promiscuity has worsening impacts, such as the rapid spread of the virus, the lack of personal space, mental health, and the distribution of resources. In this way, it is considered for the category of social resources that the three axes, gender equity, density, and health, should be reinforced. In the same way, about the natural resource category in Figure 3, we observed negative trends in land use and food security for the island.
This means that the island is highly dependent on imports and will be vulnerable to prolonged pandemics and shortages of primary products. On the other hand, the environmental quality indicator does not have updated data after the pandemic event. However, the earlier results are alarming and need to be considered for conservation plans and reducing impacts from tourism and other anthropic activities.

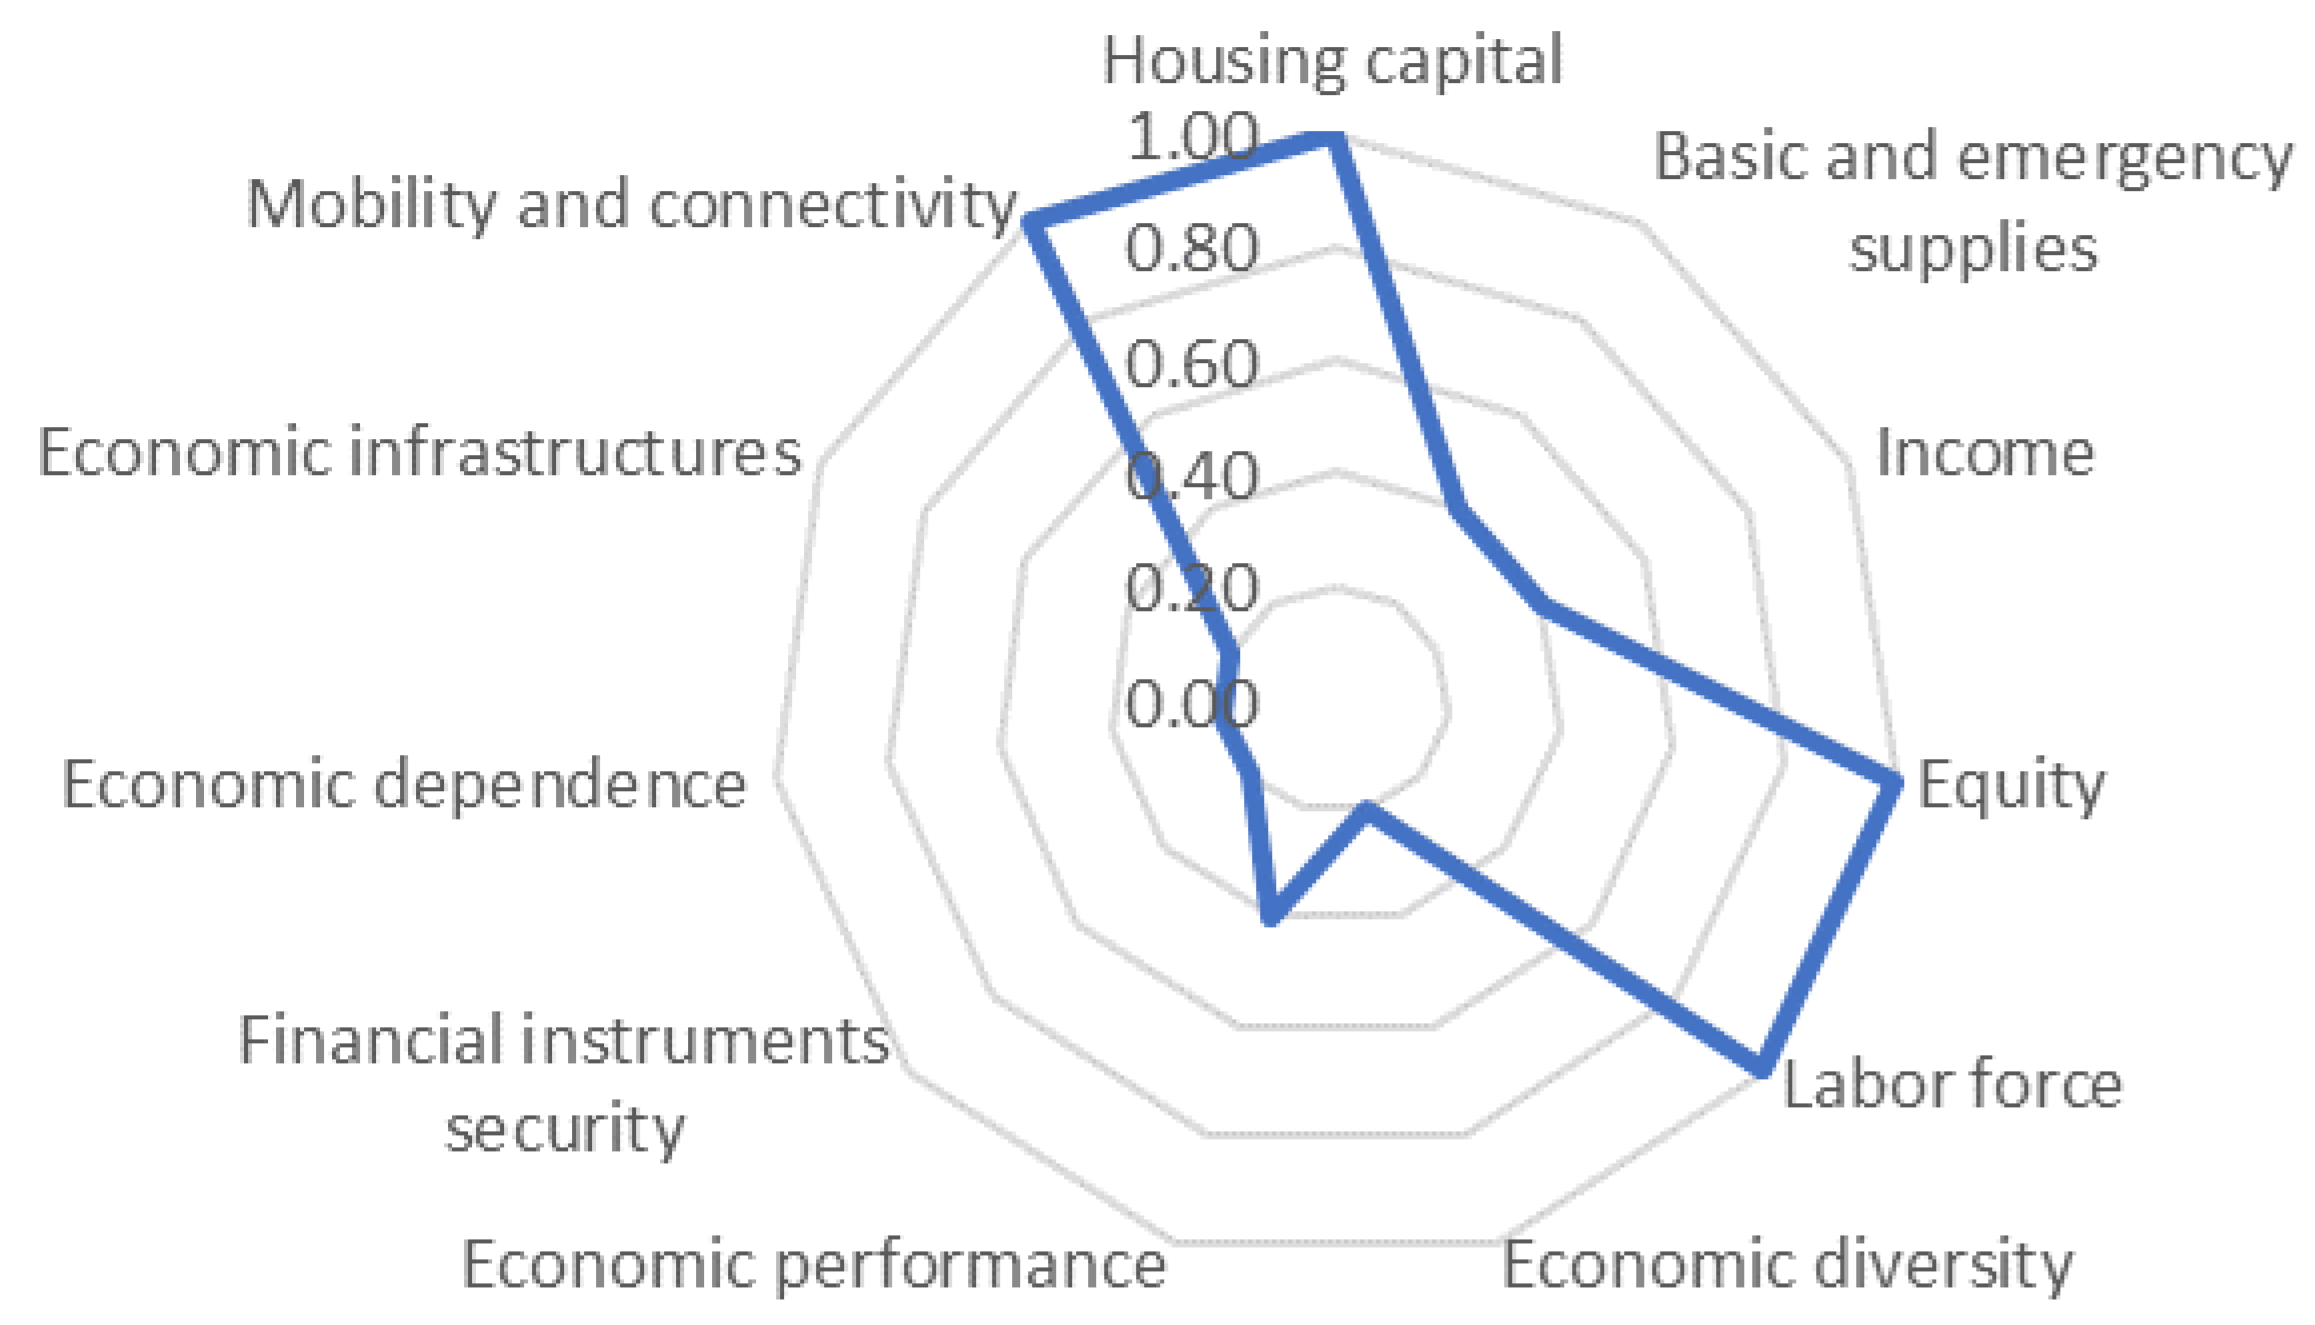
3.2. Economic Dimension Results

The economic dimension Table 4 includes two categories, financial resources and physical infrastructure, which focus on the micro and macro economy generated by individuals’ local activities and resources. The data were primarily quantitative and collected through national statistical agencies and official journals with a breakdown at the municipal scale.
The economic dimension Figure 4 results showed a positive trend of housing capital, mobility connectivity, financial instruments security, labor force, and equity. However, it is essential to note comments about specific data.
First, it can be added to the data of mobility and connectivity in Table 4 that the distance between the mainland and Cozumel Island is approximately 18 km, which puts the connectivity of Cozumel Island into perspective. Secondly, the data of financial instruments in case of disasters depend on the resources and tools of the national organizations since in Mexico, the municipalities need this economic competence.
However, we note in Table 4 that no data were found after the event (2020–2023) for the indicator’s economic infrastructure, dependence, and diversity. This is due to the cuts in the statistical survey published every five years and published in 2024. For the moment, it is impossible to obtain the information to analyze the data and trends.
On the other hand, we see in Figure 4 that primary and emergency supplies, income, and economic performance indicators registered a negative trend.
For the income indicator, the results show a critical situation, which means more of the population of the Cozumel municipality lives below the poverty line. This implies that the population does not have the minimum of economic resources to be able to live decently and to be able to save and expect to prevent future economic downturns.
In the case of the economic performance indicator, the data reflect little reinvestment of profits in the island’s economy. This could be alarming, but the trend curve since the 2000s has shown difficulties, which only reflects a cyclical fluctuation. Thus, it is recommended for the economic dimension to reinforce the axes related to the income of the population and to add the axis of economic diversity; even though we do not have the data after the event, the concentration of income is highly linked to tourism and could be an axis of reinforcement to obtain a diversity of economic resources.

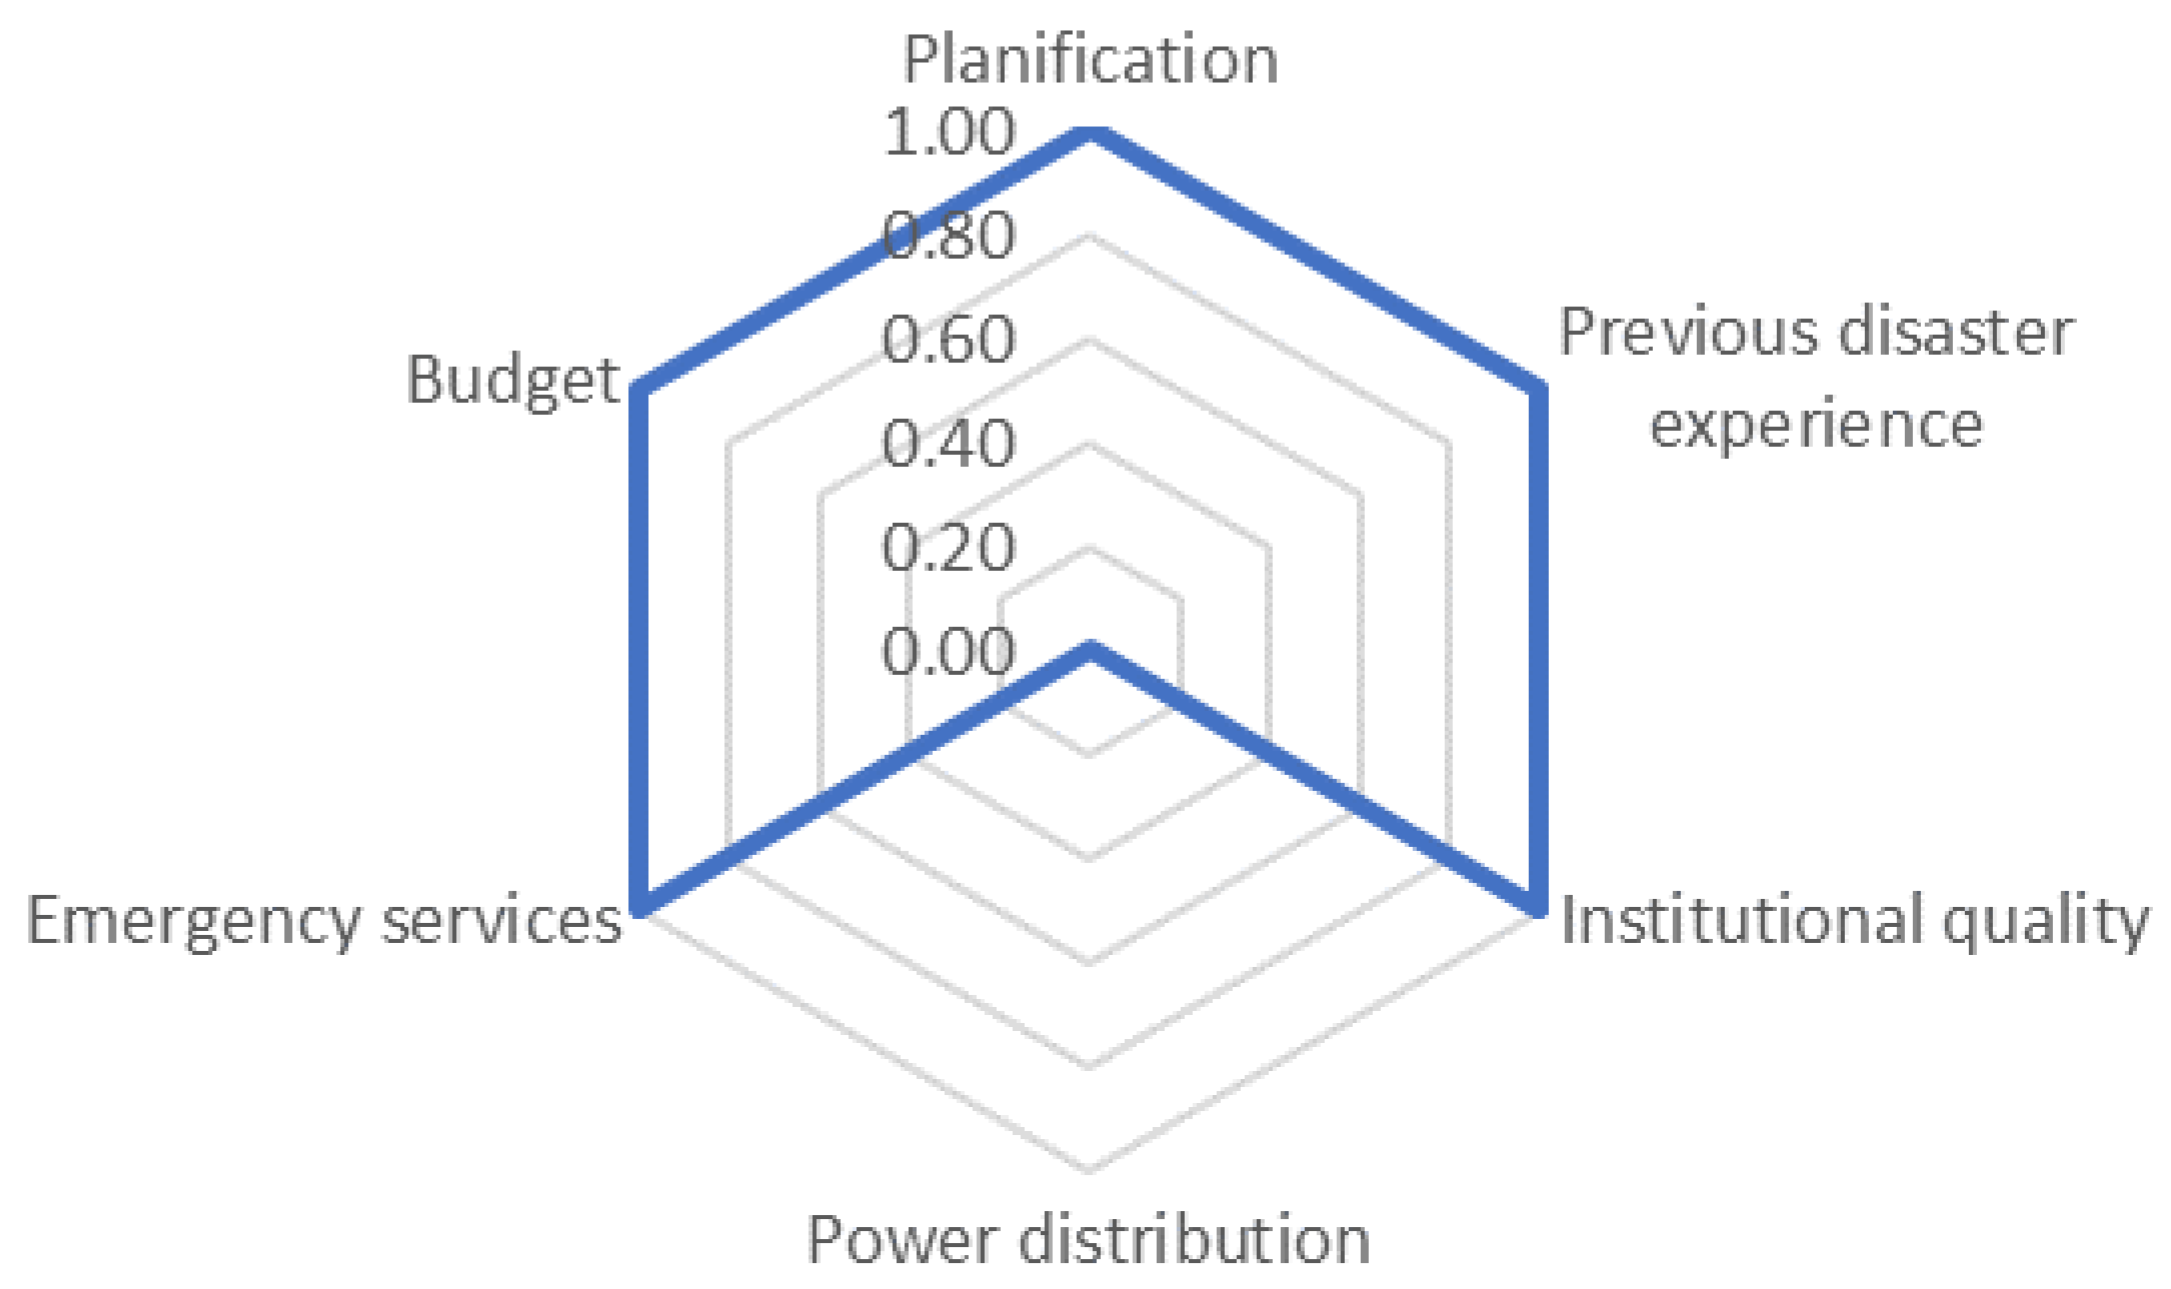
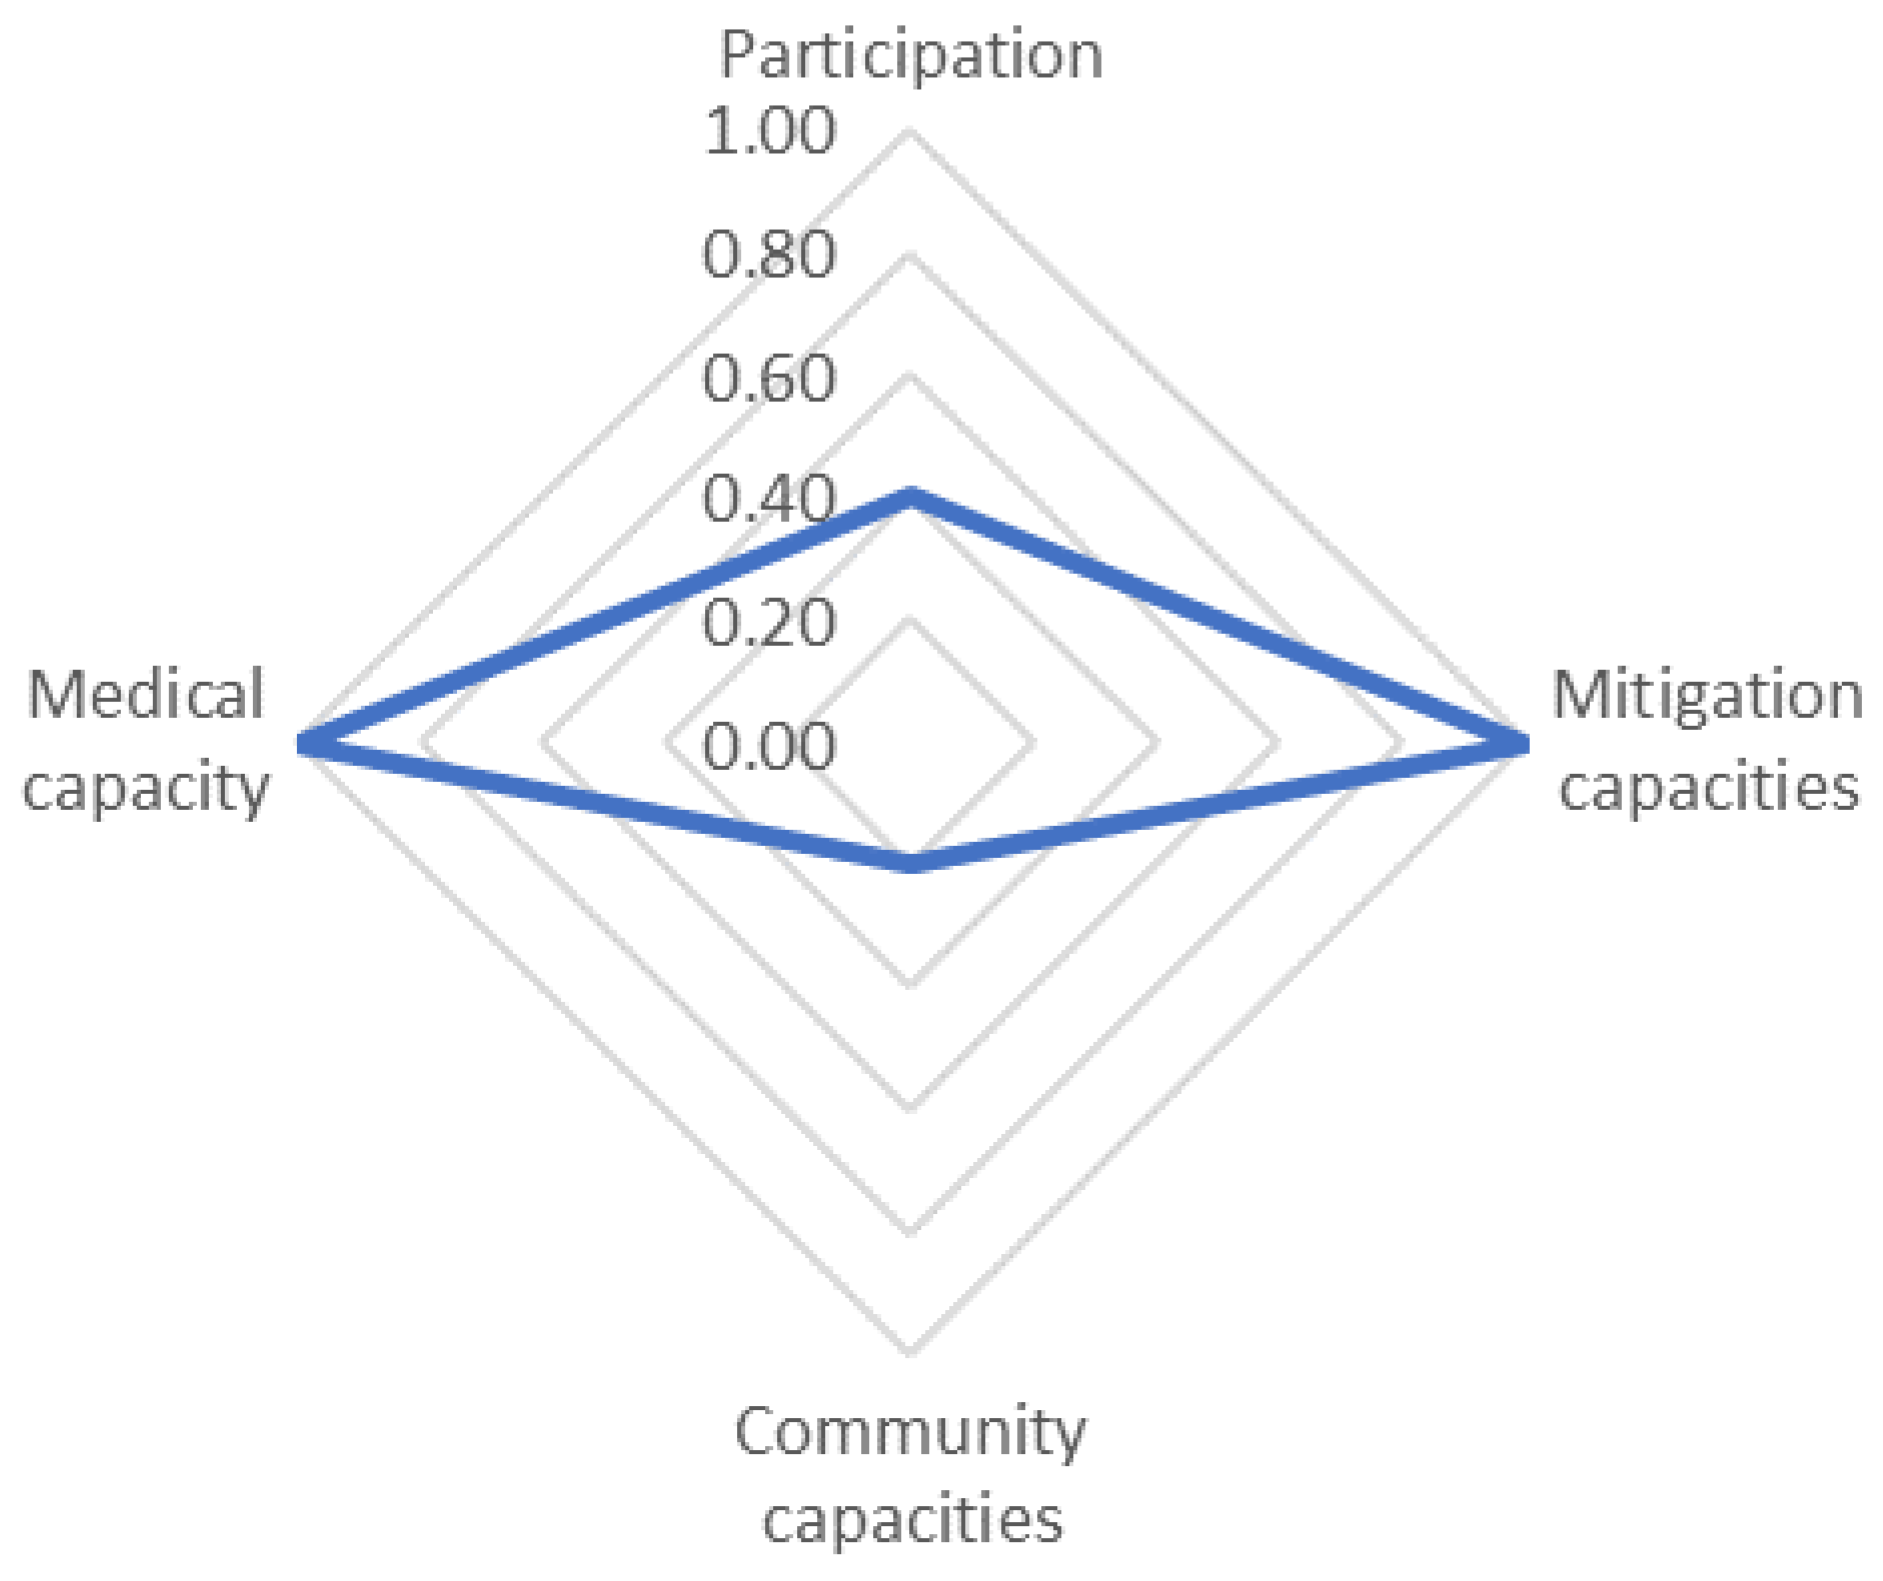
3.3. Institutional Dimension Results

The institutional dimension Table 5 forms two categories: political and human resources. The institutional dimension emphasizes data and knowledge about the distribution of a locality’s resources, power, or capacities to supply a better understanding of the system. Data were mixed and were collected through national statistical agencies with a breakdown at the municipal level. In this sense, the data collected are mixed and collected from federal agencies’ websites at the municipal level and small closed interviews with key actors with availability for all indicators before and after the disturbance event.
The institutional dimension Figure 5 and Figure 6 showed a positive trend in the indicators of planification, budget, previous disaster experience, emergency services, institutional quality, medical capacities, and mitigation capacities. However, it is crucial to note comments about specific data.
First, the planning instruments in case of disasters depend on the resources and tools of the national organizations CENAPRED. Secondly, the data of institutional quality Table 5 was based on the perception to understand the linkage between the population and municipalities better. Thirdly, official data must be collected for inclusive representation within the government. It cannot be proven even if it is present in political speeches.
Therefore, we observe in Figure 4 that the indicator of the power distribution is the only one with a negative result.
Thus, it is recommended to consider the power distribution indicator as the axis of reinforcement to obtain a better result in assessing the population as a unit and increasing the representativeness of the community. In addition, it is necessary to point out that the emergency services of Cozumel Island have an organization and experience in the face of hydrometeorological events, which helps with the transfer of capabilities and human resources in the face of disasters caused by other disturbing events. However, it is recommended to constantly reinforce annual campaigns for different situations, such as pandemics, and update training with the support of academics and experts. In the case of the human resources indicator Figure 6, the data reflect a decrease in participation and a need for more knowledge of community capacities.
Moreover, the absence of data about risk management indicators would be an axis of future development to optimize decision-making. On the other hand, participation points to a break in municipal affairs such as voting, development of plans, or consultation should be essential and have wider dissemination to reach the public.

4. Discussion

The thirty-three valuable indicators used responded to the evaluation of the thirty-three theoretical indicators set out in the ISRID matrix, which also responded to the six categories and three dimensions: the social dimension (social resources, natural resources), economic dimension (economic resources, physical infrastructures), institutional resources (political resources, human resources).
In this sense, the matrix gives rise to the assessment of socioeconomic resilience to pandemic events in island tourism territories, which according to the UNDRR [57], should have “The ability to resist, absorb, accommodate, adapt to, transform and recover from the effects of a hazard in a timely and efficient manner, including through the preservation and restoration of its essential basic structures and functions through risk management”.
Likewise, the evaluation matrix used (see Table 3, Table 4 and Table 5) proposes five columns: theoretical indicators, useful indicators, data before the disturbing event, data after the alarming event, and source of data collection. In this regard, a difficulty in the evaluation of island territories dependent on a continental entity is the unavailability of online data at the local level and the need for centralization of relevant information at the island level. On the other hand, diverse information collection (online data, key actors) perfects the collection process. However, data availability is highly dependent on national surveys, i.e., approximately five years between each report in the case of Cozumel Island in Mexico may cause temporary data shortage without necessarily causing a regression in knowledge.
Also, the results obtained are similar to those found in Mexico and Latin America [45,58,59], which show a trend in which institutions focus mainly on the development of technical capabilities of emergency services and are highly correlated to the paradigm centered on the hazard and the infrastructural and engineering approaches [59,60,61,62].
In addition, previous studies of a pandemic or risk management in the state of Quintana Roo [20,21,45,48] also pointed to key areas for strengthening the capacities of the territory, such as diversification of economic activities, financial security, environmental impact, economic resources, marginalization of individuals, inclusiveness as well as community participation in the development of strengthening plans.
The COVID-19 lockdown in Quintana Roo, as in other Latin American countries, reduced human intervention and gave insights into how humans impact nature [5]. However, at present and after a new post-pandemic period, new ecological impacts affect diverse ecosystems [6,8,27]. This unique environmental situation is conducted as we appear from the pandemic. Therefore, governments should avoid prioritizing short-term economic gains propitiating the socioeconomic resilience of tourist activity in insular regions like Cozumel’s and determining its ability to manage a pandemic. Identifying strengths and weaknesses that compromise the coastal ecosystem and the services they provide humanity is one of the significant challenges for risk management of current governments in Mexico.

5. Conclusions

The Cozumel Island community needs better risk management in the presence of a pandemic phenomenon. However, solid bases of emergency services were noted due to their experience with hydro-meteorological phenomena. On the other hand, the need for comprehensive plans with multidisciplinary approaches was identified. Effectively, they focused on the reinforcement of technical and engineering tools. In this sense, the central axes to reinforce capacities were strengthening social participation, including the most vulnerable groups, so they can appropriate the device and become actors of their resilience. It is also essential to improve access to information on risk knowledge about pandemic phenomena and how to sensitize the community to strengthen its adaptive capacity. In addition, health and economic plans should include axes to reduce gender inequalities and marginalization. Moreover, the territory’s economic activities should be diversified to strengthen the financial capacities of individuals. Finally, the environment should be protected from the impacts of tourism, and endemic resources should be valued to become self-sufficient. In conclusion, the matrix can assist decision-makers in generating the corresponding actions when designing, implementing, and evaluating socioeconomic resilience capacities to cope with a pandemic disaster in island tourist destinations.
In this sense, the principal axes to reinforce capacities were implementing a comprehensive plan with multidisciplinary approaches containing themes like social participation, access to information, health and economic resources, gender inequalities and marginalization, environmental impacts, and endemic resources.

Author Contributions

Conceptualization, A.H. and A.S.R.-T.; Methodology, A.H., C.D.A.-B., O.F.-M. and A.S.R.-T.; Validation, O.F.-M.; Investigation, A.H., C.D.A.-B., O.F.-M. and A.S.R.-T.; Writing—original draft, A.H.; Writing—review & editing, A.H., C.D.A.-B., O.F.-M. and A.S.R.-T.; Supervision, O.F.-M. All authors have read and agreed to the published version of the manuscript.

Funding

This research was funded by the CONAHCYT grant number (1150053) and the APC was funded by MDPI and the Sustainable Development Division of the Universidad Autonoma del Estado de Quintana Roo.

Institutional Review Board Statement

Not applicable.

Informed Consent Statement

Not applicable.

Data Availability Statement

Not applicable.

Conflicts of Interest

The authors declare no conflict of interest.

Appendix A. Indicators Frequency Analysis Table

IndicatorFrequency Document
Social dimensionEducation47.62%
Health30.16%
Special needs20.63%
Gender equity14.29%
Density30.16%
Age41.27%
Civic engagement14.29%
Communication34.92%
Land use diversity26.98%
Food security12.70%
Environmental Quality14.29%
Environmental conservation9.52%
Economic dimensionHousing capital30.16%
Basic and emergency supplies33.33%
Income38.10%
Equity19.05%
Labor force52.38%
Economic diversity17.46%
Economic performance30.16%
Financial instruments security9.52%
Economic dependence4.76%
Economic infrastructures9.52%
Mobility and connectivity33.33%
Political dimensionPlanification14.29%
Previous disaster experience7.94%
Institutional quality19.05%
Power distribution9.52%
Emergency services22.22%
Budget19.05%
Participation9.52%
Mitigation capacities17.46%
Community capacities11.11%

References

  1. Gaillard, J.-C.; Maceda, E.; Stasiak, E.; Masson, L.; Berre, L.; Espaldon, M. Vulnérabilité face aux aléas naturels littoraux et accès aux ressources: Perspectives philippines. In Proceedings of the International Pluridisciplinary Conference ‘The Littoral: Challenge, Dialogue, Action, Lille, France, 16–18 January 2008. [Google Scholar]
  2. Kammouh, O.; Noori, A.Z.; Taurino, V.; Mahin, S.A.; Cimellaro, G.P. Deterministic and fuzzy-based methods to evaluate community resilience. Earthq. Eng. Eng. Vib. 2018, 17, 261–275. [Google Scholar] [CrossRef]
  3. Mayer, N. Urbanisation et Agriculture Intensive Augmentent le Risque de Pandémies. Available online: https://www.futura-sciences.com/sante/actualites/coronavirus-urbanisation-agriculture-intensive-augmentent-risque-pandemies-80160/ (accessed on 1 May 2021).
  4. Kern, J. La Destruction des Habitats Naturels Favorise L’émergence de Nouvelles Épidémies Comme le COVID-19. Available online: https://www.futura-sciences.com/sante/actualites/coronavirus-urbanisation-agriculture-intensive-augmentent-risque-pandemies-80160/ (accessed on 1 May 2021).
  5. Bates, A.E.; Mangubhai, S.; Milanés, C.B.; Rodgers, K.U.; Vergara, V. The COVID-19 pandemic as a pivot point for biological conservation. Nat. Commun. 2021, 12, 5176. [Google Scholar] [CrossRef] [PubMed]
  6. Bates, A.E.; Primack, R.B.; Biggar, B.S.; Bird, T.J.; Clinton, M.E.; Command, R.J.; Richards, C.; Shellard, M.; Geraldi, N.R.; Vergara, V.; et al. Global COVID-19 lockdown highlights humans as both threats and custodians of the environment. Biol. Conserv. 2021, 263, 109175. [Google Scholar] [CrossRef] [PubMed]
  7. Jackson, J.K. Global Economic Effects of COVID-19; Congressional Research Service: Washington, DC, USA, 2021.
  8. Perillo, G.M.E.; Botero, C.M.; Milanes, C.B.; Elliff, C.I.; Cervantes, O.; Zielinski, S.; Bombana, B.; Glavovic, B.C. Integrated coastal zone management in the context of COVID-19. Ocean Coast. Manag. 2021, 210, 105687. [Google Scholar] [CrossRef]
  9. IFRC. Drowning Just below the Surface: The Socioeconomic Consequences of the COVID-19 Pandemic; IFRC: Geneva, Switzerland, 2021. [Google Scholar]
  10. Cepal, N. América Latina y el Caribe Ante la Pandemia del COVID-19: Efectos Económicos y Sociales; IFRC: Geneva, Switzerland, 2021. [Google Scholar]
  11. Higgins-Desbiolles, F. The “war over tourism”: Challenges to sustainable tourism in the tourism academy after COVID-19. J. Sustain. Tour. 2020, 29, 551–569. [Google Scholar] [CrossRef]
  12. Foley, A.M.; Moncada, S.; Mycoo, M.; Nunn, P.; Tandrayen-Ragoobur, V.; Evans, C. Small Island Developing States in a post-pandemic world: Challenges and opportunities for climate action. WIREs Clim. Chang. 2022, 13, 769. [Google Scholar] [CrossRef]
  13. Movono, A.; Scheyvens, R. Tourism and Politics: Responses to Crises in Island States. Tour. Plan. Dev. 2022, 19, 50–60. [Google Scholar] [CrossRef]
  14. Marín, C.; Montañá, J.; Ramiréz-Rubio, O.; Ribes, M.; Chaccour, C. Como Responder a la Pandemia Desde un Estado Insular Pequeño? Available online: https://issuu.com/isglobal/docs/38_isglobal_covid-19_y_caribe_es (accessed on 12 November 2022).
  15. Briguglio, L. Small island developing states and their economic vulnerabilities. World Dev. 1995, 23, 1615–1632. [Google Scholar] [CrossRef]
  16. McElroy, J.L. Tourism development in small islands across the world. Geogr. Ann. Ser. B Hum. Geogr. 2003, 85, 231–242. [Google Scholar] [CrossRef]
  17. Mehmet, O.; Tahiroglu, M. Growth and equity in microstates. Int. J. Soc. Econ. 2002, 29, 152–162. [Google Scholar] [CrossRef]
  18. Worrell, D. Development and Stabilization in Small Open Economies: Theories and Evidence from Caribbean Experience; Taylor & Francis: Abingdon, UK, 2023. [Google Scholar]
  19. CNET. Claves Para la Recuperación de la Industría Mexicana; CNET: San Francisco, CA, USA, 2021. [Google Scholar]
  20. Damián, A.G. Vulnerabilidad cuando se depende del turismo: Covid-19 en Quintana Roo, México. Desarro. Econ. Soc. 2020, 9, 16–25. [Google Scholar] [CrossRef]
  21. Palafox-Muñoz, A.; Rubí-González, F. La gota que derramó el vaso en el turismo en Quintana Roo, México: Precariedad laboral y COVID-19. Dimens. Turísticas 2020, 4, 131–148. [Google Scholar] [CrossRef]
  22. Data Mexico. Cozumel Municipio de Quintana Roo. Available online: https://datamexico.org/es/profile/geo/cozumel (accessed on 11 May 2023).
  23. SEDETUR. Indicadores Turísticos Enero-Diciembre 2020; SEDETUR: Cancun, Mexico, 2020.
  24. Davila, F.; Bourke, R.M.; McWilliam, A.; Crimp, S.; Robins, L.; van Wensveen, M.; Alders, R.G.; Butler, J.R.A. COVID-19 and food systems in Pacific Island Countries, Papua New Guinea, and Timor-Leste: Opportunities for actions towards the sustainable development goals. Agric. Syst. 2021, 191, 103137. [Google Scholar] [CrossRef] [PubMed]
  25. Farrell, P.; Thow, A.M.; Wate, J.T.; Nonga, N.; Vatucawaqa, P.; Brewer, T.; Sharp, M.K.; Farmery, A.; Trevena, H.; Reeve, E.; et al. COVID-19 and Pacific food system resilience: Opportunities to build a robust response. Food Secur. 2020, 12, 783–791. [Google Scholar] [CrossRef] [PubMed]
  26. Duro, J.A.; Perez-Laborda, A.; Turrion-Prats, J.; Fernández-Fernández, M. COVID-19 and tourism vulnerability. Tour. Manag. Perspect. 2021, 38, 100819. [Google Scholar] [CrossRef]
  27. Milanes, C.B.; Pérez Montero, O.; Cabrera, J.A.; Cuker, B. Recommendations for coastal planning and beach management in Caribbean insular states during and after the COVID-19 pandemic. Ocean Coast. Manag. 2021, 208, 105575. [Google Scholar] [CrossRef]
  28. Melián-Alzola, L.; Fernández-Monroy, M.; Hidalgo-Peñate, M. Hotels in contexts of uncertainty: Measuring organisational resilience. Tour. Manag. Perspect. 2020, 36, 100747. [Google Scholar] [CrossRef]
  29. Bruneckiene, J.; Pekarskiene, I.; Palekiene, O.; Simanaviciene, Z. An Assessment of Socio-Economic Systems’ Resilience to Economic Shocks: The Case of Lithuanian Regions. Sustainability 2019, 11, 566. [Google Scholar] [CrossRef] [Green Version]
  30. Hallegatte, S.; Bangalore, M.; Vogt-Schilb, A.C. Socioeconomic resilience: Multi-hazard estimates in 117 countries. In World Bank Policy Research Working Paper; World Bank: Washington, DC, USA, 2016. [Google Scholar]
  31. Reghezza-Zitt, M. Utiliser la polysémie de la résilience pour comprendre les différentes approches du risque et leur possible articulation. EchoGéo 2013, 24, 13401. [Google Scholar] [CrossRef] [Green Version]
  32. Quenault, B. Retour critique sur la mobilisation du concept de résilience en lien avec l’adaptation des systèmes urbains au changement climatique. EchoGéo 2013, 24, 13403. [Google Scholar] [CrossRef] [Green Version]
  33. Wisner, B.; Gaillard, J.C.; Kelman, I. Framing disaster: Theories and stories seeking to understand Hazards, vulnerability and risk. In Handbook of Hazards and Disaster Risk Reduction; Routledge: London, UK, 2012; pp. 18–34. [Google Scholar]
  34. INEGI. México en Cifras. Cozumel, Quintana Roo (23001). In Indicadores. Grado Promedio de Escolaridad de la Población de 15 y más años (Años de Escolaridad), 2020; Instituto Nacional de Estadística y Geografía: Aguascalientes, Mexico, 2020. [Google Scholar]
  35. CONEVAL. Medición de la Pobreza, Indice de Rezago Social (IRS), Anexos Estadísticos del IRS 2000–2020; Consejo Nacional de Evaluación de la Politíca de Desarrollo Social: Mexico City, Mexico, 2020.
  36. CONEVAL. Medición de la Pobreza, Pobrezaq por Grupos Poblacionales a Escala Municipal 2010, 2015 y 2020; Consejo Nacional de Evaluación de la Politíca de Desarrollo Social: Mexico City, Mexico, 2020.
  37. INEGI. Sistema de consulta. Banco de indicadores. Demografía y Sociedad. Población. In Densidad de Población (Habitantes por Kilómetro Cuadrado), Cozumel, 2020; Instituto Nacional de Estadística y Geografía: Aguascalientes, Mexico, 2020. [Google Scholar]
  38. INEGI. Sistema de consulta. Banco de indicadores. Demografía y Sociedad. In Población. Relación de Dependencia (Porcentaje), Cozumel, 2020; Instituto Nacional de Estadística y Geografía: Aguascalientes, Mexico, 2020. [Google Scholar]
  39. CONEVAL. Medición de la Pobreza, la Cohesión Social; Consejo Nacional de Evaluación de la Politíca de Desarrollo Social: Mexico City, Mexico, 2020.
  40. INEGI. Sistema de consulta. Banco de indicadores. Demografía y Sociedad. Hogares y Vivienda. Vivienda. In Porcentaje de Viviendas Particulares Habitadas que Disponen de Internet (Porcentaje), Cozumel, 2020; Instituto Nacional de Estadística y Geografía: Aguascalientes, Mexico, 2020. [Google Scholar]
  41. CONABIO. Geo Portal Conabio, Vegetación y Uso de Suelo (73), INEGI (7), Uso del Suelo y Vegetación, Escala 1:250000, Serie VI, Uso del Suelo y Vegetación, Escala 1:250000, Serie VII; Comisión Nacional para el Conocimiento y Uso de la Biodiversidad: Mexico City, Mexico, 2021.
  42. SIAP. Acciones y Programas Cierre de la Producción Agrícola; Servicio de Información Agroalimentaria y Pesquera: Mexico City, Mexico, 2021.
  43. CONABIO. Geo Portal Conabio, Biodiversidad (14993), Índice de Capital Natural (13), Índice de Sustentabilidad de Capital Natural (ISCN); Comisión Nacional para el Conocimiento y Uso de la Biodiversidad: Mexico City, Mexico, 2019.
  44. Gobierno de Quintana Roo. Impulso a la Conservación y Uso Sustentable de Recursos Naturales. Available online: https://qroo.gob.mx/sema/2023/04/18/impulso-a-la-conservacion-y-uso-sustentable-de-recursos-naturales/ (accessed on 9 April 2023).
  45. Hafsi, A.; Frausto-Martínez, O. Community resilience to hurricane disasters in urban coastal areas: Cozumel island, Mexico. In Vulnerabilidad, Resiliencia y Riesgos Emergentes en Época de Pandemia; Una Visión Desde REDESclim; Redesclim-Conacyt; González Sosa, E., Travieso Bello, A.C., Romo Aguilar, M.D.L., Welsh Rodríguez, C.M., Eds.; Universidad Autonoma de Queretaro: Queretaro, Mexico, 2022; pp. 43–63. [Google Scholar]
  46. CONEVAL. Buscador CONEVAL, Indicadores_Cohesion_Social_Municipio_Mexico_2010-2020; Consejo Nacional de Evaluación de la Politíca de Desarrollo Social: Mexico City, Mexico, 2020.
  47. INEGI. Sistema de consulta. Banco de indicadores. Demografía y Sociedad. Empleo y ocupación. In Porcentaje de la Población de 12 años y más Económicamente Activa Ocupada (Porcentaje), Cozumel, 2020; Instituto Nacional de Estadística y Geografía: Aguascalientes, Mexico, 2020. [Google Scholar]
  48. Frausto, M.O.; Tun Chim, J.; Colín Olivares, O.; Vázquez Sosa, A.; Dzul Pech, R.; Isla Garcia, R.; Hernández Aguilar, M.L.; Campos Vargas, M.; Arroyo Arcos, L.; Palacio Aponte, G. Perfil de resiliencia urbana de la isla de Cozumel, México. In Gestión de Información Sobre Riesgi Ante Desastres Hidrometeorológicos en México. Dossier 1; Antrópica Revista de Ciencias Sociales y Humanidades: Yucatan, Mexico, 2018; Volume 4. [Google Scholar]
  49. Turimexico. Terminales Marítimas y Aéreas en Cozumel. Available online: https://www.turimexico.com/ciudades-de-mexico/cozumel/terminales-maritimas-y-aereas-en-cozumel/ (accessed on 9 May 2023).
  50. SALUD. Plan Nacional Para la Preparación y Respuesta Ante la Intensificación de la Influenza Estacional o ante una Pandemia de Influenza; Secretaria de Salud: Mexico City, Mexico, 2018.
  51. Ayuntamiento de Cozumel. Atlas de Riesgos del Municipio de Cozumel; H. Ayuntamiento de Cozumel: San Miguel de Cozumel, Mexico, 2012.
  52. Frausto Martínez, O.; Chim, J.T.; Olivares, O.C.; Sosa, A.V.; Pech, R.D.; Garcia, R.I.; Aguilar, M.L.H.; Vargas, M.C.; Arcos, L.A.; Aponte, G.P. Perfil de resiliencia urbana de la isla de Cozumel, México. Antrópica. Rev. Cienc. Soc. Humanidades 2018, 4, 215–237. [Google Scholar]
  53. Ayuntamiento de Cozumel. Presupuesto de Egresos del Ejercicio Fiscal 2019; H. Ayuntamiento de Cozumel: San Miguel de Cozumel, Mexico, 2019.
  54. Ayuntamiento de Cozumel. Presupuesto de Egresos del Ejercicio Fiscal 2023. Available online: https://cozumel.gob.mx/prensa/cabildo-aprueba-por-unanimidad-presupuesto-de-egresos-del-ejercicio-fiscal-2023/#:~:text=Por%20unanimidad%20el%20Honorable%20Ayuntamiento,con%20el%20programa%20de%20ingresos (accessed on 12 May 2023).
  55. IEQROO. Estadística Electoral Participación Ciudadana y Resultados Electorales; Instituto Electoral de Quintana Roo: Chetumal, Mexico, 2019. [Google Scholar]
  56. IEQROO. Estadística Electoral y de Participación Ciudadana; Instituto Electoral de Quintana Roo: Chetumal, Mexico, 2022. [Google Scholar]
  57. UNDRR. Sendai Framework Terminology on Disaster Risk Reduction. Resilience. Available online: https://www.undrr.org/terminology/resilience (accessed on 28 May 2023).
  58. Cid Nacer, J.; Milanés Batista, C.; Pinto Osorio, D.; Núñez Alvarez, J. La Informática y la Gestión Integrada de los sistemas de alertas tempranas dentro del manejo integrado de zonas costeras. In Estudios de caso Sobre Manejo Integrado de Zonas Costeras en Iberoamérica; Editorial Educosta: Barranquilla, Colombia, 2019. [Google Scholar]
  59. Hafsi, A.; Aguilar-Becerra, C.D.; Frausto, O.M. Sistemas de alerta temprana basado en la comunidad ante fenómenos hidrometeorológicos en localidades situadas en barras de litoral costera. In Sistemas de Alerta Temprana Ante Fenómenos Hidrometeorológicos Extremos en Mexico; Redesclim-conacyt; Martínez, O.F., Morales, J.C.H., Aguilar-Becerra, C.D., Eds.; Uagroo: Mexico City, Mexico, 2020; pp. 29–54. [Google Scholar]
  60. Basher, R. Global early warning systems for natural hazards: Systematic and people-centred. Philos. Trans. R. Soc. A Math. Phys. Eng. Sci. 2006, 364, 2167–2182. [Google Scholar] [CrossRef] [PubMed]
  61. Kelman, I.; Mercer, J.; Gaillard, J.-C. The Routledge Handbook of Disaster Risk Reduction Including Climate Change Adaptation; Routledge Londres: London, UK, 2017. [Google Scholar]
  62. Sufri, S.; Dwirahmadi, F.; Phung, D.; Rutherford, S. A systematic review of community engagement (CE) in disaster early warning systems (EWSs). Prog. Disaster Sci. 2020, 5, 100058. [Google Scholar] [CrossRef]
Figure 1. Infographics of the first stage.
Sustainability 15 11246 g001
Figure 2. Diagram evaluation of the category social resources. Based on data from Table 3 and the evaluation criteria in Table 1.
Sustainability 15 11246 g002
Figure 3. Diagram evaluation of the category of natural resources. Based on data from Table 3 and the evaluation criteria in Table 1.
Sustainability 15 11246 g003
Figure 4. Diagram evaluation of the economic dimension. Based on data from Table 4 and the evaluation criteria in Table 1.
Sustainability 15 11246 g004
Figure 5. Diagram evaluation of the institutional resources category. Based on data from Table 5 and the evaluation criteria in Table 1.
Sustainability 15 11246 g005
Figure 6. Diagram evaluation of the human resources. Based on data from Table 5 and the evaluation criteria in Table 1.
Sustainability 15 11246 g006
Table 1. ISRID Matrix table.
Theoretical IndicatorsPractical IndicatorsSources
Social dimensionSocial resourcesEducationThe average level of schooling of the population 15 years of age and older (Years of education)INEGI [34]
HealthPopulation not entitled to health services (In %)CONEVAL [35]
Special needsSocial backwardness (Index)CONEVAL [35]
Gender equityFemale population with income below the income poverty line (In %)CONEVAL [36]
DensityPopulation density (Inhabitants per square kilometer)INEGI [37]
AgeDependency ratio of Cozumel (In %)INEGI [38]
Civic engagementSocial Network Perception Index (Linker scale)CONEVAL [39]
CommunicationPercentage of inhabited private homes with Internet access (In %)INEGI [40]
Natural resourcesLand use diversityThe total area of agricultural land in the municipality (hectares)CONABIO [41]
Food securityAgricultural production (in thousands of pesos)SIAP [42]
Environmental qualityNatural Capital Sustainability Index (NCSI)CONABIO [43]
Environmental conservationExistence of environmental conservation plans (Yes/No)Gobierno de Quintana Roo [44]
Economic dimensionEconomic ResourcesHousing capitalPercentage of inhabited private housing owned (In %)UQROO [45]
Basic and emergency suppliesPopulation lacking access to essential services in housing (In %)CONEVAL [36]
IncomePopulation below the income poverty line by income (In %)CONEVAL [36]
EquityGINI Coefficient (Index)CONEVAL [46]
Labor forcePercentage of the economically active male population aged 12 years and older in employment (Percentage)INEGI [47]
Economic diversityNumber of active economic sectorsData Mexico [22]
Economic performanceProfit reinvestment (In millions of USD)Data Mexico [22]
Financial instruments securityExistence of a financial instrument security (Yes/No)UQROO [48]
Economic dependenceThe concentration of total income of the tertiary sector Cozumel (In %)Data Mexico [22]
Physical infrastructureEconomic infrastructuresNumber of economic unitsData Mexico [22]
Mobility and connectivityNumber of access points Turimexico [49]
Political dimensionPoliticalresourcesPlanificationExistence of an action plan for pandemic events (Yes/No)SALUD [50]
Earlier disaster experienceExistence of earlier pandemic disaster experience (Yes/No)H. Ayuntamiento de Cozumel [51]
Institutional qualityTrust in authorities (In %)Data Mexico [22]
Power distributionInclusive representation within the governmentNd
Emergency servicesSufficient emergency services (Yes/No)UQROO [52]
BudgetThe approved budget for the fiscal year (In millions of pesos)H. Ayuntamiento de Cozumel [53,54]
Human resourcesParticipationCitizen participation in municipal elections (%)IEQROO [55,56]
Mitigation abilitiesExistence of pandemic risk sensibilization campaign (Yes/No)UQROO [48]
Community abilitiesPopulation member of a neighbor group support (In %)UQROO [52]
Earlier disaster experienceNumber of hospital beds for emergenciesUQROO [45]
Own elaboration: Synthesis of the ISRID Matrix.
Table 2. Evaluation Criteria.
DefinitionRatingSkills
Data were available for all periods and showed an improvement or a stabilization of the highest standard.1Knowledge, resistance, absorptive, adaptive, learning, and building back better abilities.
Data were available for all periods, showing a recovery ability to the first stage.0.8Knowledge, resistance, absorptive, adaptive abilities.
Data were not available before the disruptive event but were developed after the event.0.6Knowledge and learning abilities.
Data were available for all periods and show a regression.0.4Knowledge but decrease in abilities.
Data were available before the event but not after.0.2Lack of knowledge and decrease of abilities.
Data were not available.0Lack of knowledge.
Elaboration based on the study of Hafsi and Frausto-Martínez [45].
Table 3. Social dimension results.
IndicatorPractical Indicator2015–20192020–2023Sources
Social resourcesEducationThe average level of schooling of the population 15 years of age and older (Years of education)9.510.1[34]
HealthPopulation not entitled to health services (In %)15.55%21.75%[35]
Special needsSocial backwardness (Index)−1.212684−1.133519[35]
Gender equityFemale population with income below the income poverty line (In %)43.3%52.9%[36]
DensityPopulation density (Inhabitants per square kilometer)177.1181.6[37]
AgeDependency ratio of Cozumel (In %)48.60%43%[38]
Civic engagementSocial Network Perception Index (Linker scale)MediumMedium[39]
CommunicationPercentage of inhabited private homes with Internet access (In %)45.40%70.40%[40]
Natural resourcesLand use diversityThe total area of agricultural land in the municipality (hectares)6.00 × 1062.49 × 106[41]
Food securityAgricultural production (in thousands of pesos)35.280[42]
Environmental qualityNatural Capital Sustainability Index (NCSI)At RiskNd[43]
Environmental conservationExistence of environmental conservation plans (Yes/No)YesYes[44]
Own elaboration.
Table 4. Economic dimension results.
IndicatorPractical Indicator2015–20192020–2023Sources
Economic resourcesHousing capitalPercentage of inhabited private housing owned (In %)44%55.60%[45]
Basic and emergency suppliesPopulation lacking access to essential services in housing (In %)3.6%3.2%[36]
IncomePopulation below the income poverty line by income (In %)41.8%51.6%[36]
EquityGINI Coefficient (Index)0.3630.381[46]
Labor forcePercentage of the economically active male population aged 12 years and older in employment (Percentage)97.10%98.20%[47]
Economic diversityNumber of active economic sectors18Nd[22]
Economic performanceProfit reinvestment (In millions of USD)23940[22]
Financial instruments securityExistence of a financial instrument security (Yes/No)NoNd[48]
Economic dependenceThe concentration of total income of the tertiary sector Cozumel (In %)96.2%Nd[22]
Physical infrastructureEconomic infrastructuresNumber of economic units4455Nd[22]
Mobility and connectivityNumber of access points 45[49]
Own elaboration.
Table 5. Institutional dimension results.
IndicatorPractical Indicator2015–20192020–2023Sources
Institutional resourcesPlanificationExistence of an action plan for pandemic events (Yes/No)YesYes[50]
Previous disaster experienceExistence of previous pandemic disaster experience (Yes/No)YesYes[51]
Institutional qualityTrust in authorities (In %)50.1%55.7%[22]
Power distributionInclusive representation within the governmentNdNdNd
Emergency servicesSufficient emergency services (Yes/No)YESYES[52]
BudgetThe approved budget for the fiscal year (In millions of pesos)622750[53,54]
Human resourcesParticipationCitizen participation in municipal elections (%)61%55%[55,56]
Mitigation capacitiesExistence of pandemic risk sensibilization campaign (Yes/No)NoYes[48]
Community capacitiesPopulation member of a neighbor group support (In %)57.30%Nd[52]
Medical capacityNumber of hospital beds for emergencies116146[45]
Own elaboration.
Disclaimer/Publisher’s Note: The statements, opinions and data contained in all publications are solely those of the individual author(s) and contributor(s) and not of MDPI and/or the editor(s). MDPI and/or the editor(s) disclaim responsibility for any injury to people or property resulting from any ideas, methods, instructions or products referred to in the content.

