Article

Modeling Climate Regulation of Arable Soils in Northern Saxony under the Influence of Climate Change and Management Practices

1
Chair of Computational Landscape Ecology, Faculty of Environmental Sciences, TU Dresden, Helmholtzstr. 10, 01069 Dresden, Germany
2
Helmholtz Centre for Environmental Research GmbH—UFZ, Department of Computational Landscape Ecology, Permoserstraße 15, 04318 Leipzig, Germany
*
Authors to whom correspondence should be addressed.
Sustainability 2023, 15(14), 11128; https://doi.org/10.3390/su151411128
Submission received: 27 May 2023 / Revised: 29 June 2023 / Accepted: 10 July 2023 / Published: 17 July 2023

Abstract

:
One approach to increasing the climate-regulating potential of the agricultural sector is carbon sequestration in agricultural soils. This involves storing atmospheric carbon dioxide in the soil in the form of soil organic carbon (SOC) through agricultural management practices (AMPs). Model simulations of area-specific current and future SOC stocks can be used to test appropriate AMPs. In this study, the CANDY Carbon Balance (CCB) model was used to determine how different AMPs could affect SOC stocks in a study area in northern Saxony, Germany. Specifically, we used scenarios with different intensities of sustainable AMPs to assess the potential effects of reduced tillage, crop cultivation, and fertilizer management, as well as the management of crop residues and by-products. The analysis was carried out for the simulation period 2020–2070, with and without consideration of climate change effects. The results showed an average carbon sequestration potential of 5.13–7.18 t C ha−1 for the whole study area, depending on the intensity of AMP implemented. While higher intensities of sustainable AMP implementation generally had a positive impact on carbon sequestration, the scenario with the highest implementation intensity only led to the second highest gains in SOC stocks. The most important factor in increasing SOC stocks was reduced tillage, which resulted in a carbon sequestration potential of 0.84 t C ha−1 by 2070. However, reduced application rates of fertilizers also proved to be critical, resulting in a reduction in carbon stocks of up to 2.2 t C ha−1 by 2070. Finally, the application of high-intensity sustainable AMPs was shown to be able to offset the negative impacts of an intermediate climate change scenario for most of the simulation period. Overall, the results not only confirmed existing knowledge on the effects of AMPs on carbon sequestration for a specific case study area, but also identified future management scenarios that stress the need for widespread adoption of sustainable management practices under changing climate conditions.

1. Introduction

1.1. Climate Change and the Role of SCS in the Agricultural Sector

Reducing and stabilizing anthropogenic carbon dioxide (CO2) emissions is one of the greatest challenges of our time. The recent Intergovernmental Panel on Climate Change (IPCC) Special Report on Climate Change and Land states, with high confidence, that the sector of agriculture, forestry and other land use is a significant net source of greenhouse gas emissions, accounting for 13% of the total net anthropogenic CO2 emissions per year. On the other hand, land is also a potential sink of atmospheric carbon, having absorbed 29% of global anthropogenic CO2 emissions between 2008 and 2017 [1].
One option to enhance the soil’s function as a sink for CO2 is through soil carbon sequestration (SCS), which is particularly important in the agricultural sector [2,3]. Mandal et al. defined SCS as “the process by which we could entrap CO2 from the atmosphere into the soil”, where it would be stored long-term as soil organic carbon (SOC) [4] (p. 5), [5]. A recent study commissioned by the European Parliament as part of the “Fit for 55” package underlined the importance of SCS for climate change mitigation [6]. It estimated that carbon management at farm level has the potential to offset 3–12% of the EU’s total annual greenhouse gas emissions (conservatively estimated at 26% of the EU’s annual agricultural emissions). The question now is how to realize this potential and achieve a real increase in carbon stocks. How can we transform agriculture or other land uses to maximize the storage of atmospheric CO2 in the soil, also in the face of future climate change? Several agricultural management practices (AMPs) that support carbon sequestration were already identified. Examples include strategic residue management and mulching, effective use of fertilizers or conservation tillage [3,4]. However, the effectiveness of these measures varies across regions and depends on climatic and edaphic conditions [7,8,9,10,11,12].

1.2. Modeling SOC Stocks for Different Regions and Scenarios

To analyze the potential of SCS for different regions, models are used that simulate, in a simplified way, changes in SOC stocks and distributions under different scenarios of agricultural management or climatic conditions [13]. The use of such models allows the identification of critical drivers and approaches for mitigation measures that cannot be determined directly in the field [4,14]. Different management or climate scenarios are often modeled to evaluate and compare different potential future directions or pathways [15,16,17]. The outcomes of such scenarios are used by scientists and policy makers to develop long-term planning strategies. In the case of SOC modeling, for example, the improved understanding of the anthropogenic influence on climate change is used as a basis for decision makers to incentivize appropriate management practices [4,6,13].

1.3. Scope of This Study

The aim of this study was to analyze the SCS potential of a case study region for different management and climate scenarios. Specifically, we used four scenarios with different implementation intensities of sustainable AMPs to assess the relevance of different management options (reduced tillage, cultivated crops, fertilizer management, management of crop residues and byproducts) for increasing SOC stocks of the study area. The analysis was carried out for the simulation period 2020–2070, with and without consideration of climate change effects. The study area is part of the ECO²SCAPE project, which is testing agricultural measures to protect biodiversity and ecosystem services in order to engage farmers in the future design of conservation measures. We used the CANDY Carbon Balance (CCB) model, which simulates the annual dynamics of topsoil SOC concentration based on site-specific environmental conditions. Moreover, we analyzed the influence of the different management options and climate change on SOC stocks individually. In this way, we aim to contribute to a better understanding of how AMPs can contribute to climate change mitigation.

2. Materials and Methods
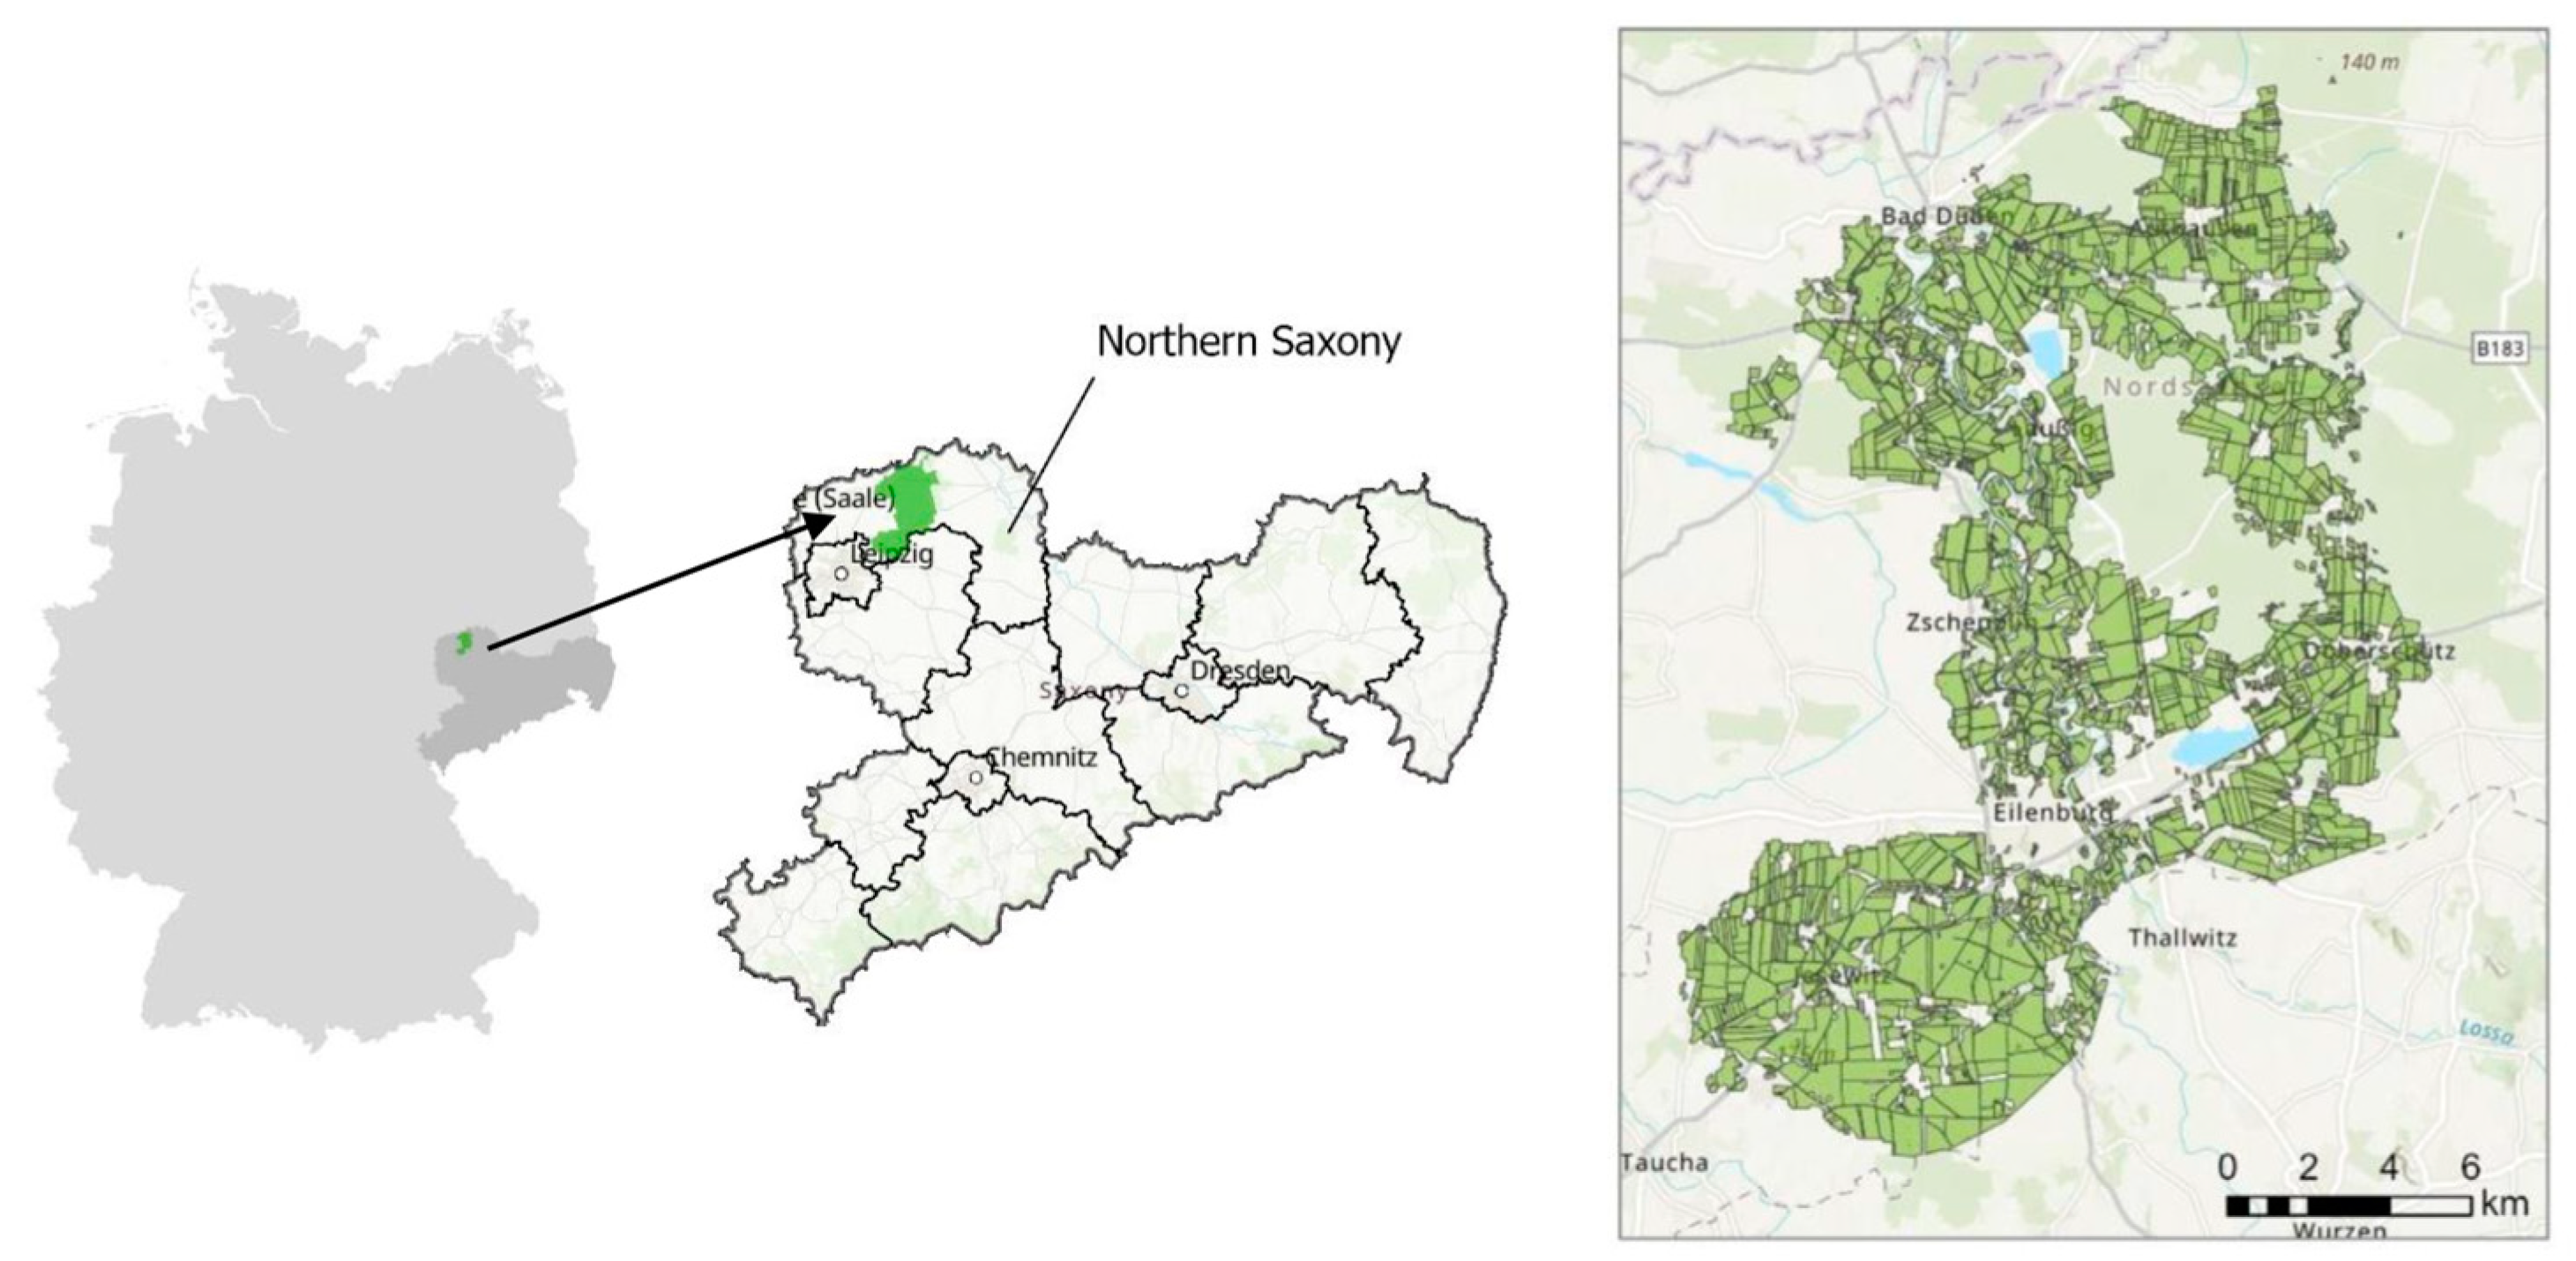
The work on this study was divided into three parts (Figure 1). First, the model was set up for the period 2016–2019 using case-study specific input data. Second, a business as usual (BaU) scenario and three scenarios of low, medium and high intensity of sustainable AMP implementation were developed. Each scenario was tested with and without climate change impacts, leading to a set of eight scenarios. Finally, the impact of five individual drivers on the regional SCS potential was analyzed.

2.1. Study Area

The study area “Vereinigte Mulde” is located in relatively flat terrain in the northwestern part of Saxony (Figure 2) [18]. It is part of the Mulde River basin and is characterized by relatively low precipitation (<550 mm), average annual temperatures of 9.1 °C (period: 1961–1990) and 9.9 °C (period: 1991–2005) and limited soil water retention [19]. The dry, warm diluvial soils of the eastern German lowlands are relatively acidic and sandy, making them less fertile and low-yielding [20,21,22]. Consequently, the region in which the study area is located is considered an area of limited suitability for agricultural use. Nevertheless, 49.2% of the study area consists of cropland and 17.6% of permanent grassland. The rest entails forest (26.2%), urban areas (4.3%), water bodies (1.5%) and heathland (1.1%). The cropland is mainly cultivated with wheat, rapeseed, barley and maize (period: 2016–2019) [23]. Due to its multifunctional use, the study area is representative of many cultural landscapes in Germany and Europe, where biodiversity and ecosystem services are threatened by the intensity of agricultural and tourism use, among others [24,25]. In this study, we focused on 2614 agricultural fields in this area, which had an average size of 6.4 ha and covered a total area of 16,717 ha.

2.2. The CCB Model

The CCB model [26] was selected for this study because of its ability to work with limited input data at the farm level while taking into account all relevant site conditions that influence SOC stocks. It was developed based on the CANDY (Carbon-Nitrogen-Dynamics) model [27,28] and simplified in such a way that the required data input is on a “level that is usually known by farmers” [26] (p. 119) and is, therefore, more suitable for answering practice-oriented research questions. The CCB model was validated for various site conditions and cropping systems and was applied in several German case studies, also close to the model region [7,9,26,29,30,31]. While some of these applications analyzed and validated the carbon balance and ongoing trends at the field scale [7,26] and considered the carbon sequestration potential of specific measures such as minimum tillage [29] and crop residue management [30], other studies conducted regional scale analyses [9,31], addressed climate change aspects [32], or included CCB in a multi-model ensemble [33].
The CCB model simulates SOC dynamics in the topsoil (0 to 30 cm) at annual time steps, while considering three pools of SOC (active, stabilized, long-term stabilized) and several pools of fresh organic matter (FOM). The FOM pools are partially crop yield dependent and differentiated by the origin of the organic substances (crop by-products, crop residues, organic fertilizers). More information on the structure and functioning of the CCB model can be found in Franko et al. [26]. CCB uses an indicator for the potential turnover rate that influences the fluxes between pools—the biologic active time (BAT), given as the number of microbial active days per year [34]. The BAT approach divides time into intervals with BAT (assuming of optimal conditions for SOC turnover) and without BAT (suboptimal environment for SOC turnover) and sums up the number of days with BAT per year. BAT is determined by the site-specific environmental conditions, including air temperature, precipitation, soil physical parameters and tillage system [26,29,35]. In this study, the ’regional mode’ of the CCB model was used, which was developed for medium to large-scale studies [9]. In the ‘regional mode’, management activities are given as area shares. These area proportions of, e.g., tillage, crop residues or applied fertilizer can be used when not all input data are available per field, which was the case in this study [9,34]. The CCB model simulates the annual dynamics of soil organic matter (SOM) concentration, mineralization and reproduction and provides a number of output variables [34]. The outputs considered in this study include the dynamics in the carbon amount in SOM (CSOM) in kg C ha−1, the annual carbon flux from FOM to SOM (Crep) in kg C ha−1 a−1, and BAT in microbial active days per year (dmad yr−1). Crep and BAT were included because they drive changes in soil carbon storage, indicate trends and provide insights into possible reasons for SOC stock dynamics [36]. The SCS potential of a simulated scenario was defined as the CSOM increase within the scenario period (see Section 2.4). The application of the regional mode led to results that can only be evaluated as an average or total value for the entire study area rather than for each individual field. The weighted average was calculated based on the size of the fields.

2.3. Input Data, Model Set-Up and Initialisation

Input parameters that were relevant within the scope of this study included data on climate, soil properties, initial SOC values and agricultural management. The data were assigned to each field, based on the Integrated Administration and Control System (IACS) dataset for the years 2016 to 2019, which was provided by the Saxon State Ministry for Energy, Climate Protection, Environment and Agriculture for the objectives of the ECO²SCAPE project. Average annual climate data for air temperature and precipitation were obtained as raster data (1 × 1 km) from the Climate Data Center [37,38]. Soil properties were derived from the “Bodenkundliche Landesaufnahme Sachsen” (BK50), which contained results of soil surveys in Saxony at a scale of 1:50,000 [39,40]. We used data on the soil texture type, percentage of clay, silt and sand content (taken from [41]), skeleton content (obtained from the soil database “BK LBF 2020 Horizont” from [42]), bulk density and carbon inert factor (i.e., defining the fraction of long-term stabilized carbon).
CCB requires agricultural management data on crop cultivation and yields, crop residues and by-products, irrigation, mineral and organic fertilizers and tillage for each field. Information on cultivated crops per field was obtained from the IACS dataset. 35 crop types were parameterized in the CCB model. Data for annual crop yields were mostly obtained from the Statistical Office of Saxony [43,44,45,46], considering the region of Northern Saxony. Data for set-asides, grass and clover and other arable crops were based on additional sources [47,48,49,50,51] (for detailed information, see Table S1 in the Supplementary Material). The removal rate of crop by-products (e.g., straw) from agricultural fields was set to 20% for cereals [9] and to 30% for rapeseed and other arable crops [52]. Irrigation was parameterized for potatoes, sugar beets and vegetables [53,54,55], assuming an annual application rate of 64.6 mm ha−1 [54]. Application rates of organic fertilizers were estimated based on regional livestock numbers [56,57,58,59], assuming that all the excrement produced was applied to the fields. The average amount of slurry, liquid manure and solid manure per animal category was calculated based on typical excrement production rates per animal [60] (Table S3 in the Supplementary Material). The proportion of land used for application of liquid and solid organic fertilizers as well as mineral fertilizers was based on information from the Statistical Office of Saxony [61]. Information on the amount of mineral fertilizers was obtained from the “Stoffbilanz Viewer” [62]. For set-aside land, it was assumed that no fertilizer was applied. Input data on the use of reduced tillage were available for the crop groups wheat, barley, rapeseed, maize, sugar beet and rye based on a survey among farmers in Saxony in 2018 [20]. For all other crops, the area shares of reduced tillage were estimated based on data from the Statistical Office of Saxony [63] (for the years 2016 and 2017) and VisDat Geodatentechnologie GmbH [62] (for the years 2018 and 2019). For the set-aside and grassland areas, it was assumed that their entire area was managed with reduced tillage.
The initial values for SOC in M% were based on samples collected at 82 sites in and close to the study area between 2014 and 2017 [64,65]. For fields without samples, initial SOC values were predicted using the ordinary kriging method in ArcGIS and were then assigned to each field. The values ranged from 1.06 M% to 14.9 M%, with a weighted average of 2.59 M%. After setting initial SOC values for each field, CCB was used to model a spin-up period between 2016 and 2019 to further initialize the carbon model for the scenarios. The resulting SOC values for 2019 served as initial SOC values for the scenario runs starting in 2020.

2.4. Scenario Development and Model Application

Four scenarios with increasing implementation intensity of sustainable AMPs were designed, each of them with and without consideration of climate change impacts. An overview of the resulting eight scenarios can be found in Figure 1. A timeframe of five decades (2020–2070) was chosen for the scenarios in order to show a trend in SOC stock development. The BaU scenario can be seen as the baseline scenario that examines the consequences of continuing current management practices. Specifically, we assumed that the initial management practices from the spin-up period between 2016 and 2019 would be repeated until 2070. The idea of increasing the intensity of AMPs throughout the scenarios arises from the assumption that current funding on EU and national level explicitly supports sustainable AMPs. These AMPs target climate change mitigation, among other environmental objectives in the agricultural sector [66,67]. In the scenarios, we focused on the combined effect of AMPs on SOC stocks, as the effect of single measures on SOC stocks could be enhanced or reduced in combination with other measures [68,69]. In Scenario 1 (Sc1), we implemented the first changes in management, such as an introduction of marginal strips on agricultural fields or an increase in reduced tillage and crop-residues left on the field. This scenario represents a weak implementation intensity of sustainable AMPs, while Scenario 2 (Sc2) and Scenario 3 (Sc3) represent medium and strong implementation, respectively.
All changes applied in the scenarios were based on the selection of important driving factors of soil carbon that can be addressed by adapting specific measures and that could be represented in the CCB model. These factors include reduced tillage, cultivated crops and fertilizer management, as well as management of crop residues and byproducts. Moreover, specific adjustments of these management practices within the scenarios are based on the new scheme for agri-environment-climate measures in Saxony [67]. These measures support the extensification of arable land, including an introduction of marginal strips and increase in set-asides, an increase in the cultivation of legumes, grass and clover and a reduction in the cultivation of maize. For example, consistent with agri-environmental and climate measures, we assumed an increase in marginal strips and a decrease in crop yields on marginal strips throughout the scenarios. At the same time, we increased the area with crop residues and by-products left on the fields. In the following, we provide an overview of the most scenario assumptions. Detailed information on the changes per parameter and scenario can be found in Table S4 in the Supplementary Materials.
In terms of crops, we changed the area of specific crop types and the amount of yields for each crop type. Specifically, the area of grass, clover, legumes and set-aside were increased from Sc1 to Sc3, while the area cultivated with maize was decreased and gradually replaced by legumes, grass and clover. In Sc3, either legumes or grass and clover covered the initial area of maize (8.6% of the study area). In addition, marginal strips cultivated with barley, oats, rye, triticale, wheat and other cereals were introduced and increased from 4.6% in Sc1 to 15.3% in Sc3. The areas with reduced removal of crop residues and byproducts were increased proportionally from Sc1 to Sc3 for all crop types. The same was carried out regarding the area share of reduced tillage. On the areas with marginal strips, the share of crop residues and byproducts that remained on the field as well as the share of reduced tillage was set to 100%. Finally, the share of fertilized fields was reduced to 0% in Sc3 for legume fields and fields with grass and clover, and the amount of fertilizers were decreased on all fields.
For the scenarios with climate change, the model input data were adapted based on the intermediate climate scenario of the Representative Concentration Pathway (RCP) 4.5, which stands for an approximate radiative forcing level of 4.5 W/m2 in 2100 (relative to 1750) [70]. For Saxony, this was translated into an average temperature increase of 1.6 °C (until 2100) compared to the period 2016–2019. We assumed a linear increase in temperature, which resulted in a change of 0.02 °C per year. At the same time, the mean precipitation per field was linearly reduced by 11% (1.12 mm per year) until 2070 according to Spekat and Enke [71].

2.5. Analysis of Driving Factors

We conducted a sensitivity analysis by determining the impact of the five different driving factors on simulated SOC stocks between 2020 and 2070: cultivated crops, reduced tillage, management of crop residues and byproducts, fertilizer management and climate change (Figure 1). To analyze the sensitivity of each driver, the BaUnoCC scenario was run four times. Each time, only one driving factor was changed according to its changes in scenario Sc3 to produce the most distinctive effect in the comparison to the baseline BaU scenario. For example, to evaluate the impact of reduced removal of crop residues and by-products on SOC stocks, we used the BaUnoCC scenario and adjusted the crop residues parameters in that model, using the same percentages of crop residues per field as in Sc3 (for values and ranges of the agricultural driving factors, see Table S4 in Supplementary Material, for values of climate see Section 2.4). Finally, we compared the results with the original BaUnoCC results for the year 2070. To evaluate only the sensitivity of the driving factor, it had to be taken into account that the BaUnoCC itself also led to an increase in SOC. Therefore, the effect of the BaUnoCC on the CSOM values was subtracted for each field. Finally, the difference in the change in SOC stocks caused by the driving factors between the first (2020) and the last year of the simulation period (2070) was analyzed and presented as boxplots. To analyze the impact of climate change on SOC stocks, we compared the final SOC stocks of the BaUnoCC and the BaUCC scenarios in 2070.

3. Results

3.1. Scenario Results

Based on the scenarios tested in this study, we calculated a total SCS potential of 85,705 t C (BaUCC)—120,072 t C (Sc2noCC) on average for the case study area “Vereinigte Mulde” until 2070. In all scenarios, the SOC stocks increased during the simulation period with an average additional gain of 6.18 t C ha−1. However, there were strong differences between the scenarios, as shown in Figure 3. When comparing the growth in SOC stocks between 2020 and 2070 for scenarios without climate change, the increase was lowest for BaUnoCC (6.17 t C ha−1, growth by 6.0%) and Sc1noCC (6.33 t C ha−1, growth by 6.2%), while Sc3noCC (7.03 t C ha−1, growth by 6. 8%) and Sc2noCC (7.18 t C ha−1, growth by 7.0%) showed larger gains. This sequence of scenarios in terms of the amount of carbon stored in SOM was the same for the scenarios with climate change. However, the SCS potential of the study area was significantly lower under climate change conditions (e.g., BaUCC increased by 5.0% and Sc2CC by 6.1%). Figure 3 also shows that scenarios with climate change and a high degree of sustainable management practices (i.e., Sc2CC and Sc3CC) have the potential to store more carbon than scenarios without climate change and lower degrees of sustainable management for most of the simulation period. Specifically, Sc2CC stored more carbon on average per hectare than BaUnoCC between 2021 and 2069, Sc1noCC between 2022 and 2060 and Sc3noCC between 2021 and 2032. The annual increase in SOC stocks declined over time for all scenarios, changing from 3.5‰ in 2020 to 2021 to 0.3‰ in 2069 to 2070. The increase in SOC implies that, for all scenarios, the carbon inputs to the soil must exceed the carbon decomposition.
The average annual reproduction flux from FOM to SOM (Crep), and, thus, the carbon input, decreased from BaU to Sc3, indicating a negative effect on SOC storage. Crep was highest in the BaUCC scenario (2289 kg C ha−1 yr−1) and lowest in Sc3noCC (2021 kg C ha−1 yr−1). As shown in Figure 4, there was little difference in Crep between the scenarios with and without climate change. However, the scenario results with climate change had a slightly higher Crep (e.g., the average Crep for BaUCC was 0.29 kg C ha−1 yr−1 higher than for BaUnoCC). Figure 4 also shows that the differences in Crep between scenarios increased from scenario to scenario. It was largest between Sc2 and Sc3.
The decrease in carbon turnover (BAT) from BaU to Sc3 (Figure 5) implies a positive effect on the overall SCS potential of the study region. Figure 5 also shows that in both climate change cases, the BaU scenario had the highest BAT values, while Sc3 had the lowest BAT values. While the BAT values for the scenarios without climate change remained stable within the simulation period, the BAT values for the scenarios with climate change increased by an average of 5.6% between 2020 and 2070. Similar to the Crep results, the differences between the average scenario values varied in magnitude. For the scenarios without climate change, the difference between BaUnoCC and Sc1noCC was the smallest at about 1.2 dmad yr−1, while the difference between Sc1noCC and Sc2noCC was the largest at about 1.85 dmad yr−1.

3.2. Sensitivity of Driving Factors

The five main drivers analyzed in the scenarios had different effects on the simulated soil carbon dynamics, as shown in Figure 6. The change in CSOM between the first and last year of the simulation period is shown in t C ha−1 for Sc3. Compared to the initial SOC stocks, decreases in soil carbon were observed from 2020 to 2070 due to a reduction in fertilizer application rates (−2172 kg C ha−1 on average), climate change effects (−897 kg C ha−1 on average) and changes in cultivated crops (−8 kg C ha−1 on average), while positive changes were caused by an increase in crop residues and byproducts (+422 kg C ha−1 on average) and reduced tillage (+839 kg C ha−1 on average).
The figure also shows that the effects of reduced removal of crop residues and by-products and reduced tillage on carbon storage were always positive, while the effects of climate change were always negative. On the other hand, the effects of changing crop cultivation and reducing fertilizer application were negative on average, but could also be positive due to land use changes between the scenarios. Fertilizer management showed the largest interquartile range of all boxplots (7252 kg C ha−1), also reaching into the positive spectrum. In the result tables of the CCB model run, it could be observed that these positive data points all belonged to marginal strips in Sc3. The driving factor of changes in cultivated crops also showed a large dispersion of data and the largest spread of outliers in both the positive and negative spectra. The data points with a strong positive change mostly belonged to set-aside fields in the BaU scenario and were marginal strips in Sc3, cultivated with cereal with reduced yield. Fields with a strong negative change were mostly marginal strips cultivated with cereals with a reduced yield and previously cultivated with permanent grassland.

4. Discussion

4.1. Increase in SOC Stocks under Different Scenarios

The results of this study showed an increase in SOC stocks with increasing use and implementation intensity of sustainable AMPs. This is in line with other studies analyzing the importance of sustainable AMPs for climate change mitigation and future agri-environment-climate policies [4,11,72,73]. Depending on the scenario, the total increase in SOC in our study area between 2020 and 2070 ranged from 5.13 to 7.18 t C ha−1. This was in good agreement with the results of Lugato et al. [73], who found an average increase of 0–25 t C ha−1 between 2010 and 2100 in the southern part of eastern Germany under current land management practices. We found that even the continuation of current management practices, as in the BaU scenarios, led to an increase in SOC stocks. However, it also became clear that the scenarios with higher intensities of sustainable AMPs have a higher potential to sequester carbon and contribute to climate regulation. The fact that even the BaU scenario led to an increase in SOC levels may be due to already ongoing changes in agricultural land management, which increased carbon inputs to soil and reduced carbon turnover rates in our study region [9]. These trends can be attributed to changes in crop cultivation and organic amendments on the one hand, and to an increased use of conservation tillage on the other hand [9,20], and were also identified at the European level [73].
While the difference between the BaU-scenario and Sc1 was quite small, the stronger implementation of sustainable management practices in Sc2 and Sc3 led to a much larger increase in the potential for sequestering carbon in the soil. This indicates that strong changes in AMP are required to achieve significant benefits for the SOC stocks in the case study region. The fact that the scenario with the medium implementation of sustainable AMPs (Sc2) led to higher increases in SOC than the strongest implementation of sustainable AMPs (Sc3) can be attributed to a comparatively small reduction in turnover rate (Figure 5) and a comparatively large decline in carbon input (Figure 4) from Sc2 to Sc3. The reduction in the turnover rate in Sc3 was quite small, due to the implementation of reduced tillage on all fields in Sc3, and was not able to offset the reduction in the carbon influx to SOM. In contrast, the large reduction in the carbon input is likely due to the large reduction in fertilizer use and the widespread application of marginal strips with lower yields in Sc3. Both trends can, thus, be attributed to the combination of measures within the scenarios. As shown in our results, some of the sustainable AMPs had a negative impact on the SCS potential (e.g., marginal strips, reduced application of organic fertilizers), even if their overall environmental impact was positive (e.g., considering water quality and biodiversity).
Moreover, the model results showed that scenarios with climate change had increasing carbon turnover values (Figure 5) and, thus, a lower overall potential for SOC storage. Accordingly, we found a negative effect of climate change on future SOC stocks in our analysis of driving factors (Figure 6). This is consistent with the results of other studies analyzing climate change impacts on soil carbon (e.g., [74,75]), including those near the case study region [9,76]. Essentially, higher temperatures increase the turnover of carbon in the soil [75]. The sustainable AMPs tested in our study were able to offset the observed impacts of climate change on soil carbon stocks for limited periods of time. In the case of Sc2, the climate change effect could even be compensated for almost the entire simulation period and was only overtaken in the year 2070. This implies that we can actually use soils as a carbon sink despite climate change if AMPs are implemented quickly and on a large scale.

4.2. Effects of the Driving Factors

The analysis of the driving factors showed that the increase in conservation tillage is the most important contributor to the overall gains in SOC storage in the study area, while reduced fertilization is the most important contributor to the overall losses in SOC. These results are consistent with the findings of Liu et al. [77] and Luo et al. [78] on the effects of tillage and with findings of Paustian et al. [3] on the effects of fertilization. Other studies identifying fertilization as the most influential factor on SOC stocks compared to other driving factors include Bolinder et al. [72], Lessmann et al. [11], Minasny et al. [79] and Roß et al. [80]. The driving factor of climate change had the second strongest negative effect. Both rising temperatures and decreasing precipitation have an effect on carbon sequestration in the soil, with temperatures being the primary determining factor [74]. The positive effects of crop residues remaining on the field on SOC stocks were also observed in other studies [30,81,82]. However, it should be noted that the effects of crop residues on SOC stocks are strongly dependent on the quality and quantity of the crop residues [83,84]. The effects of changes in crop cultivation on SOC stocks can be both positive and negative. This can be attributed to two factors: (1) the changed composition of crop types. For example, the replacement of maize by grass, clover and legumes in Sc3 results in a higher carbon input, which has a positive effect on SOC stocks; (2) the lower yield on marginal strips results in less carbon input to the soil, which, thus, has a negative effect on SOC stocks. In our study, fertilizer management can also have positive or negative effects on SOC. However, it should be noted that a reduced application of organic fertilizers always leads to a reduction in carbon input and, thus, to a reduction in SOC [3,11,72]. In our case, less fertilizer was applied overall, which explains the mean negative effect on SOC. However, more managed field margins were added throughout the scenarios where organic fertilizer was also applied to previously unfertilized fields. Thus, on these fields, fertilizer management has a positive effect on SOC.
The results suggest that the observed decrease in carbon input was mainly due to the reduction in fertilizer application and the changes in crop cultivation (i.e., lower yields on marginal strips). These seem to offset the positive effect of increased amounts of crop residues left on the field. The decrease in carbon turnover from the BaU scenario to Sc3 can be attributed to reduced tillage (see Figure 6).

4.3. Implications of This Study

Our study identified several options for strengthening the climate regulation function of the agricultural sector in our case study region through targeted agricultural management. It became clear that a more intensive implementation of sustainable management strategies, such as reduced tillage or an increase in crop residues left on the field, can make a strong contribution to SCS. The agri-environment-climate measures, on which we based the development and implementation of the scenarios, were already supporting the implementation of environmentally friendly measures in arable land and grassland for more than 30 years [85]. Overall, there is an increase in SOC stocks of Saxony and in many parts of Europe, which is probably due to the already existing positive trends in AMPs such as reduced tillage and residue management as well as the inclusion of biogas production and its related digestate applications into the agricultural system [86]. In Saxony, grassland-based measures mainly focus on biodiversity targets (e.g., habitat creation and species and biotope protection), while arable land measures are intended to contribute to soil protection, e.g., by reducing soil erosion and improving soil fertility, among other aspects (e.g., reducing nutrient input into water bodies, creating habitats for species [87]). It is widely known and was also shown in this study that carbon management at farm level has a high potential to offset greenhouse gas emissions [6]. EU policies that further support farms in SCS, such as the Farm to Fork Strategy, the 2030 Climate Target Plan and the Ecosystem Restoration goals, can, thus, build on a wide range of studies that model and analyze the effects of AMPs on SOC or identify novel pathways for strategic SCS.

4.4. Limitations and Outlook

Our study had several limitations. First, we based the scenarios on several assumptions. These include the specific changes in crop cultivation, fertilizer application, reduced tillage, crops residue management and climate change. We based our assumptions on the schemes for agri-environment-climate measures and consulted other studies for concrete implementation. Nevertheless, some assumptions might be unrealistic, such as the conversion of unfertilized fields to fertilized marginal strips or the addition of marginal strips to all fields regardless of the cultivation (e.g., set-aside). Especially when evaluating Sc3, it is important to keep in mind that this is the most extreme scenario, and its assumptions were made to study boundary conditions (e.g., marginal strips covering 15.3% of the study area). In regional SOC assessments, it is typically challenging to initialize SOC concentrations because SOC levels can vary widely within a region and the number and spatial distribution of monitoring data points are typically limited [88,89]. This limited availability of monitoring data and the regional scale of the assessment also prevented a case study specific calibration and validation procedure of the CCB model. The fact that we observed an increase in SOC stocks in our BaU scenario may indicate that our initial SOC values were too low. However, we used a large number of monitoring points for model initialization to minimize potential errors. Furthermore, we expect this to have only a limited impact on the scenario results, especially with respect to their relative comparison. Several limitations of our study are related to the general restrictions of the CCB model. CCB only simulates the topsoil and potential effects of drivers and measures on deeper soil layers cannot be investigated, which is relevant, for example, for reduced tillage [90]. Furthermore, CCB does not simulate plant growth and effects of climate change on future crop yields and, thus, carbon input to soil were not considered in this study.
Further studies could include a spatially diversified analysis within the study area, the inclusion of more detailed data and the interrelation with other nutrients. For example, there is consensus that nitrogen is needed to sequester more carbon [91,92] and some practices of soil carbon management (e.g., reduced tillage, crop residues) were found to interact with nitrous oxide and thus could offset the amount of sequestered carbon [93]. Furthermore, the effect of different crop species cultivated on SOC stocks as well as the influence of their respective C:N ratio, biomass, time of planting and other factors could be subject of future studies. Additionally, a focus on other possible drivers or combinations of AMPs and stronger climate change scenarios would be of interest. Field-specific data could allow spatial analysis and the identification of hotspots for SCS. On a broader scale, research is also needed to identify other barriers to implementation than solely biophysical ones (including economic, social, institutional and political constraints) [94].
Finally, the findings of this study are not transferable to other areas as the input data and conditions for SCS are site-specific. Therefore, similar studies in other areas could help to create detailed overviews of regional SCS potential.

5. Conclusions

In order to understand the role of agricultural soils in climate mitigation within the next decades, the regional potential of SCS under different management has to be analyzed. We simulated the changes in SOC stocks under possible scenarios with different intensities of sustainable AMPs for the next five decades and analyzed the influence of individual drivers on SOC in a case study region in Saxony, Germany.
SOC stocks in the study area increased in all scenarios between 2020 and 2070, but with a declining growth rate. The results suggest that agricultural soils will contribute to climate regulation in the case of an intermediate climate change (following the RCP 4.5). Our results also confirmed the findings of other studies claiming that the climate-regulating function of soils is strongly influenced by AMPs. We identified the increase in conservation tillage (positive impact) and reduced fertilization (negative impact) as the most critical driving factors of SOC storage. Moreover, it seems likely that stronger climate change scenarios could prevent SOC growth at a certain point if not compensated by high-intensity management practices.
Studies with similar frameworks help to identify suitable AMPs, and, thus, starting points for mitigation actions, and can provide a basis for decision makers to incentivize appropriate management practices. The results of this study suggest that changes in agricultural management in northern Saxony should especially focus on tillage, crop residues and fertilizer management to mitigate climate change.

Supplementary Materials

The following supporting information can be downloaded at: https://www.mdpi.com/article/10.3390/su151411128/s1, Table S1: Overview of yield per crop group from 2016–2019; Table S2: Overview of management data (area shares) per crop group from 2016–2019; Table S3: Overview of the input data for manure and fertilizer; Table S4: Overview of the development of the parameters in the four scenarios.

Author Contributions

Conceptualization, L.S., L.H. and F.W.; methodology, L.S., L.H. and F.W.; formal analysis, L.S.; investigation, L.S.; data curation, L.S., L.H. and F.W.; writing—original draft preparation, L.S.; writing—review and editing, L.S., L.H. and F.W.; supervision, L.H. and F.W.; funding acquisition, L.H. All authors have read and agreed to the published version of the manuscript.

Funding

This research made possible by funding from the BMBF (German Federal Ministry of Education and Research) for the project ECO²SCAPE (Grant number: 16LW0079K). The Article Processing Charges (APC) were funded by the joint publication funds of the TU Dresden, including Carl Gustav Carus Faculty of Medicine, and the SLUB Dresden as well as the Open Access Publication Funding of the DFG.

Institutional Review Board Statement

Not applicable.

Informed Consent Statement

Not applicable.

Data Availability Statement

Essential data presented in this study are included within the article and supplementary material or openly available as listed in the References section. Additional data that support the findings of this study are available from the corresponding author upon on reasonable request. These additional datasets are not publicly available due to license restrictions in the original datasets. The CCB software are available on the website of the Helmholtz-Centre for Environmental Research—UFZ: https://www.ufz.de/index.php?en=44046 (accessed on 1 June 2022). In this study, we used the CCB version 2019.1.16.

Acknowledgments

We would like to thank Anna Cord for her advice and support during the study, Anne Paulus for her support in modeling yield data and to Michael Strauch for his support with the soil data.

Conflicts of Interest

The authors declare no conflict of interest. The funders had no role in the design of the study; in the collection, analyses, or interpretation of data; in the writing of the manuscript; or in the decision to publish the results.

References

  1. Intergovernmental Panel on Climate Change. Summary for Policymakers. In Climate Change and Land: An IPCC Special Report on Climate Change, Desertification, Land Degradation, Sustainable Land Management, Food Security, and Greenhouse Gas Fluxes in Terrestrial Ecosystems; Intergovernmental Panel on Climate Change, Ed.; Cambridge University Press: Cambridge, UK; New York, NY, USA, 2019; pp. 1–36. [Google Scholar]
  2. Intergovernmental Panel on Climate Change. Climate Change 2014: Synthesis Report; Contribution of Working Groups I, II and III to the Fifth Assessment Report of the Intergovernmental Panel on Climate Change: Geneva, Switzerland, 2014. [Google Scholar]
  3. Paustian, K.; Lehmann, J.; Ogle, S.; Reay, D.; Robertson, G.P.; Smith, P. Climate-smart soils. Nature 2016, 532, 49–57. [Google Scholar] [CrossRef] [PubMed] [Green Version]
  4. Mandal, A.; Majumder, A.; Dhaliwal, S.S.; Toor, A.S.; Mani, P.K.; Naresh, R.K.; Gupta, R.K.; Mitran, T. Impact of agricultural management practices on soil carbon sequestration and its monitoring through simulation models and remote sensing techniques: A review. Crit. Rev. Environ. Sci. Technol. 2022, 52, 1–49. [Google Scholar] [CrossRef]
  5. Paustian, K.; Larson, E.; Kent, J.; Marx, E.; Swan, A. Soil C Sequestration as a Biological Negative Emission Strategy. Front. Clim. 2019, 1, 8. [Google Scholar] [CrossRef]
  6. McDonald, H.; Frelih-Larsen, A.; Lorant, A.; Duin, L.; Pyndt Andersen, S.; Costa, G.; Bradley, H. Carbon Farming: Making Agriculture Fit for 2030; Study for the committee on Environment, Public Health and Food Safety (ENVI) PE 695.482; Policy Department for Economic, Scientific and Quality of Life Policies, European Parliament: Luxembourg, 2021; Available online: https://www.europarl.europa.eu/RegData/etudes/STUD/2021/695482/IPOL_STU(2021)695482_EN.pdf (accessed on 21 October 2022).
  7. Franko, U.; Diel, J.; Ruehlmann, J. Applying CCB to predict management change affected long-term SOM turnover of the Extended Static Fertilization Experiment in Bad Lauchstädt. Eur. J. Soil Sci. 2021, 73, e13148. [Google Scholar]
  8. Smith, P.; Smith, J.U.; Franko, U.; Kuka, K.; Romanenkov, V.A.; Shevtsova, L.K.; Wattenbach, M.; Gottschalk, P.; Sirotenko, O.D.; Rukhovich, D.I.; et al. Changes in mineral soil organic carbon stocks in the croplands of European Russia and the Ukraine, 1990–2070; comparison of three models and implications for climate mitigation. Reg. Environ. Chang. 2007, 7, 105–119. [Google Scholar] [CrossRef]
  9. Witing, F.; Gebel, M.; Kurzer, H.-J.; Friese, H.; Franko, U. Large-scale integrated assessment of soil carbon and organic matter-related nitrogen fluxes in Saxony (Germany). J. Environ. Manag. 2019, 237, 272–280. [Google Scholar] [CrossRef]
  10. Zhao, G.; Bryan, B.A.; King, D.; Luo, Z.; Wang, E.; Song, X.; Yu, Q. Impact of agricultural management practices on soil organic carbon: Simulation of Australian wheat systems. Glob. Chang. Biol. 2013, 19, 1585–1597. [Google Scholar] [CrossRef]
  11. Lessmann, M.; Ros, G.H.; Young, M.D.; de Vries, W. Global variation in soil carbon sequestration potential through improved cropland management. Glob. Chang. Biol. 2022, 28, 1162–1177. [Google Scholar] [CrossRef]
  12. Searchinger, T.; Waite, R.; Hanson, C.; Ranganathan, J. Creating a Sustainable Food Future: A Menu of Solutions to Feed Nearly 10 Billion People by 2050; Final Report; World Resources Institute: Washington, DC, USA, 2019. [Google Scholar]
  13. Food and Agricultural Organization of the United Nations. Measuring and Modelling Soil Carbon Stocks and Stock Changes in Livestock Production Systems: Guidelines for Assessment; Version 1; Livestock Environmental Assessment and Performance (LEAP) Partnership: Rome, Italy, 2019. [Google Scholar]
  14. Amelung, W.; Bossio, D.; de Vries, W.; Kögel-Knabner, I.; Lehmann, J.; Amundson, R.; Bol, R.; Collins, C.; Lal, R.; Leifeld, J.; et al. Towards a global-scale soil climate mitigation strategy. Nat. Commun. 2020, 11, 5427. [Google Scholar] [CrossRef]
  15. Kriegler, E.; O’neill, B.C.; Hallegatte, S.; Kram, T.; Lempert, R.J.; Moss, R.H.; Wilbanks, T. The need for and use of socio-economic scenarios for climate change analysis: A new approach based on shared socio-economic pathways. Glob. Environ. Chang. 2012, 22, 807–822. [Google Scholar] [CrossRef]
  16. Pastor, A.V.; Nunes, J.P.; Ciampalini, R.; Bahri, H.; Annabi, M.; Chikhaoui, M.; Crabit, A.; Follain, S.; Keizer, J.J.; Latron, J.; et al. ScenaLand: A simple methodology for developing land use and management scenarios. Mitig. Adapt. Strat. Glob. Chang. 2022, 27, 52. [Google Scholar] [CrossRef]
  17. Gutzler, C.; Helming, K.; Balla, D.; Dannowski, R.; Deumlich, D.; Glemnitz, M.; Knierim, A.; Mirschel, W.; Nendel, C.; Paul, C.; et al. Agricultural land use changes—A scenario-based sustainability impact assessment for Brandenburg, Germany. Ecol. Indic. 2015, 48, 505–517. [Google Scholar] [CrossRef] [Green Version]
  18. Landesamt Für Umwelt, Landwirtschaft und Geologie. Die Vergleichsgebiete in Sachsen: Zusammenstellung Standörtlicher Bedingungen Für Die Landwirtschaft und Flächennutzung. 2012. Available online: https://www.landwirtschaft.sachsen.de/download/RAWIS_Natuerliche_Bedingungen_VG.pdf (accessed on 26 October 2022).
  19. Sächsisches Staatsministerium für Energie, Klimaschutz, Umwelt und Landwirtschaft. Vergleichsgebiet 10—Dübener-Dahlener Heide. Available online: https://www.landwirtschaft.sachsen.de/vergleichsgebiet-10-duebener-dahlener-heide-15205.html (accessed on 26 October 2022).
  20. Lülfs-Baden, F.; Barrett, S.; Schulze Höping, M.; Stahl, H. Situation der Bodenbearbeitung in Sachsen: Eine Analyse zur Verbreitung Verschiedener Bodenbearbeitungsverfahren und der Damit Verbundenen Technischen Ausstattung; Schriftenreihe des LfULG Heft 5; Landesamt für Umwelt, Landwirtschaft und Geologie: Dresden, Germany, 2020. [Google Scholar]
  21. Sächsisches Staatsministerium für Energie, Klimaschutz, Umwelt und Landwirtschaft. Boden-Klima-Räume. Available online: https://www.landwirtschaft.sachsen.de/boden-klima-raeume-15281.html (accessed on 26 October 2022).
  22. Landesamt für Umwelt, Landwirtschaft und Geologie. Böden der Altmoränenlandschaften. Available online: https://www.boden.sachsen.de/boden-der-altmoranenlandschaften-17982.html (accessed on 16 October 2022).
  23. Sächsisches Staatsministerium für Energie, Klimaschutz, Umwelt und Landwirtschaft. Integriertes Verwaltungs- und Kontrollsystem (InVeKoS) Sachsen. 2020. Available online: https://www.smekul.sachsen.de/ (accessed on 11 October 2022).
  24. Forschung für Nachhaltigkeit. ECO²SCAPE—Partizipativer Biodiversitätsschutz Durch Verbindung ökologischer und ökonomischer Perspektiven. Available online: https://www.fona.de/de/aktuelles/nachrichten/2021/eco2scape.php (accessed on 25 July 2022).
  25. Hölting, L.; Komossa, F.; Filyushkina, A.; Gastinger, M.-M.; Verburg, P.H.; Beckmann, M.; Volk, M.; Cord, A.F. Including stakeholders’ perspectives on ecosystem services in multifunctionality assessments. Ecosyst. People 2020, 16, 354–368. [Google Scholar] [CrossRef]
  26. Franko, U.; Kolbe, H.; Thiel, E.; Ließ, E. Multi-site validation of a soil organic matter model for arable fields based on generally available input data. Geoderma 2011, 166, 119–134. [Google Scholar] [CrossRef]
  27. Franko, U. Modelling Approaches of Soil Organic Matter Turnover within the CANDY System; Evaluation of Soil Organic Matter Models, I (38); Springer: Berlin/Heidelberg, Germany, 1996. [Google Scholar]
  28. Franko, U.; Oelschlägel, B.; Schenk, S. Simulation of temperature-, water- and nitrogen dynamics using the model CANDY. Ecol. Model. 1995, 81, 213–222. [Google Scholar] [CrossRef]
  29. Franko, U.; Spiegel, H. Modeling soil organic carbon dynamics in an Austrian long-term tillage field experiment. Soil Tillage Res. 2016, 156, 83–90. [Google Scholar] [CrossRef]
  30. Spiegel, H.; Sandén, T.; Dersch, G.; Baumgarten, A.; Gründling, R.; Franko, U. Soil Organic Matter and Nutrient Dynamics Following Different Management of Crop Residues at Two Sites in Austria. In Soil Management and Climate Change; Elsevier: Amsterdam, The Netherlands, 2018; pp. 253–265. ISBN 9780128121283. [Google Scholar]
  31. Witing, F.; Volk, M.; Franko, U. Modeling Soil Organic Carbon Dynamics of Arable Land across Scales: A Simplified Assessment of Alternative Management Practices on the Level of Administrative Units. Agronomy 2023, 13, 1159. [Google Scholar] [CrossRef]
  32. Franko, U.; Witing, W.; Volk, M. Climate Change Induced Carbon Competition: Bioenergy Versus Soil Organic Matter Reproduction. In Atlas of Ecosystem Services: Drivers, Risks, and Societal Responses; Schröter, M., Bonn, A., Klotz, S., Seppelt, R., Baessler, C., Eds.; Springer: Cham, Switzerland, 2019; pp. 257–262. ISBN 978-3-319-96228-3. [Google Scholar]
  33. Riggers, C.; Poeplau, C.; Don, A.; Bamminger, C.; Höper, H.; Dechow, R. Multi-model ensemble improved the prediction of trends in soil organic carbon stocks in German croplands. Geoderma 2019, 345, 17–30. [Google Scholar] [CrossRef]
  34. Franko, U.; Witing, F.; Thiel, E.; Ließ, E.; Diel, J.; Gasser, A. CCB Manual: Version 20.19.1.14; Umweltforschungszentrum: Halle, Germany, 2019. [Google Scholar]
  35. Franko, U.; Oelschlägel, B. Einfluss von klima und textur auf die biologische aktivität beim umsatz der organischen bodensubstanz. Arch. Agron. Soil Sci. 1995, 39, 155–163. [Google Scholar] [CrossRef]
  36. Franko, U.; Ruehlmann, J. SOC sequestration as affected by historic and present management. Geoderma 2018, 321, 15–21. [Google Scholar] [CrossRef]
  37. DWD Climate Data Center. Annual Grids of Monthly Averaged Daily Air Temperature (2m) over Germany: Version v1.0. 2022. Available online: https://opendata.dwd.de/climate_environment/CDC/grids_germany/annual/air_temperature_mean/DESCRIPTION_gridsgermany_annual_air_temperature_mean_en.pdf (accessed on 13 August 2022).
  38. DWD Climate Data Center. Annual Sum of Monthly Precipitation Grids over Germany: Version v1.0. 2022. Available online: https://opendata.dwd.de/climate_environment/CDC/grids_germany/annual/precipitation/DESCRIPTION_gridsgermany_annual_precipitation_en.pdf (accessed on 13 August 2022).
  39. Bräunig, A. Erläuterung zur BK50: Bodenkundliche Landesaufnahme Sachsen im Maßstab 1:50,000; Landesamt für Umwelt, Landwirtschaft und Geologie: Dresden, Germany, 2020. [Google Scholar]
  40. Sächsisches Staatsministerium für Energie, Klimaschutz, Umwelt und Landwirtschaft. Bodenkarte 1:50.000 Sachsen. 2022. Available online: https://www.boden.sachsen.de/digitale-bodenkarte-1-50-000-19474.html (accessed on 22 July 2022).
  41. Bundesanstalt für Geowissenschaften und Rohstoffe; Staatlichen Geologischen Diensten. Bodenkundliche Kartieranleitung; 5. verbess. und erw. Auflage; Bundesanstalt für Geow. und Rohstoffe: Hannover, Germany, 2005; ISBN 3510959205. [Google Scholar]
  42. Sächsisches Staatsministerium für Energie, Klimaschutz, Umwelt und Landwirtschaft. Bodenkarte 1:50.000 Sachsen: Horizontabfolge der Leitbodenformen Wird Mit Charakteristischen Bodenparametern. 2020. Available online: https://luis.sachsen.de/fachbereich-boden-bodenkarte-bk50.html (accessed on 20 July 2022).
  43. Statistisches Landesamt des Freistaates Sachsen. Bodennutzung und Ernte im Freistaat Sachsen: Feldfrüchte, Baumobst, Strauchbeeren und Gemüse 2016; Statistischer Bericht C II 2—j/16; Statistisches Landesamt des Freistaates Sachsen: Kamenz, Germany, 2017.
  44. Statistisches Landesamt des Freistaates Sachsen. Bodennutzung und Ernte im Freistaat Sachsen: Feldfrüchte, Baumobst, Strauchbeeren und Gemüse 2017; Statistischer Bericht C II 2—j/17; Statistisches Landesamt des Freistaates Sachsen: Kamenz, Germany, 2018.
  45. Statistisches Landesamt des Freistaates Sachsen. Bodennutzung und Ernte im Freistaat Sachsen: Feldfrüchte, Baumobst, Strauchbeeren und Gemüse 2018; Statistischer Bericht C II 2—j/18; Statistisches Landesamt des Freistaates Sachsen: Kamenz, Germany, 2019.
  46. Statistisches Landesamt des Freistaates Sachsen. Bodennutzung und Ernte im Freistaat Sachsen: Feldfrüchte, Baumobst, Strauchbeeren und Gemüse 2019; Statistischer Bericht C II 2—j/19; Statistisches Landesamt des Freistaates Sachsen: Kamenz, Germany, 2020.
  47. Landesanstalt für Landwirtschaft und Gartenbau Sachsen-Anhalt. Verordnung über die Anwendung von Düngemitteln, Bodenhilfsstoffen, Kultursubstraten und Pflanzenhilfsmitteln nach den Grundsätzen der Guten Fachlichen Praxis Beim Düngen. Gültig für Sachsen-Anhalt. 2019. Available online: https://llg.sachsen-anhalt.de/fileadmin/Bibliothek/Politik_und_Verwaltung/MLU/LLFG/Dokumente/04_themen/pfl_ernaehr_duengung/Richtwerte/2019_rw_gesamt_duengerecht.pdf (accessed on 20 October 2022).
  48. Landesamt für Umwelt, Landwirtschaft und Geologie. Fachliche Informationen zu den Planungsdaten. 2022. Available online: https://www.landwirtschaft.sachsen.de/download/Fachl_Info_042022.pdf (accessed on 19 October 2022).
  49. Landwirtschaftskammer Nordrhein-Westfalen. Zwischenfruchtanbau. 2015. Available online: https://www.landwirtschaftskammer.de/Landwirtschaft/ackerbau/zwischenfruechte/index.htm (accessed on 20 July 2022).
  50. Vollrath, B. Energetische Verwertung von kräuterreichen Ansaaten in der Agrarlandschaft und im Siedlungsbereich: Eine ökologische und Wirtschaftliche Alternative bei der Biogasproduktion; Schlussbericht zum Forschungsvorhaben Nr. 22005308 (08NR053); Bayerische Landesanstalt für Weinbau und Gartenbau: Veitshöchheim, Germany, 2012. [Google Scholar]
  51. Land Niedersachsen (2020): Monitoring zur Nährstofffixierung durch mehrjährige Wildpflanzen auf Praxisflächen in Niedersachsen: Abschlussbericht 2020. Available online: https://www.3-n.info/projekte/abgeschlossene-projekte/monitoring-zur-naehrstofffixierung-durch-mehrjaehrige-wildpflanzen-auf-praxisflaechen-in-niedersachsen.html (accessed on 21 September 2022).
  52. Scarlat, N.; Martinov, M.; Dallemand, J.-F. Assessment of the availability of agricultural crop residues in the European Union: Potential and limitations for bioenergy use. Waste Manag. 2010, 30, 1889–1897. [Google Scholar] [CrossRef] [PubMed]
  53. Jäkel, K.; Gramm, M. Aktuelle Situation der Feldbewässerung in Sachsen: Ergebnisse einer Betriebsbefragung in sächsischen Landwirtschaftsbetrieben; Landesamt für Umwelt, Landwirtschaft und Geologie: Dresden, Germany, 2013. [Google Scholar]
  54. Statistisches Landesamt des Freistaates Sachsen. Landwirtschaftszählung 2010: Landwirtschaftliche Produktionsmethoden im Freistaat Sachsen. C/LZ 2010-6. 2010. Available online: https://www.statistischebibliothek.de/mir/servlets/MCRFileNodeServlet/SNHeft_derivate_00003926/C_LZ_2010_6_SN.pdf;jsessionid=1C8BE1ED64BF1A4520F0E59383FB7DCE (accessed on 18 October 2022).
  55. Statistisches Bundesamt. Land- und Forstwirtschaft, Fischerei: Bodenbearbeitung, Bewässerung, Landschaftselemente. Erhebung über landwirtschafliche Produktionsmethoden (ELPM); Fachserie 3 Heft 5, Wiesbaden. 2011. Available online: https://www.destatis.de/DE/Themen/Branchen-Unternehmen/Landwirtschaft-Forstwirtschaft-Fischerei/Produktionsmethoden/Publikationen/Downloads-Produktionsmethoden/bodenbearbeitung-bewaesserung-2032805109004.pdf?__blob=publicationFile (accessed on 18 October 2022).
  56. Statistisches Landesamt des Freistaates Sachsen. Viehbestände in den Landwirtschaftlichen Betrieben im Freistaat Sachsen: Agrarstrukturerhebung; C III 3 -/16; Statistisches Landesamt des Freistaates Sachsen: Kamenz, Germany, 2016.
  57. Statistisches Landesamt des Freistaates Sachsen. Viehbestände im Freistaat Sachsen: Mai 2017; C III 8—hj 1/17; Statistisches Landesamt des Freistaates Sachsen: Kamenz, Germany, 2017.
  58. Statistisches Landesamt des Freistaates Sachsen. Viehbestände im Freistaat Sachsen: Mai 2018; C III 8—hj 1/18; Statistisches Landesamt des Freistaates Sachsen: Kamenz, Germany, 2019.
  59. Statistisches Landesamt des Freistaates Sachsen. Viehbestände im Freistaat Sachsen: November 2019; C III 8—hj 2/19; Statistisches Landesamt des Freistaates Sachsen: Kamenz, Germany, 2020.
  60. Landwirtschaftliches Technologiezentrum Augustenberg. Stammdatensammlung: Düngung BW: Stand 05.07.2021; Landwirtschaftliches Technologiezentrum Augustenberg: Rheinstetten, Germany, 2021. [Google Scholar]
  61. Statistisches Landesamt des Freistaates Sachsen. Landwirtschaftszählung 2020: Wirtschaftsdünger Tierischer Herkunft in den Landwirtschaftlichen Betrieben im Freistaat Sachsen; C VII 6- 10j/20; Statistisches Landesamt des Freistaates Sachsen: Kamenz, Germany, 2021.
  62. VisDat Geodatentechnologie GmbH. STOFFBILANZ Viewer. Available online: https://viewer.stoffbilanz.de/?lang=de (accessed on 24 July 2022).
  63. Statistisches Landesamt des Freistaates Sachsen. Ausgewählte Strukturdaten Landwirtschaftlicher Betriebe im Freistaat Sachsen, 2016: Korrekturausgabe; C IV 12—u/16; Statistisches Landesamt des Freistaates Sachsen: Kamenz, Germany, 2018.
  64. Landesamt für Umwelt, Landwirtschaft und Geologie. Unveröffentliche Daten zur SOC Messungen Einzelner Standorte im Untersuchungsgebiet Vereinigte Mulde, 2014–2016; Statistisches Landesamt des Freistaates Sachsen: Kamenz, Germany, 2022.
  65. Poeplau, C.; Don, A.; Flessa, H. Erste Bodenzustandserhebung Landwirtschaft: Kerndatensatz; Johann Heinrich von Thünen-Institut: Göttingen, Germany, 2020; Available online: https://www.openagrar.de/receive/openagrar_mods_00054877 (accessed on 20 August 2022).
  66. European Commission. Common Agricultural Policy for 2023–2027: 28 CAP Strategic Plans at a Glance. 2022. Available online: https://agriculture.ec.europa.eu/common-agricultural-policy/cap-overview/cap-2023-27_en#documents (accessed on 20 August 2022).
  67. Sächsisches Staatsministerium für Energie, Klimaschutz, Umwelt und Landwirtschaft. Richtlinie des Sächsischen Staatsministeriums für Energie, Klimaschutz, Umwelt und Landwirtschaft zur Förderung von Maßnahmen der umweltgerechten Flächenbewirtschaftung im Freistaat Sachsen: Förderrichtlinie Agrarumwelt- und Klimamaßnahmen; FRL AUK/2023; Sächsisches Staatsministerium für Energie, Klimaschutz, Umwelt und Landwirtschaft: Dresden, Germany, 2022.
  68. Kroschewski, B.; Richter, C.; Baumecker, M.; Kautz, T. Effect of crop rotation and straw application in combination with mineral nitrogen fertilization on soil carbon sequestration in the Thyrow long-term experiment Thy_D5. Plant Soil 2022, 474, 1–16. [Google Scholar] [CrossRef]
  69. Liu, X.; Herbert, S.; Hashemi, A.; Zhang, X.; Ding, G. Effects of agricultural management on soil organic matter and carbon transformation—A review. Plant Soil Environ. 2006, 52, 531–543. [Google Scholar] [CrossRef] [Green Version]
  70. Intergovernmental Panel on Climate Change. Summary for Policy Makers. Contribution of Working Groups I, II and III to the Fifth Assessment Report of the Intergovernmental Panel on Climate Change. In Climate change 2014: Mitigation of Climate Change: Contribution of Working Group III to the Fifth Assessment Report of the Intergovernmental Panel on Climate Change; Intergovernmental Panel on Climate Change, Ed.; Cambridge University Press: Cambridge, UK; New York, NY, USA, 2014; ISBN 9781107058217. [Google Scholar]
  71. Spekat, A.; Enke, W. Regionale Klimaprojektionen für Sachsen: WMSax2.0; Bereitstellung eines Ensembles regionaler Klimaprojektionen für Sachsen; Schriftenreihe des LfULG 3/2020; Landesamt für Umwelt, Landwirtschaft und Geologi: Dresden, Germany, 2020. [Google Scholar]
  72. Bolinder, M.A.; Crotty, F.; Elsen, A.; Frac, M.; Kismányoky, T.; Lipiec, J.; Tits, M.; Tóth, Z.; Kätterer, T. The effect of crop residues, cover crops, manures and nitrogen fertilization on soil organic carbon changes in agroecosystems: A synthesis of reviews. Mitig. Adapt. Strat. Glob. Chang. 2020, 25, 929–952. [Google Scholar] [CrossRef]
  73. Lugato, E.; Panagos, P.; Bampa, F.; Jones, A.; Montanarella, L. A new baseline of organic carbon stock in European agricultural soils using a modelling approach. Glob. Chang. Biol. 2014, 20, 313–326. [Google Scholar] [CrossRef]
  74. Falloon, P.; Jones, C.D.; Cerri, C.E.; Al-Adamat, R.; Kamoni, P.; Bhattacharyya, T.; Easter, M.; Paustian, K.; Killian, K.; Coleman, K.; et al. Climate change and its impact on soil and vegetation carbon storage in Kenya, Jordan, India and Brazil. Agric. Ecosyst. Environ. 2007, 122, 114–124. [Google Scholar] [CrossRef]
  75. Crowther, T.W.; Todd-Brown, K.E.O.; Rowe, C.W.; Wieder, W.R.; Carey, J.C.; Machmuller, M.B.; Snoek, B.L.; Fang, S.; Zhou, G.; Allison, S.D.; et al. Quantifying global soil carbon losses in response to warming. Nature 2016, 540, 104–108. [Google Scholar] [CrossRef] [Green Version]
  76. Franko, U.; Witing, F.; Jäckel, G.; Volk, M. Large-scale identification of hot spots for soil carbon demand under climate change and bioenergy production. J. Plant Nutr. Soil Sci. 2015, 178, 199–208. [Google Scholar] [CrossRef]
  77. Liu, E.; Teclemariam, S.G.; Yan, C.; Yu, J.; Gu, R.; Liu, S.; He, W.; Liu, Q. Long-term effects of no-tillage management practice on soil organic carbon and its fractions in the northern China. Geoderma 2014, 213, 379–384. [Google Scholar] [CrossRef]
  78. Luo, Z.; Wang, E.; Sun, O.J. Can no-tillage stimulate carbon sequestration in agricultural soils? A meta-analysis of paired experiments. Agric. Ecosyst. Environ. 2010, 139, 224–231. [Google Scholar] [CrossRef]
  79. Minasny, B.; Malone, B.P.; McBratney, A.B.; Angers, D.A.; Arrouays, D.; Chambers, A.; Chaplot, V.; Chen, Z.-S.; Cheng, K.; Das, B.S.; et al. Soil carbon 4 per mille. Geoderma 2017, 292, 59–86. [Google Scholar] [CrossRef]
  80. Roß, C.-L.; Baumecker, M.; Ellmer, F.; Kautz, T. Organic Manure Increases Carbon Sequestration Far beyond the “4 per 1000 Initiative” Goal on a Sandy Soil in the Thyrow Long-Term Field Experiment DIV.2. Agriculture 2022, 12, 170. [Google Scholar] [CrossRef]
  81. Chowdhury, S.; Farrell, M.; Butler, G.; Bolan, N. Assessing the effect of crop residue removal on soil organic carbon storage and microbial activity in a no-till cropping system. Soil Use Manag. 2015, 31, 450–460. [Google Scholar] [CrossRef]
  82. Lehtinen, T.; Schlatter, N.; Baumgarten, A.; Bechini, L.; Krüger, J.; Grignani, C.; Zavattaro, L.; Costamagna, C.; Spiegel, H. Effect of crop residue incorporation on soil organic carbon and greenhouse gas emissions in European agricultural soils. Soil Use Manag. 2014, 30, 524–538. [Google Scholar] [CrossRef]
  83. Stella, T.; Mouratiadou, I.; Gaiser, T.; Berg-Mohnicke, M.; Wallor, E.; Ewert, F.; Nendel, C. Estimating the contribution of crop residues to soil organic carbon conservation. Environ. Res. Lett. 2019, 14, 094008. [Google Scholar] [CrossRef]
  84. Shahbaz, M.; Kuzyakov, Y.; Sanaullah, M.; Heitkamp, F.; Zelenev, V.; Kumar, A.; Blagodatskaya, E. Microbial decomposition of soil organic matter is mediated by quality and quantity of crop residues: Mechanisms and thresholds. Biol. Fertil. Soils 2017, 53, 287–301. [Google Scholar] [CrossRef]
  85. Batáry, P.; Dicks, L.V.; Kleijn, D.; Sutherland, W.J. The role of agri-environment schemes in conservation and environmental management. Conserv. Biol. 2015, 29, 1006–1016. [Google Scholar] [CrossRef] [Green Version]
  86. Witing, F.; Prays, N.; O’Keeffe, S.; Gründling, R.; Gebel, M.; Kurzer, H.-J.; Daniel-Gromke, J.; Franko, U. Biogas production and changes in soil carbon input—A regional analysis. Geoderma 2018, 320, 105–114. [Google Scholar] [CrossRef] [Green Version]
  87. Paulus, A.; Hagemann, N.; Baaken, M.C.; Roilo, S.; Alarcón-Segura, V.; Cord, A.F.; Beckmann, M. Landscape context and farm characteristics are key to farmers’ adoption of agri-environmental schemes. Land Use Policy 2022, 121, 106320. [Google Scholar] [CrossRef]
  88. Dimassi, B.; Guenet, B.; Saby, N.P.; Munoz, F.; Bardy, M.; Millet, F.; Martin, M.P. The impacts of CENTURY model initialization scenarios on soil organic carbon dynamics simulation in French long-term experiments. Geoderma 2018, 311, 25–36. [Google Scholar] [CrossRef]
  89. Foereid, B.; Bellamy, P.H.; Holden, A.; Kirk, G.J.D. On the initialization of soil carbon models and its effects on model predictions for England and Wales. Eur. J. Soil Sci. 2012, 63, 32–41. [Google Scholar] [CrossRef]
  90. Haddaway, N.R.; Hedlund, K.; Jackson, L.E.; Kätterer, T.; Lugato, E.; Thomsen, I.K.; Jørgensen, H.B.; Isberg, P.-E. How does tillage intensity affect soil organic carbon? A systematic review. Environ. Evid. 2017, 6, 30. [Google Scholar] [CrossRef] [Green Version]
  91. Soussana, J.-F.; Lutfalla, S.; Smith, P.; Lal, R.; Chenu, C.; Ciais, P. Letter to the Editor: Answer to the Viewpoint “Sequestering Soil Organic Carbon: A Nitrogen Dilemma”. Environ. Sci. Technol. 2017, 51, 11502. [Google Scholar] [CrossRef] [PubMed]
  92. van Groenigen, J.W.; van Kessel, C.; Hungate, B.A.; Oenema, O.; Powlson, D.S.; van Groenigen, K.J. Sequestering Soil Organic Carbon: A Nitrogen Dilemma. Environ. Sci. Technol. 2017, 51, 4738–4739. [Google Scholar] [CrossRef] [Green Version]
  93. Li, C.; Frolking, S.; Butterbach-Bahl, K. Carbon Sequestration in Arable Soils is Likely to Increase Nitrous Oxide Emissions, Offsetting Reductions in Climate Radiative Forcing. Clim. Chang. 2005, 72, 321–338. [Google Scholar] [CrossRef]
  94. Lalic, B.; Marcic, M.; Sremac, A.F.; Eitzinger, J.; Koci, I.; Petric, T.; Ljubojevic, M.; Jezerkic, B. Landscape Modelling and Decision Support; Mirschel, W., Terleev, V.V., Wenkel, K.-O., Eds.; Springer International Publishing: Cham, Switzerland, 2020; ISBN 978-3-030-37420-4. [Google Scholar]
Figure 1. Workflow of the study. (BaU = Business as Usual, Sc = Scenario, noCC = without climate change, CC = with climate change).
Sustainability 15 11128 g001
Figure 2. Location of the study area within Germany.
Sustainability 15 11128 g002
Figure 3. Development of the amount of carbon in SOM from 2020 to 2070 (a) under the different scenarios and (b) compared to the values of the scenario Business as Usual without climate change. (BaU = Business as Usual, Sc = Scenario, noCC = without climate change, CC = with climate change).
Sustainability 15 11128 g003
Figure 4. Average annual value of the carbon flux from fresh organic matter to soil organic matter (Crep) from 2020 to 2070 for the scenarios.
Sustainability 15 11128 g004
Figure 5. Development of carbon turnover conditions (BAT) from 2020 to 2070 for each scenario. (BaU = Business as Usual, Sc = Scenario, noCC = without climate change, CC = with climate change).
Sustainability 15 11128 g005
Figure 6. Effect of different driving factors on change in carbon amount in SOM (comparison of 2020–2070).
Sustainability 15 11128 g006
Disclaimer/Publisher’s Note: The statements, opinions and data contained in all publications are solely those of the individual author(s) and contributor(s) and not of MDPI and/or the editor(s). MDPI and/or the editor(s) disclaim responsibility for any injury to people or property resulting from any ideas, methods, instructions or products referred to in the content.

