Article

The Impact of Orientation on Living Wall Façade Temperature: Manchester Case Study

1
Department of Design and Built Environment, School of Arts and Humanities, University of Huddersfield, Huddersfield HD1 3DH, UK
2
Centre for Urban Design, Architecture and Sustainability, Department of Design and Built Environment, School of Arts and Humanities, University of Huddersfield, Huddersfield HD1 3DH, UK
*
Author to whom correspondence should be addressed.
Sustainability 2023, 15(14), 11109; https://doi.org/10.3390/su151411109
Submission received: 25 May 2023 / Revised: 5 July 2023 / Accepted: 14 July 2023 / Published: 17 July 2023
(This article belongs to the Special Issue Urban Design for Sustainable Built Environment)

Abstract

:
Living walls are a nature-based strategy to enhance climate resilience in urban areas. There is a need to study the possible influence of living walls on the thermal performance of building façades, given the rising temperatures in 2022 across the UK. This study aims to analyze the impacts of living walls on façade temperature based on orientation variation through simulation Envi-met 5.0.3. software. The living wall studied is attached to a multistory building located in Manchester city center consisting of seven evergreen plants. An environmental simulation was carried out linked to the 2022 climate, including extremely hot and cold days. Four scenarios of façades with and without greening on the northwest and southeast orientations in summer and winter were analyzed. The results highlighted the living wall’s ability to reduce the surface temperatures on both the northwest and southeast façades on a hot summer day. There is no significant evidence of improvement for the northwest façade in the winter climate, but a modestly increased temperature is shown in the southeast compared to the bare wall. These findings indicate that living walls provide measurable advantages in the building envelope, leading to energy saving.

1. Introduction

Urbanization is recognized to cause a rise in urban heat island (UHI) intensity, especially in rapidly growing cities [1,2,3], potentially harming the environment and human health [4,5]. The UK is not immune to these fast urbanizing effects contributing to the rising temperature. An investigation using findings from a high-density urban monitoring network demonstrated that local warming (on a particular day) could exceed 8 °C [6]. A maximum summer intensity of 8 °C was also recently measured in Manchester [7]. Similarly, research measuring UHI during the winter in Birmingham city center showed a rise of +2.3 °C, and another study indicates that the summer UHI would cause an increase in heat-related health problems [8]. As the built environment affects the surface energy balance and causes UHI, high-performance building envelope approaches should be used to reduce the negative impacts [9]. Modifying the building envelope can reduce UHI [10,11,12] and reduce the energy required for indoor cooling [13]. A successful mitigation strategy for boosting resistance to the effects of global warming is to use methods for reducing heat gain by using urban surface parameters on large spatial scales [14].
In this paper, the terms GW (green wall) and VGS (vertical greening system) are used interchangeably, and LWs (Living Walls) and GFs (Green Façades) have different constructions according to their scientific classification. LWs generally refer to vertical gardens mounted to building walls [15]; in contrast, a GF is a wall covered with greenery, such as climbing plants planted on the ground, on roofs, or climbing through supporters. Additionally, LWs have more complicated structural designs due to the variety of plants, substrate characteristics, watering systems, and air gaps which affect LW thermal efficiency.
Researchers and practitioners have widely accepted the VGS as a helpful strategy to mitigate adverse UHI effects on an urban scale [16,17,18,19]. Without taking up any space on the street level on a city scale, a GW contributes to the integration of plants into the urban environment [20]. The analysis results of previous studies suggest that a GW reduces building energy use for heating and cooling by up to 16.5% and 51%, respectively, and can reduce UHI in all the investigated climate zones by up to 5% [21]. The existing research [15,22,23,24] also demonstrates that a GW is an effective strategy for saving energy in buildings. Furthermore, a GW potentially increases biodiversity in urban areas [25], adds value to properties [26], and improves health and well-being [27]. However, a study has shown that LWs can lower the surface temperature of façades compared to GFs in a tropical climate in Singapore [28]. Currently, a few studies have considered the effect of LWs in climate zones such as those experienced in the UK, that is, in maritime/moist climates with a moderate annual temperature range, including cold and wet winters and warm and wet summers. It is beneficial to examine the potential effects of LWs on the thermal efficiency of building façades in circumstances where the temperature in the UK continues to rise, especially since 2022 experienced the highest annual average temperature [29]. In addition, the plant species already utilized by companies and the impact of orientation will have different effects in the UK compared to tropical countries where warm conditions are currently more frequently experienced. Therefore, it is essential to study the utilization of plants that might be used to advance understanding in this area.
VGSs are increasingly being used in the UK, especially in megacities like Manchester. Building façades become “greener” based on owners’ priorities, building envelope potential, and company products. More studies about VGS installation are required to ensure the practical usage of GW products because there are not many studies in the UK that are specifically focused on the thermal performance of GWs in extreme weather. Despite having a significant influence on both the summer and winter urban environment and the thermal performance of buildings [30], the thermal behavior of a VGS depends on the climate conditions and needs further examination. The extent of the energy benefits also varies with the GW orientation. Hence, it is crucial to make sure that LWs do not contribute to rising energy usage during the winter in climates such as Manchester. The characteristics of the plants themselves also play a significant role in the effectiveness of LWs. Charoenkit and Yiemwattana [15] indicate that in tropical climates, plants with small leaves and dense foliage have the greatest performance in reducing surface temperature.
The project’s goal is to examine the impact of LWs on the thermal exchange of the building surfaces in Manchester in 2022. A case study of a multistory building with LWs on its northwest and southeast façades was carried out using Envi-met software. This study used statistical analysis to explain the findings. Using Envi-met software, the building was modeled along with seven plant types in both orientations. The numerical results extracted display air temperature in front of facade, humidity, longwave radiation, and the surface temperature of the façades. The results are shown in diagrams and figures.
The research questions are as follows:
-
What is the difference between the thermal exchange of the exterior surface temperature with and without plants in the climate conditions of Manchester?
-
What is the relationship between the thermal performance of the LW and the façade’s orientation?
-
What is the relationship between plants and wind fluctuations in the southeast and northwest exposures?
The hypothesis is as follows:
The southeast and northwest faces seem to influence the façades’ heat exchange. As the southeast façade experiences more heat gain, the surface temperature reduction is expected to be greater than the one on the northwest façade. Additionally, the LWs are expected to lessen the wind fluctuation in the wintertime relative to the weather in Manchester.
Few studies have analyzed the thermal performance of LWs, specifically in Manchester’s climate and urban conditions. The study’s novelty is the LW simulation carried out on the building prototype in the extreme weather in Manchester, which is implemented in the northwest and southeast directions, and is covered with seven plants already used by local GW companies. The results of this research can assist companies, designers, and consumers to determine the efficiency of LWs and optimum LW orientations in Manchester’s climate conditions. The limitation of this study is that this study used particular LWs in Manchester as the case study. The LWs include seven different types of plants with mixed effects on air quality, thermal performance, and appearances in various seasons. Therefore, the calculated results for the effects of the LWs are closely related to the plants used and the location and orientation of the LWs.
As the literature review in the section below demonstrates, the thermal behaviors of LWs vary in different climate zones. Many LWs have been constructed in warm climate zones, but less are used in mild climate areas, such as those in the UK. In order to compare the performance of the LWs in Manchester against those in other climate zones, an extensive literature review is carried out in the section below to demonstrate various impacts of LWs on urban environments.

2. Literature Review

2.1. Green Envelope Thermal Performance

Many studies have examined the thermal behavior of LWs, such as a study comparing the thermal performance of eight types of VGSs (seven different kinds of LWs and one type of GF) carried out for tropical regions by Wong [31]. A decrease of 11.58 °C in the wall surface temperature was observed for clear sky in the case of a modular LW with an inorganic substrate and lattice and a modular LW with a mixed substrate. A decreased wall temperature also reduces the energy cooling load and creates potential energy savings. These findings indicate the thermal benefits of the VGS for lowering building surface temperatures in tropical regions.
A sensitivity test was used to find the critical variables that impact the thermal efficiency of LWs, such as plant type, substrate, structural factors, interior environment, weather parameters, and watering frequency. A research team from China conducted a simulation study using the Envi-met tool and employing the novel substrate known as “super soil”. It assessed LW cooling and energy-saving advantages throughout the summer by comparing four different wall scenarios: a bare wall, a GF, a super soil LW, and a planter-based LW. The super-soil-based LWs achieved 19.92% indoor energy savings, followed by the LW based on boxes at 15.37% and the wall of the GF at 6.29% [32].
Eumorfopoulou and Kontoleon [33] conducted an experimental investigation during the Greek cold season to understand how a GW impacts the thermal behavior of building envelopes. This research considered the surfaces covered with the Parthenocissus triscupidata climbing plant and coverage ratios varying from 0% to 100%. Lower temperatures on the building surfaces due to plant coverage were observed, and the beneficial effect became more evident on the east and west surfaces as the proportion of plant leaf cover increased [30]. An experimental study in the Netherlands examined temperature and airflow at the beginning of autumn, including direct GFs, indirect GFs, and planter-based LWs. The most effective wind barriers reported using LWs were made of planter boxes and direct GFs, which reduced the wind speed. The insulating effect of the building envelope was increased by improving the thermal resistance. In order to determine whether this strategy can help in London’s climate, Jimenez [34] investigated the thermal performance of LWs on three buildings. The findings show that the VGS can lower the exterior surface temperature of buildings by up to 12 °C during summer.
An experimental study carried out at the University of Bari (Italy) utilized three perforated brick walls: two had evergreen plant coverings of Rhyncospermum jasminoides and variegated Pandorea jasminoides, while the third was left uncovered and served as the control. On warm days, the protected walls’ daytime temperatures were up to 9.0 °C colder than the corresponding values for the exposed walls. The vegetated walls’ overnight temperatures during the cold days were up to 3.5 °C higher than the control wall’s [18]. Similarly, Blanco et al. [35] found that by comparing the surface temperature of the wall covered with climbing plants and bare walls in Bari, the surface temperatures of the GWs were up to 7.7 °C lower in the summer than those of the uncovered walls. In an experimental study in Brazil, the surface temperatures of an east façade in a subtropical climate with hot summers (Cfa) were measured to determine the thermal impact of a continuous LW. The findings demonstrate the effectiveness of the LW in lowering the internal and external surface temperatures relative to a bare wall, down to 2.9 °C and 10.6 °C, respectively [36]. The impacts of different LWs in various regions are listed in Table 1 for comparison.
In both summer and winter, LWs have more energy-saving effects than identical simple/common walls [39]. Due to the additional thermal insulation offered by the plants and substrate, a rate of 18% in energy savings was attained during the heating test [24].
The existing studies demonstrate that the temperature changes on the building façades were affected by the orientation of the walls. Also, different types of plants can contribute to passive systems for energy savings in different mechanisms. These two aspects are discussed in the following two sections.
The studies on the thermal performance of GWs can be broadly divided into groups based on GW characteristics, such as GW type, substrate, air cavity, plant species, irrigation system, and climate conditions, as well as building attributes, including materials, orientation, height, and usage. Most of the research on GWs has focused on elements relating to climate issues and GW characteristics. The methodology applied is simulation, separate experiments, or experiments which are validated using simulation studies.

2.2. Living Wall Orientation

There is an apparent influence of the orientation of LWs on energy efficiency. The dependency of an LW’s thermal behavior based on the orientation of the GW and climate condition is strongly supported in various studies. In Brisbane’s tropical climate, north-facing vegetated façades could minimize cooling loads by 95% relative to west-facing façades, which decreased cooling loads by just 1% [40]. In temperate climates, a difference in the energy saving of LWs facing opposite directions is often seen. In the case of GFs, a simulation study shows that when all faces are fully covered by plants, the cooling load reductions differ based on the exterior wall configuration. The cooling load of a building without openings is lowered by up to 20%, 18%, 8%, and 5% if the greening system is built in the west, east, south, and north [41]. The simulation evaluation of a building in Portugal reveals that heating loads can be lowered by 6–11.2% through the use of LWs on the east face, 8.2–13.3% on the west, and 24.4–28.6% on the north façade [42].
An experimental study was conducted by Jim [43] in the humid–tropical Hong Kong climate using four orientations. Strong irradiance raised control surface temperatures and caused significant transpiration that cooled nearby ambient air and plant surfaces.
Another experimental study was carried out by Pan et al. [44] in humid subtropical Hong Kong on the effects of orientation and weather on the thermal performance of a VGS. In relation to the daily maximum temperatures of the walls with and without VGSs, substantial impacts were demonstrated. A west-facing VGS had the most significant reduction in wall temperature (6.1 °C), and a north-facing VGS had the highest potential to lower the ambient temperature (10.1 °C). The existing studies highlight that VGSs might lower the building envelope’s constant cooling load from 12% to 42%. The orientation of the greening on the building façade also affects the internal thermal environment.
Pérez et al. [45] showed that a decrease of 15 °C in the building surface temperature could be achieved and that a GF on the east orientation could minimize the sun’s early-morning substantial effects. When temperatures peaked in the south exposure at 3:45 p.m., the decrease was as much as 16 °C. At 7 p.m., the double-skin GF on the west orientation lowered the temperature by 16.4 °C. However, a study by Bolton et al. [37] suggests that evergreen LWs on north-facing buildings can reduce heating costs, and deciduous climbers on the south side are more efficient in Manchester. On cold days, the covering is more effective; however, if the temperature rises above 12.2 °C, the ivy covering causes an increase in energy loss because it protects the wall’s exterior from shortwave warming. A recent study was undertaken in Florence, Italy; the surface façade temperature dropped by 8.0 °C with indirect GFs during the hottest days, while in winter, plants blocked the solar gain, leading to a rising heating demand of about 4%. Similarly, deciduous plants are recommended in a Mediterranean climate. Regarding shading by plants, a significant reduction happened in the western orientation with 8 °C compared to the southern and northern directions with 6 °C and 4 °C, respectively [46].
Coma et al. [47] investigated a double-skin GF and compared their results to a reference wall using south, east, and west orientations. The east wall’s GF and the GW temperature reduction were 13.8 °C and 17.0 °C, respectively. Comparison data from a different orientation revealed a 10.7 °C reduction using a GF on the south surface and 21.5 °C for a GW. The GF reduced the temperature by 13.9 °C and the GW by 20.1 °C when facing west. Comparative research in La Rochelle, Paris, and Athens, Greece, also highlighted thermal insulation benefits in winter and summer, particularly on the west sides [48].
The majority of research shows that a west-facing orientation performs best in terms of reducing cooling demand. According to studies [37,38,39,40,41,42,43,44,45,46,47,48,49] that examined GFs covered by climbing plants, evergreen species with a south orientation contribute to higher heating demand. Thus, deciduous climbing plants can be planted to increase heat gain during the winter. Arguably, another study by Vox et al. [50], through two years of experimental research in the Mediterranean climate, showed that evergreen plants remarkably saved energy in the winter in the south orientation. The main cause of heating loss was the insulation of GWs on the western and southern façades [51]. Although several studies have been conducted, the thermal exchange of GWs in winter, specifically in cold regions, is still scarce.

2.3. Plant Mechanisms

Plants on building façades can contribute to energy saving in the building in different ways. According to Perez et al. [52], there are four fundamental mechanisms that plants can provide towards passive systems for energy savings, including creating shadows to reduce solar radiation [53,54,55,56], increasing thermal insulation [56], enhancing evaporative cooling effects [52,57], and creating a varied impact on the wind around the building [58]. Different species also have various outcomes on the internal thermal environment, largely related to the local climate. Climate changes in different seasons can influence both the plants’ growth and internal thermal performance. Understanding the local climate for the study areas and climate changes in different seasons is essential. The local climate impacted the growth rate of different climbing plants and their ability to provide shade changed during the year. The results suggest that GFs create a microclimate between the wall and the green coverage, leading to slightly lower temperatures and higher relative humidity in dry Mediterranean continental climates [59]. GFs with higher leaf densities are more effective for cooling façades [60]. The following section discusses the four fundamental mechanisms of the plants in detail.

2.3.1. Evapotranspiration

Evaporative cooling, which lowers the temperature of the façade, is produced when heat energy is taken during the evaporation of water from plants [31], with a significant potential to reduce urban and global temperatures [61]. Scarpa [62] provided a mathematical model that took into consideration a variety of LW characteristics, including evapotranspiration, open or closed air cavities, and plant species. It offers a tool for predicting the thermal behavior of LWs by considering all these characteristics.
While the thickness of plant foliage increases by 25 cm and is 100% covered, the cooling season energy consumption is reduced by 18.17%, and energy savings connected to the south face are less than those related to buildings facing east. Moreover, GFs can heat adjacent air by evaporating water [17] and improving thermal insulation in winter [63]. To determine the evapotranspiration rate of GFs and their effect on evapotranspirative cooling, an experimental study analyzed deciduous non-native and nondeciduous native plant species in Australia. When the conditions were well watered, the north- and west-facing façades of the GFs provided maximum evapotranspiration cooling of 4.4 °C and 1.7 °C, respectively [64].

2.3.2. Shading

A GW may shield the building exterior by offering shade. The GW receives sunlight depending on the canopy’s physical features. It is distributed in three ways: transmitted to the atmosphere, or through the leaves, or the canopy absorbs it [65]. Plants can provide shade to buildings, protect them from direct sunlight, and, at the same time, create a homogeneous microclimatic phase between the plants and the building surfaces. Shading is often cited as the most important aspect of plant cooling, indicating that the larger the foliage, the more influential the impact [66]. Most locations with high vertical radiation use shading VGSs to provide shading [67]. Depending on the cooling and heating seasons, shading may have various impacts. In the summer, carefully placed plant canopies on the building façade could block sunlight [68].
Sun et al. [69] presented the global relationships between UHI and urban greening, including characteristics such as leaf area index (LAI), vertical structure, plant height, and canopy density, which can affect shading and cooling effects. Transferring heat through a GW is complicated by numerous aspects. Heat transfer mechanisms on a wall with climbing plants differ from those on a bare wall due to the interposition of the foliage between the outdoor environment and the building envelope. In contrast, a leaf cover’s exterior layers serve as optical filters, and the deeper layers will function as insulation.

2.3.3. Effects from Wind

Wind is another environmental factor that impacts building envelopes. Heat transfer from the building envelope is influenced by wind velocity. Due to the wind velocity reduction using a GW, there will be energy savings for cooling and heating [70].
The amount of wind protection a green barrier offers is primarily determined by the direction and speed of the wind; the height, width, and length of the barrier; and the density and permeability of the material that will eventually make up the barrier. Given the plant type, the area should be designed to avoid blocking access to air conditioning systems in the summer and winds in the winter [71]. Dense foliage reduces the wind flow around the façade and prevents the building from cooling down in warm conditions. It suggests that VGSs with fewer plants have a negative effect during the winter instead of a cooling effect, as the LAI is considered the main principle altering the thermal performance of plants [58]. Blocking wind is one method of enhancing a building’s energy efficiency. Wind reduces the efficiency of standard insulation, even in airtight buildings [52].

2.3.4. Thermal Insulation

The GW can be used as “additional insulation” for the building envelope [30,72]. The effect of VGS insulation can be created by changing the ambient conditions (humidity and temperature) of the space between the greening system and the building surface [48,49]. In the humid and cold regions of China’s Hunan Province, due to the VGS’s additional thermal insulation, an energy saving of 18% was achieved during a heating experiment. The use of insulation materials and an air cavity minimized the heat transfer between the indoor and outdoor environments around the building [24]. An experimental study performed on a modular GW in a Mediterranean climate shows the green system provided additional thermal insulation. It estimated a 60% reduction in outgoing heat flux. Daily energy studies showed that the greening system could reduce heat loss during a cloudy winter day by about 56% compared to a plastered wall [73] due to the thermal insulation provided by the vegetation and the substrate [53]. GW may increase heat demand [55] if the plants have not been selected carefully enough and the climatic characteristics have not been analyzed. Dede et al. [74] investigated various types of growing media to understand their thermal insulation value in hot climate situations. Growing media, like peat, compost, and perlite, were tested, and the result showed that compost and peat had the same performance. The highest efficiency was observed in the mix of peat and perlite growing media. It should be noted that despite the related research on the insulation effects of VGSs, the empirical evidence on how LWs affect building insulation is still being determined [38].

3. Materials and Methods

3.1. Simulation Tool and the Case Study

Stimulation for the research comes from the understanding that architects are encouraged to use developed technologies in building design to constantly improve design solutions and enhance the capabilities of this simulation software. Given the range of simulation tools, capabilities, and limitations, it is crucial to be informed of the new options for energy-saving design and the available energy design tools. Simulation also offers meteorological models to replicate the geographical area and take into account essential elements, such as climate, materials, and atmospheric processes, as well as calculated thermal comfort indices, mean radiant temperature measurement, initialization, and boundary conditions [75]. In this study, Envi-met software was used to simulate the effects of the LWs on the building walls. Envi-met is a high-resolution 3D modeling software that can simulate complex microclimatic processes, such as flow around and between buildings and temperature exchange processes on surfaces such as the ground and the buildings’ walls. The software, therefore, can provide useful data about the impacts of environmental factors that influence the built environment by simulating how the ground, plants, structures, and atmosphere interact. Hydrodynamics and thermodynamics are the fundamental theories of environmentalism [76]. Engineers, planners, and urban environmental scientists can use Envi-met to simulate the climatological features of the urban environment [77], and researchers have widely recognized it as a practical and scientific research tool [78] when focusing on urban studies [79].
In this paper, the authors used results from a simulation study using the Envi-met tool to assess LW thermal performance throughout the UK’s summer and winter climate conditions. This involved comparing two LWs in different orientations to explore the greenery’s impact on the building’s surface temperature. The study incorporates knowledge gained from the reviews of previous studies presented above (Figure 1). The research project focuses on analyses of the thermal performance of LWs simulated for two days in July and January 2022, using Envi-met version 5.0.3 as a primary tool. The grid cell sizes for the model are dx: 1, dy: 1, and dz: 0.5 m, with x-grids of 80, y-grids of 80, and z-grids of 80. The weather information for the simulation were extracted from Meteonorm. It should be noted that in this study, the physical building with the LWs in Manchester that was chosen as the case study had one-meter-long chamfer on one of both walls. As this study uses the building and its LWs as models for simulation, in the calculation, a straight wall and standard wall structure were used. Therefore, the results do not necessarily correspond to the real temperature changes inside or outside the real building in Manchester.

3.2. The Case Study

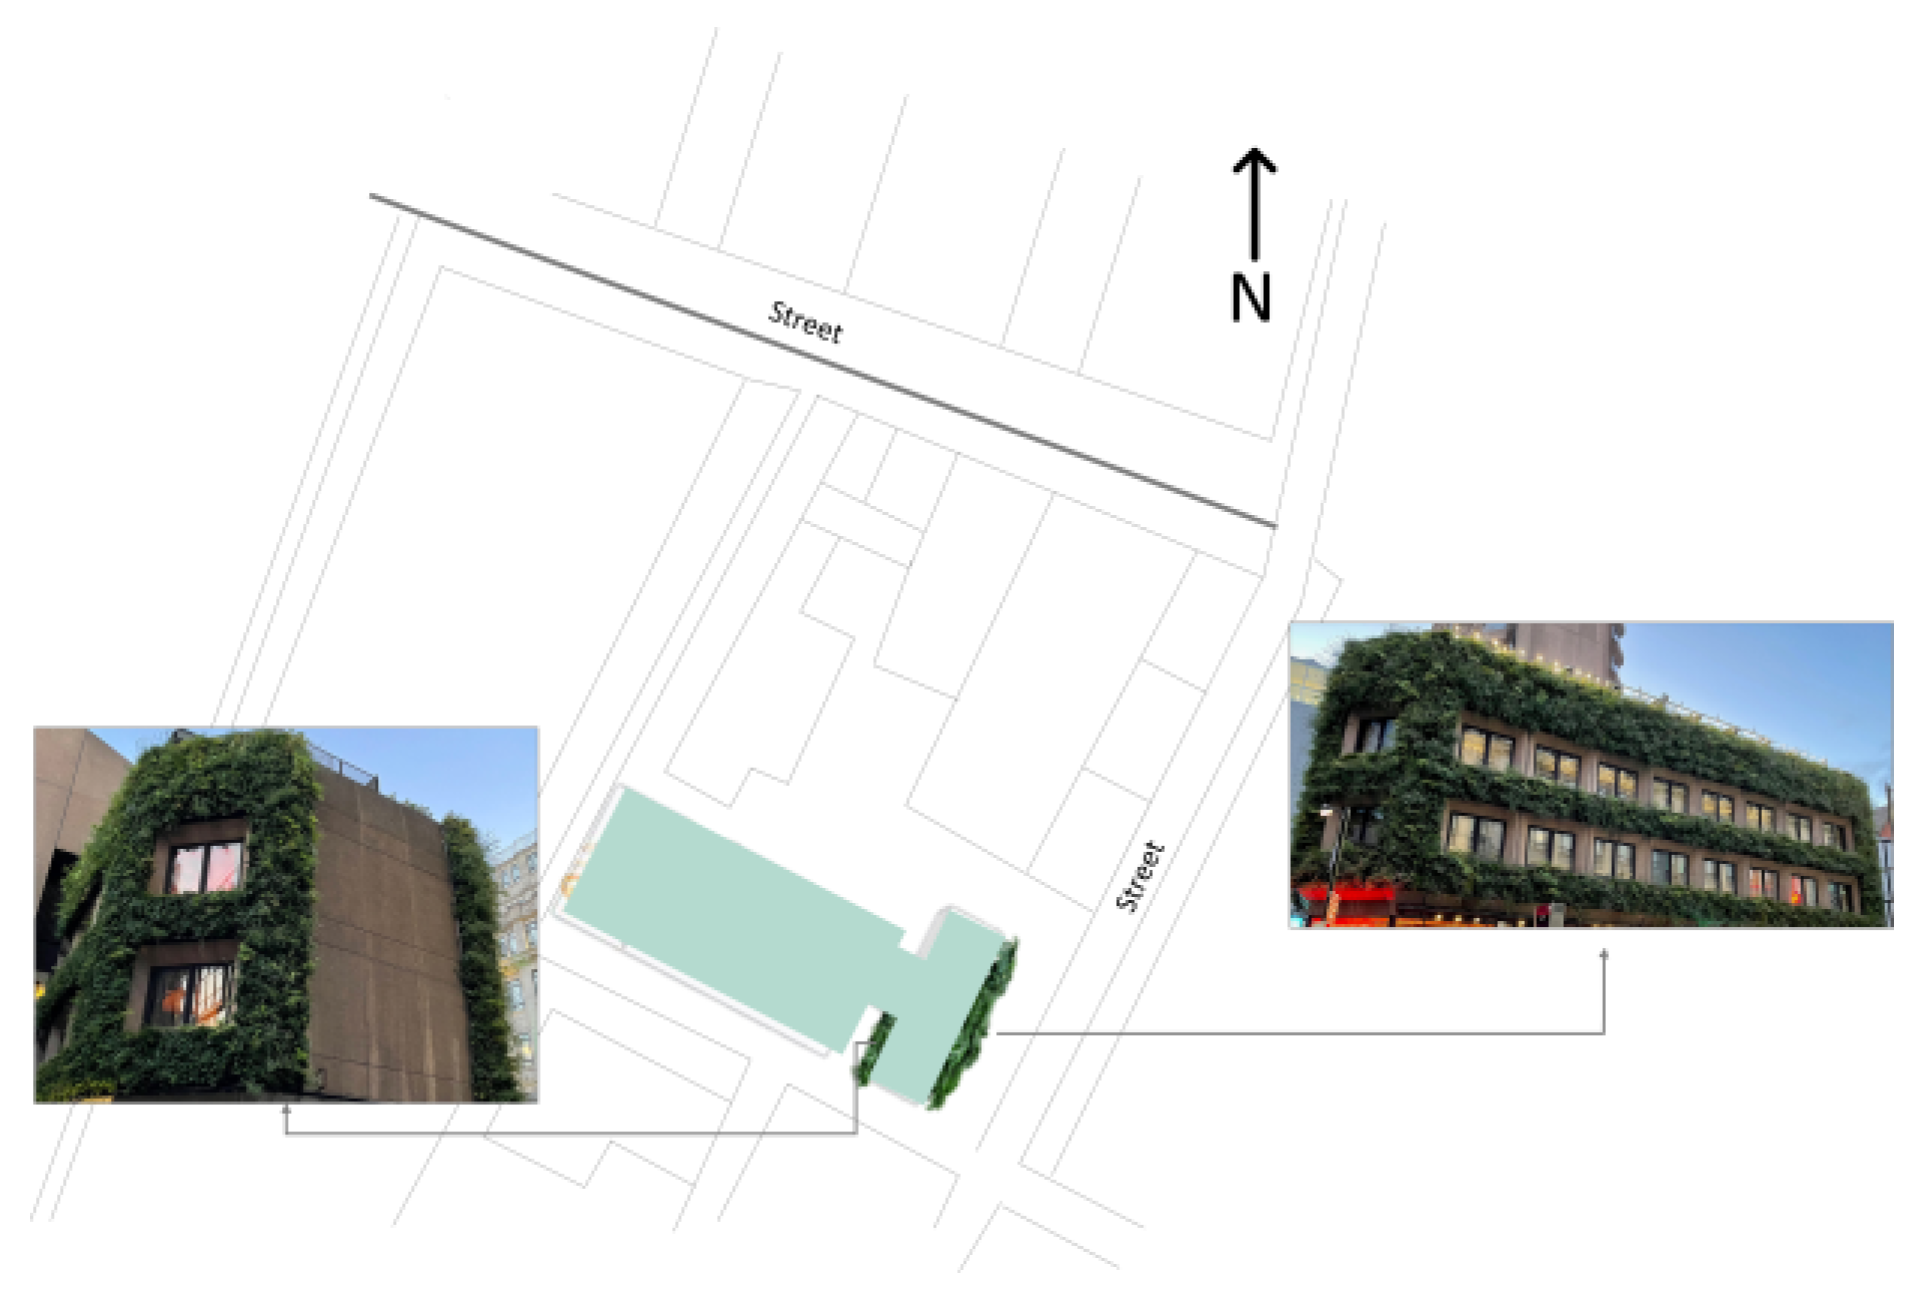
This research uses a multistory building in the city center of Manchester as a stereotype building for the simulation, and this section of the city in which the building is located is densely populated, and the southeast side of the GW faces a busy street. The materials used in the construction are diverse; however, the outside walls are a combination of concrete cladding and glass, as shown in Figure 2. The modular LW elements are secured by a porous vertical carrier rail to support the weight of the soil and plants. The applied substrate is clay. The LW is colorful in appearance and comprises evergreen and flowering plant species for year-round attraction. Some plant species also have significant air purification properties, which are helpful because the building is situated in a relatively busy urban area. The plan of the building and its orientation are illustrated in Figure 2. The simulation used a standard building envelope wall of concrete and rainscreen concrete cladding. The case chosen represents a typical example of LWs in a busy urban area that are surrounded by other buildings and busy streets.
This study tested LW elements that incorporated seven evergreen plants, mimicking real LWs made for a local building, including Hedera Helix “Green Ripple”, Lavender Hidcote, Matteuccia Struthiopteris, Tellima Grandiflora, Buxus Sempervirens, Dryopteris, and Vinca Minor “Atropururea”, which were applied to the northwest and southeast façades.
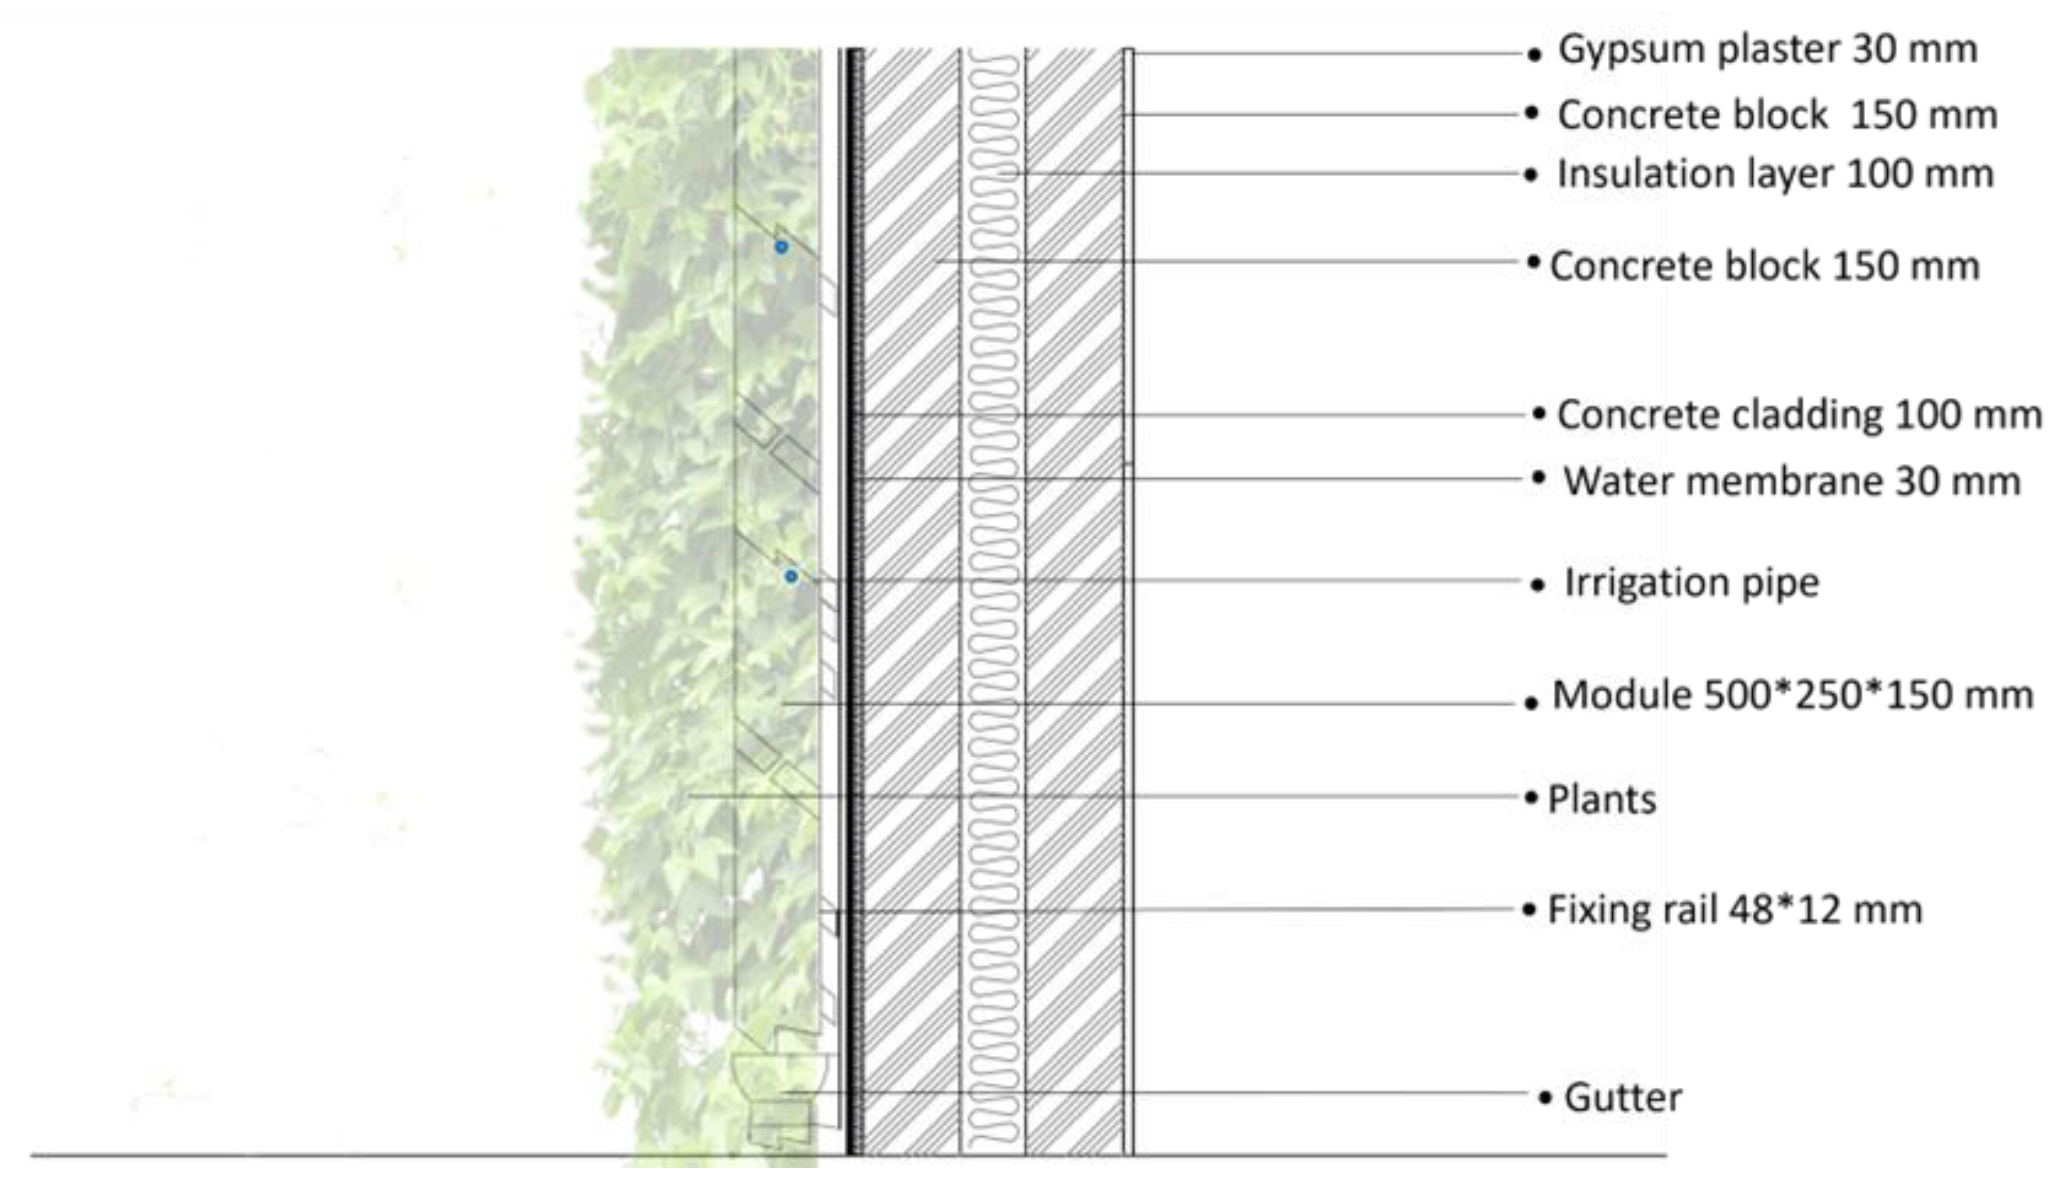
The standard wall for the building comprises an inner layer of dense concrete block (150 mm) and an outer layer of rainscreen concrete cladding (100 mm). These layers are separated by a 100 mm insulation layer. The internal face of the wall is covered with gypsum plaster (10 mm), and the overall thickness is 400 mm (Figure 3). The details of the LWs are listed in Table 2.

3.3. Climate Conditions in Manchester

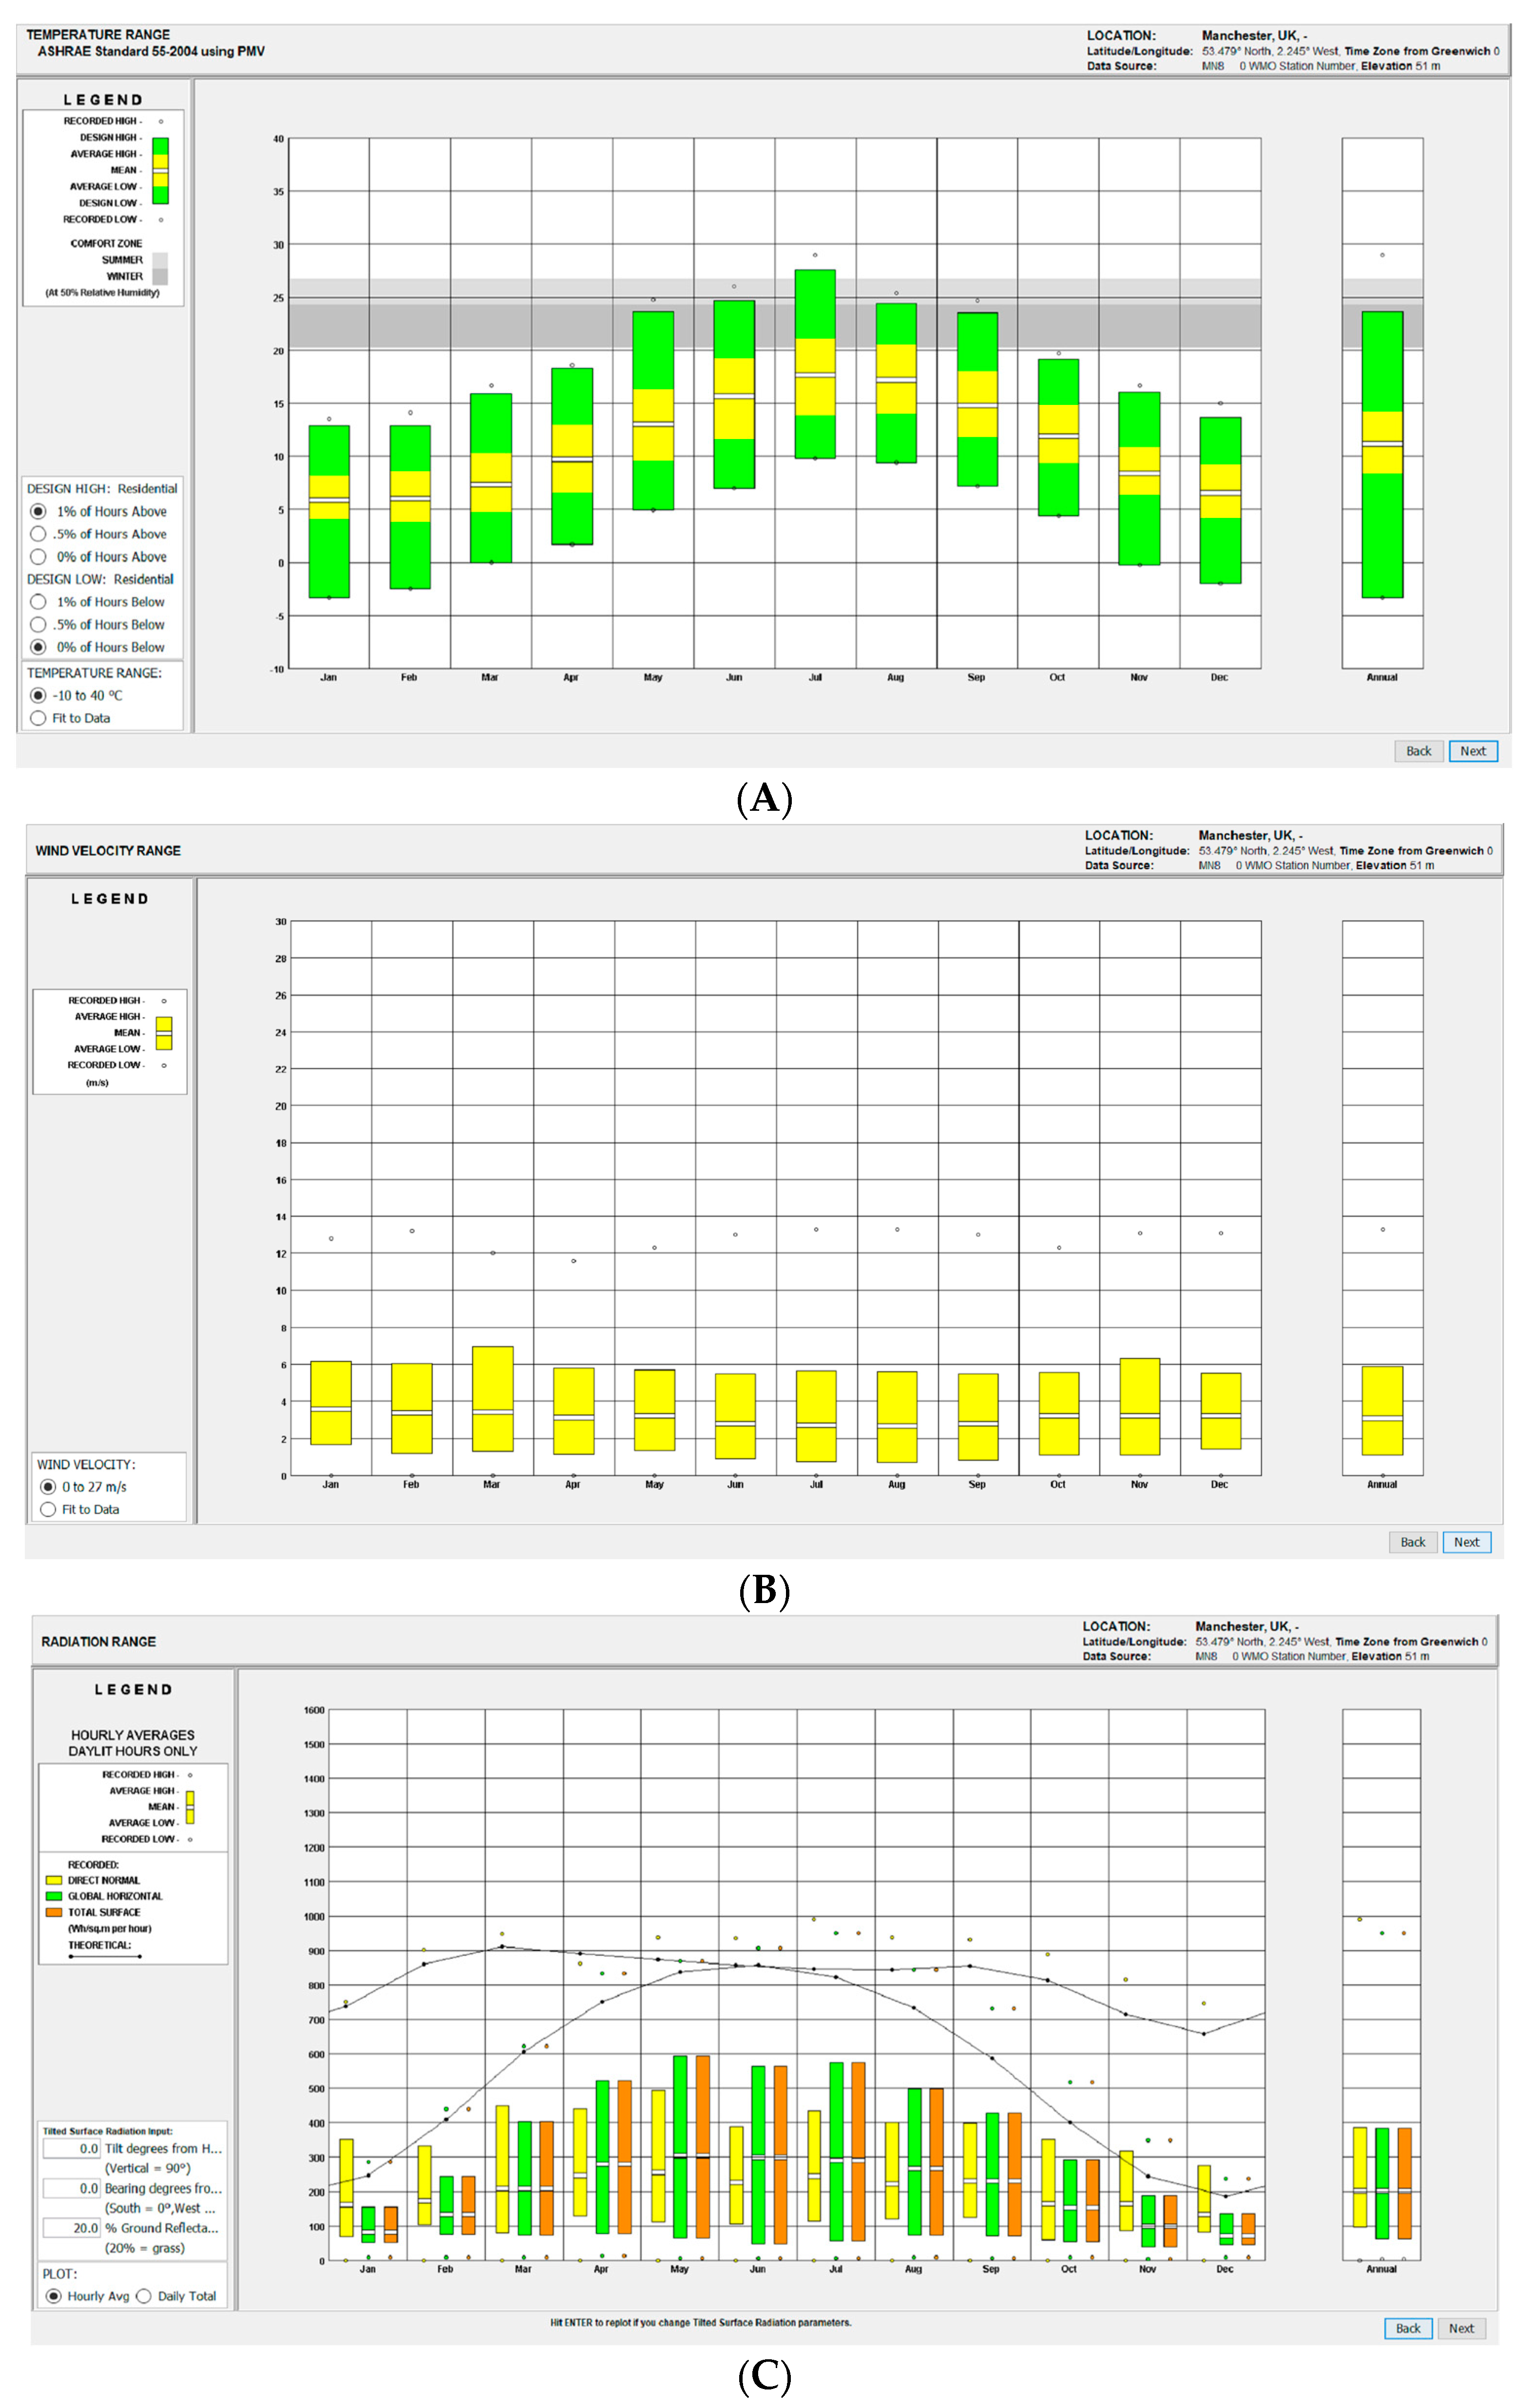
Climate conditions are a critical factor influencing the thermal behavior of VGSs [80]. In order to better understand the impact of climate conditions, meteorological data were extracted from Meteonorm for the examined year and imported into Climate Consultant software, which computes thermal analysis based on ASHRAE Standard 55. Manchester’s climate falls under the “Cfb” category of the Köppen Climate Classification (West Coast Marine Climate). The yearly average temperature is 10 °C (50.0 °F). To assess the efficiency of the VGS, the warmest and coldest months and days within those months were identified. This led to further analysis based on the days of 19 July and 7 January from 7 a.m. to 8 p.m., focusing on the thermal performance of the LWs. This simulation was conducted in extreme weather to check performance on one of the hottest and coldest days of the year. The maximum temperature was recorded in July, with the highest temperature around 30 °C (Figure 4), and an extreme heat wave warning was issued. January was the coldest month, with the lowest temperature of −3.00 °C.
Although the strongest winds in Manchester ranged from 12 to 14 m/s, the wind speed in July was 2.5 m/s from the southwest, and in January, typically 3.5 m/s from the northwest. Additionally, the most significant amount of precipitation—about 86 mm—occurred in January, while the lowest amount—about 60 mm—was recorded in February, although in January, there were 11 days with rain. The average amount of precipitation in July of the tested year was 76 mm across 11 days, which is higher than the average for the month. In the summer, notably in July and August, there was a significant internal heat increase.

4. Results from Envi-Met Calculation

4.1. Southeast-Facing Façade on Hot Day of the Year 2022

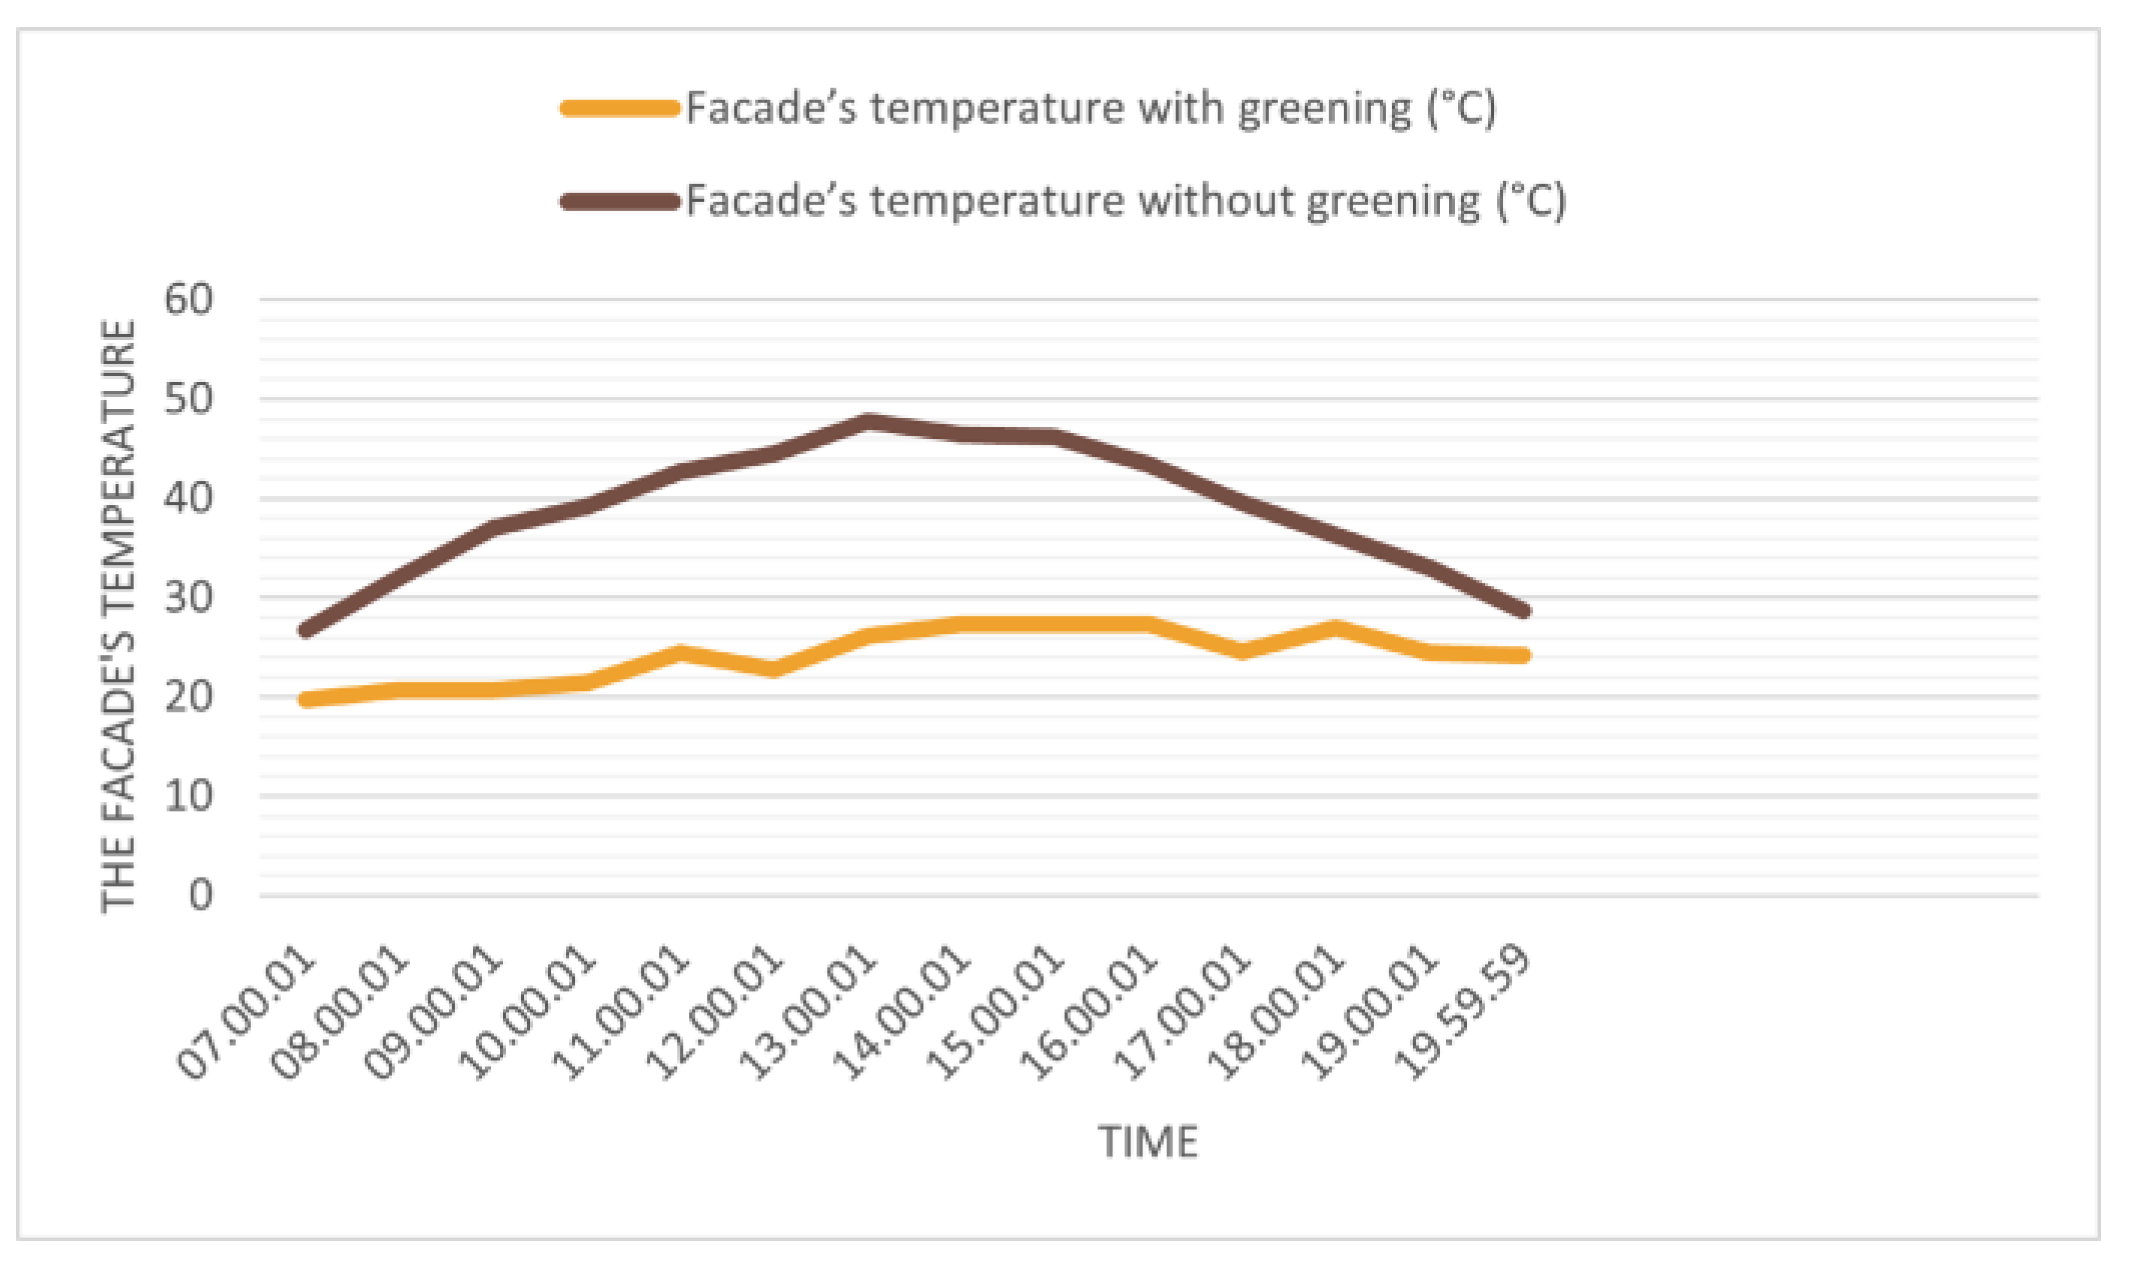
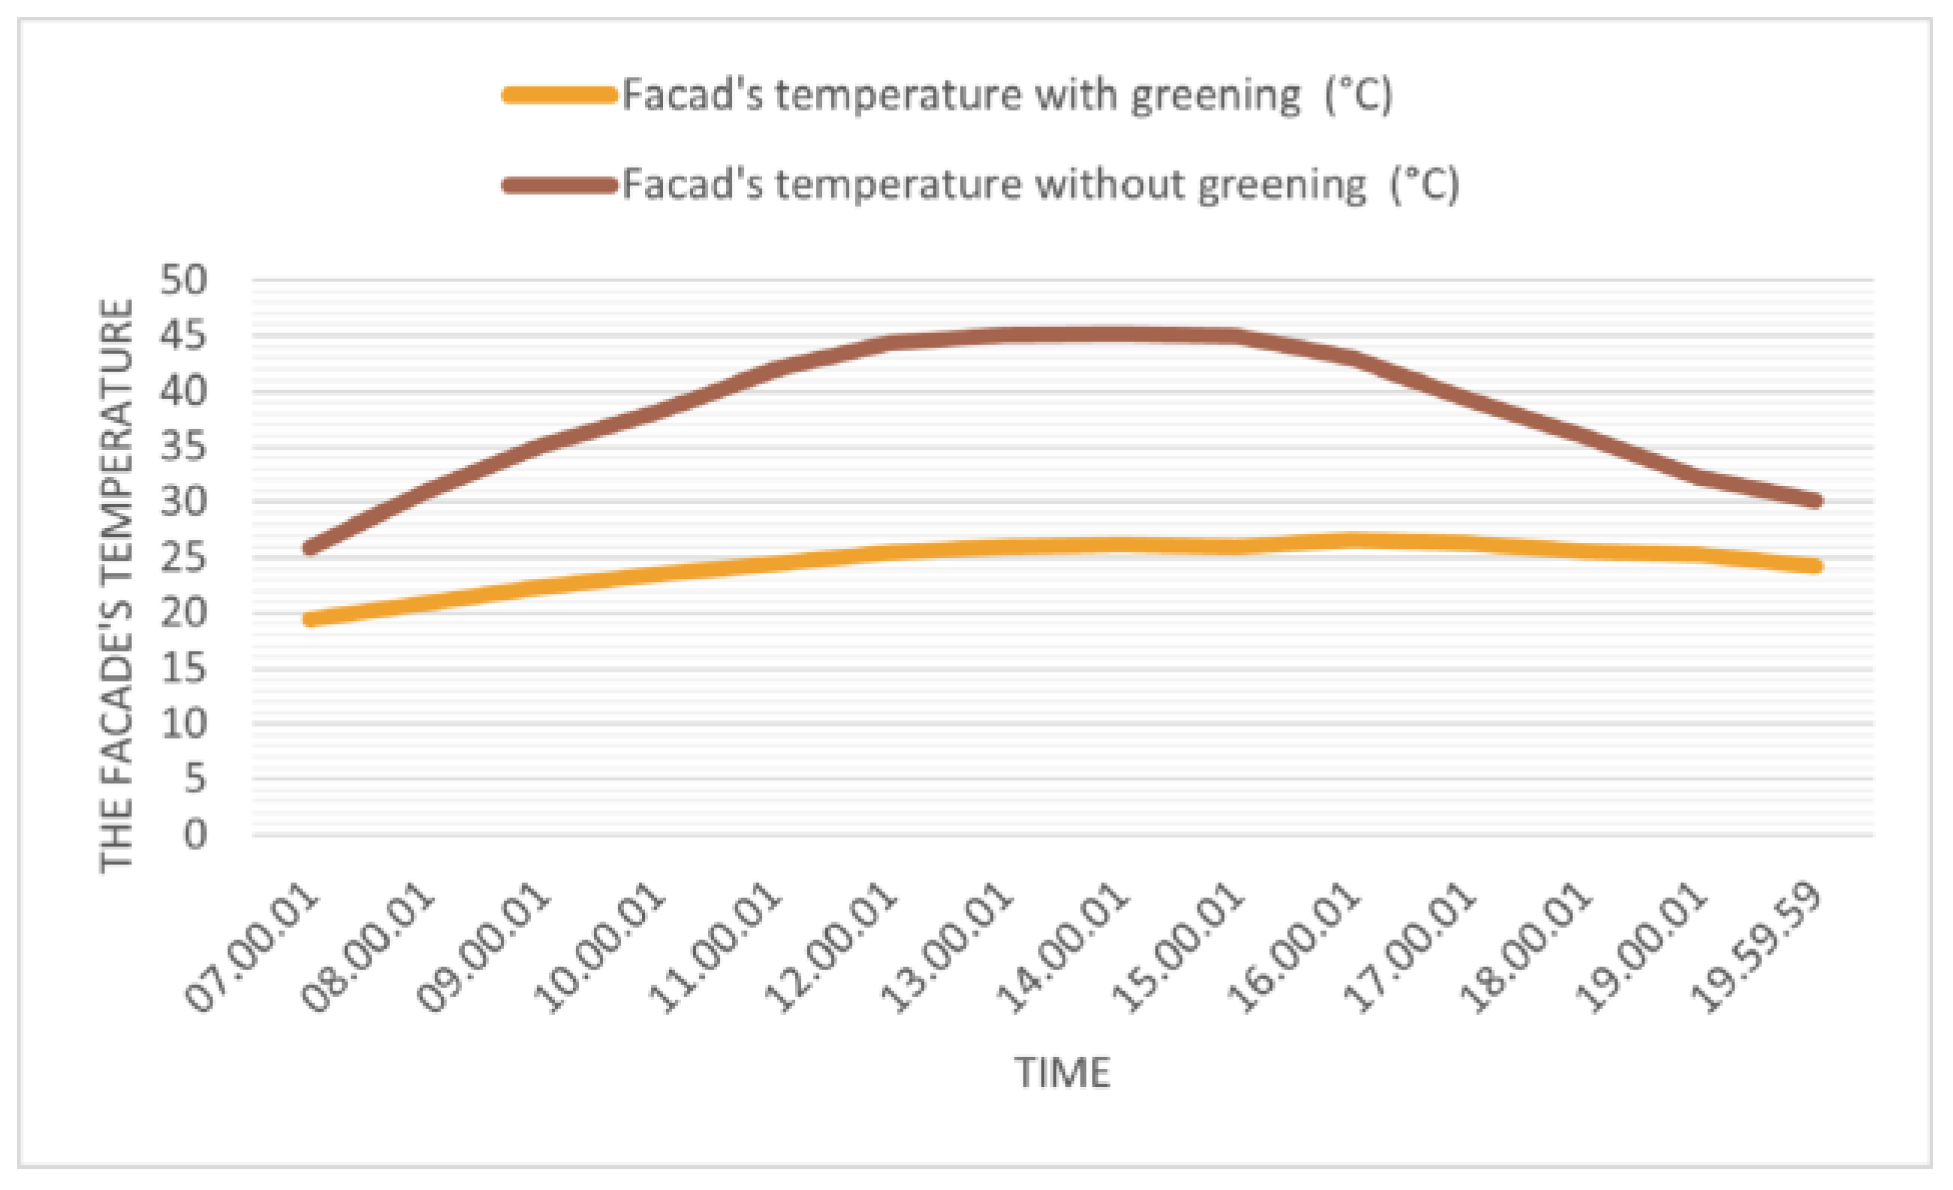
To assess the cooling capabilities of the LW, the temperature of the façade was simulated from 7 a.m. to 8 p.m. on 19 July 2022. The chart demonstrates the temperature-lowering effects of the LW, which included seven plant varieties.
Compared to the baseline scenario (façade without greening), the LW had a cooling impact on the façade (Figure 5). Effectively, the cooling performance of the LW indicated a temperature decrease of almost 6.91 °C at 7 a.m. and 11.37 °C at 8.00 a.m., followed by a steady increase of 17.80 °C, 18.77 °C, and 18.39 °C between 9 and 11 a.m. The temperature difference increased dramatically between 1.00 p.m. and 2.00 p.m., reaching 23.48 °C, followed by 19.01 °C at 3.00 p.m. and 16.08 °C at 4.00 p.m. After 6.00 p.m., the surface temperature decreased by 9.27 °C, and the difference between 7.00 and 8.00 p.m. was 9.74 °C and 5.43 °C, respectively. On a hot summer day in July 2022, the reduction in façade temperature ranged from 5.43 °C to 23.48 °C. On average, the results confirm that the LW cooled down the façade by 15.00 °C.

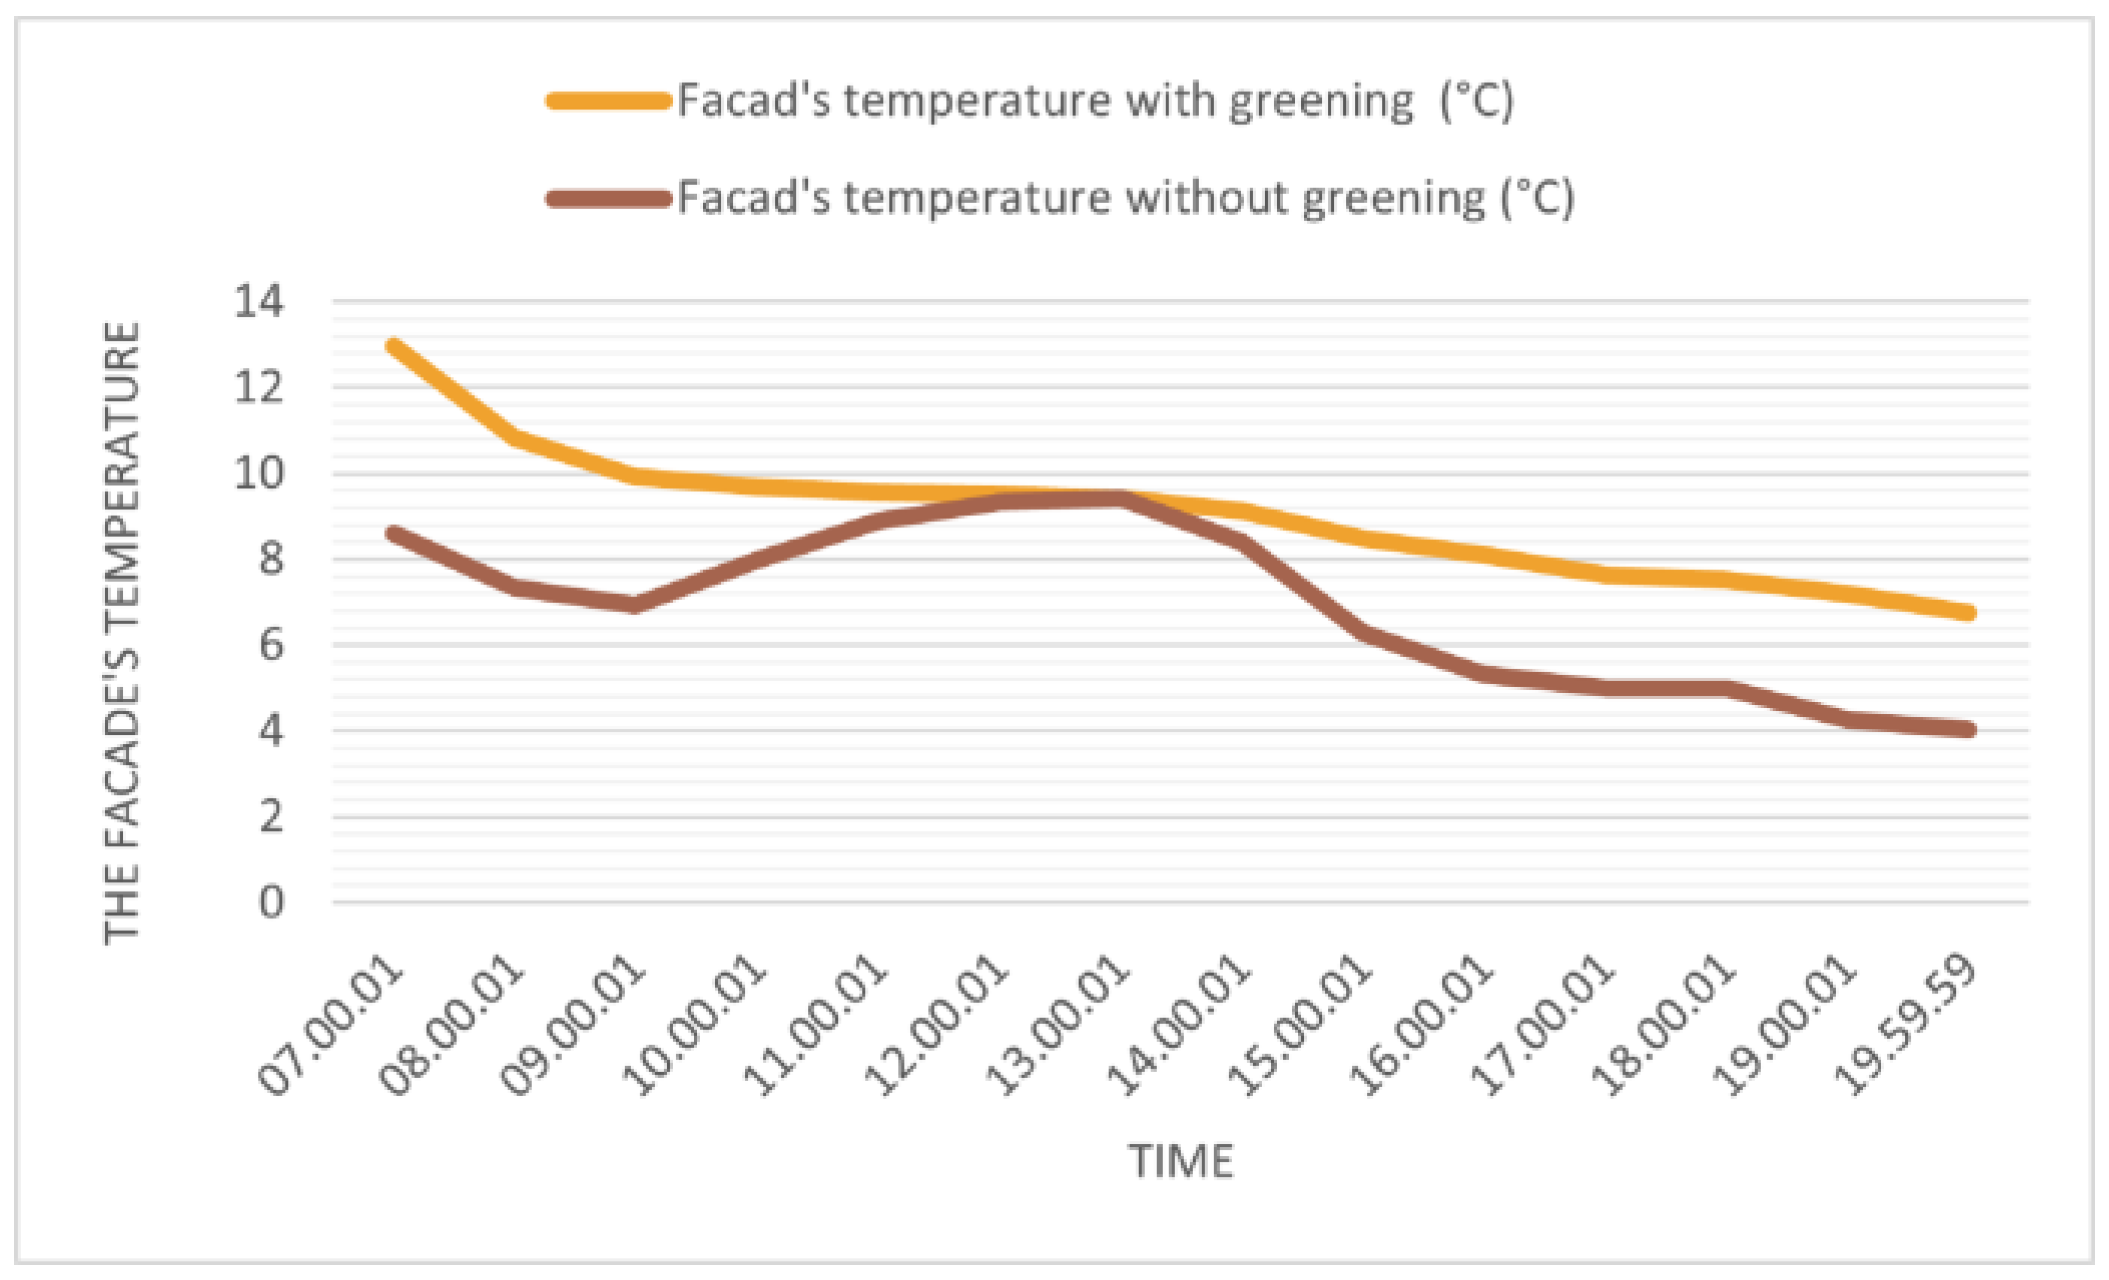
4.2. Southeast-Facing Façade on a Cold Day

The southeast façade with greening was approximately 4.38 °C, 3.49 °C, and 3.00 °C warmer than the façade without greening, as demonstrated (Figure 6) from 7 a.m. to 10 a.m. on a cold day on 7 January, when the LW was simulated. The least effective times for the LW to slightly warm the façade was at 11:00 a.m. and 12:00 noon, at about 0.66 °C and 0.81 °C, respectively. The surface temperature with and without plant cover was roughly equal at 1:00 p.m. The LW was, on average, 2.63 °C warmer from 1.00 p.m. to 8.00 p.m. It can be stated that the LW was warmer than a bare wall on a freezing winter day in 2022, by, on average, about 2.18 °C. However, its efficiency on a scorching summer day was significantly more profitable.

4.3. Northwest-Facing Façade on a Hot Day

The same date and time, from 7 a.m. to 8 p.m., were simulated for the temperature of the northwest façade. The LW helped to keep the façade’s temperature down by about 6.47 °C at 7 a.m. and 10.04 °C at 8 a.m. Colder surfaces were then followed by 12.80 °C and 14.59 °C at 9. a.m. and 10. a.m., respectively. At about 12.00 noon., there was a sharp increase in the temperature disparities. When the average difference in surface temperature was around 18:00 °C, the LW was the most effective at cooling between 12:00 noon and 4.00 p.m. It should be noted that the best cooling happened at 2:00 p.m. when the temperature was 19 °C. After 5.00 p.m., the cooling impact of the surface started to diminish, and the results at 6.00 p.m. revealed 16.36 °C and 13.00 °C at 7 p.m. Compared to the bare wall at 8.00 p.m., the LW surface temperature was the lowest at 5.87 °C (Figure 7). The northwest façade’s LW demonstrated the most remarkable effectiveness in lowering the surface’s temperature by an average of 13.53 °C during the specified period.

4.4. Northwest-Facing Façade on a Cold Day

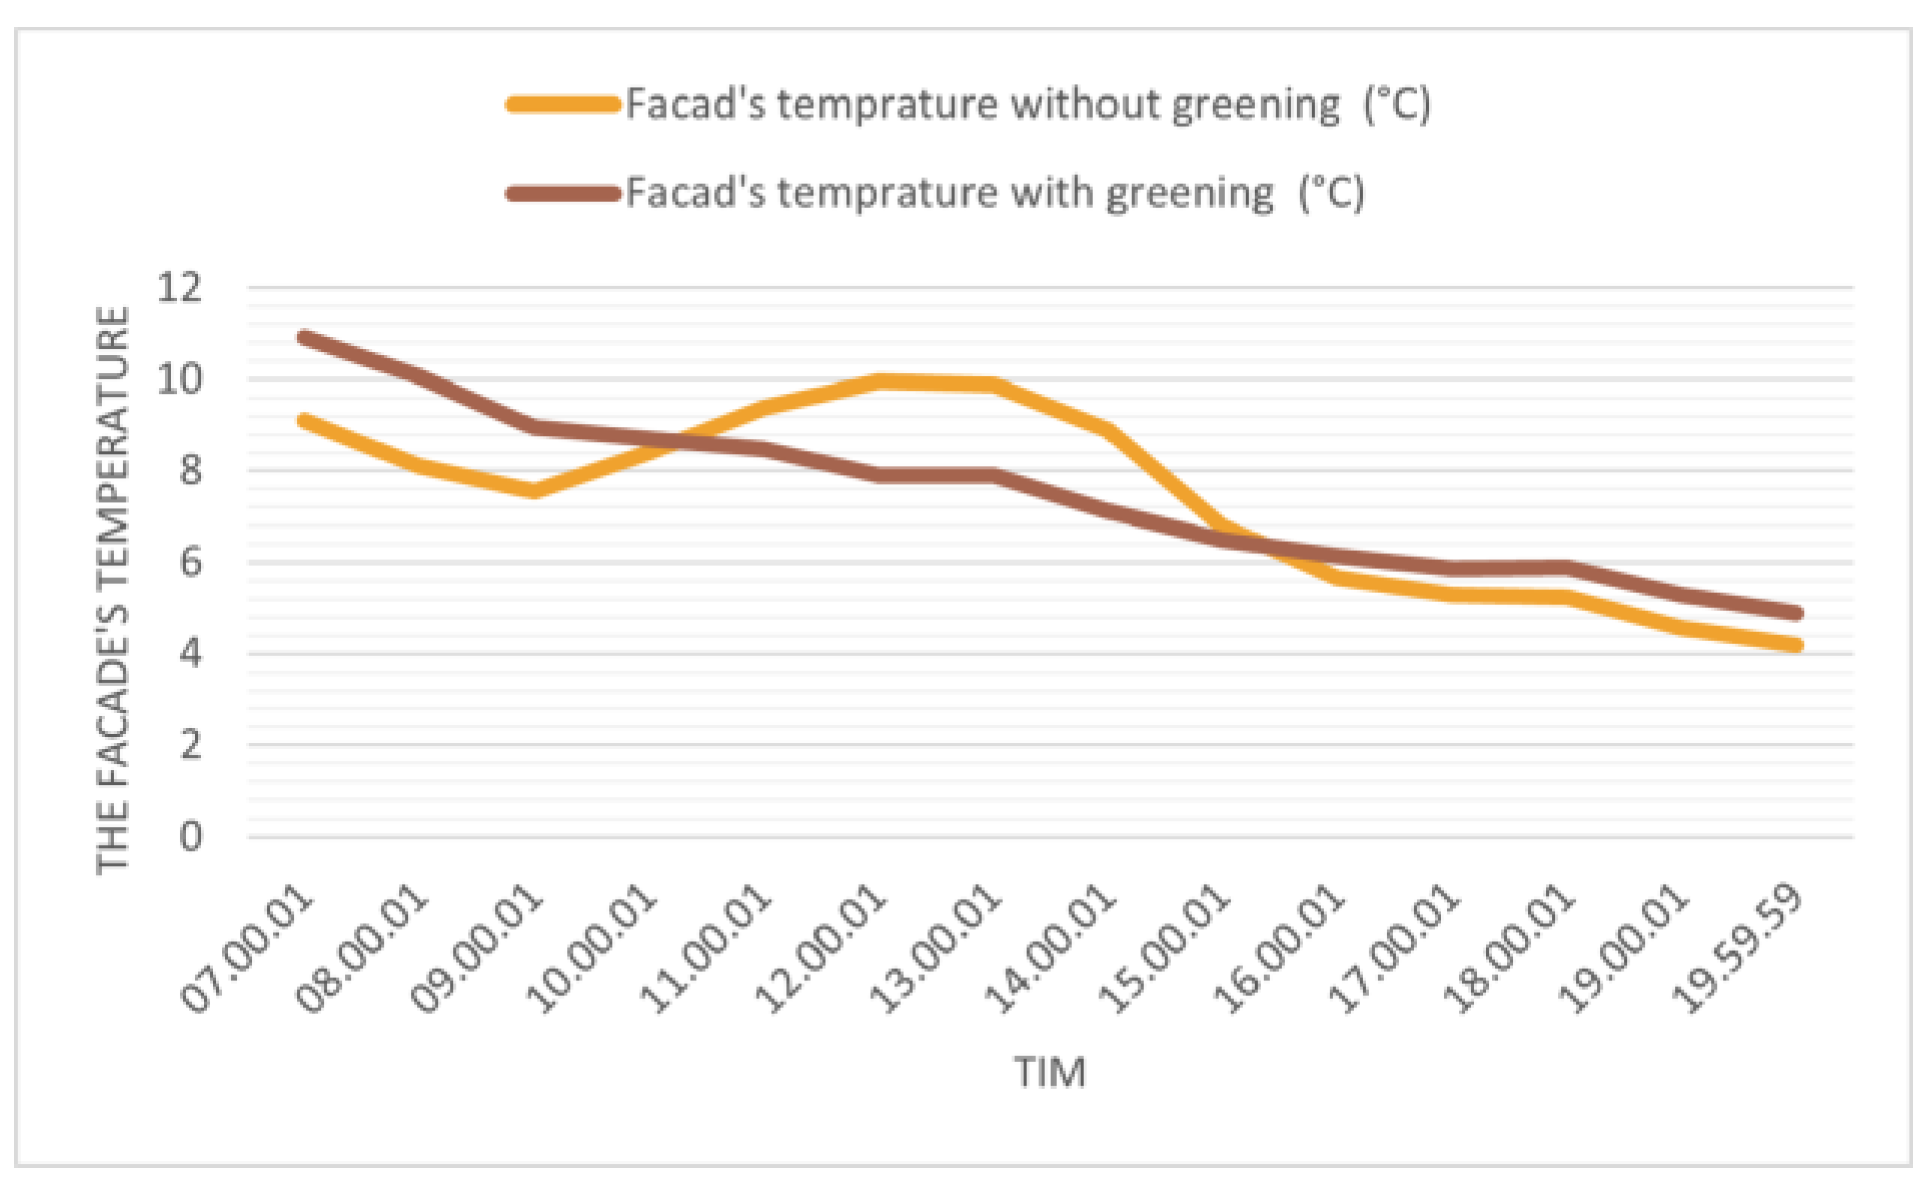
In this scenario, as shown in Figure 8, the LW warmed up by 1.80 °C, 1.90 °C, and 1.41 °C from 7 to 9 a.m. The surface temperature in both cases was nearly the same at 10:00. The bare wall was warmer than the LW between 12:00 and 3.00 p.m. The LW was warmer by under 1 °C from 3.00 p.m. to 8.00 p.m. On the test day, the façade covered with plants was, on average, 1.1 °C warmer than the façades without greening, and temperature fluctuation was reduced by a maximum of 2.70 °C in comparison to Bolton’s study [36] in Manchester, which found that ivy increased the average outside warmth of a north-facing wall by 0.5 °C in the winter and reduced temperature variations by more than 3 °C.

5. Discussion

5.1. Effectiveness of Living Wall Regulating Temperature in Winter

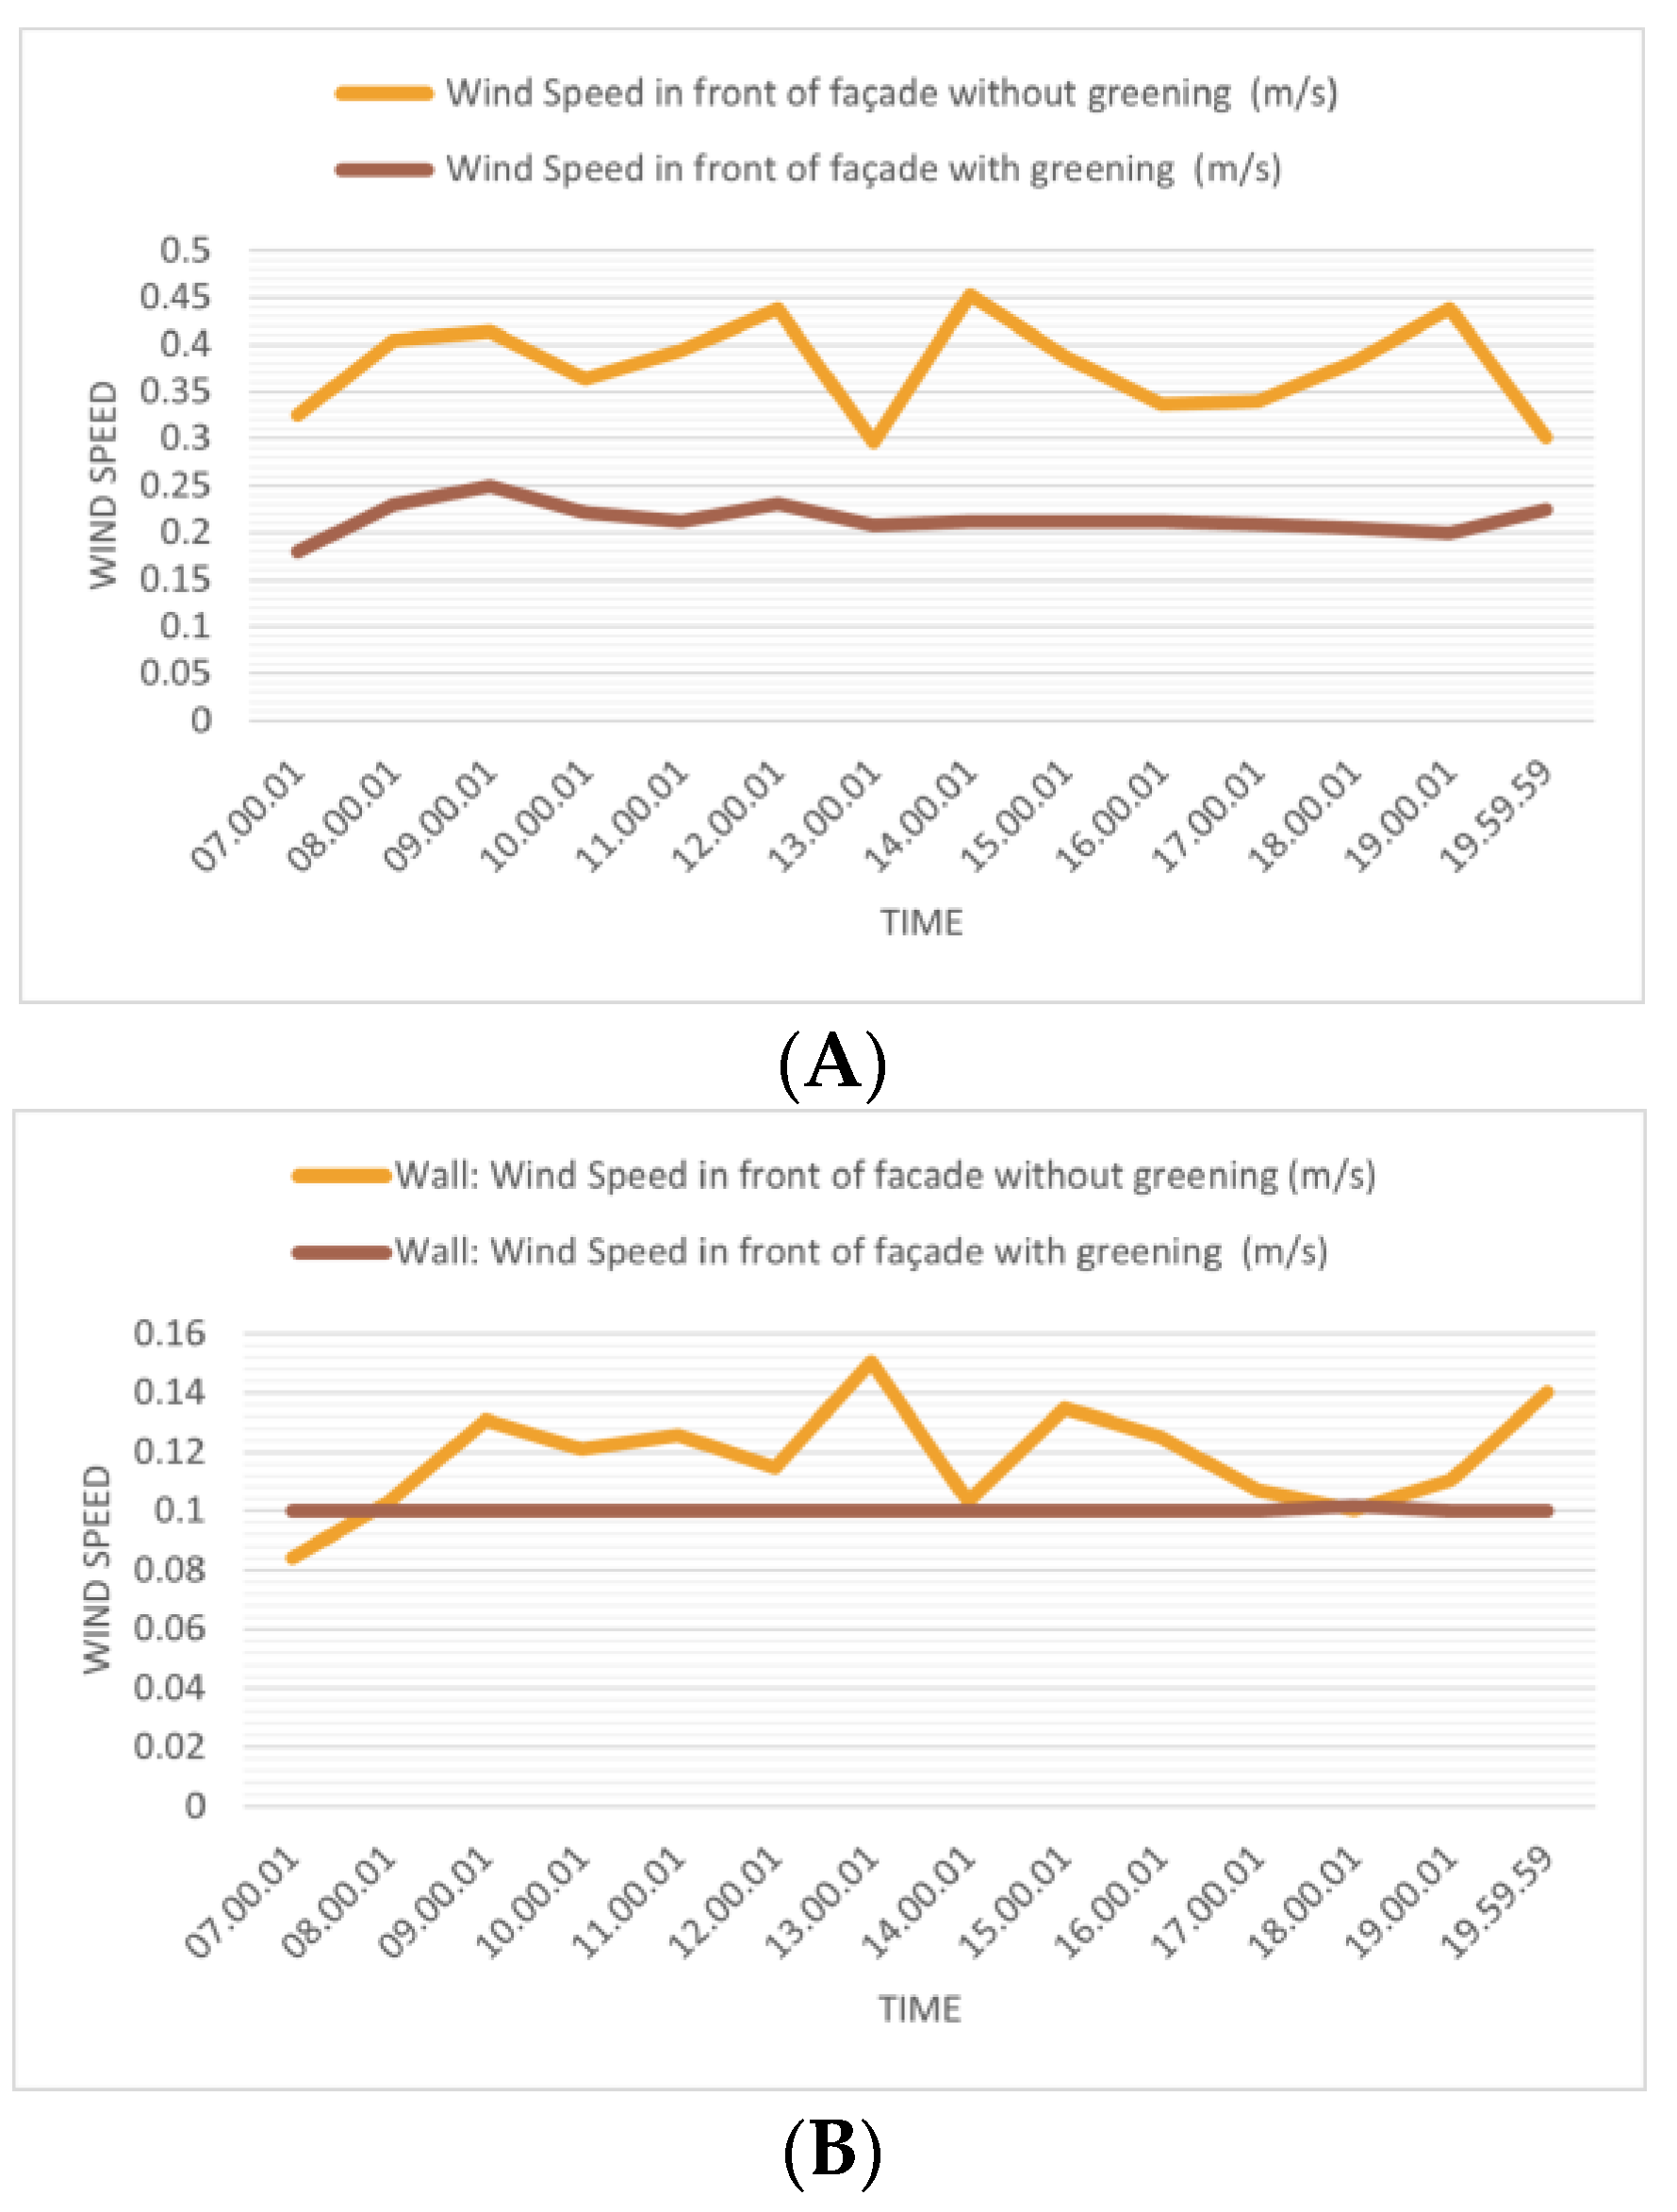
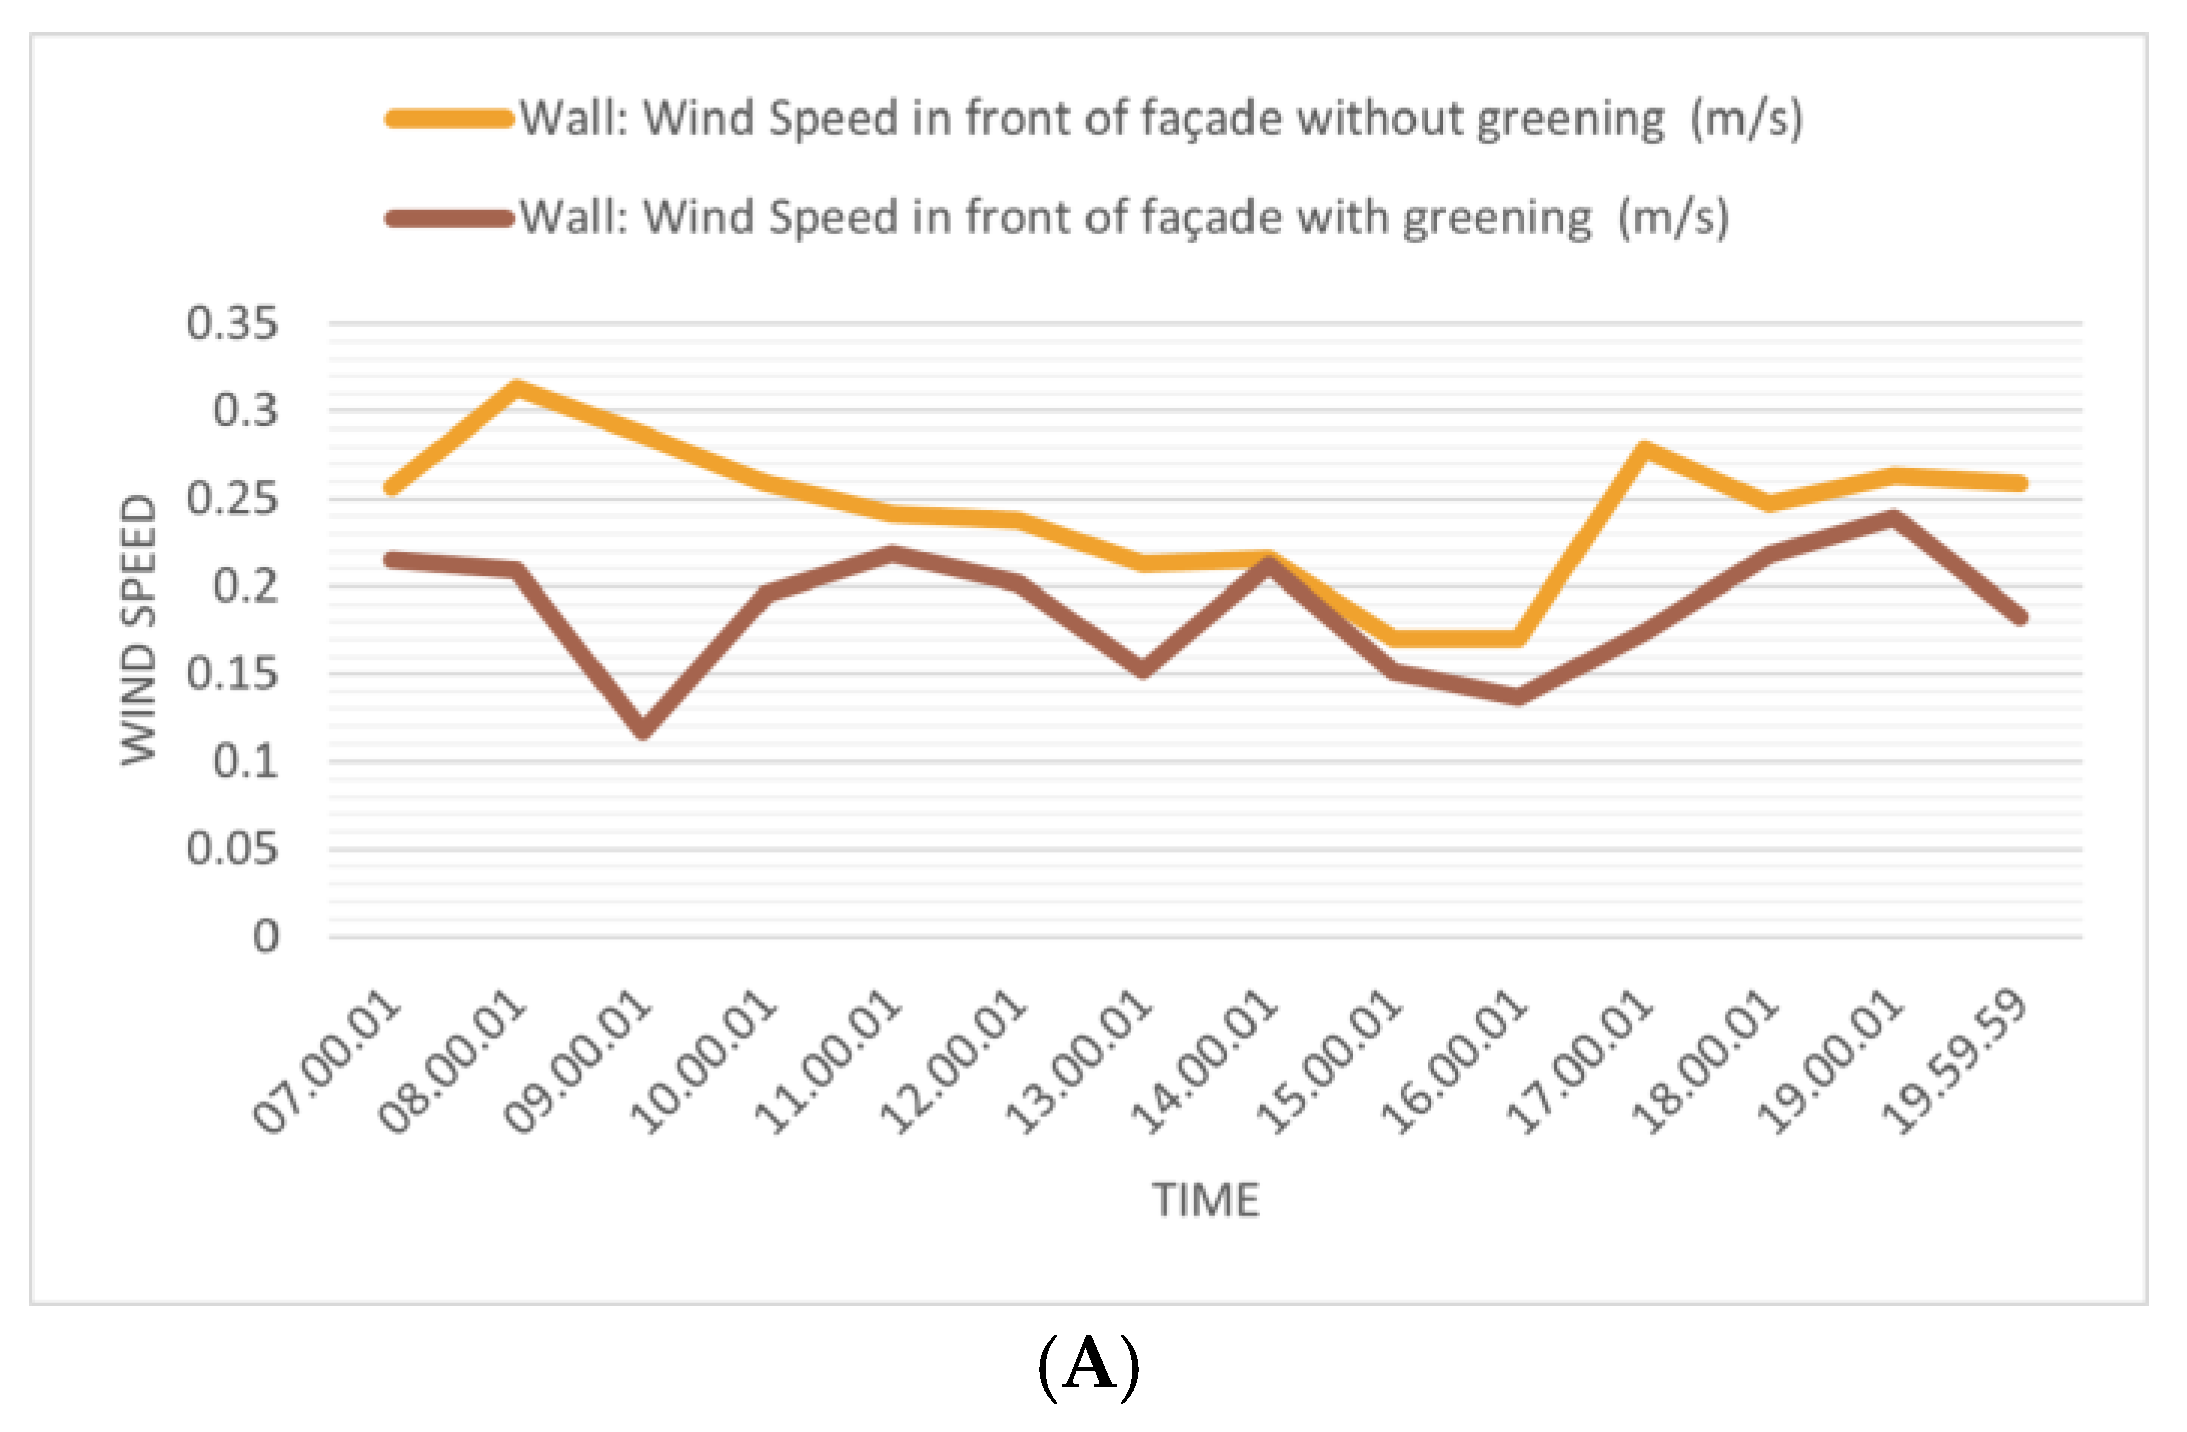
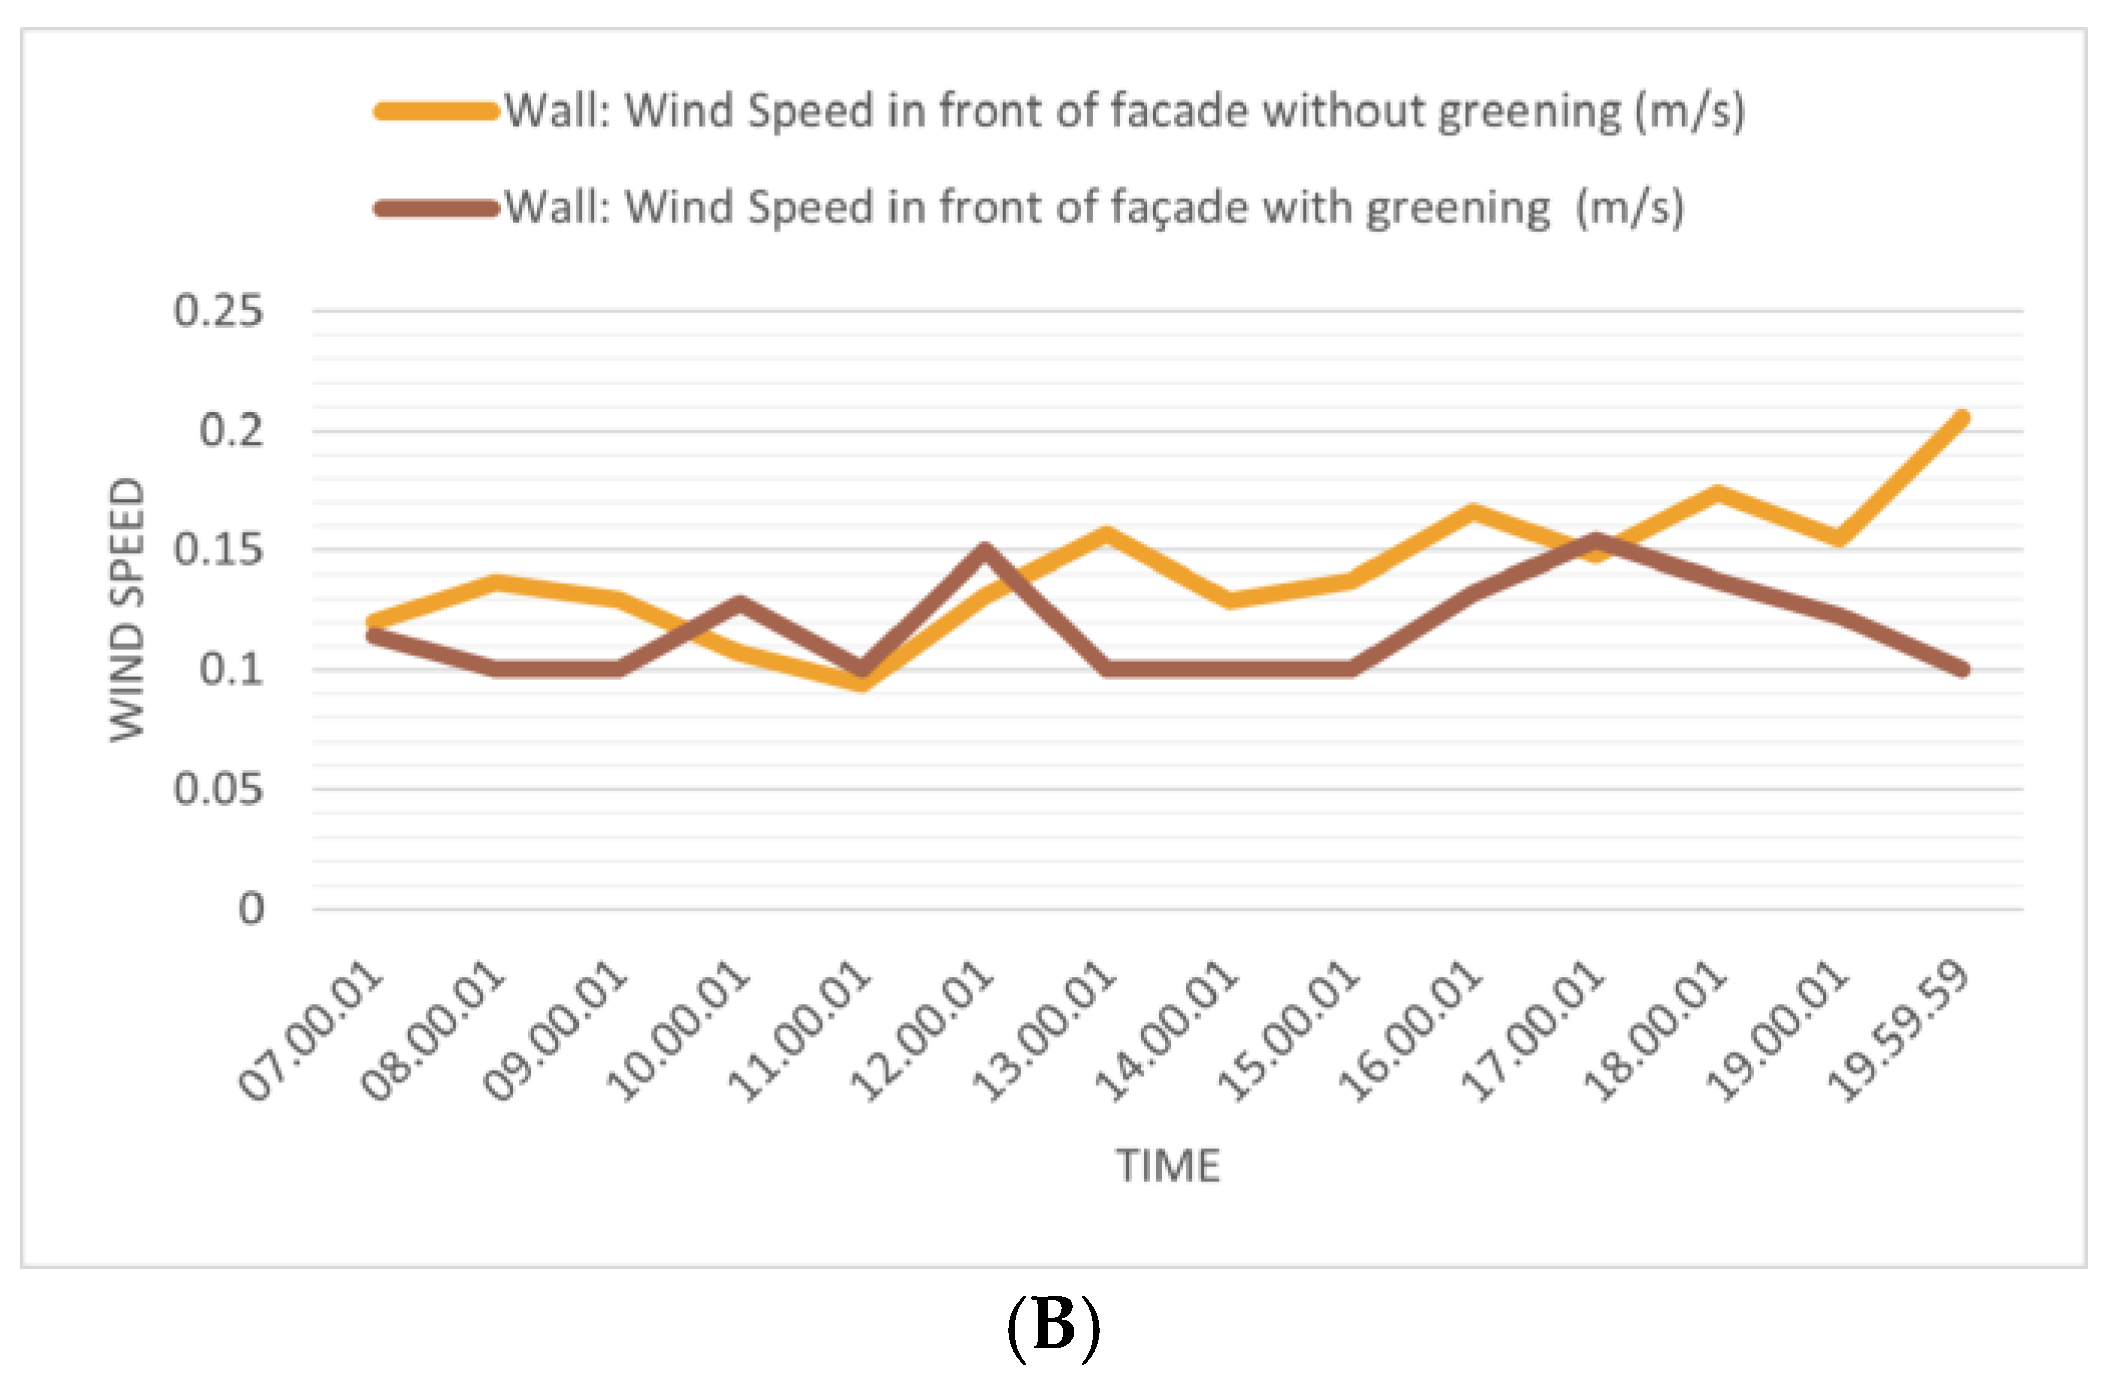
As seen in Figure 9, the LW shielded the wind from the façade during a winter day, contrasting with the façade without greening. When tested on the southeast façade during the cold day, the wind speed fluctuated by 0.7 to 0.24 m/s, and the most considerable dropping variation was 0.24 m/ss, while it was reported to be 0.05 m/s on the northwest façade. On the test day, the southerly wind was the predominant direction. Hence, the southeast façade had a more substantial wind barrier effect than the façade facing the northwest. A GW minimizes the heat transfer between indoors and outdoors [80]. Perez et al. [81] reported that blocking the wind enhances a building’s energy efficiency. The thermal losses from the building envelope are an indication of the value of the overall energy balance and depend significantly on wind convection [82]. Both tested façades effectively blocked the wind, contributing to building energy savings.
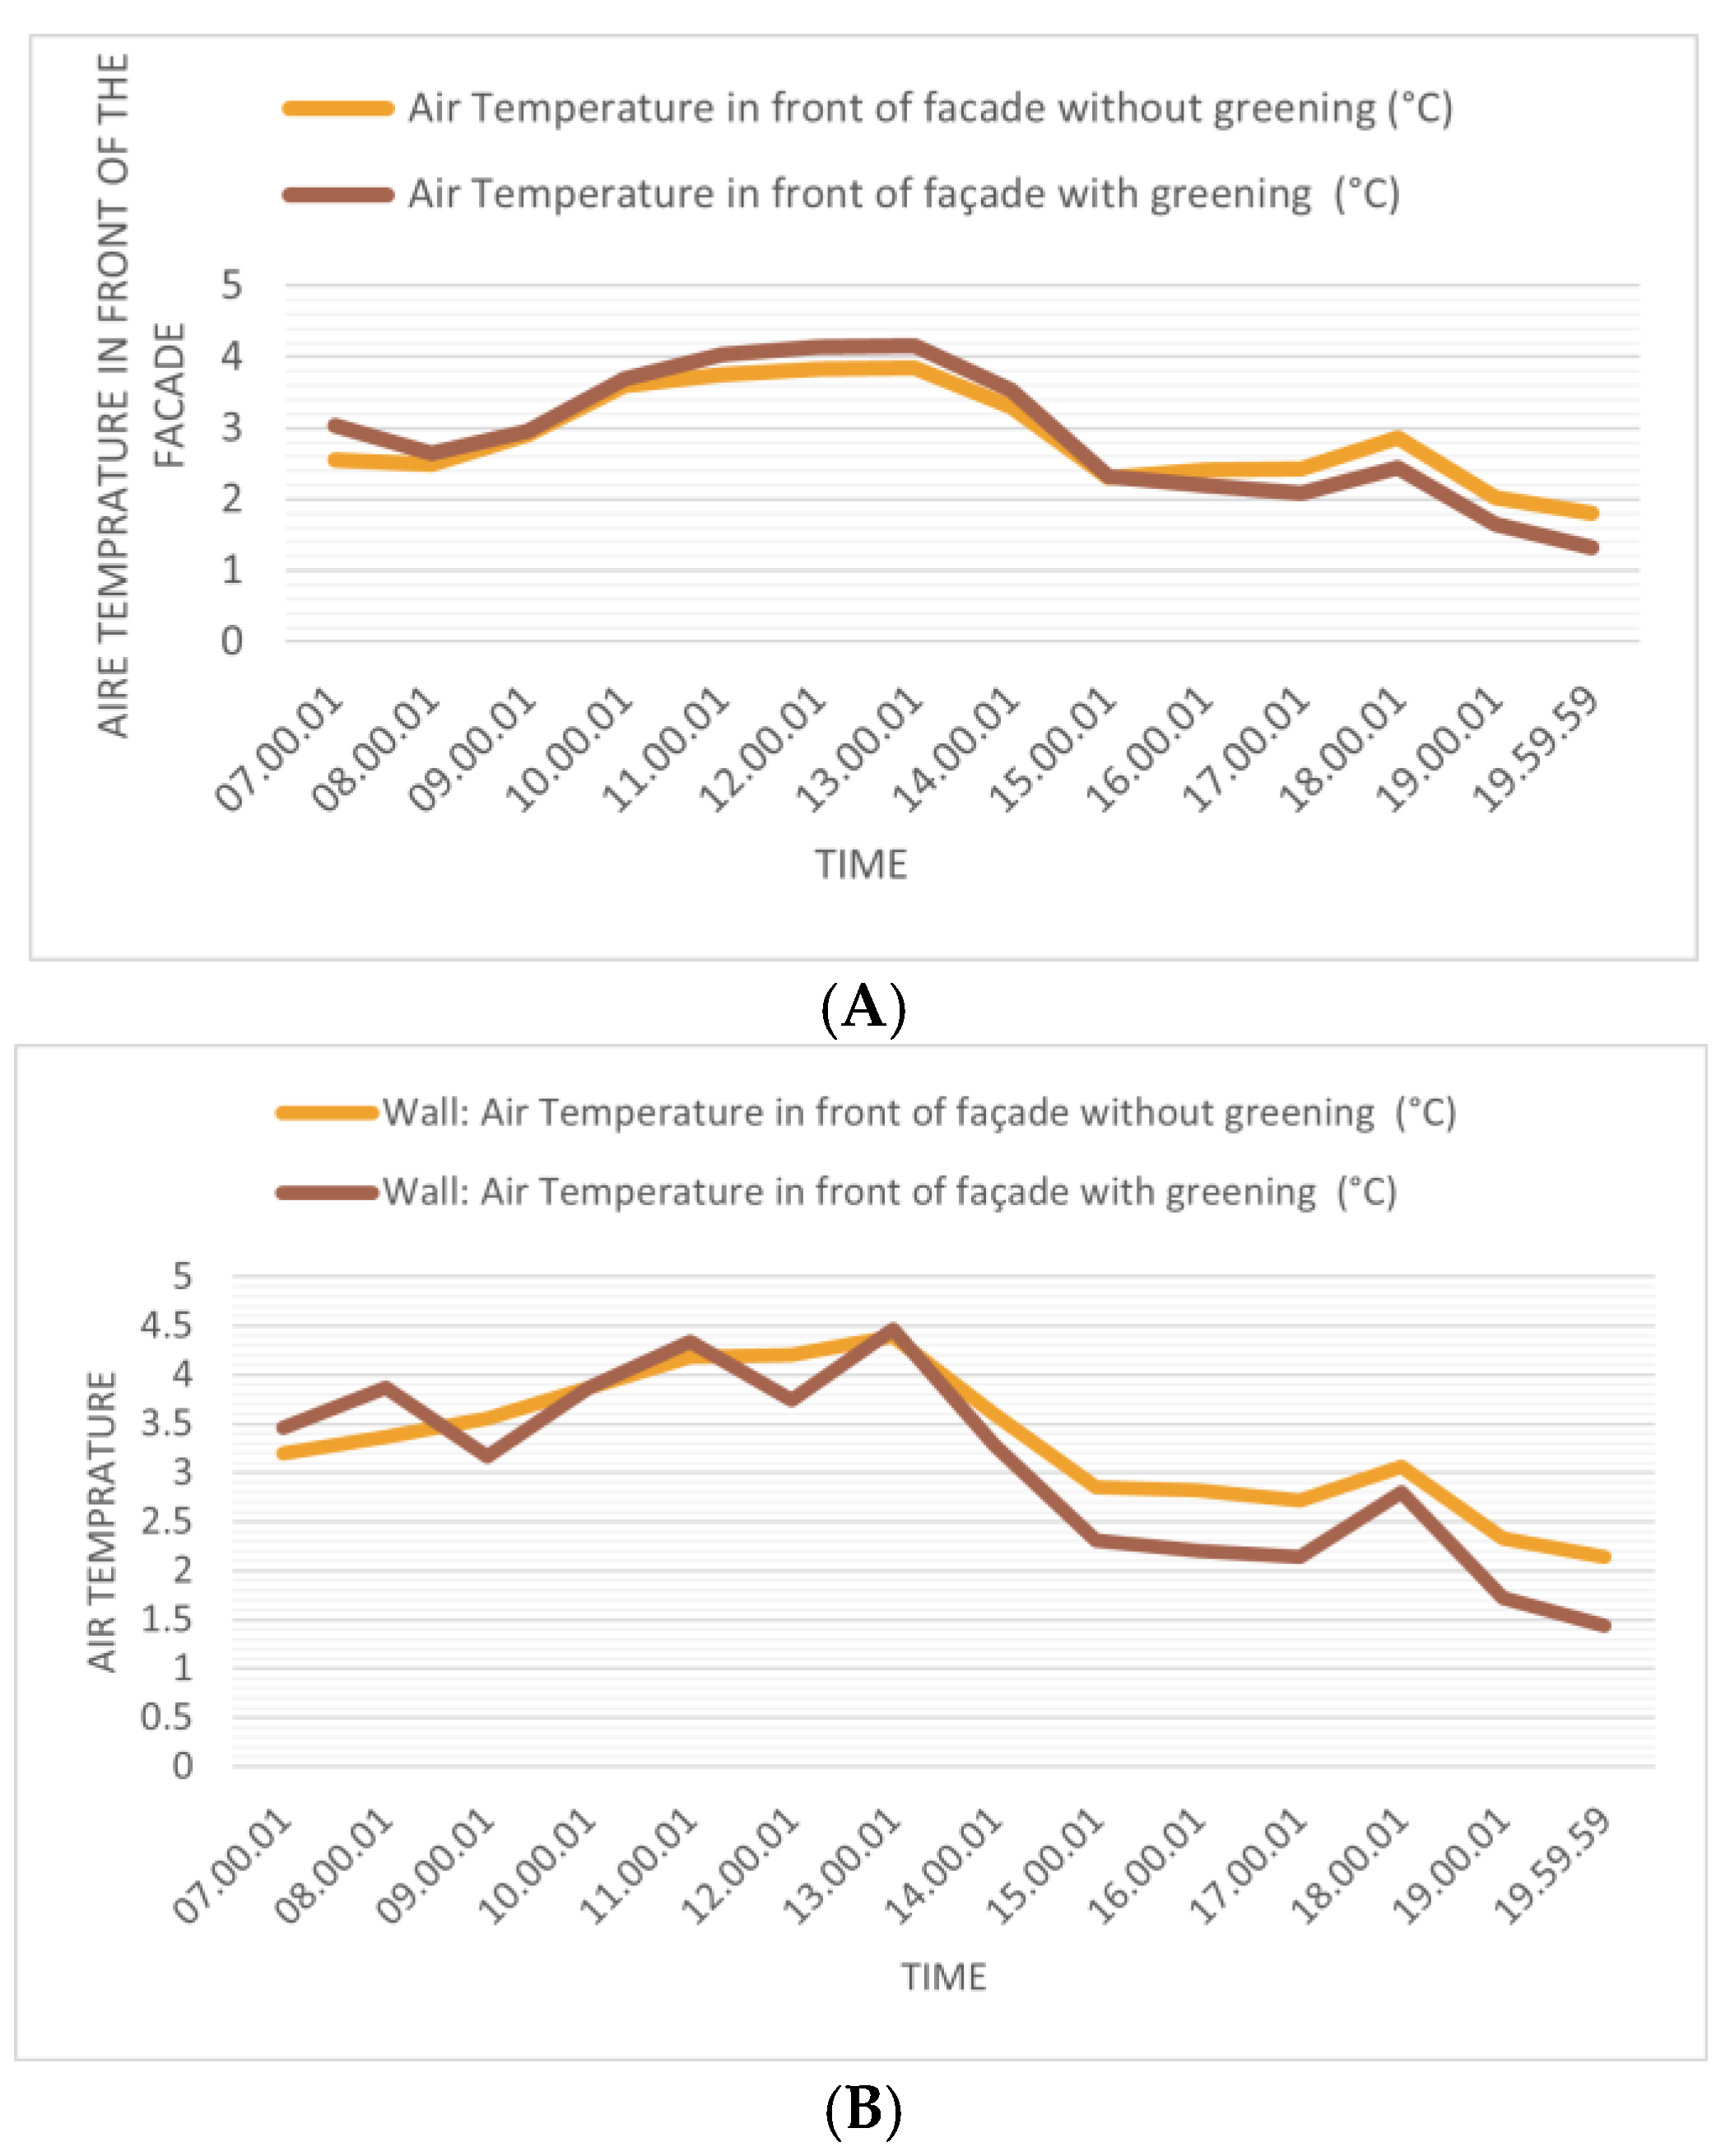
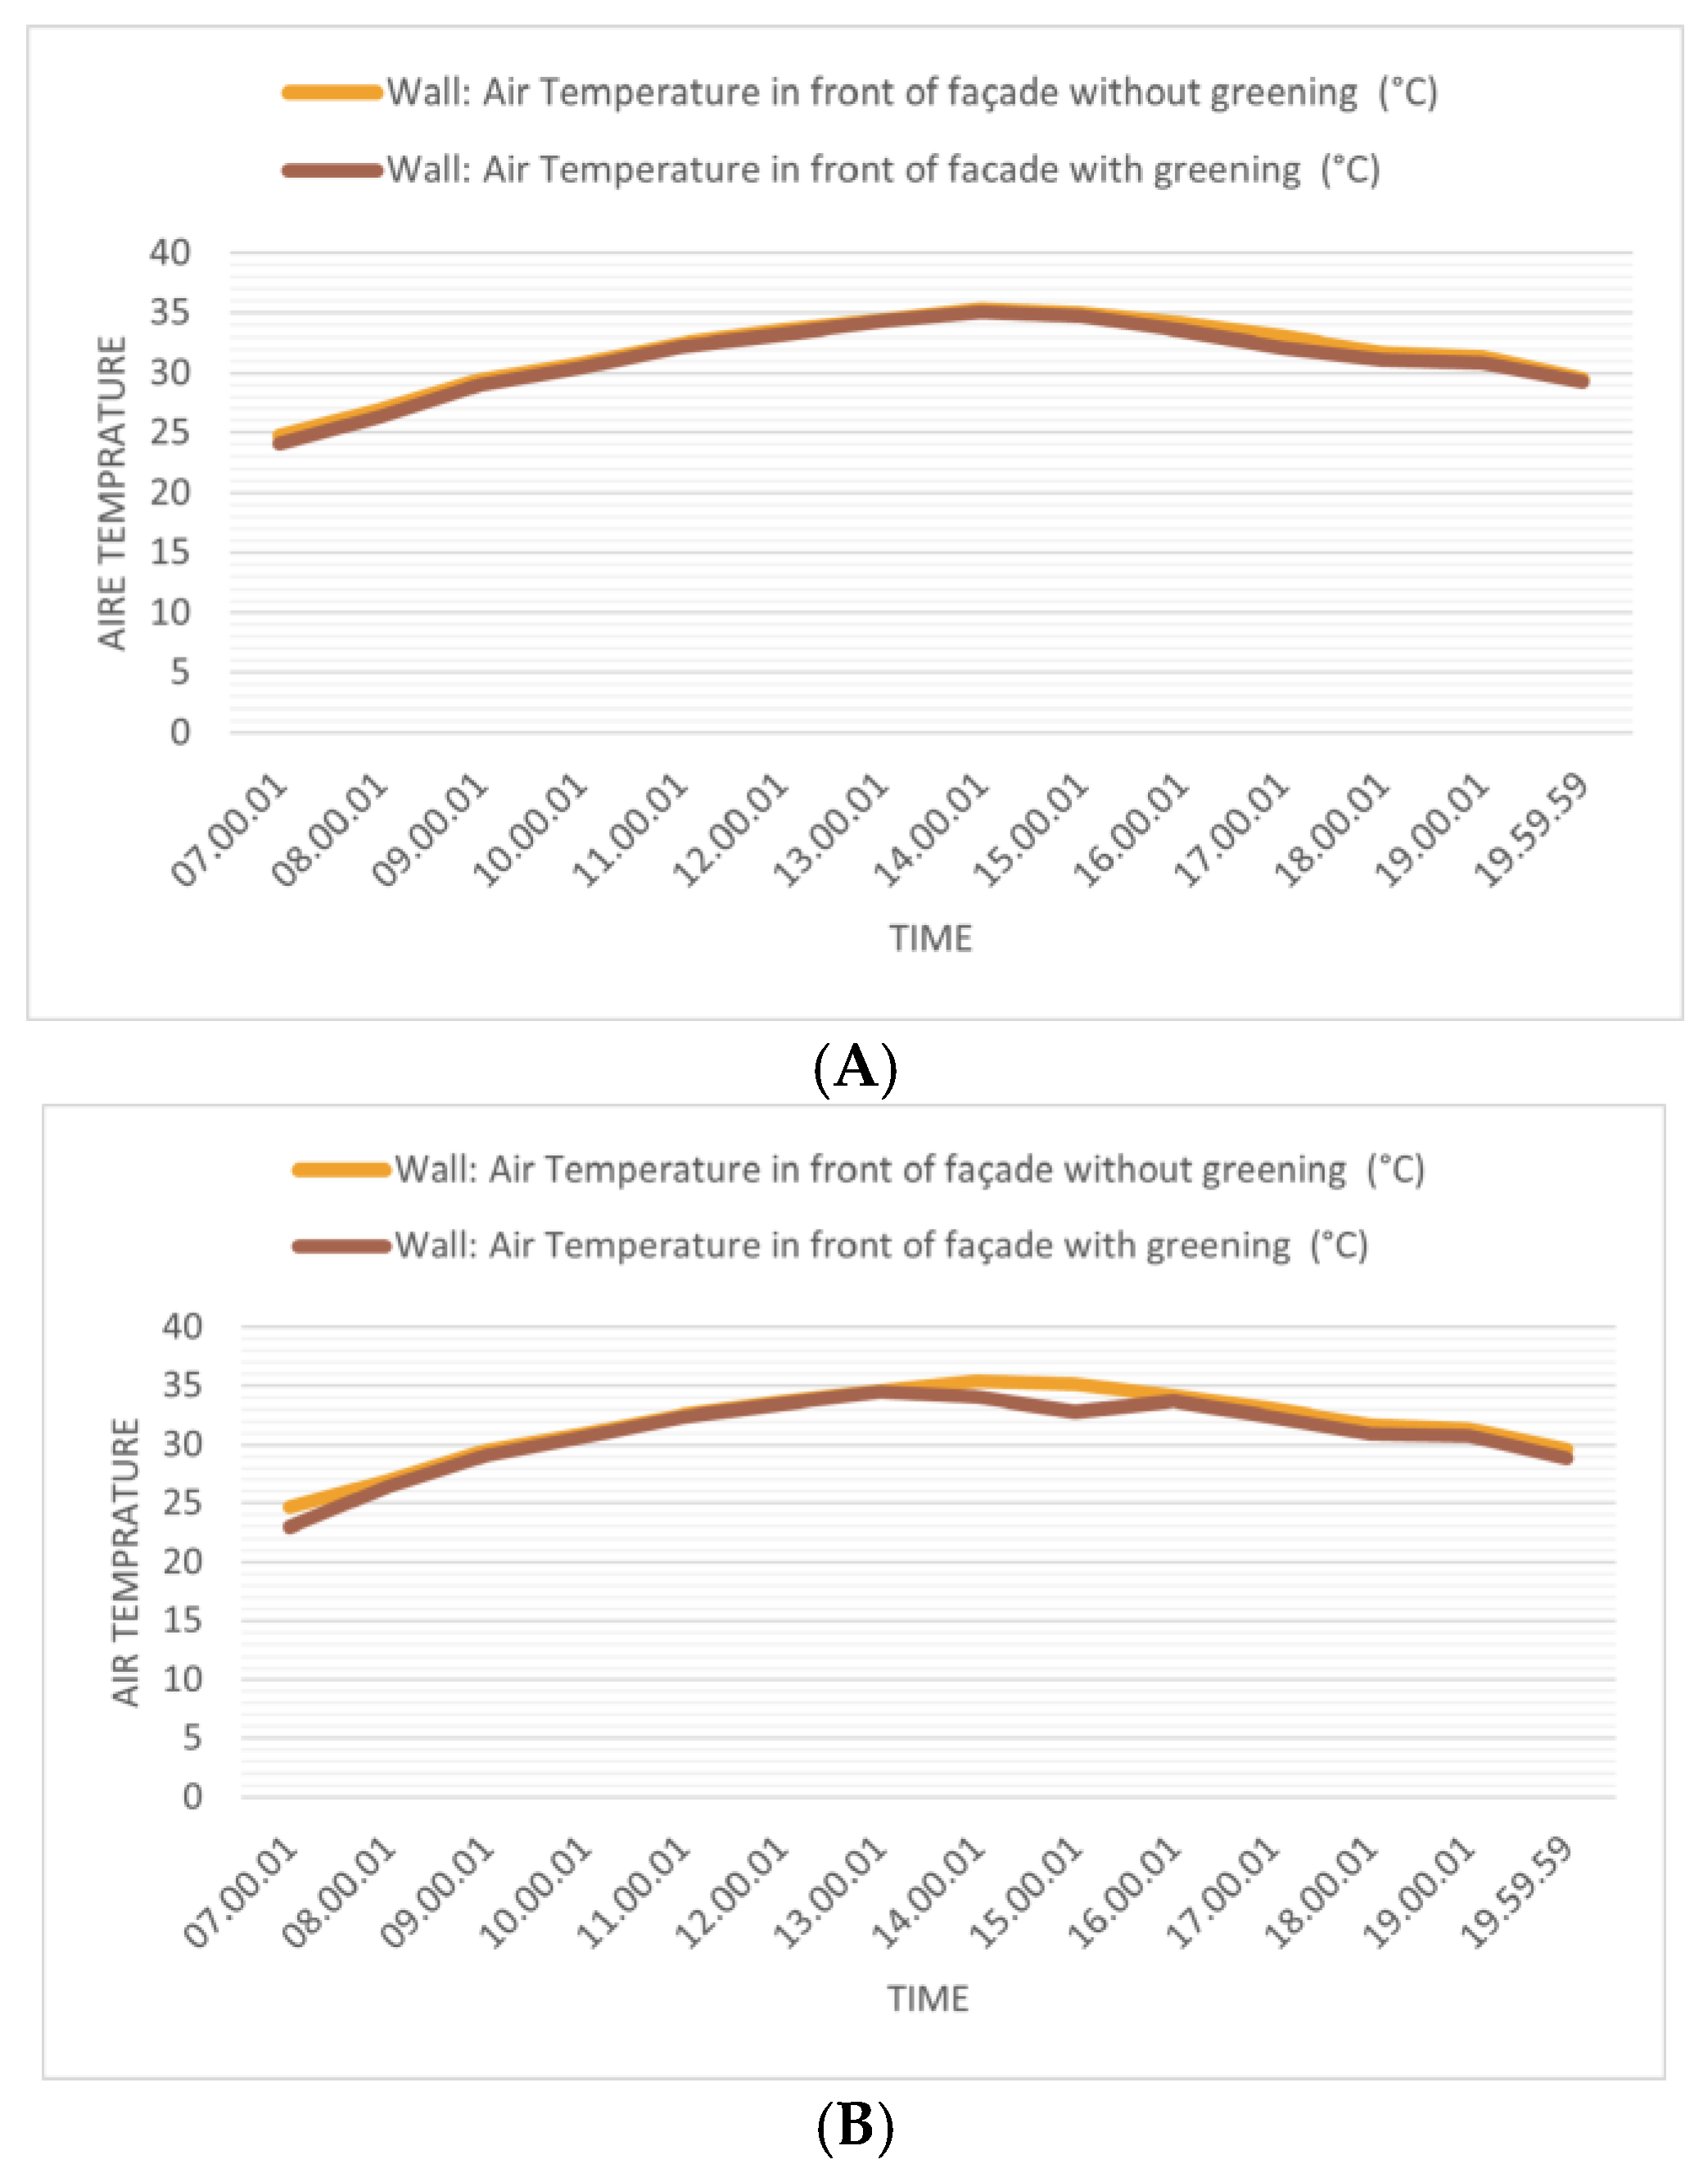
The air temperature in front of the southeast façade covered with plants between 7 a.m. and 3 p.m. was at its highest point of 0.31 °C on a cold winter day. After 3 p.m., the situation was reversed, and the air temperature in front of the southeast façade without greening showed the upper maximum difference between 0.35 °C and 0.48 °C. During the day, the LW reported lower air temperatures in front of the façade, which ranged from 0.00 to 0.71 °C. The air temperature differences in front of the northwest façade with greening reached their maximum amount at 7 p.m. (Figure 10).
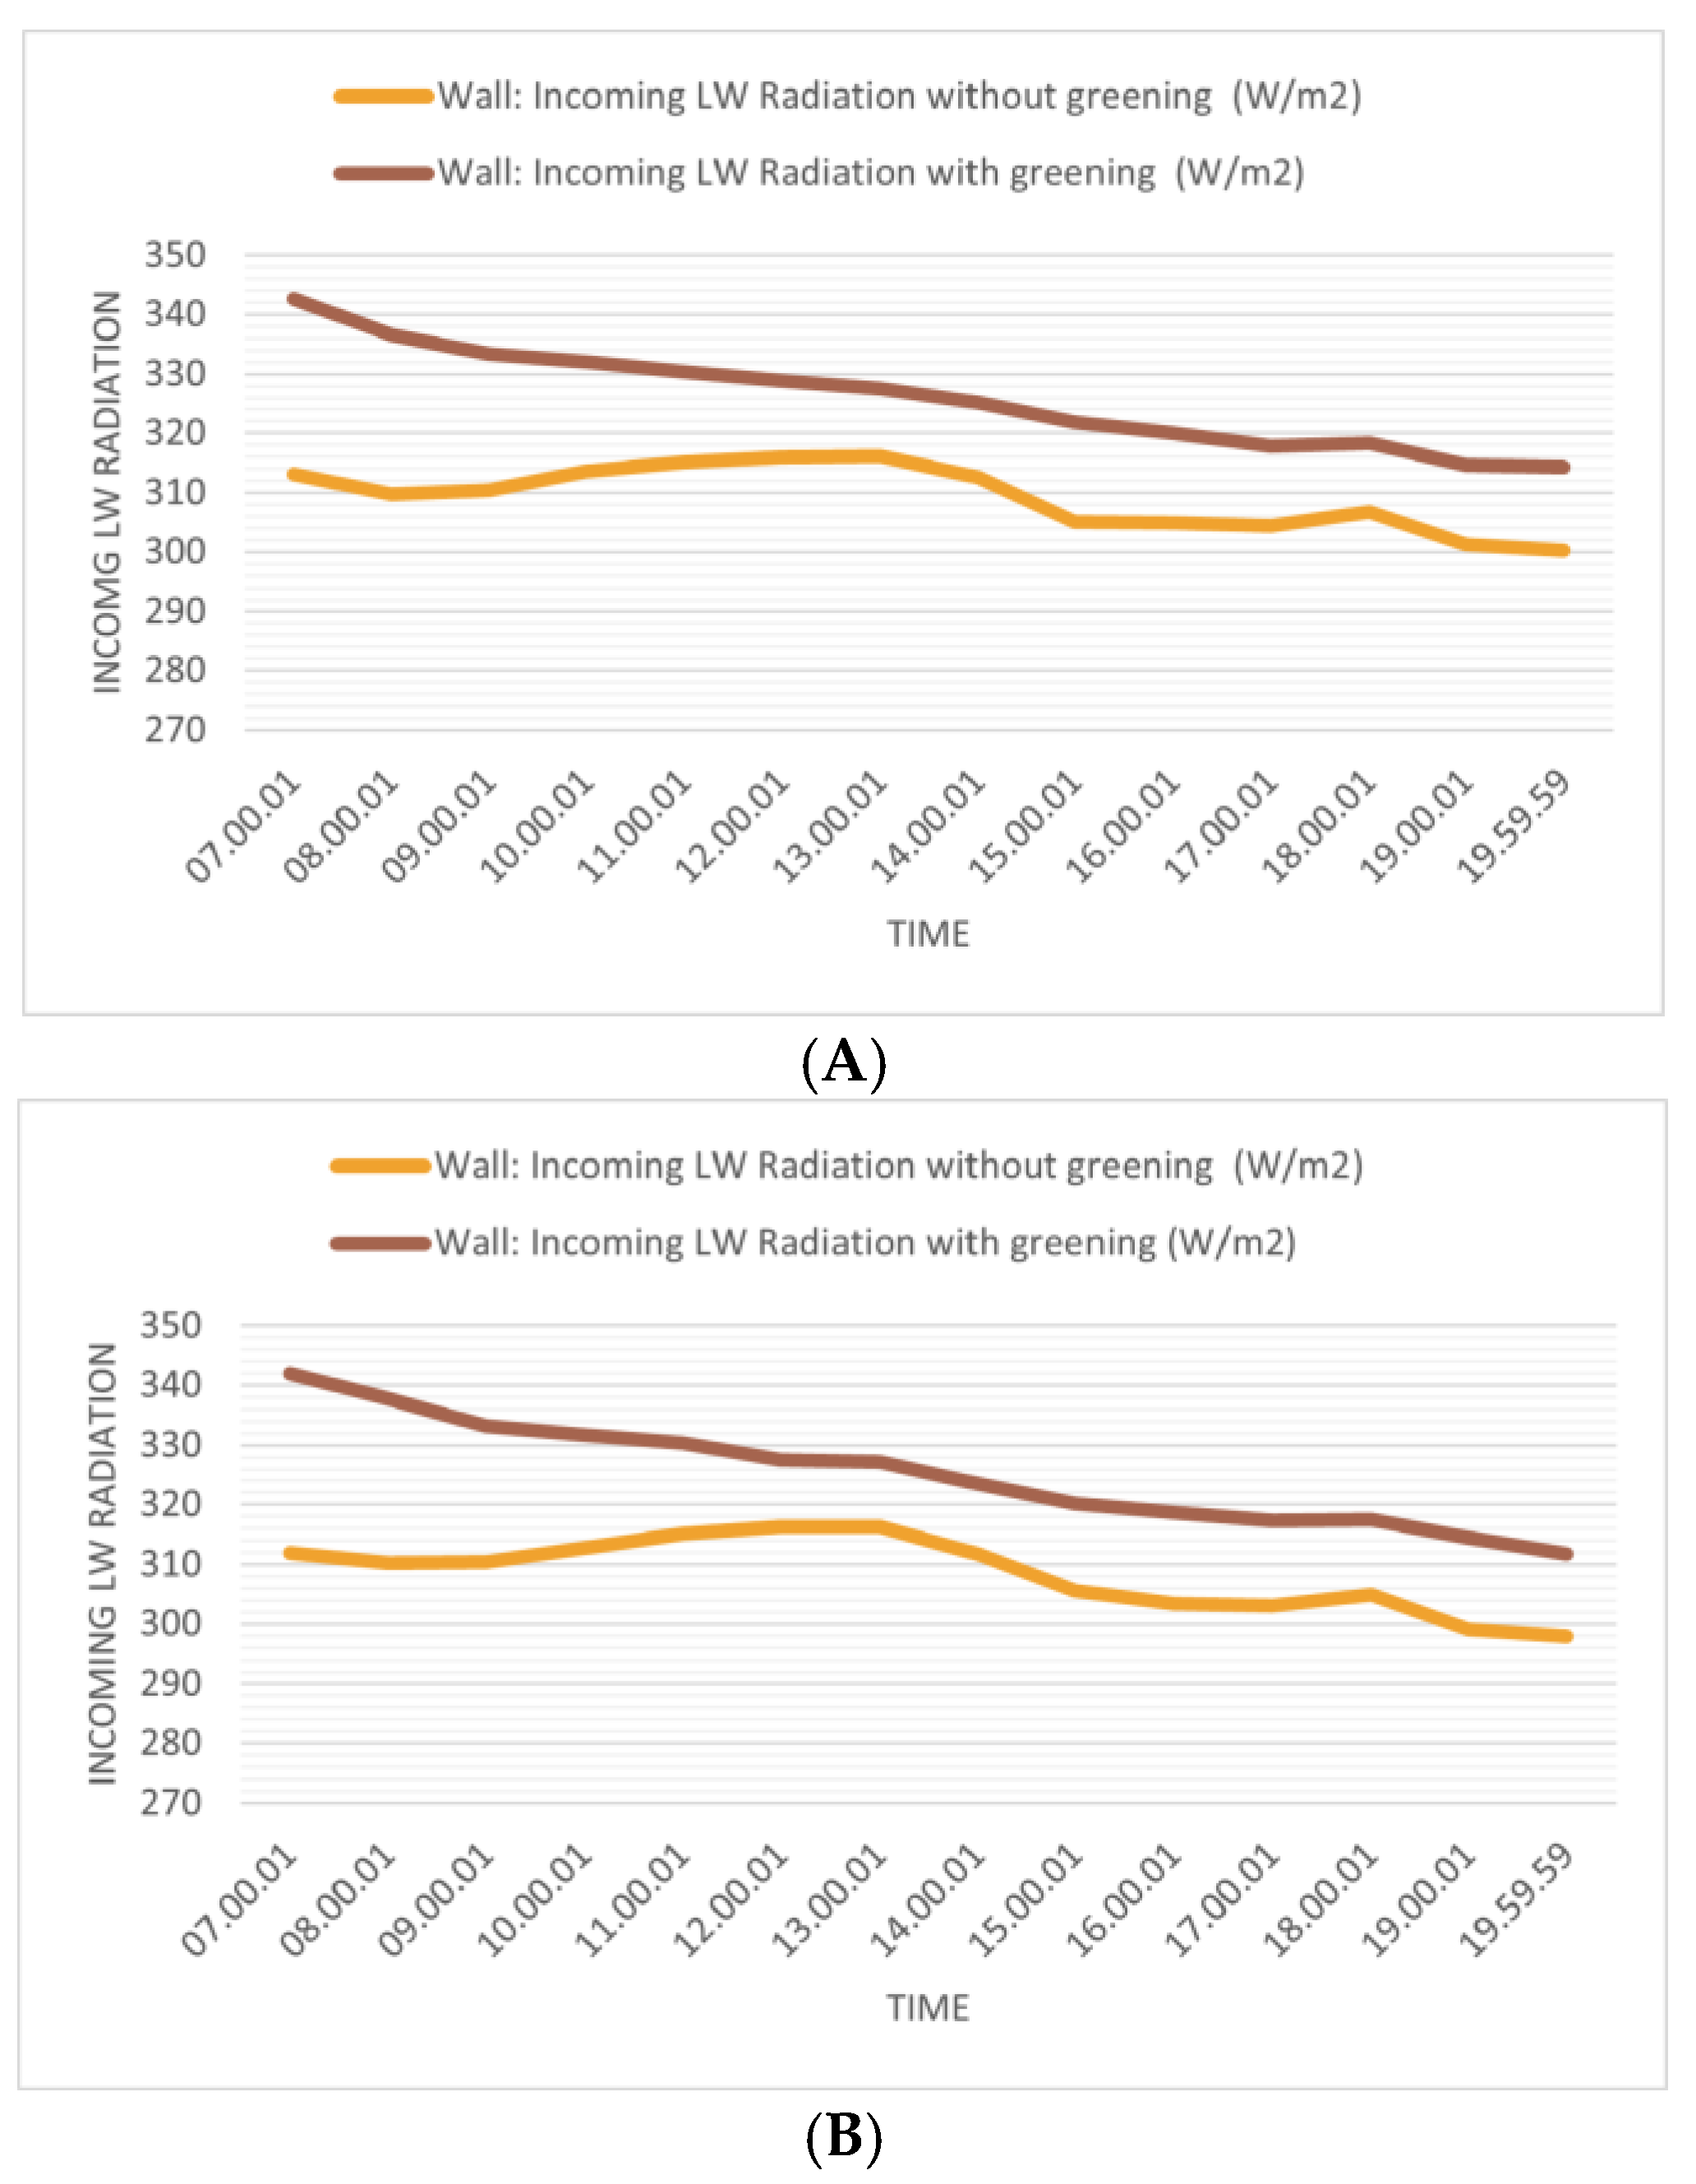
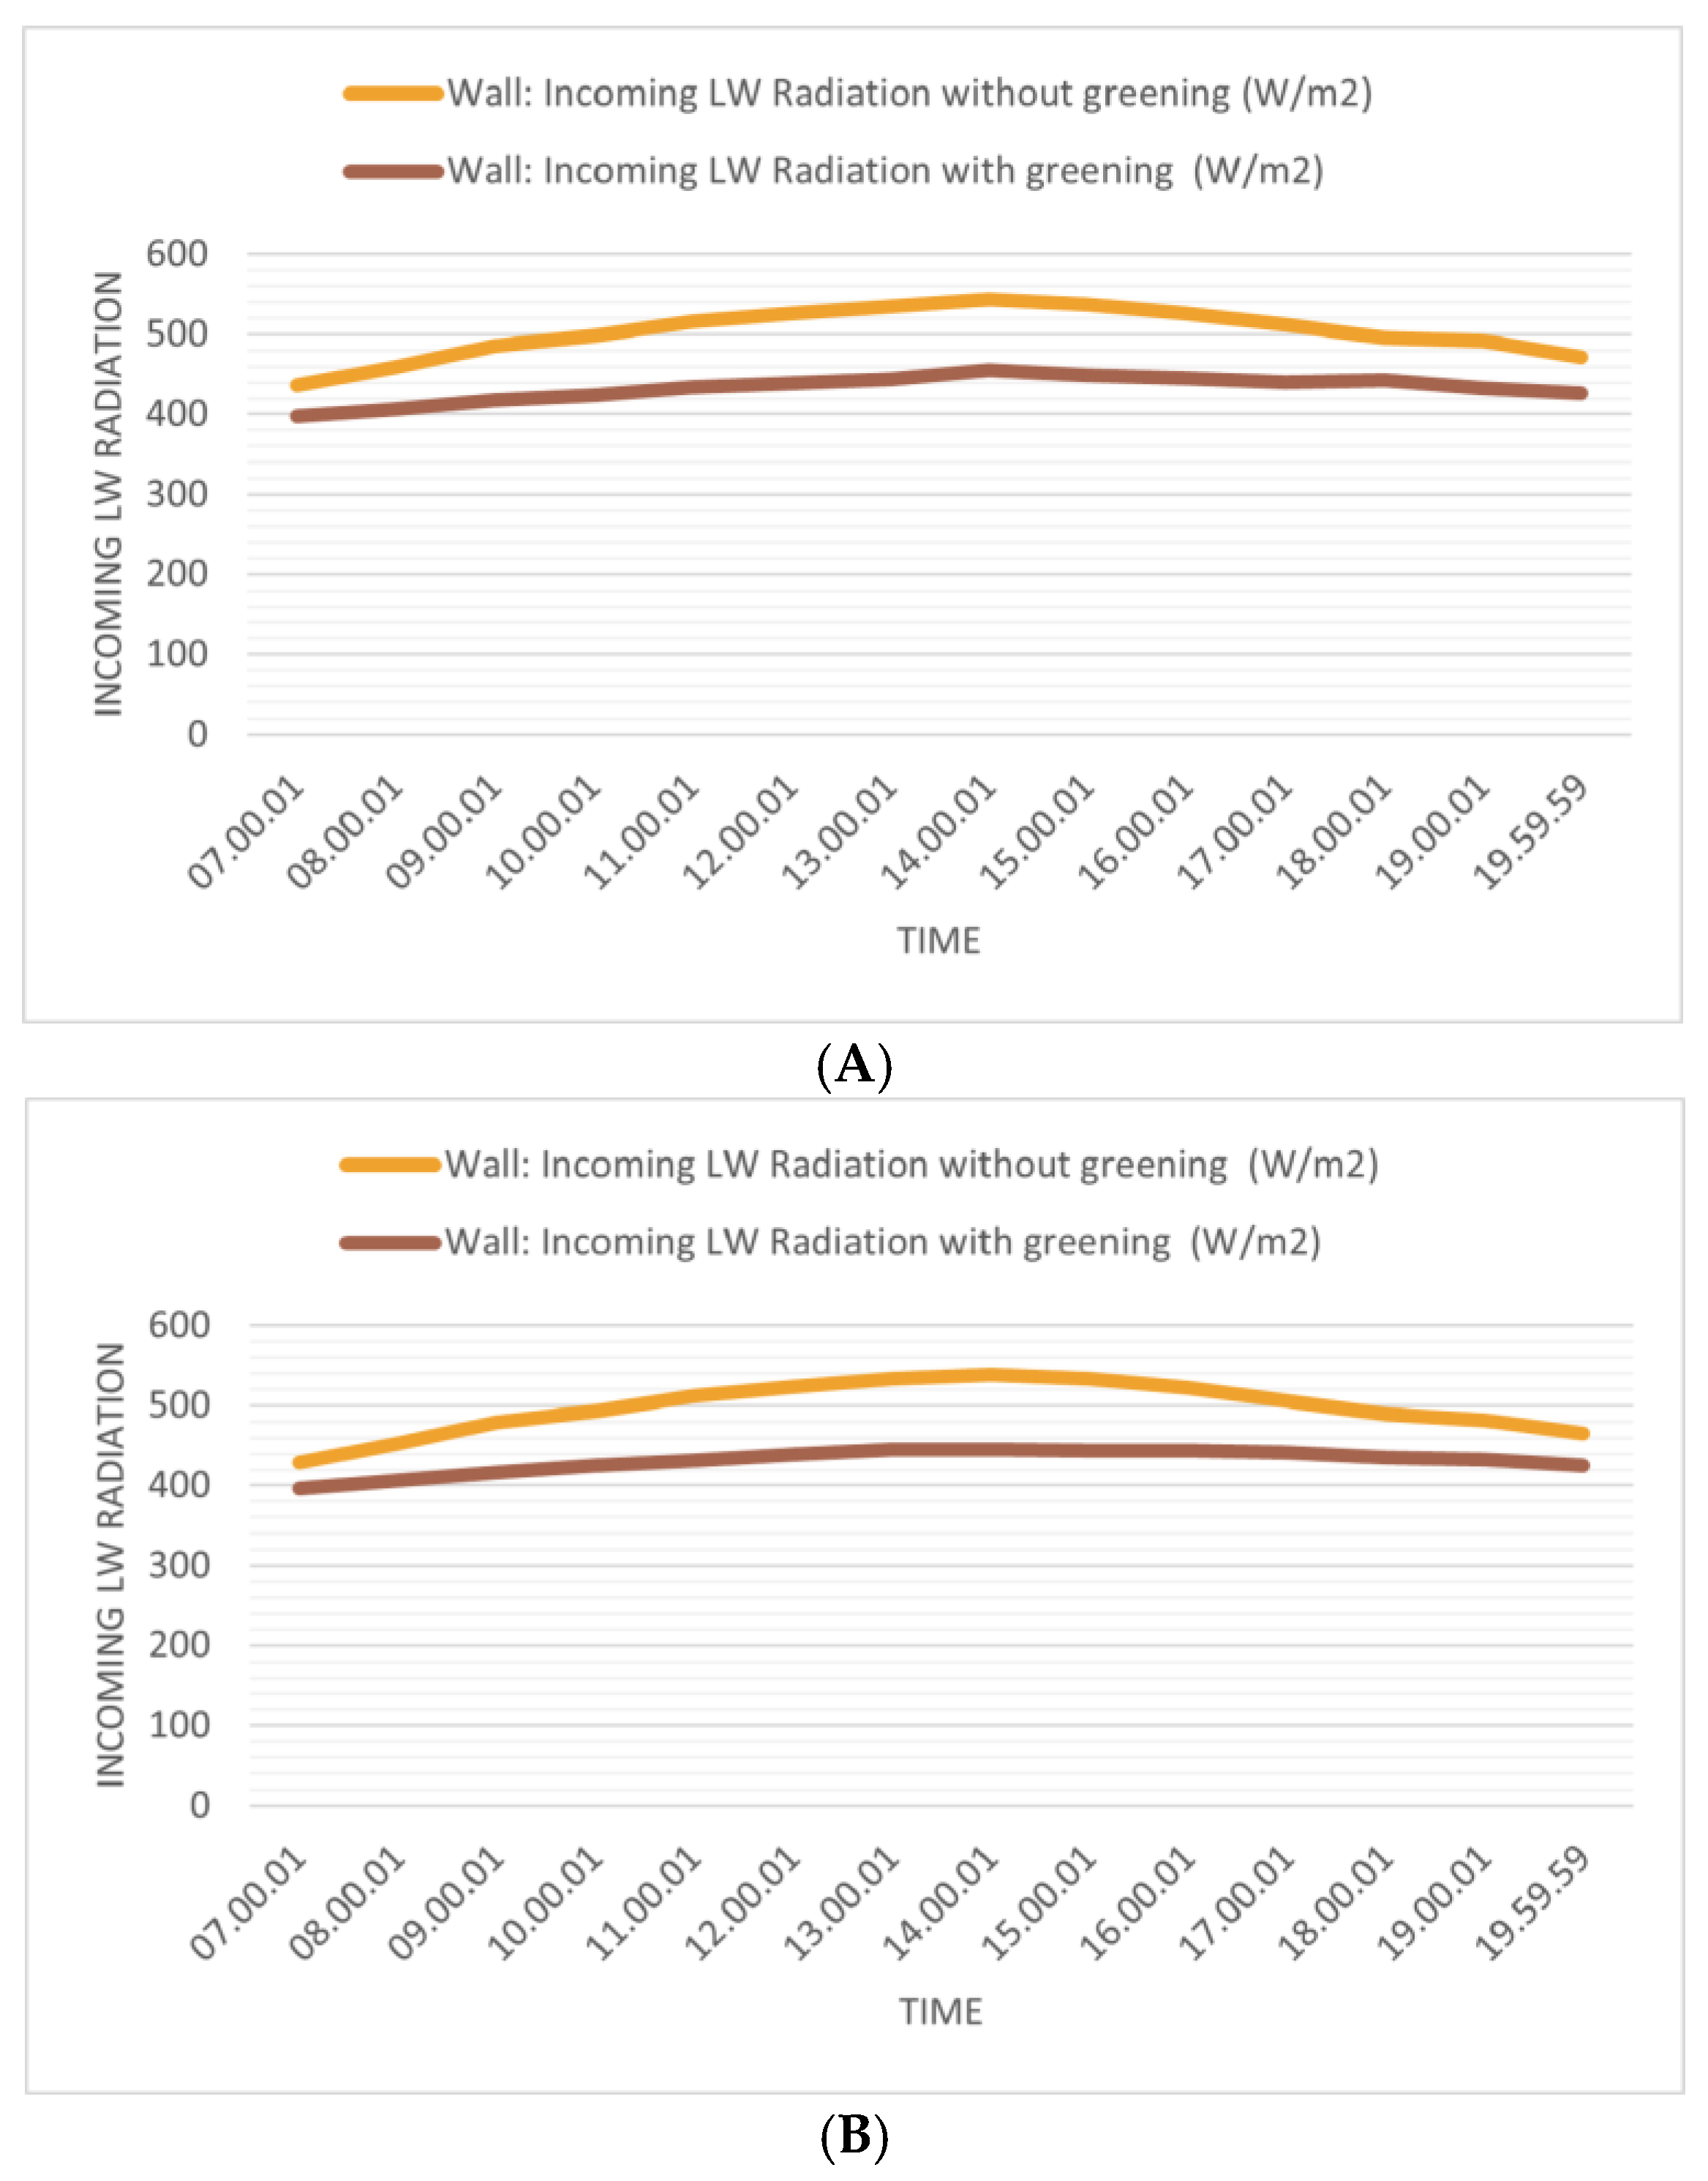
To emphasize the reduction in direct solar radiation through the LW, it was compared with a bare façade. The incoming LW radiation in the southeast façade created a more significant amount, with LW radiation differences varying between 11.44 W/m2 and 32.86 W/m2. Similarly, on the northwest façade, the LW received higher LW radiation on a cold day. The plants received more LW radiation, with the peak LW radiation exposure occurring at 7 a.m. (Figure 11). The differences ranged from 10.9 W/m2 to 27.37 W/m2 on the northwest façade. By comparing both façades, the southeast facing provides more efficiency on a cold day due to the incoming LW radiation.

5.2. Effectiveness of Living Wall Regulating Temperature in Summer

The LW in front of the southeast façade prevented the wind on a summer day. The highest wind speed blocking occurred at 9 a.m., with differences of 0.17 m/s; at 2 p.m., it was almost zero. The northwest façade covered with plants experienced different thermal behavior. There is no consistent pattern due to changes in the wind direction on the tested day. Most of the time, the LW was less successful at preventing the wind in this direction compared with the façade facing southeast (Figure 12).
The air temperature decreased by around 2.3 °C in front of the northwest façade at 3 p.m. Compared to the various plants examined in the UK [16], the air temperatures were 3 °C cooler during the hottest times in the presence of plants. The effect of watering frequency was noted as an essential factor, as plants significantly reduced the air temperature in both the north and south facades.
Although there was a similar trend in the air temperature in front of the southeast and northwest façades, on a hot summer day, there was no air temperature difference in either orientation (Figure 13).
The primary methods of heat exchange in a GW are LW radiation, solar radiation, convective heat transfer, and evapotranspiration [83]. Incoming longwave radiation (ILR) from the atmosphere and outgoing LW radiation (OLR) from the Earth are the two categories of LW radiation. “Net LW radiation” refers to the LW radiation that this two-directional radiation leaves behind in a particular region. Infrared radiation increases when net LW radiation increases in space, which impacts sensible heat [84]. The surface temperatures of buildings brought on by shortwave radiation have an impact on longwave radiation. This also incorporates the warmth emanating from a shortwave emitting [85]. As a result, incoming LW radiation is higher than in other areas in the analysed case, which is situated in a congested section of the city. As indicated previously, Meteonorm’s meteorological data were used to determine the highest hourly average radiation range in July in Manchester, with minimum and maximum values ranging from 110 to 430 W/m2 in direct normal situations. The façade covered with plants on the southeast orientation received less LW radiation compared to the façade without greening, with differences ranging from 60.72 W/m2 to 88.17 W/m2. Similarly, in the northwest orientation, incoming LW radiation in the façade with greening was consistently lower than a bare wall. At 2:00 p.m., the most notable variations experienced with the range of variations in lowering the incoming LW radiation were 46.43 W/m2 to 92.71 W/m2 (Figure 14). Plants play a significant role in lowering LW radiation. In the summer period, they can enhance thermal comfort considering the heat balance inside the building. In particular, the southeast façade protects the envelope more effectively.
Eggenberger [86] pointed out that for the summer period, wall surfaces were protected by greenery and reduce the thermal loads of LW radiation through (a) plant reflectivity, (b) convection of the energy received by plants for development and biological processes, and (c) evaporation from the leaves. Tudiwer and Korjenic [87] investigated the thermal resistance effect of the LW in winter, and the thermal resistance of the façade with greening was between 0.31 m2 K/W and 0.68 m2 K/W, depending on the kind of GW and location. In addition, the surface temperature was reported to be higher in the case of the LW at about 0.44 °C and 3.52 °C on average. Likewise, Perini [30] suggested that a decrease in wind speed improved the building envelope’s efficiency and thermal resistance. Figure 14 shows that the heat flows via plant-covered wall surface parts are less than those of the bare surface sections, which are exposed to solar radiation directly.
Green-covered walls dramatically reduce the amount of undesired heat transferred from the outside to the inside of the building envelope, strongly affecting UHI in urban areas. The findings show that plants enhance the longevity of the façade and protect it from undesired radiation. By comparing the LW energy balance in the façade with greening and the bare wall on a tested hot summer day, the most significant changes were recorded at 12 noon on the southeast façade and similarly, on the northwest façade ranged from 26.71 to 21.19 W/m2 and 32.23 to 26.71 W/m2, respectively. The largest LW energy balance reduction simultaneously on a cold winter’s day varied from 19.89 to 16.46 W/m2 in the southeast orientation and from 23.22 to 29.89 W/m2 in the northwest façade. Due to the LW energy balance fluctuation, depending on the time, the range with the greatest intensity was chosen as a result.
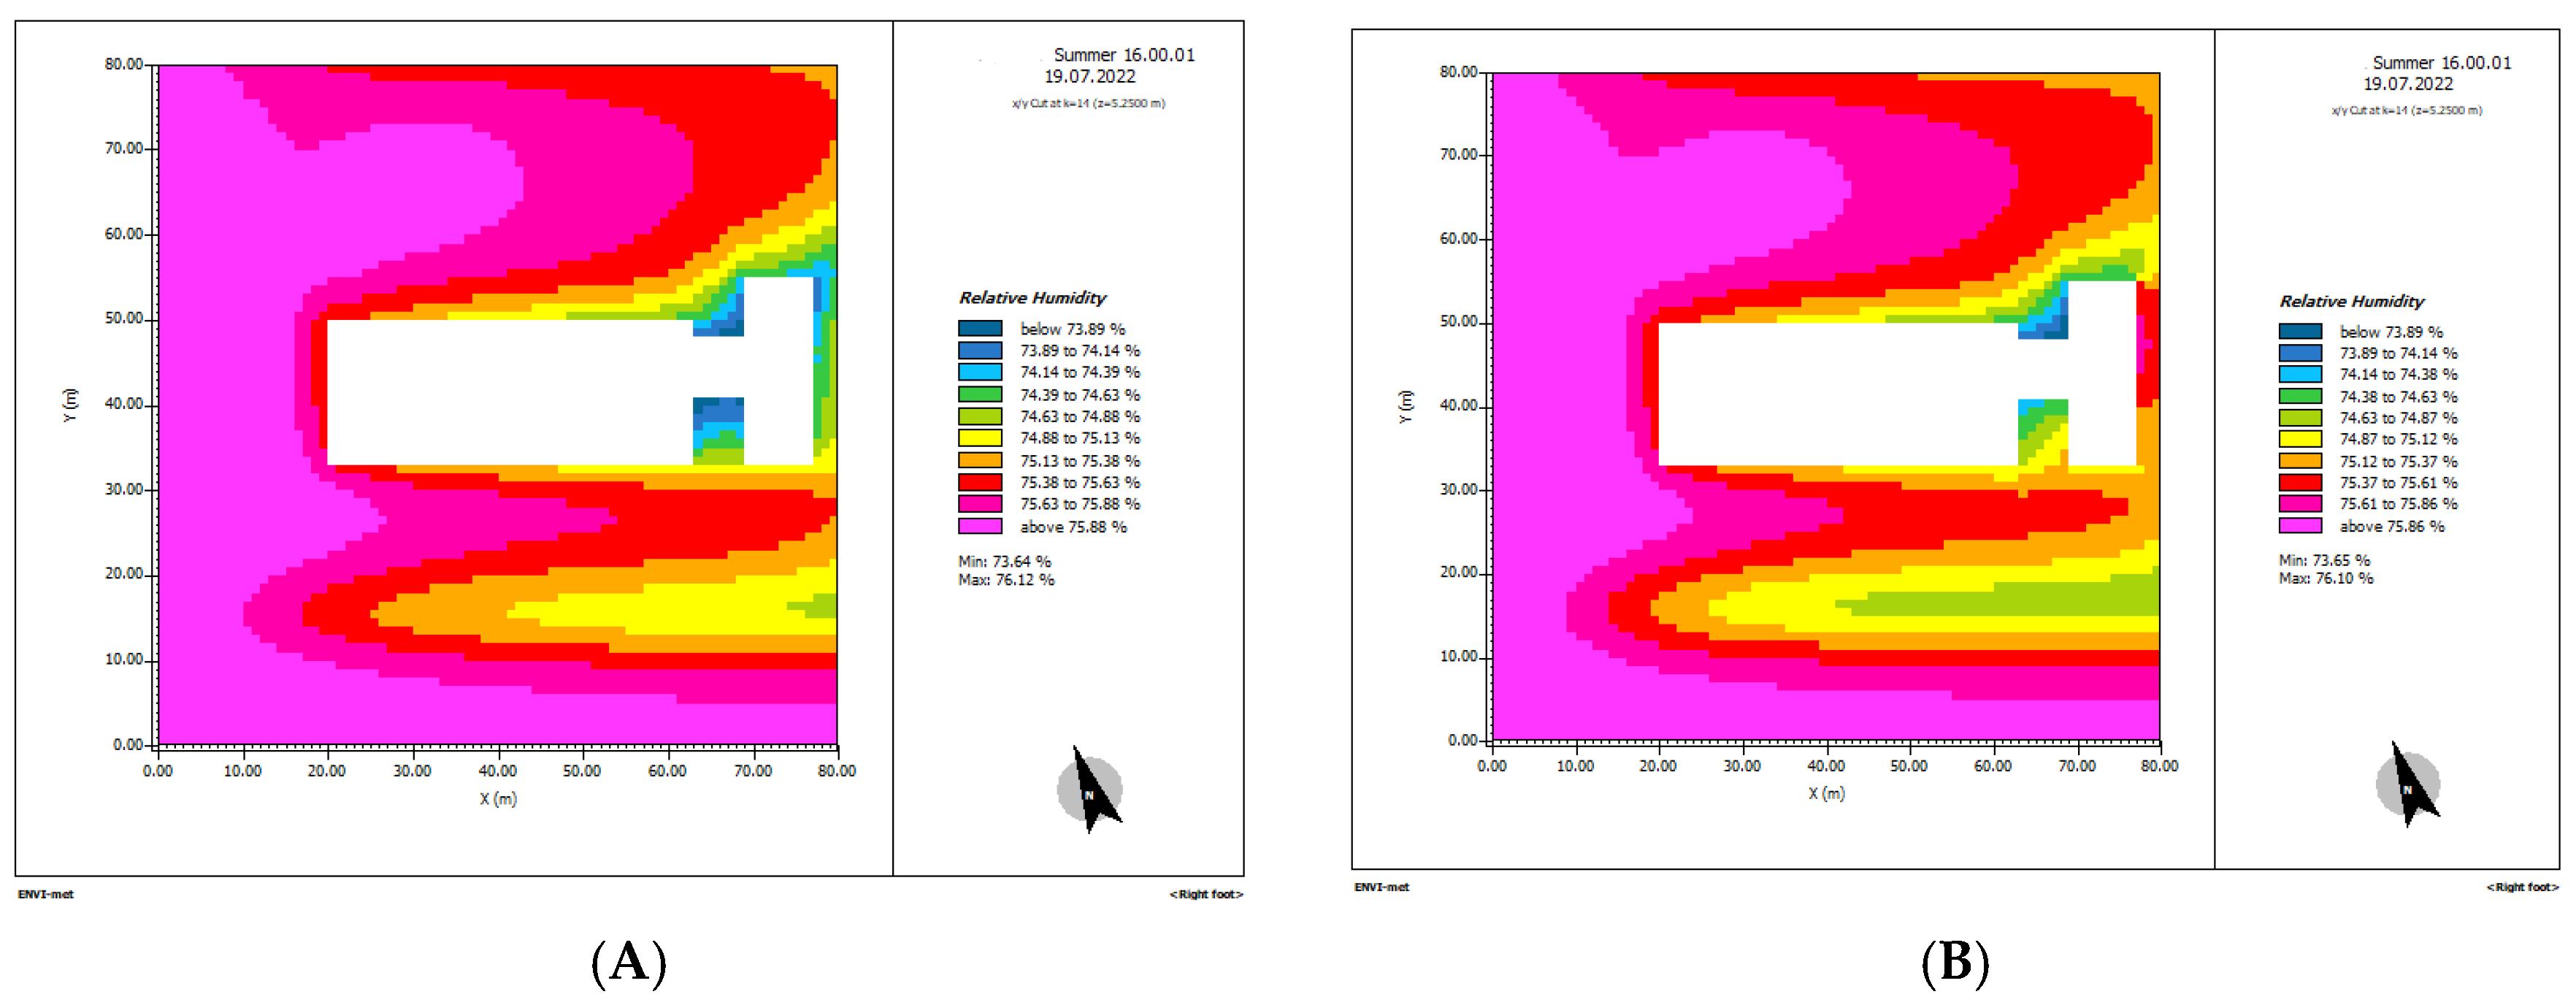
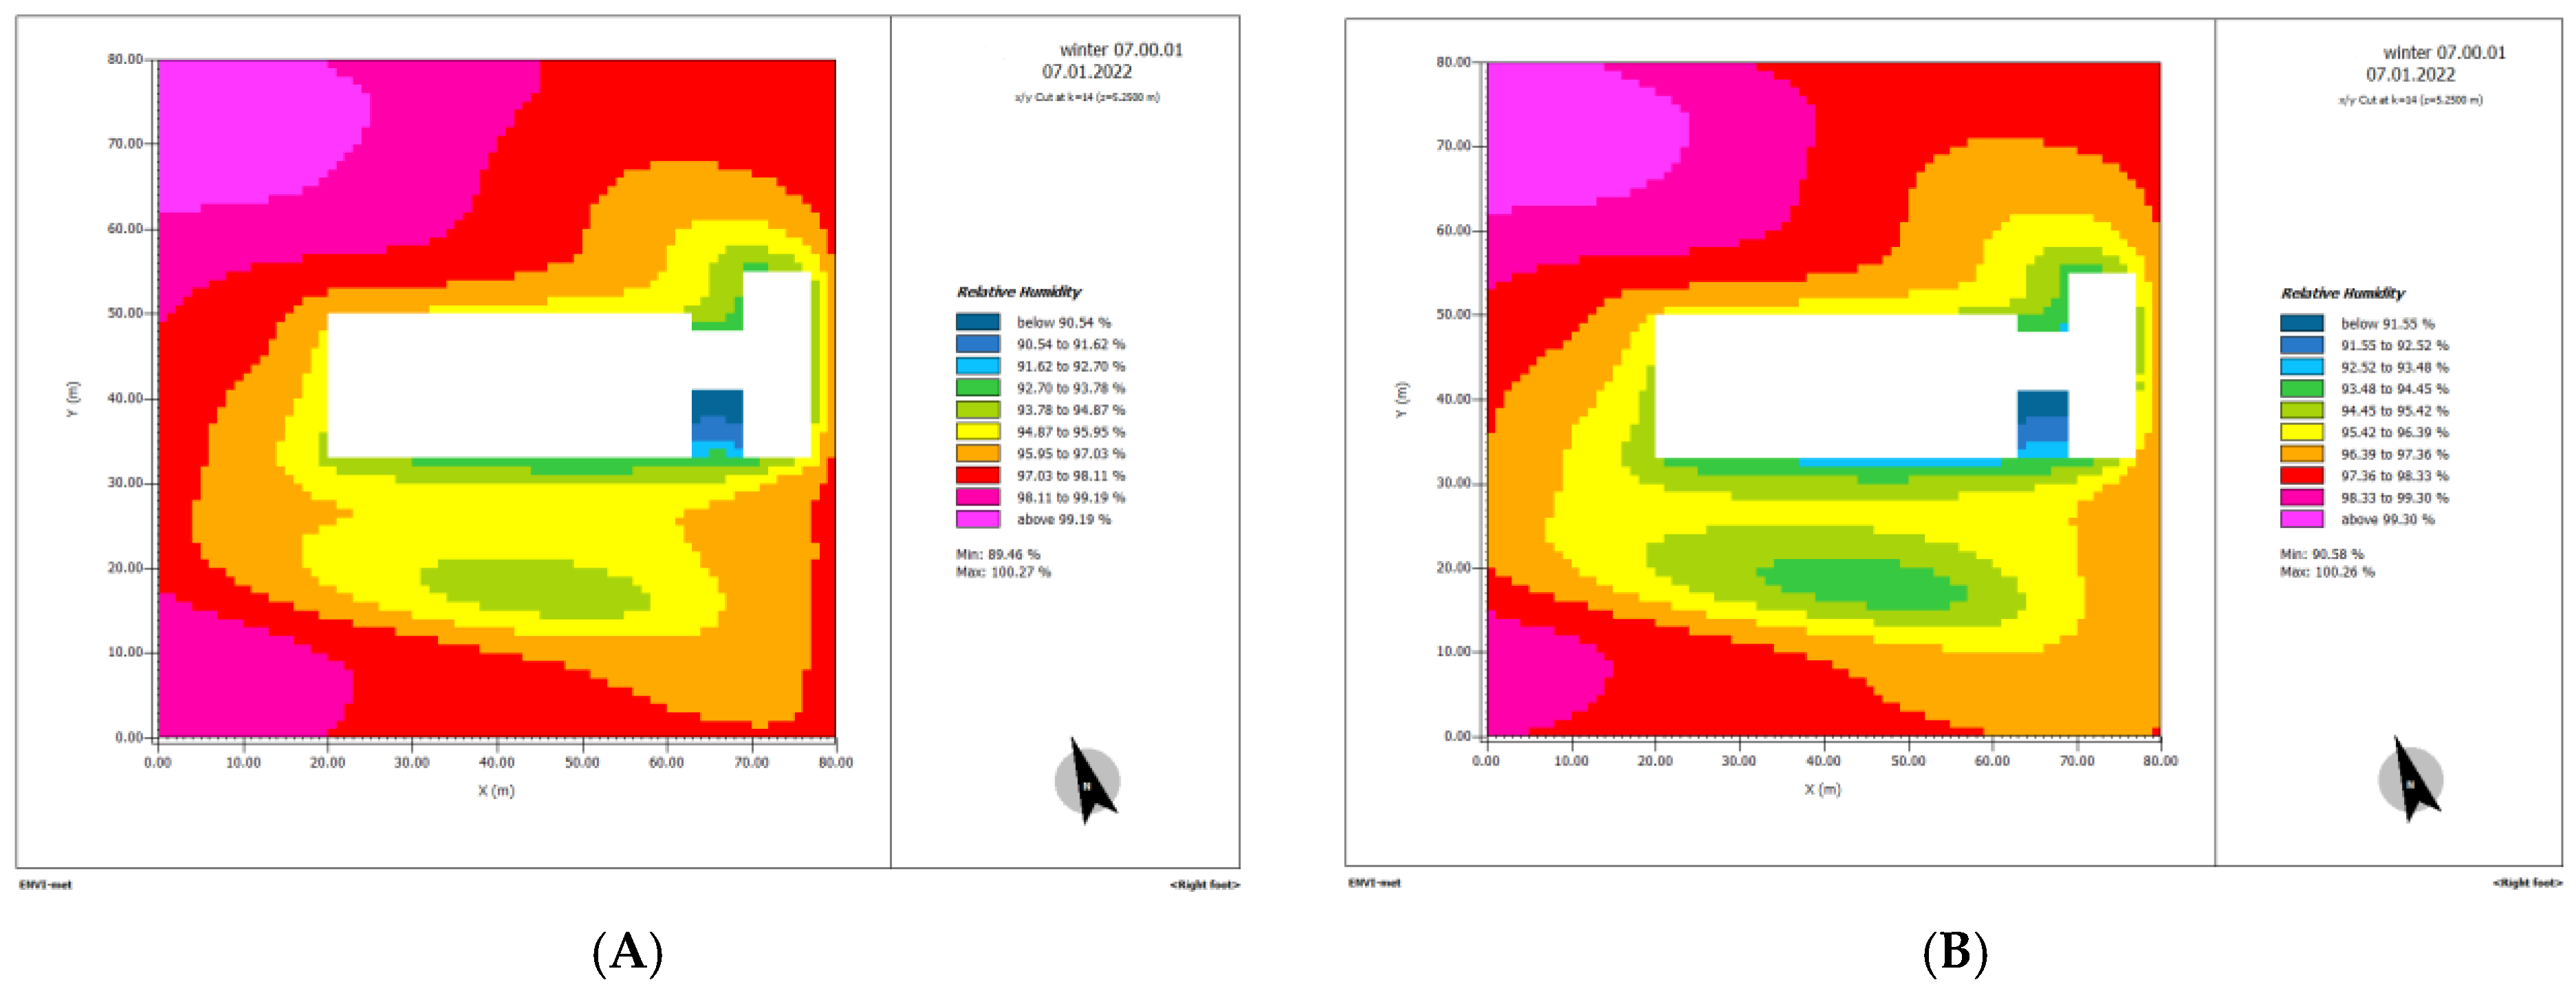
In this simulation, the RH varied between about 0.84 and 1.47% in summertime compared to the winter day, which showed a slight difference in front of the façade covered with plants and the bare wall of between 0.25% and 1.64%. Accordingly, the RH rose, on average, by about 1% on cold and hot days. The greatest variation was reported in front of the southeast façade (Figure 15 and Figure 16). The primary contributor to temperature and humidity fluctuations in the LW was evapotranspiration from the water in the substrate, and the plants had a minimal impact [88].

6. Conclusions

This paper discusses how LWs impact the façade temperature and thermal performance of walls facing southeast and northwest orientations in Manchester’s weather conditions.
The study investigated the local climate effects and the choice of optimum plants to be placed on LWs and the buildings (without greenery) separately. It examined the factors influencing the thermal behavior of LW, including wind speed, air temperature, air humidity in front of a façade, and incoming LW radiation.
A comparison of façade temperatures was made considering the effect of the seven plant species planted, including Hedera Helix “Green Ripple”, Lavender Hidcote, Matteuccia Struthiopteris, Tellima Grandiflora, Buxus Sempervirens, Dryopteris, and Vinca Minor “Atropururea”.
The following are the key conclusions that can be made from the results that have been provided:
  • The façade’s temperature significantly decreased on the southeast façade on a hot summer day in July 2022. Compared to the reference façade without greening, the LW was, on average, 15.00 °C cooler, which helped to reduce the cooling load and energy consumption. The reduction in façade temperature on a hot July 2022 day ranged from 5.43 °C to 23.48 °C;
  • The northwest façade indicated remarkable effectiveness in lowering the surface’s temperature by an average of 13.53 °C during the specified period. Considering a cold day in January, the northwest façade covered with plants did not experience a significant temperature increase on the test date. However, the southeast façade, which was 2.18 °C, on average, warmer than the bare wall, showed greater efficiency;
  • The LW was, on average, approximately 2.18 °C warmer than a bare wall on a cold winter day in the southeast direction;
  • A maximum of 2.70 °C reduced the temperature fluctuation on a cold day, and the façade with plants was, on average, 1.1 °C warmer than the façades without greening in the northwest façade;
  • On a cold winter’s day, the highest LW energy balance reduction ranged from 19.89 to 16.46 W/m2 in the southeast orientation and from 23.22 to 29.89 W/m2 in the northwest façade;
  • On cold and hot days, the RH increased by an average of 1%.
According to comparisons between the results in Manchester and those studied in different climate zones, the effects of LWs are significant.
The results highlighted the strong performance of LWs in summer to lower surface temperatures in both southeast and northwest directions; however, more research on substrate features is required to study improved efficiency in winter. Libessart and Kenai [89] emphasized the value of the substrate and supported the insulating benefits of a GF with climbing plants concerning substrate type. Moreover, air cavity depth can also significantly influence LW performance [90]. As a result, the optimal air cavity feature for achieving more effective LW needs further study in the examined climate conditions.

Author Contributions

Conceptualization, E.F., Y.G. and A.P.; methodology, E.F. and Y.G.; software, E.F.; validation, E.F., Y.G. and A.P.; formal analysis, E.F., Y.G., and A.P; investigation, E.F., Y.G. and A.P.; resources, E.F., Y.G. and A.P.; data curation, E.F., Y.G. and A.P.; writing—original draft preparation, E.F.; writing—review and editing, Y.G. and A.P.; visualization, E.F.; supervision, Y.G. and A.P.; project administration, Y.G.; funding acquisition, Y.G. and A.P. All authors have read and agreed to the published version of the manuscript.

Funding

This research was partly funded by the University Research Fund for the Sustainable Living Research Centre (No. URN023) at the University of Huddersfield, UK.

Institutional Review Board Statement

Not applicable.

Informed Consent Statement

Not applicable.

Data Availability Statement

The data presented in this study are available upon request from the corresponding author. The data are not publicly available because of privacy concerns.

Conflicts of Interest

The authors declare no conflict of interest.

Nomenclature

LW energy balanceLongwave energy balance
RHRelative humidity
Incoming LWIncoming longwave radiation
UHIUrban heat island effects
GWGreen wall
GFGreen façade
LWLiving wall
VGSVertical greening system
LAILeaf area index

References

  1. Ren, G.Y.; Chu, Z.Y.; Chen, Z.H.; Ren, Y.Y. Implications of temporal change in urban heat island intensity observed at Beijing and Wuhan stations. Geophys. Res. Lett. 2007, 34, 1–5. [Google Scholar] [CrossRef]
  2. Stone, B.; Vargo, J.; Habeeb, D. Managing climate change in cities: Will climate action plans work? Landsc. Urban Plan. 2012, 107, 263–271. [Google Scholar] [CrossRef]
  3. Garcia, D.H.; Diaz, J.A. Modeling of the Urban Heat Island on local climatic zones of a city using Sentinel 3 images: Urban determining factors. Urban Clim. 2021, 37, 100840. [Google Scholar] [CrossRef]
  4. O’Lenick, C.R.; Wilhelmi, O.V.; Michael, R.; Hayden, M.H.; Baniassadi, A.; Wiedinmyer, C.; Monaghan, A.J.; Crank, P.J.; Sailor, D.J. Urban heat and air pollution: A framework for integrating population vulnerability and indoor exposure in health risk analyses. Sci. Total Environ. 2019, 660, 715–723. [Google Scholar] [CrossRef] [PubMed]
  5. Santamouris, M. Recent progress on urban overheating and heat island research. Integrated assessment of the energy, environmental, vulnerability and health impact. Synergies with the global climate change. Energy Build. 2020, 207, 109482. [Google Scholar] [CrossRef]
  6. Bassett, R.; Young, P.J.; Blair, G.S.; Cai, X.M.; Chapman, L. Urbanisation’s contribution to climate warming in Great Britain. Environ. Res. Lett. 2020, 15, 114014. [Google Scholar] [CrossRef]
  7. Levermore, G.; Parkinson, J.; Lee, K.; Laycock, P.; Lindley, S. The increasing trend of the urban heat island intensity. Urban Clim. 2018, 24, 360–368. [Google Scholar] [CrossRef]
  8. Macintyre, H.L.; Heaviside, C.; Cai, X.; Phalkey, R. The winter urban heat island: Impacts on cold-related mortality in a highly urbanized European region for present and future climate. Environ. Int. 2021, 154, 106530. [Google Scholar] [CrossRef]
  9. Magrini, A.; Lentini, G.; Cuman, S.; Bodrato, A.; Marenco, L. From nearly zero energy buildings (NZEB) to positive energy buildings (PEB): The next challenge-The most recent European trends with some notes on the energy analysis of a forerunner PEB example. Dev. Built Environ. 2020, 3, 100019. [Google Scholar] [CrossRef]
  10. Noro, M.; Lazzarin, R. Urban heat island in Padua, Italy: Simulation analysis and mitigation strategies. Urban Clim. 2015, 14, 187–196. [Google Scholar] [CrossRef]
  11. Santamouris, M.; Ding, L.; Fiorito, F.; Oldfield, P.; Osmond, P.; Paolini, R.; Prasad, D.; Synnefa, A.J.S.E. Passive and active cooling for the outdoor built environment—Analysis and assessment of the cooling potential of mitigation technologies using performance data from 220 large scale projects. Sol. Energy 2017, 154, 14–33. [Google Scholar] [CrossRef]
  12. Kandya, A.; Mohan, M. Mitigating the Urban Heat Island effect through building envelope modifications. Energy Build. 2018, 164, 266–277. [Google Scholar] [CrossRef]
  13. Morakinyo, T.E.; Lai, A.; Lau KK, L.; Ng, E. Thermal benefits of vertical greening in a high-density city: Case study of Hong Kong. Urban For. Urban Green. 2019, 37, 42–55. [Google Scholar] [CrossRef]
  14. Herath, P.; Thatcher, M.; Jin, H.; Bai, X. Effectiveness of urban surface characteristics as mitigation strategies for the excessive summer heat in cities. Sustain. Cities Soc. 2021, 72, 103072. [Google Scholar] [CrossRef]
  15. Charoenkit, S.; Yiemwattana, S. Role of specific plant characteristics on thermal and carbon sequestration properties of living walls in tropical climate. Build. Environ. 2017, 115, 67–79. [Google Scholar] [CrossRef]
  16. Cameron, R.W.; Taylor, J.E.; Emmett, M.R. What’s ‘cool’ in the world of green façades? How plant choice influences the cooling properties of green walls. Build. Environ. 2014, 73, 198–207. [Google Scholar] [CrossRef] [Green Version]
  17. Besir, A.B.; Cuce, E. Green roofs and facades: A comprehensive review. Renew. Sustain. Energy Rev. 2018, 82, 915–939. [Google Scholar] [CrossRef]
  18. Vox, G.; Blanco, I.; Schettini, E. Green facades to control wall surface temperature in buildings. Build. Environ. 2018, 129, 154–166. [Google Scholar] [CrossRef]
  19. Assimakopoulos, M.N.; De Masi, R.F.; de Rossi, F.; Papadaki, D.; Ruggiero, S. Green Wall Design Approach Towards Energy Performance and Indoor Comfort Improvement: A Case Study in Athens. Sustainability 2020, 12, 3772. [Google Scholar] [CrossRef]
  20. Virtudes, A.; Manso, M. Green walls benefits in contemporary city. In Proceedings of the 2013 International Conference on Architecture and Urban Design, Colombo, Sri Lanka, 20–21 December 2013. [Google Scholar]
  21. Susca, T.; Zanghirella, F.; Colasuonno, L.; Del Fatto, V. Effect of green wall installation on urban heat island and building energy use: A climate-informed systematic literature review. Renew. Sustain. Energy Rev. 2022, 159, 112100. [Google Scholar] [CrossRef]
  22. Coma, J.; Perez, G.; de Gracia, A.; Burés, S.; Urrestarazu, M.; Cabeza, L.F. Vertical greenery systems for energy savings in buildings: A comparative study between green walls and green facades. Build. Environ. 2017, 111, 228–237. [Google Scholar] [CrossRef] [Green Version]
  23. Daemei, A.B.; Shafiee, E.; Chitgar, A.A.; Asadi, S. Investigating the thermal performance of green wall: Experimental analysis, deep learning model, and simulation studies in a humid climate. Build. Environ. 2021, 205, 108201. [Google Scholar] [CrossRef]
  24. Xing, Q.W.; Hao, X.; Lin, Y.; Tan, H.; Yang, K. Experimental investigation on the thermal performance of a vertical greening system with green roof in wet and cold climates during winter. Energy Build. 2019, 183, 105–117. [Google Scholar] [CrossRef]
  25. Collins, R.; Schaafsma, M.; Hudson, M.D. The value of green walls to urban biodiversity. Land Use Policy 2017, 64, 114–123. [Google Scholar] [CrossRef]
  26. Perini, K.; Rosasco, P. Cost–benefit analysis for green façades and living wall systems. Build. Environ. 2013, 70, 110–121. [Google Scholar] [CrossRef]
  27. Fonseca, F.; Paschoalino, M.; Silva, L. Health and Well-Being Benefits of Outdoor and Indoor Vertical Greening Systems: A Review. Sustainability 2023, 15, 4107. [Google Scholar] [CrossRef]
  28. Wong, N.H.; Tan, A.Y.K.; Chen, Y.; Sekar, K.; Tan, P.Y.; Chan, D.; Chiang, K.; Wong, N.C. Thermal evaluation of vertical greenery systems for building walls. Build. Environ. 2010, 45, 663–672. [Google Scholar] [CrossRef]
  29. Carbon Brief. Available online: www.carbonbrief.org (accessed on 24 January 2023).
  30. Perini, K.; Ottelé, M.; Fraaij AL, A.; Haas, E.M.; Raiteri, R. Vertical greening systems and the effect on air flow and temperature on the building envelope. Build. Environ. 2011, 46, 2287–2294. [Google Scholar] [CrossRef]
  31. Wong, N.H.; Tan AY, K.; Tan, P.Y.; Wong, N.C. Energy simulation of vertical greenery systems. Energy Build. 2009, 41, 1401–1408. [Google Scholar] [CrossRef]
  32. Li, J.Y.; Zheng, B.; Shen, W.; Xiang, Y.; Chen, X.; Qi, Z. Cooling and Energy-Saving Performance of Different Green Wall Design: A Simulation Study of a Block. Energies 2019, 12, 2912. [Google Scholar] [CrossRef] [Green Version]
  33. Eumorfopoulou, E.; Kontoleon, K. Experimental approach to the contribution of plant-covered walls to the thermal behaviour of building envelopes. Build. Environ. 2009, 44, 1024–1038. [Google Scholar] [CrossRef]
  34. Jimenez, M.S. Green walls: A sustainable approach to climate change, a case study of London. Archit. Sci. Rev. 2018, 61, 48–57. [Google Scholar] [CrossRef]
  35. Blanco, I.; Schettini, E.; Vox, G. Predictive model of surface temperature difference between green façades and uncovered wall in Mediterranean climatic area. Appl. Therm. Eng. 2019, 163, 114406. [Google Scholar] [CrossRef]
  36. Cruciol-Barbosa, M.; Fontes, M.S.G.D.C.; Azambuja, M.D.A. Experimental Assessment of the Thermal Influence of a Continuous Living Wall in a Subtropical Climate in Brazil. Sustainability 2023, 15, 2985. [Google Scholar] [CrossRef]
  37. Bolton, C.; Rahman, M.A.; Armson, D.; Ennos, A.R. Effectiveness of an ivy covering at insulating a building against the cold in Manchester, UK: A preliminary investigation. Build. Environ. 2014, 80, 32–35. [Google Scholar] [CrossRef]
  38. Fox, M.; Morewood, J.; Murphy, T.; Lunt, P.; Goodhew, S. Living wall systems for improved thermal performance of existing buildings. Build. Environ. 2022, 207, 108491. [Google Scholar] [CrossRef]
  39. He, Y.; Yu, H.; Ozaki, A.; Dong, N.; Zheng, S. An investigation on the thermal and energy performance of living wall system in Shanghai area. Energy Build. 2017, 140, 324–335. [Google Scholar] [CrossRef]
  40. Charoenkit, S.; Yiemwattana, S. Living walls and their contribution to improved thermal comfort and carbon emission reduction: A review. Build. Environ. 2016, 105, 82–94. [Google Scholar] [CrossRef]
  41. Kontoleon, K.; Eumorfopoulou, E. The effect of the orientation and proportion of a plant-covered wall layer on the thermal performance of a building zone. Build. Environ. 2010, 45, 1287–1303. [Google Scholar] [CrossRef]
  42. Carlos, J.S. Simulation assessment of living wall thermal performance in winter in the climate of Portugal. Build. Simul. 2015, 8, 3–11. [Google Scholar] [CrossRef]
  43. Jim, C.Y. Thermal performance of climber greenwalls: Effects of solar irradiance and orientation. Appl. Energy 2015, 154, 631–643. [Google Scholar] [CrossRef]
  44. Pan, L.; Wei, S.; Chu, L.M. Orientation effect on thermal and energy performance of vertical greenery systems. Energy Build. 2018, 175, 102–112. [Google Scholar] [CrossRef]
  45. Pérez, G.; Coma, J.; Sol, S.; Cabeza, L.F. Green facade for energy savings in buildings: The influence of leaf area index and facade orientation on the shadow effect. Appl. Energy 2017, 187, 424–437. [Google Scholar] [CrossRef] [Green Version]
  46. Banti, N.; Ciacci, C.; Di Naso, V.; Bazzocchi, F. Green Walls as Retrofitting Measure: Influence on Energy Performance of Existing Industrial Buildings in Central Italy. Buildings 2023, 13, 369. [Google Scholar] [CrossRef]
  47. Coma, J.; Pérez, G.; Solé, C.; Castell, A.; Cabeza, L.F. New green facades as passive systems for energy savings on buildings. Energy Procedia 2014, 57, 1851–1859. [Google Scholar] [CrossRef] [Green Version]
  48. Djedjig, R.; Bozonnet, E.; Belarbi, R. Analysis of thermal effects of vegetated envelopes: Integration of a validated model in a building energy simulation program. Energy Build. 2015, 86, 93–103. [Google Scholar] [CrossRef]
  49. Kenai, M.A.; Libessart, L.; Lassue, S.; Defer, D. Impact of green walls occultation on energy balance: Development of a TRNSYS model on a brick masonry house. J. Build. Eng. 2021, 44, 102634. [Google Scholar] [CrossRef]
  50. Vox, G.; Blanco, I.; Convertino, F.; Schettini, E. Heat transfer reduction in building envelope with green façade system: A year-round balance in Mediterranean climate conditions. Energy Build. 2022, 274, 112439. [Google Scholar] [CrossRef]
  51. Karimi, K.; Farrokhzad, M.; Roshan, G.; Aghdasi, M. Evaluation of effects of a green wall as a sustainable approach on reducing energy use in temperate and humid areas. Energy Build. 2022, 262, 112014. [Google Scholar] [CrossRef]
  52. Perez, G.; Rincon, L.; Vila, A.; Gonzalez, J.M.; Cabeza, L.F. Green vertical systems for buildings as passive systems for energy savings. Appl. Energy 2011, 88, 4854–4859. [Google Scholar] [CrossRef]
  53. Hoyano, A. Climatological Uses of Plants for Solar Control and the Effects on the Thermal Environment of a Building. Energy Build. 1988, 11, 181–199. [Google Scholar] [CrossRef]
  54. Papadakis, G.; Tsamis, P.; Kyritsis, S. An experimental investigation of the effect of shading with plants for solar control of buildings. Energy Build. 2001, 33, 831–836. [Google Scholar] [CrossRef]
  55. Stec, W.J.; van Paassen, A.H.C.; Maziarz, A. Modelling the double skin facade with plants. Energy Build. 2005, 37, 419–427. [Google Scholar] [CrossRef]
  56. Miller, A.; Shaw, K.; Lam, M. Case Study Report-Vegetation on Building Facades: “Bioshader”; University of Brighton: Brighton, UK, 2007. [Google Scholar]
  57. Schmidt, M. Energy and water, a decentralized approach to an integrated sustainable urban development. RIO6 World Clim. Energy Event 2006, 2006, 1–6. [Google Scholar]
  58. Dahanayake, K.C.; Chow, C.L.; Hou, G.L. Selection of suitable plant species for energy efficient Vertical Greenery Systems (VGS). Energy Procedia 2017, 142, 2473–2478. [Google Scholar] [CrossRef]
  59. Pérez, G.; Rincón, L.; Vila, A.; González, J.M.; Cabeza, L.F. Behaviour of green facades in Mediterranean Continental climate. Energy Convers. Manag. 2011, 52, 1861–1867. [Google Scholar] [CrossRef]
  60. Widiastuti, R.; Caesarendra, W.; Prianto, E.; Budi, W.S. Study on the leaves densities as parameter for effectiveness of energy transfer on the green facade. Buildings 2018, 8, 138. [Google Scholar] [CrossRef] [Green Version]
  61. Chen, Q.; Li, B.; Liu, X. An experimental evaluation of the living wall system in hot and humid climate. Energy Build. 2013, 61, 298–307. [Google Scholar] [CrossRef]
  62. Scarpa, M.; Mazzali, U.; Peron, F. Modeling the energy performance of living walls: Validation against field measurements in temperate climate. Energy Build. 2014, 79, 155–163. [Google Scholar] [CrossRef]
  63. Alexandri, E.; Jones, P. Temperature decreases in an urban canyon due to green walls and green roofs in diverse climates. Build. Environ. 2008, 43, 480–493. [Google Scholar] [CrossRef]
  64. Bakhshoodeh, R.; Ocampo, C.; Oldham, C. Evapotranspiration rates and evapotranspirative cooling of green façades under different irrigation scenarios. Energy Build. 2022, 270, 112223. [Google Scholar] [CrossRef]
  65. Tilley, D.; Price, J.; Matt, S.; Marrow, B. Vegetated Walls: Thermal and Growth Properties of Structured Green Facades. Final Report to Green Roofs for Healthy Cities. 2012. Available online: https://www.researchgate.net/profile/David-Tilley-3/publication/328267296_Vegetated_Walls_Thermal_and_Growth_Properties_of_Structured_Green_Facades/links/5bc224d6458515a7a9e72512/Vegetated-Walls-Thermal-and-Growth-Properties-of-Structured-Green-Facades.pdf (accessed on 27 January 2023).
  66. Takakura, T.; Kitade, S.; Goto, E. Cooling effect of greenery cover over a building. Energy Build. 2000, 31, 1–6. [Google Scholar] [CrossRef]
  67. Raji, B.; Tenpierik, M.J.; Van Den Dobbelsteen, A. The impact of greening systems on building energy performance: A literature review. Renew. Sustain. Energy Rev. 2015, 45, 610–623. [Google Scholar] [CrossRef] [Green Version]
  68. Ip, K.; Lam, M.; Miller, A. Shading performance of a vertical deciduous climbing plant canopy. Build. Environ. 2010, 45, 81–88. [Google Scholar] [CrossRef]
  69. Sun, R.; Lü, Y.; Yang, X.; Chen, L. Understanding the variability of urban heat islands from local background climate and urbanization. J. Clean. Prod. 2019, 208, 743–752. [Google Scholar] [CrossRef]
  70. Ottele, M. The green building envelope: Vertical greening. Sieca Repro 2011, 21–47. Available online: https://repository.tudelft.nl/islandora/object/uuid%3A1e38e393-ca5c-45af-a4fe-31496195b88d (accessed on 27 January 2023).
  71. Ochoa, J. La Vegetación Como Instrumento para el Control Bioclimàtico. Ph.D. Thesis, Universitat Politècnica de Catalunya, Barcelona, Spain, 1999. Escola Tècnica. [Google Scholar]
  72. Minke, G.; Witter, G. Häuser mit grünem Pelz. Ein Handb. Zur Hausbegrünung 1982, 498, 31–35. [Google Scholar]
  73. Manso, M.; Castro-Gomes, J. Thermal analysis of a new modular system for green walls. J. Build. Eng. 2016, 7, 53–62. [Google Scholar] [CrossRef]
  74. Dede, O.H.; Mercan, N.; Ozer, H.; Dede, G.; Pekarchuk, O.; Mercan, B. Thermal insulation characteristics of green wall systems using different growing media. Energy Build. 2021, 240, 110872. [Google Scholar] [CrossRef]
  75. Ali-Toudert, F.; Mayer, H. Planning-oriented assessment of street thermal comfort in arid regions. In Proceedings of the 21th Conference on Passive and Low Energy Architecture, Eindhoven, The Netherlands, 19–21 September 2004. [Google Scholar]
  76. Acero, J.A.; Arrizabalaga, J. Evaluating the performance of ENVI-met model in diurnal cycles for different meteorological conditions. Theor. Appl. Climatol. 2018, 131, 455–469. [Google Scholar] [CrossRef]
  77. Huttner, S. Further Development and Application of the 3D Microclimate Simulation ENVI-Met. Doctoral Dissertation, The Universität Mainz, Mainz, Germany, 2012. [Google Scholar]
  78. Bruse, M.; Fleer, H. Simulating surface–plant–air interactions inside urban environments with a three dimensional numerical model. Environ. Model. Softw. 1998, 13, 373–384. [Google Scholar] [CrossRef]
  79. Crank, P.J.; Sailor, D.J.; Ban-Weiss, G.; Taleghani, M. Evaluating the ENVI-met microscale model for suitability in analysis of targeted urban heat mitigation strategies. Urban Clim. 2018, 26, 188–197. [Google Scholar] [CrossRef]
  80. Baghaei Daemei, A.; Jamali, A. Experimental and simulation study on thermal effects and energy efficiency of a green wall in the humid condition of Rasht. J. Energy Manag. Technol. 2022, 6, 15–21. [Google Scholar]
  81. Pérez, G.; Coma, J.; Martorell, I.; Cabeza, L.F. Vertical Greenery Systems (VGS) for energy saving in buildings: A review. Renew. Sustain. Energy Rev. 2014, 39, 139–165. [Google Scholar] [CrossRef] [Green Version]
  82. Palyvos, J. A survey of wind convection coefficient correlations for building envelope energy systems’ modeling. Appl. Therm. Eng. 2008, 28, 801–808. [Google Scholar] [CrossRef]
  83. Convertino, F.; Vox, G.; Schettini, E. Heat transfer mechanisms in vertical green systems and energy balance equations. Int. J. Des. Nat. Ecodynamics 2019, 14, 7–18. [Google Scholar] [CrossRef]
  84. Kwon, Y.J.; Lee, D.K. Thermal comfort and longwave radiation over time in urban residential complexes. Sustainability 2019, 11, 2251. [Google Scholar] [CrossRef] [Green Version]
  85. Lauster, M.; Remmen, P.; Fuchs, M.; Teichmann, J.; Streblow, R.; Müller, D. Modelling long-wave radiation heat exchange for thermal network building simulations at urban scale using Modelica. In Proceedings of the 10th International Modelica Conference, Lund, Sweden, 10–12 March 2014; pp. 125–133. [Google Scholar]
  86. Eggenberger, A. Bauphysikalische Vorgänge im begrünten Warmdach. Das Gartenamt 1983, 6, 32. [Google Scholar]
  87. Tudiwer, D.; Korjenic, A. The effect of living wall systems on the thermal resistance of the façade. Energy Build. 2017, 135, 10–19. [Google Scholar] [CrossRef]
  88. Abdo, P.; Huynh, B.P. An experimental investigation of green wall bio-filter towards air temperature and humidity variation. J. Build. Eng. 2021, 39, 102244. [Google Scholar] [CrossRef]
  89. Libessart, L.; Kenai, M.A. Measuring thermal conductivity of green-walls components in controlled conditions. J. Build. Eng. 2018, 19, 258–265. [Google Scholar] [CrossRef]
  90. Freewan, A.A.; Jaradat NA, M.; Amaireh, I.A. Optimizing shading and thermal performances of vertical green wall on buildings in a hot arid region. Buildings 2022, 12, 216. [Google Scholar] [CrossRef]
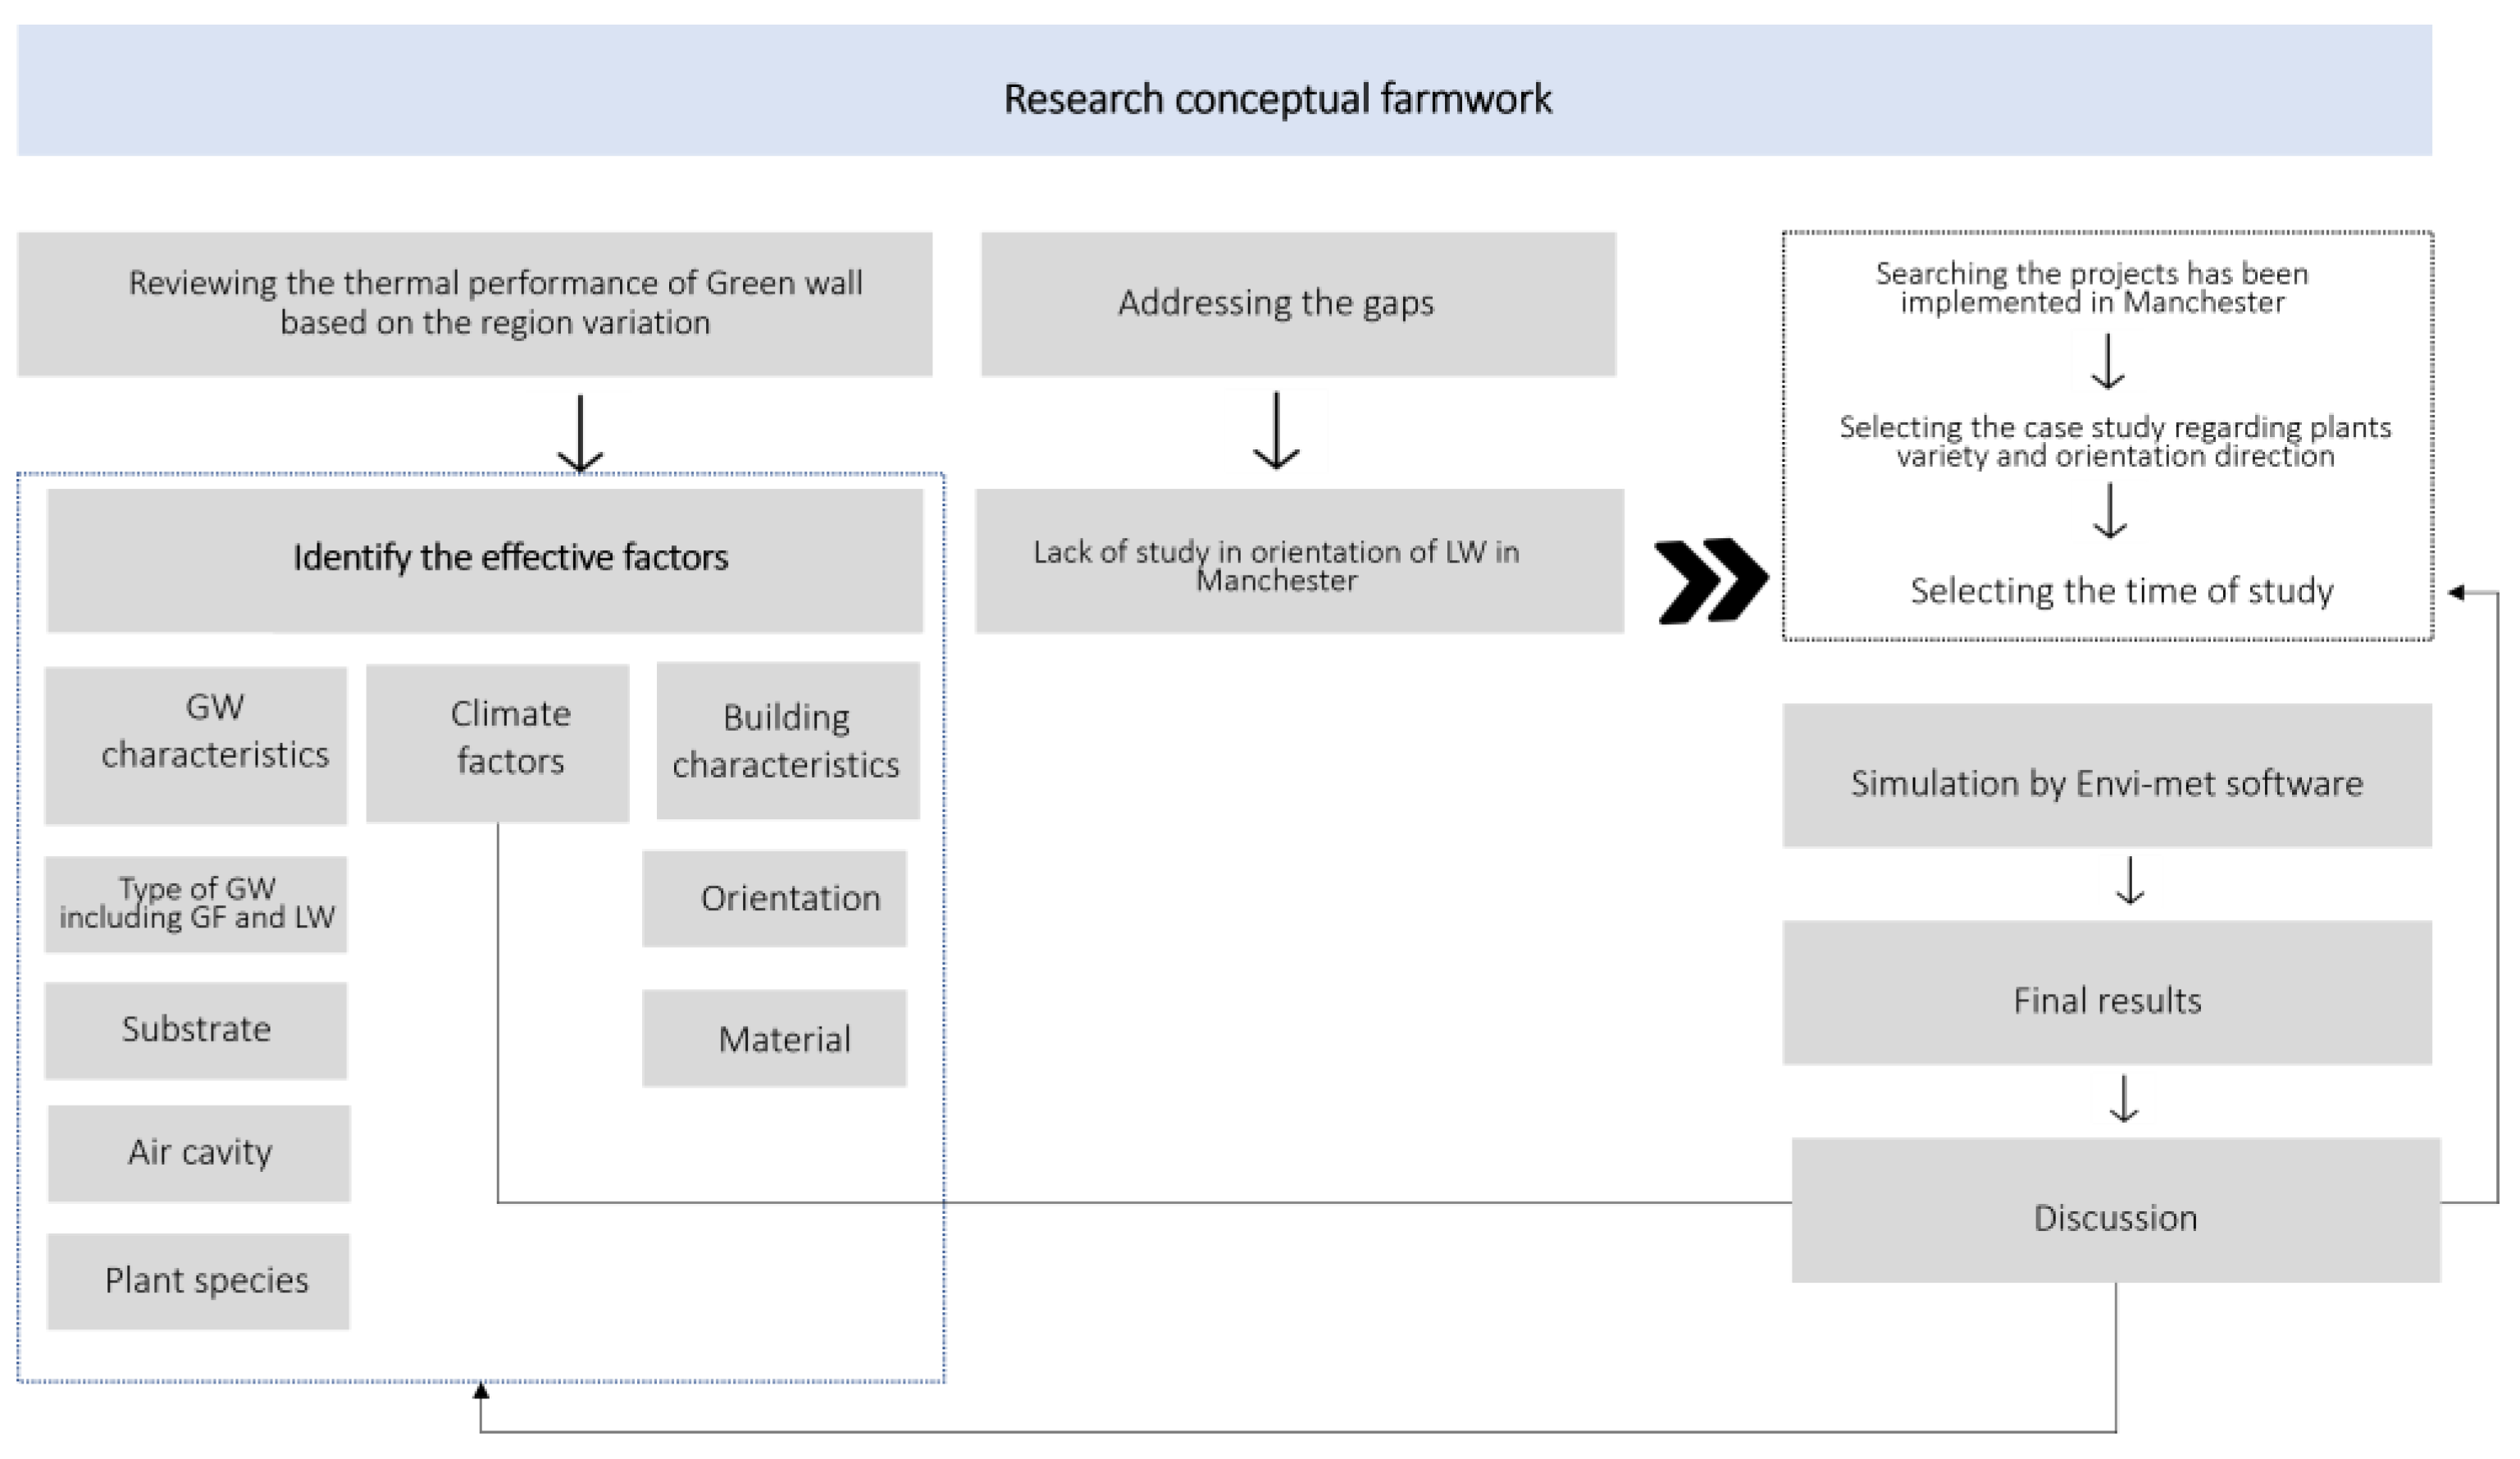
Figure 1. Conceptual research framework.
Sustainability 15 11109 g001
Figure 2. The living walls located on the southeast and northwest façade of the building.
Sustainability 15 11109 g002
Figure 3. Section through the modular living wall system.
Sustainability 15 11109 g003
Figure 4. (A) Temperature range, (B) wind velocity range, and (C) radiation range charts for Manchester (Climate Consultant software outputs).
Sustainability 15 11109 g004
Figure 5. Comparing the southeast façade’s surface temperature on a summer day in July with and without greening.
Sustainability 15 11109 g005
Figure 6. Comparing the surface temperature of the southeast façade with and without greening on a winter day.
Sustainability 15 11109 g006
Figure 7. Comparing the surface temperature of the northwest façade with and without greening on a summer day.
Sustainability 15 11109 g007
Figure 8. Comparing the surface temperature of the northwest façade with and without greening on a cold day.
Sustainability 15 11109 g008
Figure 9. (A) Wind speed in front of southeast façade on a cold day. (B) Wind speed in front of northwest façade on a cold day.
Sustainability 15 11109 g009
Figure 10. (A) Air temperature in front of the southeast façade on cold day. (B) Air temperature in front of the northwest façade on cold day.
Sustainability 15 11109 g010
Figure 11. (A) Incoming LW radiation on the southeast façade on a cold day. (B) Incoming LW radiation on the northwest façade on a cold day.
Sustainability 15 11109 g011
Figure 12. (A) Wind speed at southeast façade on hot day. (B) Wind speed at northwest façade on hot day.
Sustainability 15 11109 g012aSustainability 15 11109 g012b
Figure 13. (A) Air temperature in front of the southeast façade on a hot day. (B) Air temperature in front of the northwest façade on a hot day.
Sustainability 15 11109 g013
Figure 14. (A) Incoming LW radiation in the southeast façade on a hot day. (B) Incoming LW radiation in the northwest façade on a hot day.
Sustainability 15 11109 g014
Figure 15. (A) Relative humidity variation without greening. (B) Relative humidity variation with greening according to the most remarkable change on a summer day.
Sustainability 15 11109 g015
Figure 16. (A) Relative humidity variation without greening. (B) Relative humidity variation with greening according to the most remarkable change on a winter day.
Sustainability 15 11109 g016
Table 1. Existing studies on effects of various types of green walls.
AuthorRegionKöppen ClassificationGreen Wall TypeSeasonResults
Eumorfopoulou and Kontoleon, 2009
[33]
GreeceCsaTGSUPlants reduced the surface temperature by about 5.7 °C on average.
Wong et al., 2010
[31]
SingaporeAfGW and GFSU, WI, SPThe highest capacities were demonstrated by the living wall–modular panel, a mixed substrate with a maximum reduction of approximately 10.94 °C.
Perini et al., 2011
[30]
NetherlandsCfbTG, GF, and LWAUThe surface temperature of façades differed by 1.2 °C from TG and by 2.7 °C from DG, and 5 °C was recorded in the case of LW.
Cameron et al., 2014 [16]UKCfbGFSU, AU, and WIPrunus significantly cooled the walls but had a lower surface cooling capability (6.3 °C), while Stachys and Hedera delivered cooling of >7.0 °C.
Bolton et al., 2014
[37]
UKCfbTGWIIvy raised the average exterior warmth of a north-facing wall by 0.5 °C in the winter and decreased temperature fluctuations by more than 3 °C.
Coma et al., 2017
[21]
SpainBSkDG and GWSU and WIGW 58.9% and DG 33.8% increased energy saving during the cooling season compared to the reference wall.
Jimenez, 2018
[34]
UKCfbLWSULW lowered the temperature of the outside surface by up to 12 °C.
Vox et al., 2018
[18]
ItalyCfaTGWIGF lowered summer daytime surface temperature to up to 9.0 °C cooler and winter night-time surface temperature up to 3.5 °C warmer than uncovered walls.
Blanco et al., 2019
[35]
ItalyCfaTGSUSummertime surface temperatures of GF were up to 7.7 °C lower than those of the uncovered wall.
Fox et al., 2022
[38]
UKCfbLWAUOn average, the internal air temperature was 17.2 °C (with 4.2 °C fluctuation).
SU: summer, WI: winter, SP: spring, AU: autumn, WY: whole year, TG: traditional green façade, DG: double-skin green façade, LW: living wall. Köppen classification: Csa: hot-summer Mediterranean climate, Af: tropical rainforest climate, Cfb: temperate oceanic climate, BSk: cold semiarid climate.
Table 2. Detailed description of living wall.
ParametersModular Living Wall
SubstrateClay
Thickness0.08 m
Moisture content
Percentage40–50%
Hedera Helix “Green Ripple”
Lavender Hidcote
Plant speciesMatteuccia Struthiopteris
Tellima Grandiflora
Buxus Sempervirens
Dryopteris
Vinca Minor “Atropururea”
Air gap
0.00
Plant average thickness
0.3 m
Disclaimer/Publisher’s Note: The statements, opinions and data contained in all publications are solely those of the individual author(s) and contributor(s) and not of MDPI and/or the editor(s). MDPI and/or the editor(s) disclaim responsibility for any injury to people or property resulting from any ideas, methods, instructions or products referred to in the content.