Abstract
In this paper, a small-scale PV/Wind/Diesel Hybrid Microgrid System (HMS) for the city of Yanbu, Saudi Arabia is optimally designed, considering the uncertainties of renewable energy resources and battery degradation. The optimization problem is formulated as a multi-objective one with two objective functions: the Loss of Power Supply Probability (LPSP) and the Cost of Electricity (COE). An Improved Decomposition Multi-Objective Evolutionary Algorithm (IMOEAD) is proposed and applied to solve this problem. In this approach, different decomposition schemes are combined effectively to achieve better results than the classical MOEA/D approach. Twelve case studies are investigated based on different scenarios and different numbers of houses (5 and 10 houses). Each time, the suggested approach produced a set of solutions that formed a Pareto front (PF). Considering a variety of parameters, the optimal compromise option can be selected by the designer from the PF.
1. Introduction
The ongoing depletion of fossil fuel reserves, increasing environmental concerns, and advancements in power electronic technologies have led to a significant rise in the utilization of Renewable Energy Sources (RESs) globally. Many countries have started using RESs on a large scale and are planning to proceed further in cultivating green energy resources. However, like any other new technology, the production of electrical energy and usage of any RES are challenged by various factors. The precarious behavior of RESs, high expense in the starting phase, and requirement of requisite storage facilities have made it difficult to explore the RESs in islanded areas and rural places. Therefore, it is more practical and suitable to combine the available infrastructure of energy generations with RES technologies. Thus, the Hybrid Microgrid System (HMS) concept has become popular where conventional methods like diesel generators relate to solar-cell- or wind-turbine-generated electrical energy. However, the design, size, capacity, and hybridization policy of HMSs have always been interesting topics for researchers, as it may open the door for high efficiency, reliability, and cost-effectiveness in this arena [1].
Due to their complementary roles in producing power, solar and wind energies are the most harnessed RESs. They are widely accessible worldwide and have substantial environmental advantages. Further development of these two RESs has been boosted and stimulated in recent years by factors such as easy installation, cheap maintenance costs, environmental issues, backup of the traditional energy resources, and convenient laws on RESs. Despite their high capital costs, solar and wind energy facilities have been widely installed worldwide due to their ability to mitigate load demand gaps without carbon emissions gaps [2,3].
A substantial amount of study [4,5,6] has been conducted on the possibility of harnessing RESs with the burning of fossil fuels in order to effectively use RESs. Despite being the world’s largest provider of fossil fuels, the Kingdom of Saudi Arabia still considers wind and solar energy as the two most viable options to traditional sources. Around the Kingdom, particularly in the coastal regions, several feasibility studies have been conducted. The small-scale microgrid model, known as the nanogrid, has been investigated in [7,8] for Hafr Al Batin, a city in the Eastern region of KSA. Furthermore, due to its abundance, solar energy is the region’s go-to substitute for fossil fuels. In addition to the fossil fuel reserve, other nations have also regarded solar and wind energy as the standard sustainable energy sources. For instance, Egypt’s ambitious goal is to use 20% more RESs by 2027 [9], primarily from solar and wind energy. For the cement mill Al-Tafilah in Jordan, the authors of the article designed a hybrid PV–wind system [10]. Another study uses various optimization algorithms to examine the optimal size of freestanding hybrid microgrid systems for a village in the Western Desert of Egypt [11]. A feasibility study of various hybrid energy systems was conducted on five climate regions of Bangladesh [1].
Studies on the application of RESs in Algeria and Brunei, respectively, were described in the works [12,13]. Both articles explored different aspects of RESs as feasible alternatives for future energy needs. According to another study [14], Cambridge Bay, Canada, is economically viable, with an annual capital cost recovery of 11.1%. In contrast, Toamasina, Madagascar is suitable from a sustainable energy point of view, with 76% of the load satisfied and 76% of the energy utilized. Studies conducted on the feasibility of sustainable energy sources in Australia have found that HMSs are a cost-effective solution for moderate loads, including tourist attractions and hotels with grid connections [15,16]. In a similar vein, studies on a remote island in Thailand, such as [17,18], have investigated the effectiveness of hybrid PV/diesel systems [19]. Collectively, these studies and others of a similar nature indicate that integrating renewable energy sources (RESs) with conventional diesel generators could lower energy costs and enhance power system reliability.
The generated power from the RESs is highly variable because of the site dependence and discontinuity of wind and solar energies [20]. Isolated solar or wind energy systems may appear unstable and uneconomical due to their intermittent energy output, as they are unable to consistently meet energy demands [21]. In order to smooth out the unwanted variations, solar and wind energy systems are combined [22]. The consequences of intermittent RES supply can be lessened by incorporating diesel generator and storage systems [23,24]. The storage system is essential in this setup for balancing the intermittency of renewable energy generation and meeting power demand. Such hybrid units’ engineering and dimensioning present extremely difficult technical and financial problems [19]. Under sizing the system will result in power supply shortages when trying to fulfil the specified demand, while an extensive system will cost more money [25]. Therefore, the best HMS unit sizing is crucial for power system design and operation in light of the aforementioned concerns.
The optimal sizing of hybrid microgrid systems has been the subject of a substantial number of studies that have been documented in the literature. Various software programs have been tried for this purpose over time as well. The creation of efficient computational methods is necessary due to a number of drawbacks that each of these instruments suffers from [26]. For this optimization goal, many deterministic techniques including graphical, analytical, numerical, and iterative formulations have been tried [25]. However, numerous hybrid microgrids have also effectively used metaheuristic or nature-inspired heuristic algorithms, leading to enhanced technical and financial efficiency [27].
Despite the disadvantage of coding complexity in hybrid systems, the genetic algorithm (GA) has been used successfully to handle hybrid systems with many parameters [28]. Particle swarm optimization (PSO), which has significantly quicker response times and superior convergence, outperforms GA in other studies. [29]. The optimization problem of reducing COE and LPSP for an HMS was addressed using a multi-objective PSO in [30]. The self-adaptive differential evolution (SDE) technique is suggested to tackle the multi-objective optimization problem in one of the author’s earlier works [31]. Article [32] considered load uncertainty in the problem formulation and solved the issue with the decomposition-based multi-objective algorithm. Other intelligent optimization techniques have been reported in the literature, including the teaching learning-based optimization (TLBO) [33], tabu search (TS) [34], simulated annealing (SA) [35], cuckoo search algorithm (CSA) [36], artificial immune system (AIS) [37], and Grasshopper optimization system (GOA) [25]. Recent review publications [38,39] have presented in-depth evaluations of the optimization tools tested in these studies [40]. Recent review publications [38,39] have presented comprehensive comparative investigations of these tested optimization tools [40]. Another team of academics has reported encouraging advancements in the application of a multi-objective evolutionary algorithm for designing and sizing [41]. Their recent work [42] has investigated different configurations for the design of hybrid sustainable energy systems, introducing a scenario-dominance-based MOEA. In [43], the optimal design of a PV/biomass-based hybrid energy system for a remote hilly area using the discrete grey wolf optimization (GWO) algorithm was investigated.
The HMS has been optimized using the methods indicated above with favorable results. Nevertheless, further developments or alternative algorithms that can address the issue more effectively may enhance existing research outcomes. This paper proposes an enhanced version of the decomposition-based MOEA to address the optimization problem of the HMS. As evidenced in some highlighted works, decomposing MOPs simplifies the problem by generating a set scalar optimization problem. The solution of such a MOP can be achieved using MOEA/D [44] with a suitable decomposition technique. Typical decomposition techniques include weighted sum (WS), weighted Tchebycheff (TCH), and Penalty-based Boundary Intersection (PBI) approaches [45]. Over the years, various variants of these decomposition methods have been developed to address various challenges. For example, some well-known variants of the TCH approach [44] include the augmented achieving scalarizing function (AASF) [46], the weighted-metrics-based methods (WMMs) [47,48], the multiplicative scalarizing function (MSF) factor, and the penalty-based scalarizing function (PSF) [49]. Similarly, notable variants of the PBI approach include the adaptive penalty scheme (APS) [50], the subproblem-based penalty scheme (SPS), the inverted PBI [51,52], and the augmented PBI [53]. While each of these variants offers specific benefits and advantages, hybridizing aspects of them could result in a more robust approach.
In this research, battery degradation concerns and load uncertainty are considered when designing the PV/Wind/Diesel HMS for Yanbu city. Some key features of this article are as follows:
- The paper uses the multi-objective approach of problem formulation because it has the unique Pareto Front (PF) property of presenting the set of solutions of a multi-objective problem in a single shot. Using their expertise, the design requirements, and constraints, the design engineers can choose from any available solution.
- To address the issue of developing HMSs, a novel multi-objective strategy based on an enhanced Decomposition-Based Multi-Objective Evolutionary Algorithm (MOEA/D) is developed in this study. The results obtained from several decomposition methods are combined into a single set of solutions using the proposed novel approach.
- To assess its impact on the completed design, this article models and examines two crucial features: load variability (uncertainty) and battery deterioration.
The robustness of the suggested approach is intended to be ensured by the two test scenarios with 5 and 10 dwellings, respectively. Moreover, the optimization problem considers the COE and LPSP, which are widely used key performance indicators in microgrid planning and operation. The results obtained can provide valuable insights into the optimal allocation of energy resources within the specified limitations, which can aid in the design of microgrids.
The subsequent sections of this paper are organized as follows: Section 2 provides a detailed discussion of the HMS. Section 3 and Section 4 outline the optimization procedure and the suggested strategy of the solution, respectively. Section 5 is designated to presenting the results and their relevant analysis. Finally, Section 6 draws the conclusion.
2. Hybrid Microgrid System Configuration
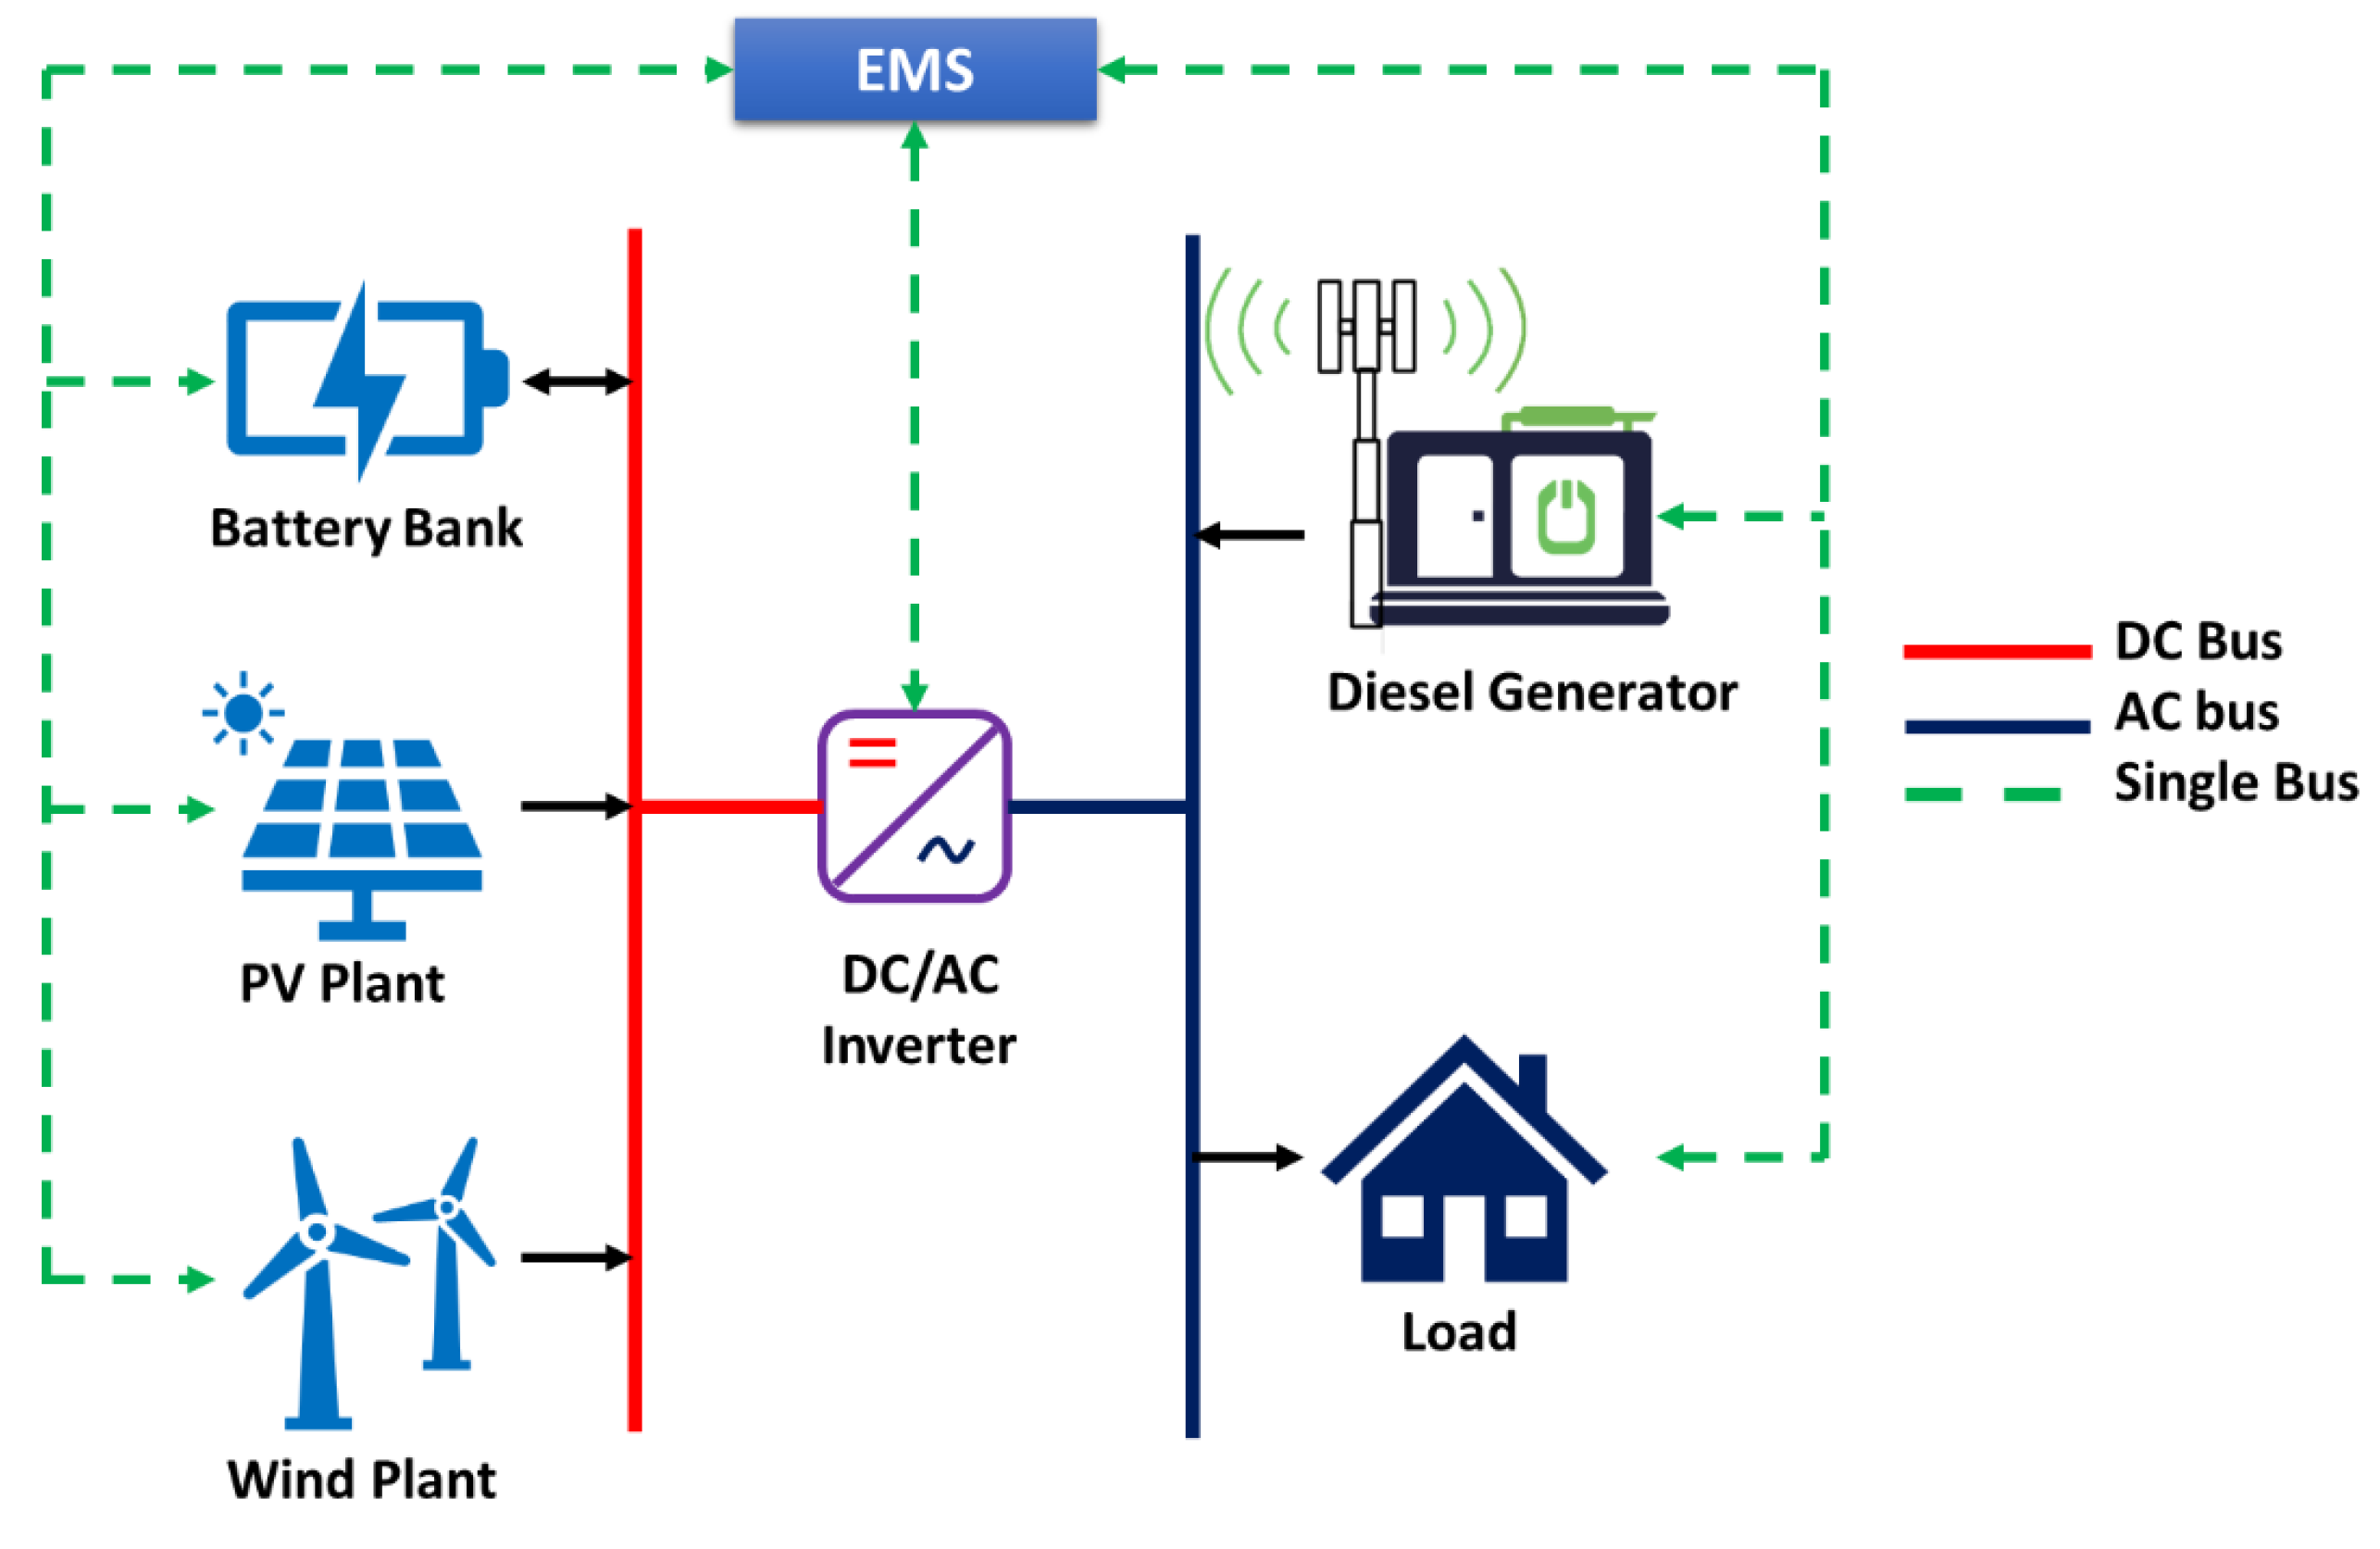
The configuration of the hybrid microgrid system (HMS) considered in this study is presented in Figure 1 that consists of five major components. In this configuration, the PV plant, wind plant, and the battery bank are the three DC power components. On the contrary, the AC power components include the diesel generator and the domestic load. For the DC-to-AC conversion, an IGBT-based high-power inverter is considered in this HMS model. This inverter along with the AC and DC buses interconnects the generating elements and the load. The optimization problem development will ignore the inverter’s dynamics since it is associated with high frequencies. To monitor and control the power sharing among the elements of the HMS, an energy management system (EMS) is associated with this model. All the elements have a duplex communication link with the EMS, so the EMS continuously receives the information of the state of each component. In return, the EMS sends control signals to each device to ensure optimal performance of the HMS.
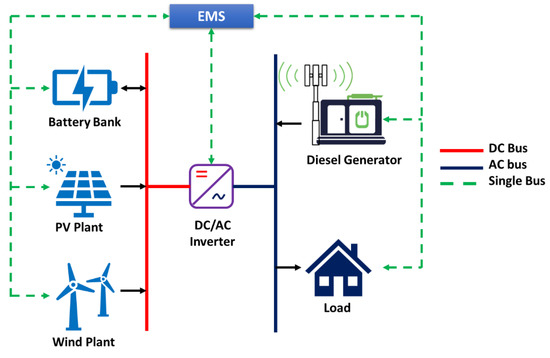
Figure 1.
HMS configuration.
2.1. Mathematical Model of the HMS
2.1.1. PV Plant
As characterized by [54], the power output from the PV panel, , is given by the following equation:
where is the ambient temperature, which is 25 °C at Standard Test Conditions (STCs) in this study. represents the surface temperature of the PV cell. The solar irradiance in W/m2 is denoted by G. Gref and Kt are two PV cell constants with values of 1 kW/m2 and −3.7 × 10⁻³ °C−1, respectively. denotes the rated output power of the PV panel at STCs.
2.1.2. Wind Plant
For the wind plant, a wind turbine is utilized to harness the wind energy to generate electrical power. The output power obtained from the wind turbine relies on the wind speed of a particular site. The turbine height is a crucial factor as the wind speed changes with the variation in turbine height. Using the power-law equation [55], the wind speed can be evaluated as a function of the height of the wind turbine as given below:
where v1 indicates the wind speed at the reference hub height, h1, and v2 represents the wind speed corresponding to the desired hub height, h2. The coefficient of friction is denoted by the power-law exponent, , that depends on different topographical properties of the terrain such as time of the year, height, speed, roughness, and temperature [6,56,57]. According to different research studies, terrains can be classified into several categories [58,59,60]. However, as per the recommendation of IEC standards [61,62], the value of is 0.11 for extreme wind conditions, whereas it is 0.20 under normal wind conditions. At a particular instant, the wind turbine output power, PWind, can be expressed as follows:
where V signifies wind speed at the current time instant and Prated indicates the rated power. Furthermore, cut-out, cut-in, and rated wind speed are represented by , , and , respectively.
2.1.3. Battery
Energy storage is a key sector in designing microgrids [63,64]. The battery unit is the third element connected to the DC bus. As shown in the following expression, the battery is typically characterized with the help of its capacity, [65]:
where denotes the load and AD represents the autonomy days. In Equation (4), DOD indicates the depth of discharge, which is set to 80%. The inverter efficiency, ηinv, is set to 92%, whereas the battery efficiency, ηb, is set to 85%.
2.1.4. Diesel Generator
The standalone diesel generator connected to the AC bus works as a backup or secondary source to enhance the operational stability of the HMS. It plays a crucial role in satisfying the load demand, especially when the RESs are not capable of doing so. As discussed in [66], the generator efficiency remains low when the output power is low. Hence, the diesel generator needs to be operated around the nominal output power for better energy utilization. In case of inconsistent load demand, this strategy provides secured operation against the power fluctuation [67]. The fuel consumption of the generator, q(t), is expressed by the following equation [68,69]:
where a and b are the coefficients of fuel consumption and their respective values are considered to be 0.246 and 0.08415 [70]. Furthermore, the output power of the diesel generator for a given time instant is denoted by P(t), whereas the rated power is represented by Prated.
Diesel generator net efficiency, , can be expressed using the following relation [71]:
where is efficiency of the generator and represents the thermal brake efficiency.
2.1.5. Inverter
For the HMS configuration considered in this study, the inverter is a vital operational component. It is mainly responsible for converting DC power to AC to satisfy necessary power requirements of the AC loads. The efficiency of the inverter, , is approximated through the following expression [72,73]:
where
where is a constant representing the inverter efficiency at 10% of its nominal power and is the corresponding value at 100%. These quantities are typically provided by the manufacturers.
2.1.6. Management Strategy of EMS
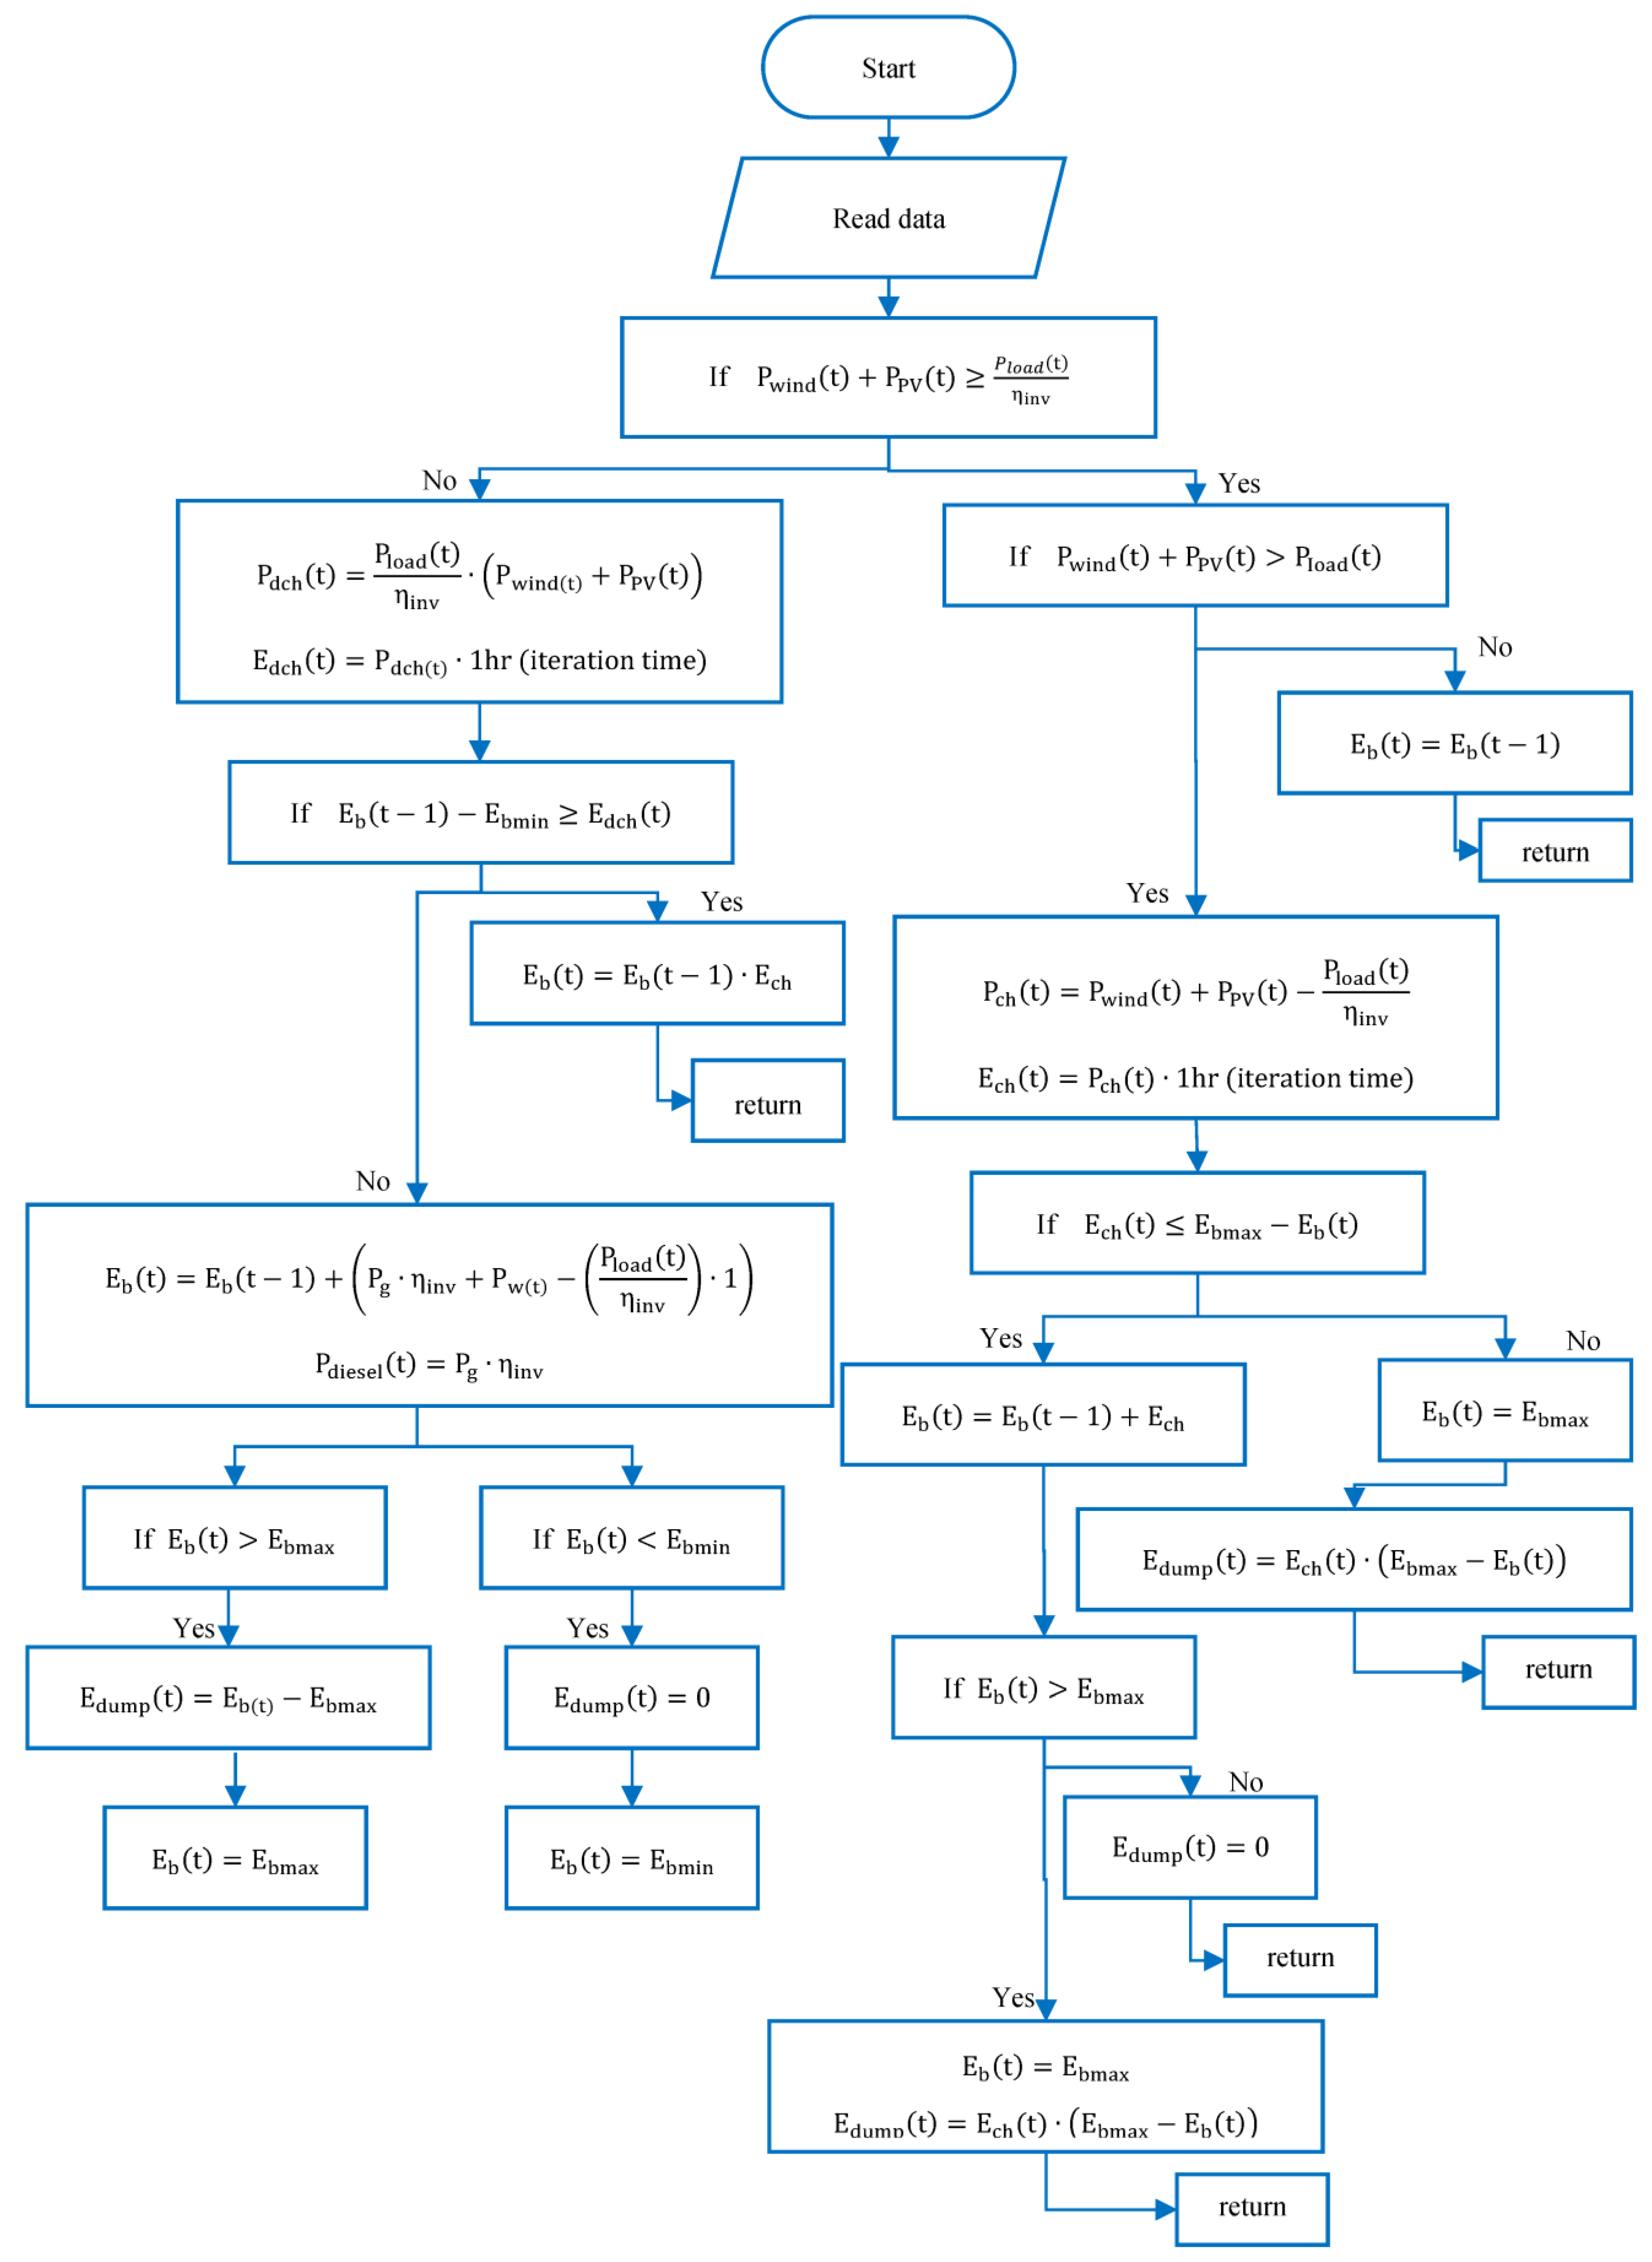
If all the components of the HMS are in close vicinity of the power consumption, then it can be considered that minimal electrical losses will be associated with the distribution of power. The goal of the EMS in the proposed HMS is to implement a management strategy to provide optimal power sharing between all the elements of the HMS. The management strategy to be implemented by the EMS is highlighted in the flowchart shown in Figure 2 [30]. According to this strategy, power generated by the RES (PV plant, wind plant) will be utilized on a priority basis to satisfy the load demand. After meeting the load demands, any excess energy available from these renewable plants will be used in charging the battery units. In case the load demand is higher than the combined power produced by the RES, the EMS will try to fulfil the remaining demand through the battery bank. In an extreme scenario, when all the elements connected with the DC bus fail to meet the load requirements, the diesel generator will be operated to overcome the shortage of power. If any surplus energy is available from the diesel generator, it will be utilized in recharging the battery bank for future requirements. In Figure 2, and denote the energy of the battery at the current time instant and the previous time instant, respectively. stands for charging energy of the battery and denotes its discharging energy The excess energy that is dumped at the current time instant is represented by . and , respectively, denote the minimum and maximum storage capacities of the battery. The equations in the preceding sections contain the rest of the symbols and their corresponding explanation.
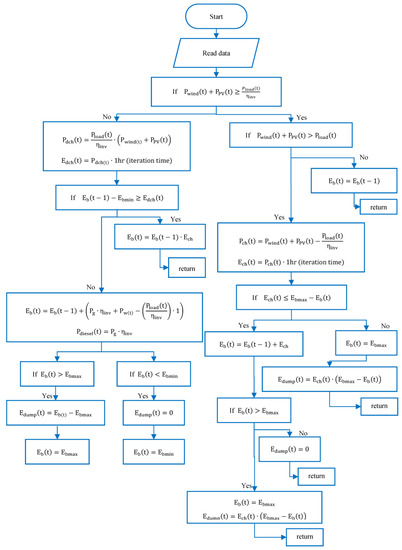
Figure 2.
Flowchart of the energy management strategy of the HMS.
2.2. Uncertainty
Dealing with different kinds of uncertainty proves to be a challenge in various fields of study such as practical engineering, general sciences, and economics. Uncertainty results from information that is not known and difficult to predict beforehand. It is almost impossible to figure out such information with complete certainty owing to limitations resulting from inaccuracies in sensor data to the limitations of physical laws of the universe. To be specific, there is no guarantee in the prediction of uncertain events. There must be a margin between the timing of an event and its likelihood of occurrence.
In practice, multiple approaches are adopted to represent uncertainty. Setting a tolerance range, defined as the percentage deviation from the obtained or measured value, is one of the commonly used methods.
2.2.1. Uncertainty in Microgrids
Uncertainties are inherent in all the elements of a microgrid system. Thus, in the domain of optimization-based research on microgrids, uncertainties play a crucial role. The formulation of the optimization problem is adversely affected by the associated uncertainties. From load demands to the generation of power, market prices to the consumer reaction to bills, and the accessibility of generating units to the isolation of microgrids, all these are non-deterministic events. When the uncertainty in the electric market prices is considered, the governing authority experiences a jeopardizing situation [19]. Thus, deterministic modeling of such uncertainties is mathematically intractable. Therefore, the pre-eminence of uncertainties in microgrids makes it necessary to incorporate it in the system model by adopting stochastic methods [74].
2.2.2. Stochastic and Deterministic Models
A predictable model can be seen as a precursor to a probabilistic one. In the former, the required parameters are already known, or they can be determined with ease, and the output can be accurately realized from the given set of inputs. Results obtained from such models may deviate from the realistic scenario where unpredictable changes might occur to different parameters. However, creating a predictable model can give a reasonable estimation and establish the groundwork for probabilistic modeling. It is feasible that predictable models may change over time. The model is referred to as a steady-state deterministic process if there is no fluctuation with regard to time. By contrast, a time series of steady-state deterministic processes is what is used when the input parameters of a deterministic model change incrementally over time. A dynamic deterministic model falls under the last group; it is dependent on several incremental series (such time and space) and has known input values for each state. This category is typically useful in forecasting studies [74].
The focus of stochastic modeling is to utilize various techniques to integrate the randomness inherent in the process to be modeled. For a given state, the inputs are not fixed; instead, there is a margin of uncertainty. A parameter might have any value within a specified range. Therefore, it is likely to obtain a different set of results for every independent run of a stochastic model. As a result, a probability distribution can be obtained through this process. A few examples of the stochastic modeling include the Poisson, Brownian, and Markov processes.
The Monte Carlo simulation is a mathematical technique useful in predicting the probability of different outcomes of a process with parameters that are random in nature. To incorporate the randomness, every input parameter randomly takes a value within the specified range of parametric uncertainty. The model is executed for a large number of iterations with a randomly generated unique set of inputs for every run. Finally, a statistical toolset can be used to obtain a probabilistic output. This technique is commonly employed in various applications, including optimization and numerical integration [74].
2.3. Battery Degradation
Battery degradation is a natural process by which the capacity of the battery to store energy reduces over time. For a particular project, it is not desirable and not cost-effective to replace batteries within the project’s lifetime. Thus, incorporating a battery degradation model is important for planning studies to ensure the required battery storage without the replacement of batteries, preventing additional investment costs. The DOD, allowable number of charge/discharge cycles, and the calendar lifetime of battery storage are the key factors to be considered for modeling the battery degradation [75]. A mixed integer programming (MIP)-based approach was adopted in [76], for determining the optimal size and DOD of a standalone microgrid, to minimize expansion costs. In [77], the battery degradation factors were incorporated into the formulation of a probabilistic mixed integer linear programming (MILP) approach for optimal integration of RESs and energy storage for the minimization of energy costs in fast charging stations. An improved MILP-based method was introduced in [78] to determine the optimal size of battery storage along with DOD and replacement year, taking the service life and capacity degradation of battery storage into consideration. In [79], the battery life degradation model was considered for a pragmatic MILP-based approach that can efficiently determine the optimal DOD and the number of charge/discharge cycles over a project’s lifetime.
3. Optimization Process
3.1. Problem Formulation
For optimal operation of the HMS, a multi-objective optimization approach is adopted in this study. A multi-objective optimization problem (MOP) can be typically represented as
where x is a vector of the design variables associated with the problem. F(x) represents the vector consisting of the individual objective functions, . Vectors and represent the equality and inequality constraint sets, respectively.
3.2. Objective Functions
To ensure the cost-effectiveness and reliability of power supply of the HMS, two objective functions are considered in this study. They are the COE and the LPSP. Minimizing these two objective functions satisfying the associated constraints of the design variables can ensure the most optimum performance of the HMS.
3.2.1. Cost of Electricity (COE)
The definition of the COE is the average cost of generating usable electrical energy by a power system in its lifespan. In the context of hybrid energy systems, COE is commonly used to evaluate the economic feasibility of different asset configurations. The key factor in COE analysis for hybrid energy systems is the net profit cost (NPC), which includes capital costs, operation and maintenance (O&M) costs, and replacement costs. Although the initial capital cost is high for all renewable energy sources, they offer benefits such as high reliability, low O&M costs, and zero fuel expenses. To simplify the analysis, the procurement costs of PV panels, batteries, wind turbines, diesel generators, and inverters are considered as the cost components of the hybrid energy system in this study.
The COE can be determined using Equations (12) and (13) [29,80], where its unit is USD/kWh:
where denotes the consumed power per hour and CRF stands for the capital recovery factor, which can be determined by
where i represents the interest rate per annum for n number of years.
3.2.2. Loss of Power Supply Probability (LPSP)
LPSP is a significant statistical tool in quantifying the reliable supply of power in a system. It denotes the probability of not fulfilling the load demand, due to a deficient power supply. This deficiency of power can result from technical failure, uncertainty in the availability of RESs, and economic constraints. LPSP is generally quantified as the proportion of energy deficit to the total energy requirement over an extended duration as given in the following expression [81,82]:
It is worth noting that for the analysis of system reliability, it is assumed that the overall load requirement is greater than the total generated power:
3.3. The Constraints for Optimization
In this study, one of the constraints is the renewable factor (RF). The RF is the measure to discriminate between the amount of power produced by renewable and non-RESs. Thus, the contribution of the RES in the total power supply can be estimated by this factor. RF can be expressed as follows:
An RF value of 100%, which shows that the renewable energy resources satisfy the total load demand, is desirable.
3.4. Design Variables
The design variables considered for this study are the number of autonomy days (NAD), wind turbines (NWT), and diesel generators (NDiesel). In addition, the amount of nominal power from the PV panels is also taken as a variable.
3.5. Formulating the Uncertainty
As mentioned earlier, the design of microgrid systems includes the necessity to encounter some uncertain parameters such as the load. This load uncertainty can be formulated with the help of the following expression [74]:
where and are binary values.
Therefore, randomly changing of the real value of the load variable provides a simple way of simulating the uncertainty. Basically, the uncertainty is introduced in each time instant either by increasing or decreasing the load by .
3.6. Degradation Formulation
The charge–discharge cycles and DOD per cycle of batteries are the major elements contributing to their degradation [79]. The degradation is considered in this study to impact the capacity, , of the batteries as follows:
where degradation is denoted in percentage over the batteries’ lifetime and it is selected to be 75% in this study.
3.7. Problem Solution Using Decomposition-Based Multi-Objective Evolutionary Algorithm (MOEA/D)
MOEA/D is utilized to break down the MOP specified in (11) into several objective functions for resolution [44]. This decomposition, achieved using any appropriate decomposition technique, leads to several competing objectives. Typically, the selected decomposition method generates scalar optimization problems that are solved using Pareto optimal vectors. The most commonly used decomposition methods are the weighted sum (WS), weighted Tchebycheff (TCH), and Penalty-based Boundary Intersection (PBI) approaches [45]. In this work, we briefly discuss the WS approach but focus more on and adopt the PBI approach, the TCH approach, and their extensions, as discussed in the following subsections.
3.7.1. The Weighted Sum Approach
The weighted sum (WS) is the convex combination of the different objectives. If we define the weight vector as , where and , a weighted sum is defined as
3.7.2. The Weighted Tchebycheff (TCH) Approach
The Tchebycheff approach is robust to the shape of Pareto fronts and can be presented as the following scalar optimization problem:
where is the reference point combining the smallest values of all the objectives : for
3.7.3. The Normalized TCH Version (NTCH)
The TCH approach suffers from the non-smoothness of the aggregation function for continuous MOPs. Moreover, for MOPs with three or more objectives, there is a noticeable degradation in uniformity of the aggregated solutions obtained using TCH compared to PBI, which is exasperated when the number of weight vectors is insufficient [44]. Hence, objective normalization is often employed to improve the solutions in non-uniformly scaled objectives. A typical normalization technique of the objectives with their normalized versions is
where is the nadir point in the objective space. sets the maximum limit of the PF, i.e., .
3.7.4. The Modified TCH Version (MTCH)
The MTCH approach is formulated by the following formula:
3.7.5. Variants of the TCH Approach
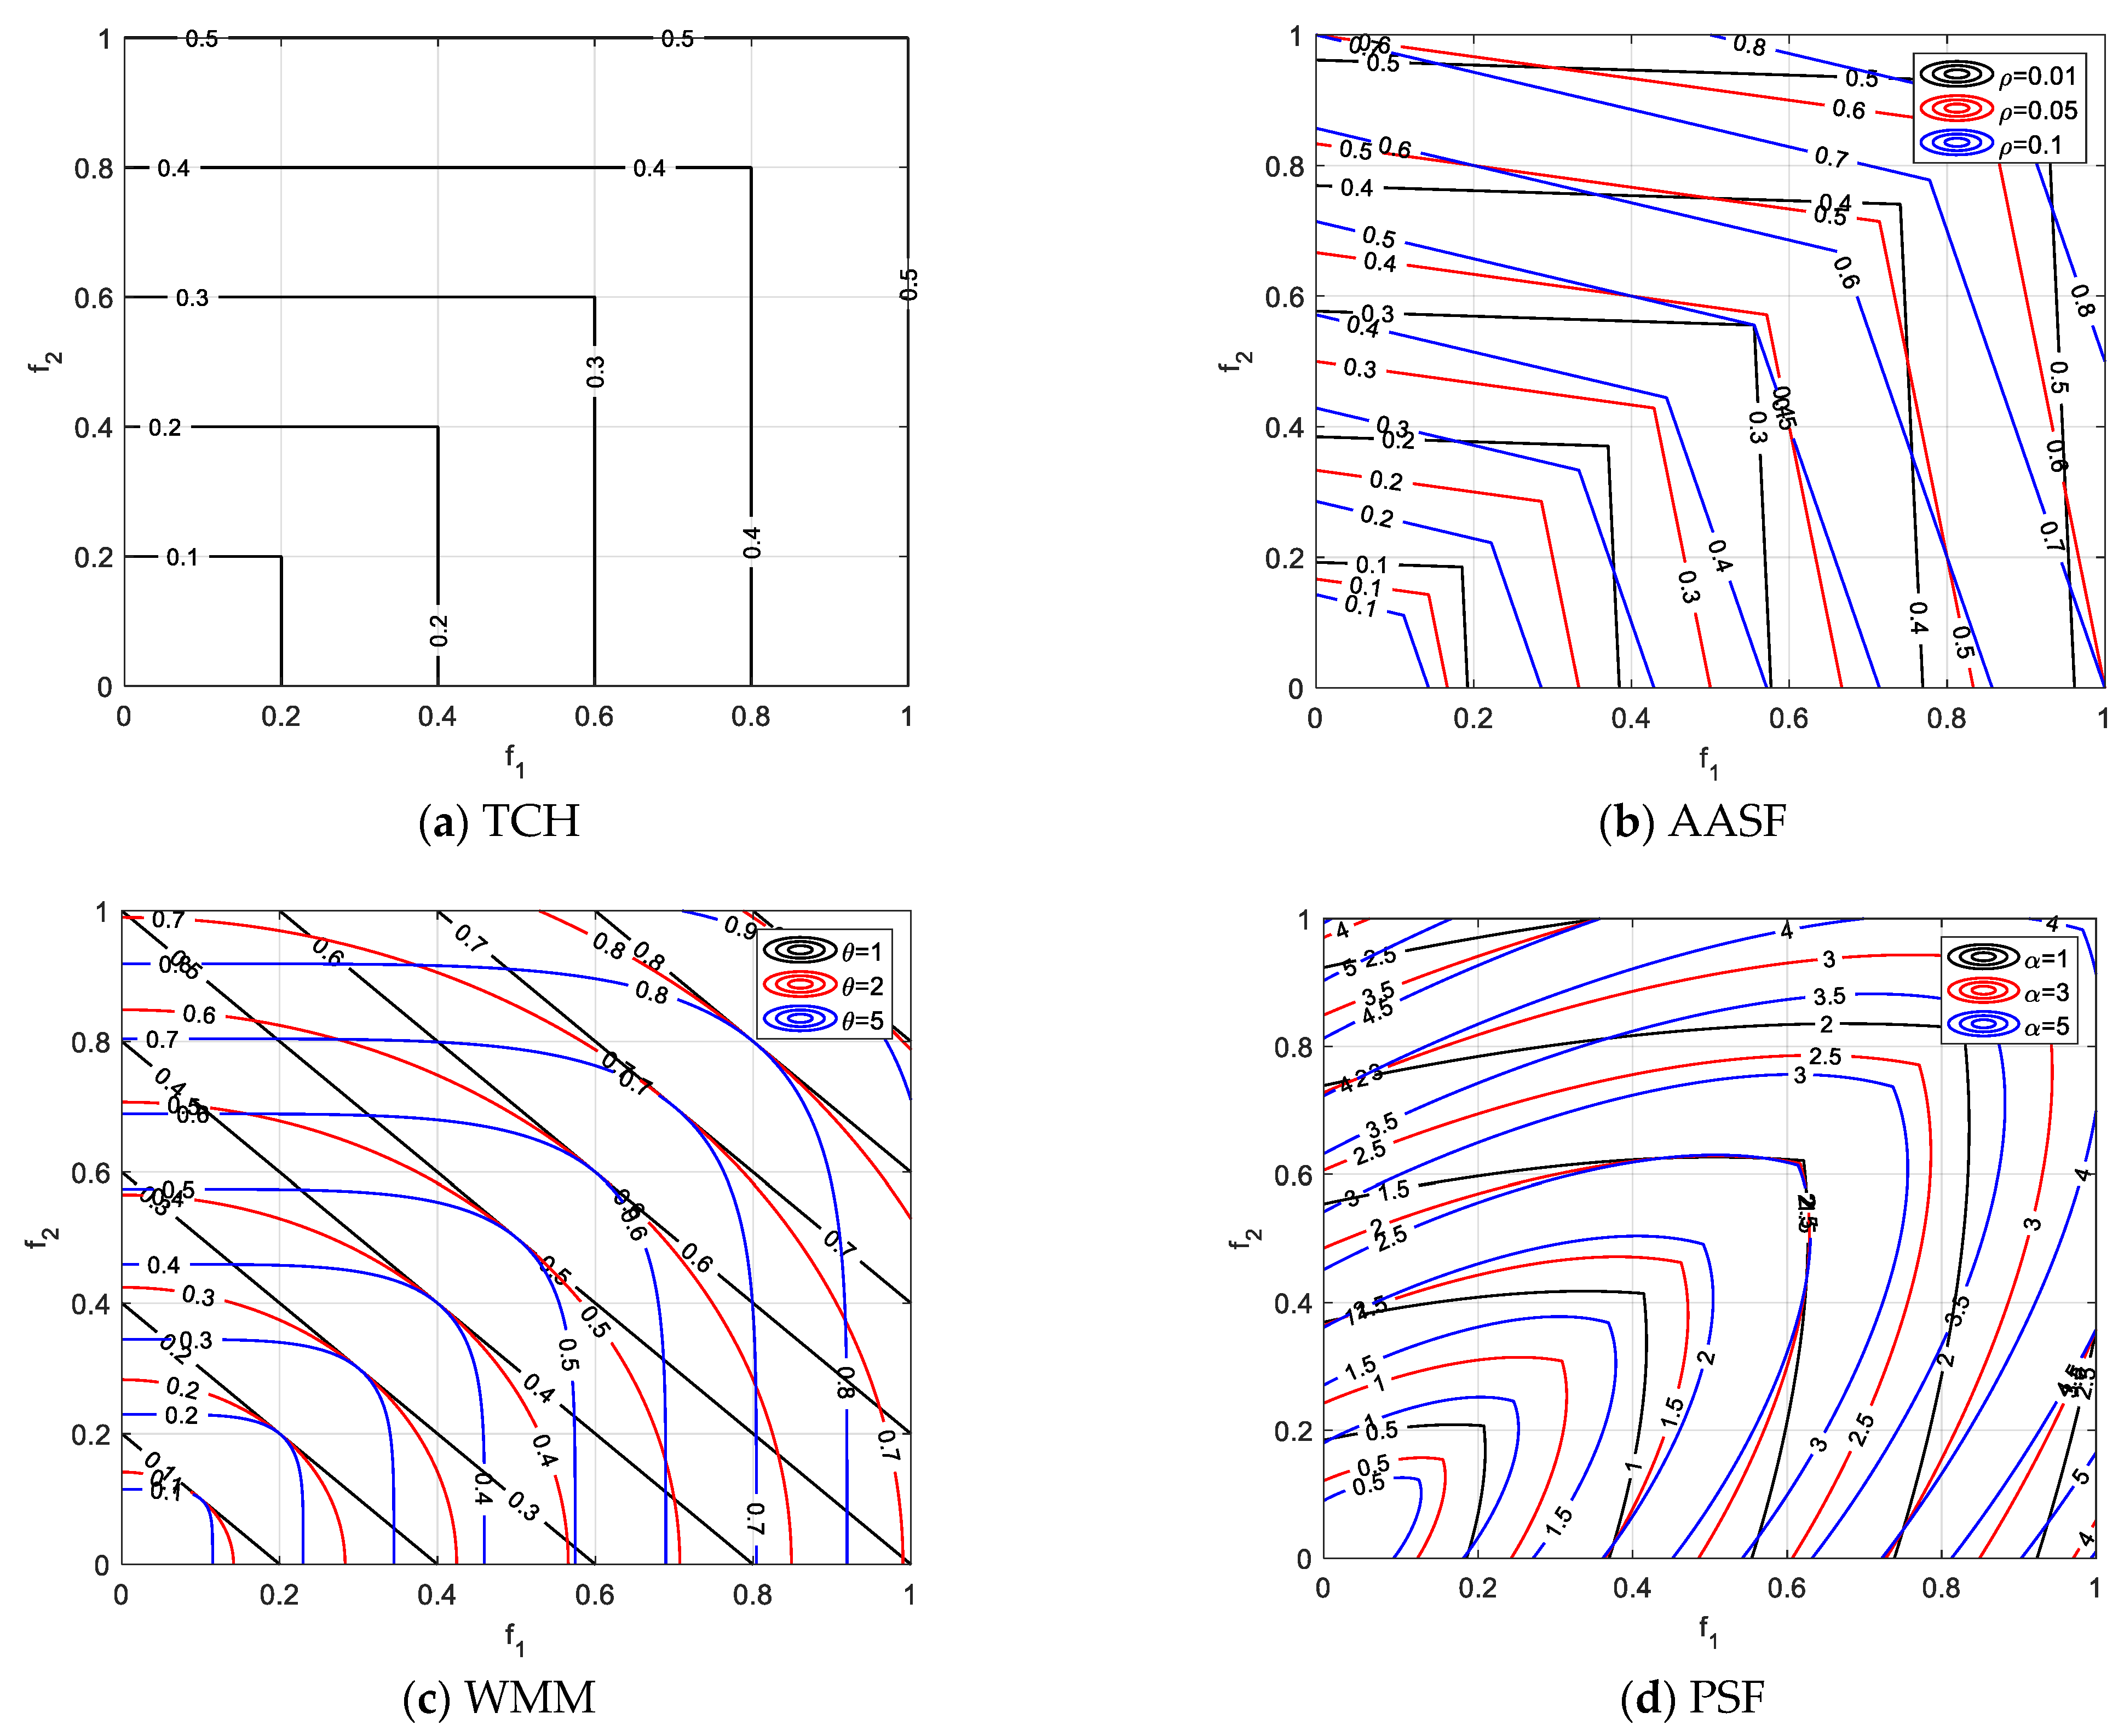
For the TCH-based methods, the shape of the contour line primarily depends on the distance measured with reference to the ideal point. The Tchebycheff distance used in the original TCH method leads to contour lines like the Pareto dominance relation for identifying better solutions [46] and cannot distinguish weakly dominated solutions. To address the issues associated with the TCH approach for subproblem formulation based on the shape of the contour lines and to improve the regions that define solutions, various modifications to the traditional TCH have been proposed over the years. Each of these variants, discussed next, tweaks the contour lines to achieve some improvements by adapting the weighted metric parameter. The contour lines for the different variants of TCH are shown in Figure 3.
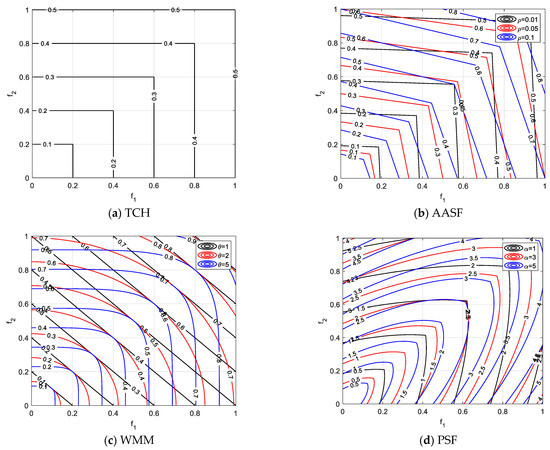
Figure 3.
Contour lines of the variants of Tchebycheff [45].
Augmented Achievement Scalarizing Function (AASF)
The augmented achieving scalarizing function (AASF) [46] was introduced to tweak the opening angle of the contour lines, as shown in Figure 3b. The function is given as
The parameter is used to tweak the contour line’s opening angle. A major drawback of this approach is the lack of thumb rules for the choice of to control the improvement region. Applications of this are found in [46,83].
Weighted-Metrics-Based (WMM) Methods
The crispy improvement region of TCH leads to a loss of population diversity. Hence, weighted metrics methods have been employed to adapt the contour lines’ shape, depicted in Figure 3c, to the subproblems’ respective local regions. A typical function that achieves this is the weighted metrics method [47,48]:
The parameter controls the geometrical characteristics of the contour lines. The improvement region for each subproblem can be refined via the adaptive tuning of from a predefined set . This application can be found in MOEA/D-Par [48] and MOEA/D-D-Pas [47].
Multiplicative Scalarizing Function (MSF)
The multiplicative scalarizing function (MSF) factor proposed by [49] is similar to the WMM. Let be the parameter that controls the shape of the MSF contour, and then the MSF is defined as [49]
This becomes TCH when but overlaps with the corresponding weight vector when . The parameter can be made adaptive using [79]:
The parameter is the value associated with the -th subproblem.
Penalty-Based Scalarizing Function (PSF)
The penalty-based scalarizing function (PSF) was also proposed by [49] as described by the following equation:
where is a parameter that balances the trade-off between convergence and diversity, and , which is defined similarly to in the PBI. The contour lines for PSF are presented in [49]. The contour lines for PSF are shown in Figure 3d.
3.7.6. The Penalty-Based Boundary Intersection (PBI) Approach
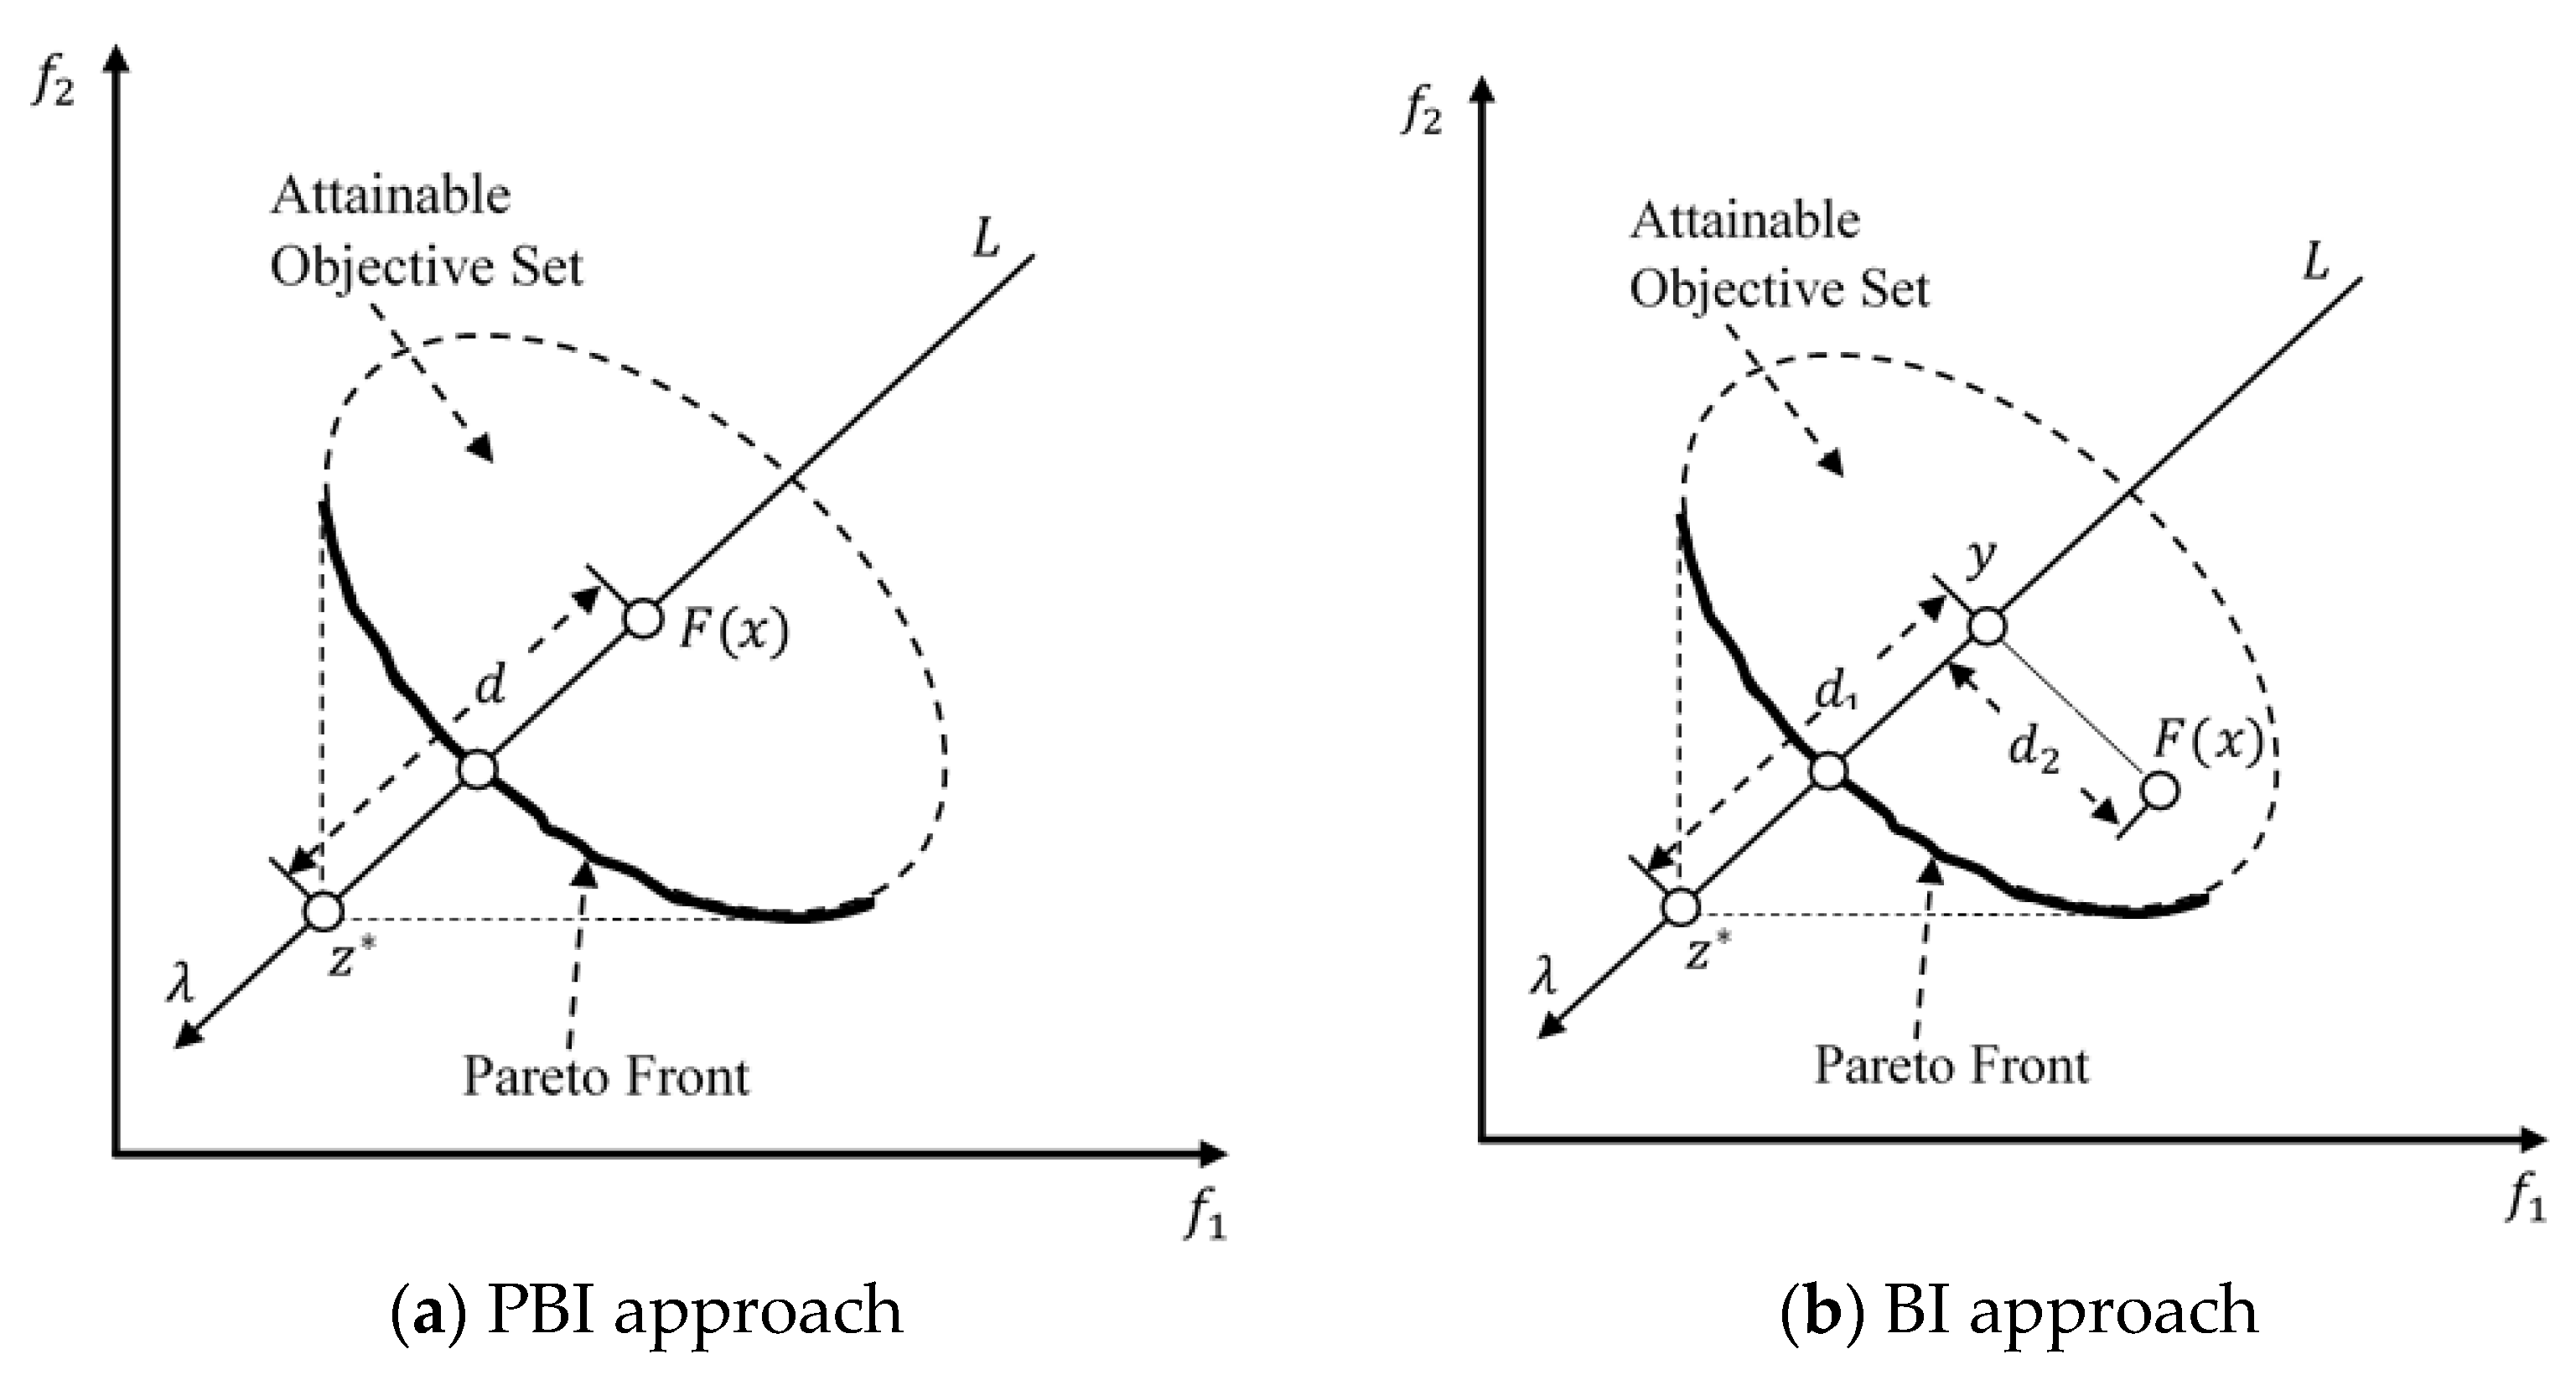
The PBI technique is a type of boundary intersection (BI) method used for decomposing MOPs. These methods were initially developed for continuous MOPs and are effective with non-concave PFs. Equations (28) and (29) define the BI and PBI approaches, respectively, and their corresponding geometric interpretations are shown in Figure 4 [32]. In the BI method, the objective is to find the points of intersection on the leftmost boundary set of lines, which, if evenly distributed, can sufficiently approximate the entire PF.
where is the weight vector and is the reference point. is constrained to remain on the line while is constrained to remain along the orientation of by the equation , which also ensures that it passes . However, the BI approach is unable to deal with equality constraints.
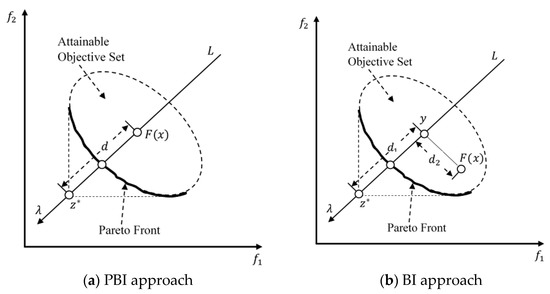
Figure 4.
Geometrical representation of the (a) PBI and (b) BI approaches [32].
The PBI method uses a penalty technique to handle equality constraints and is expressed in the following equation.
where is the distance between and (the projection of on the line ); is the distance between and ; and the penalty parameter, , can be defined by the user. Choosing an appropriate value of results in outcomes that are similar to those obtained with the BI method. When employed in MOP, the PBI approach results in the equitable allocation and convergence of optimal solutions.
3.7.7. Variants of the PBI Approach
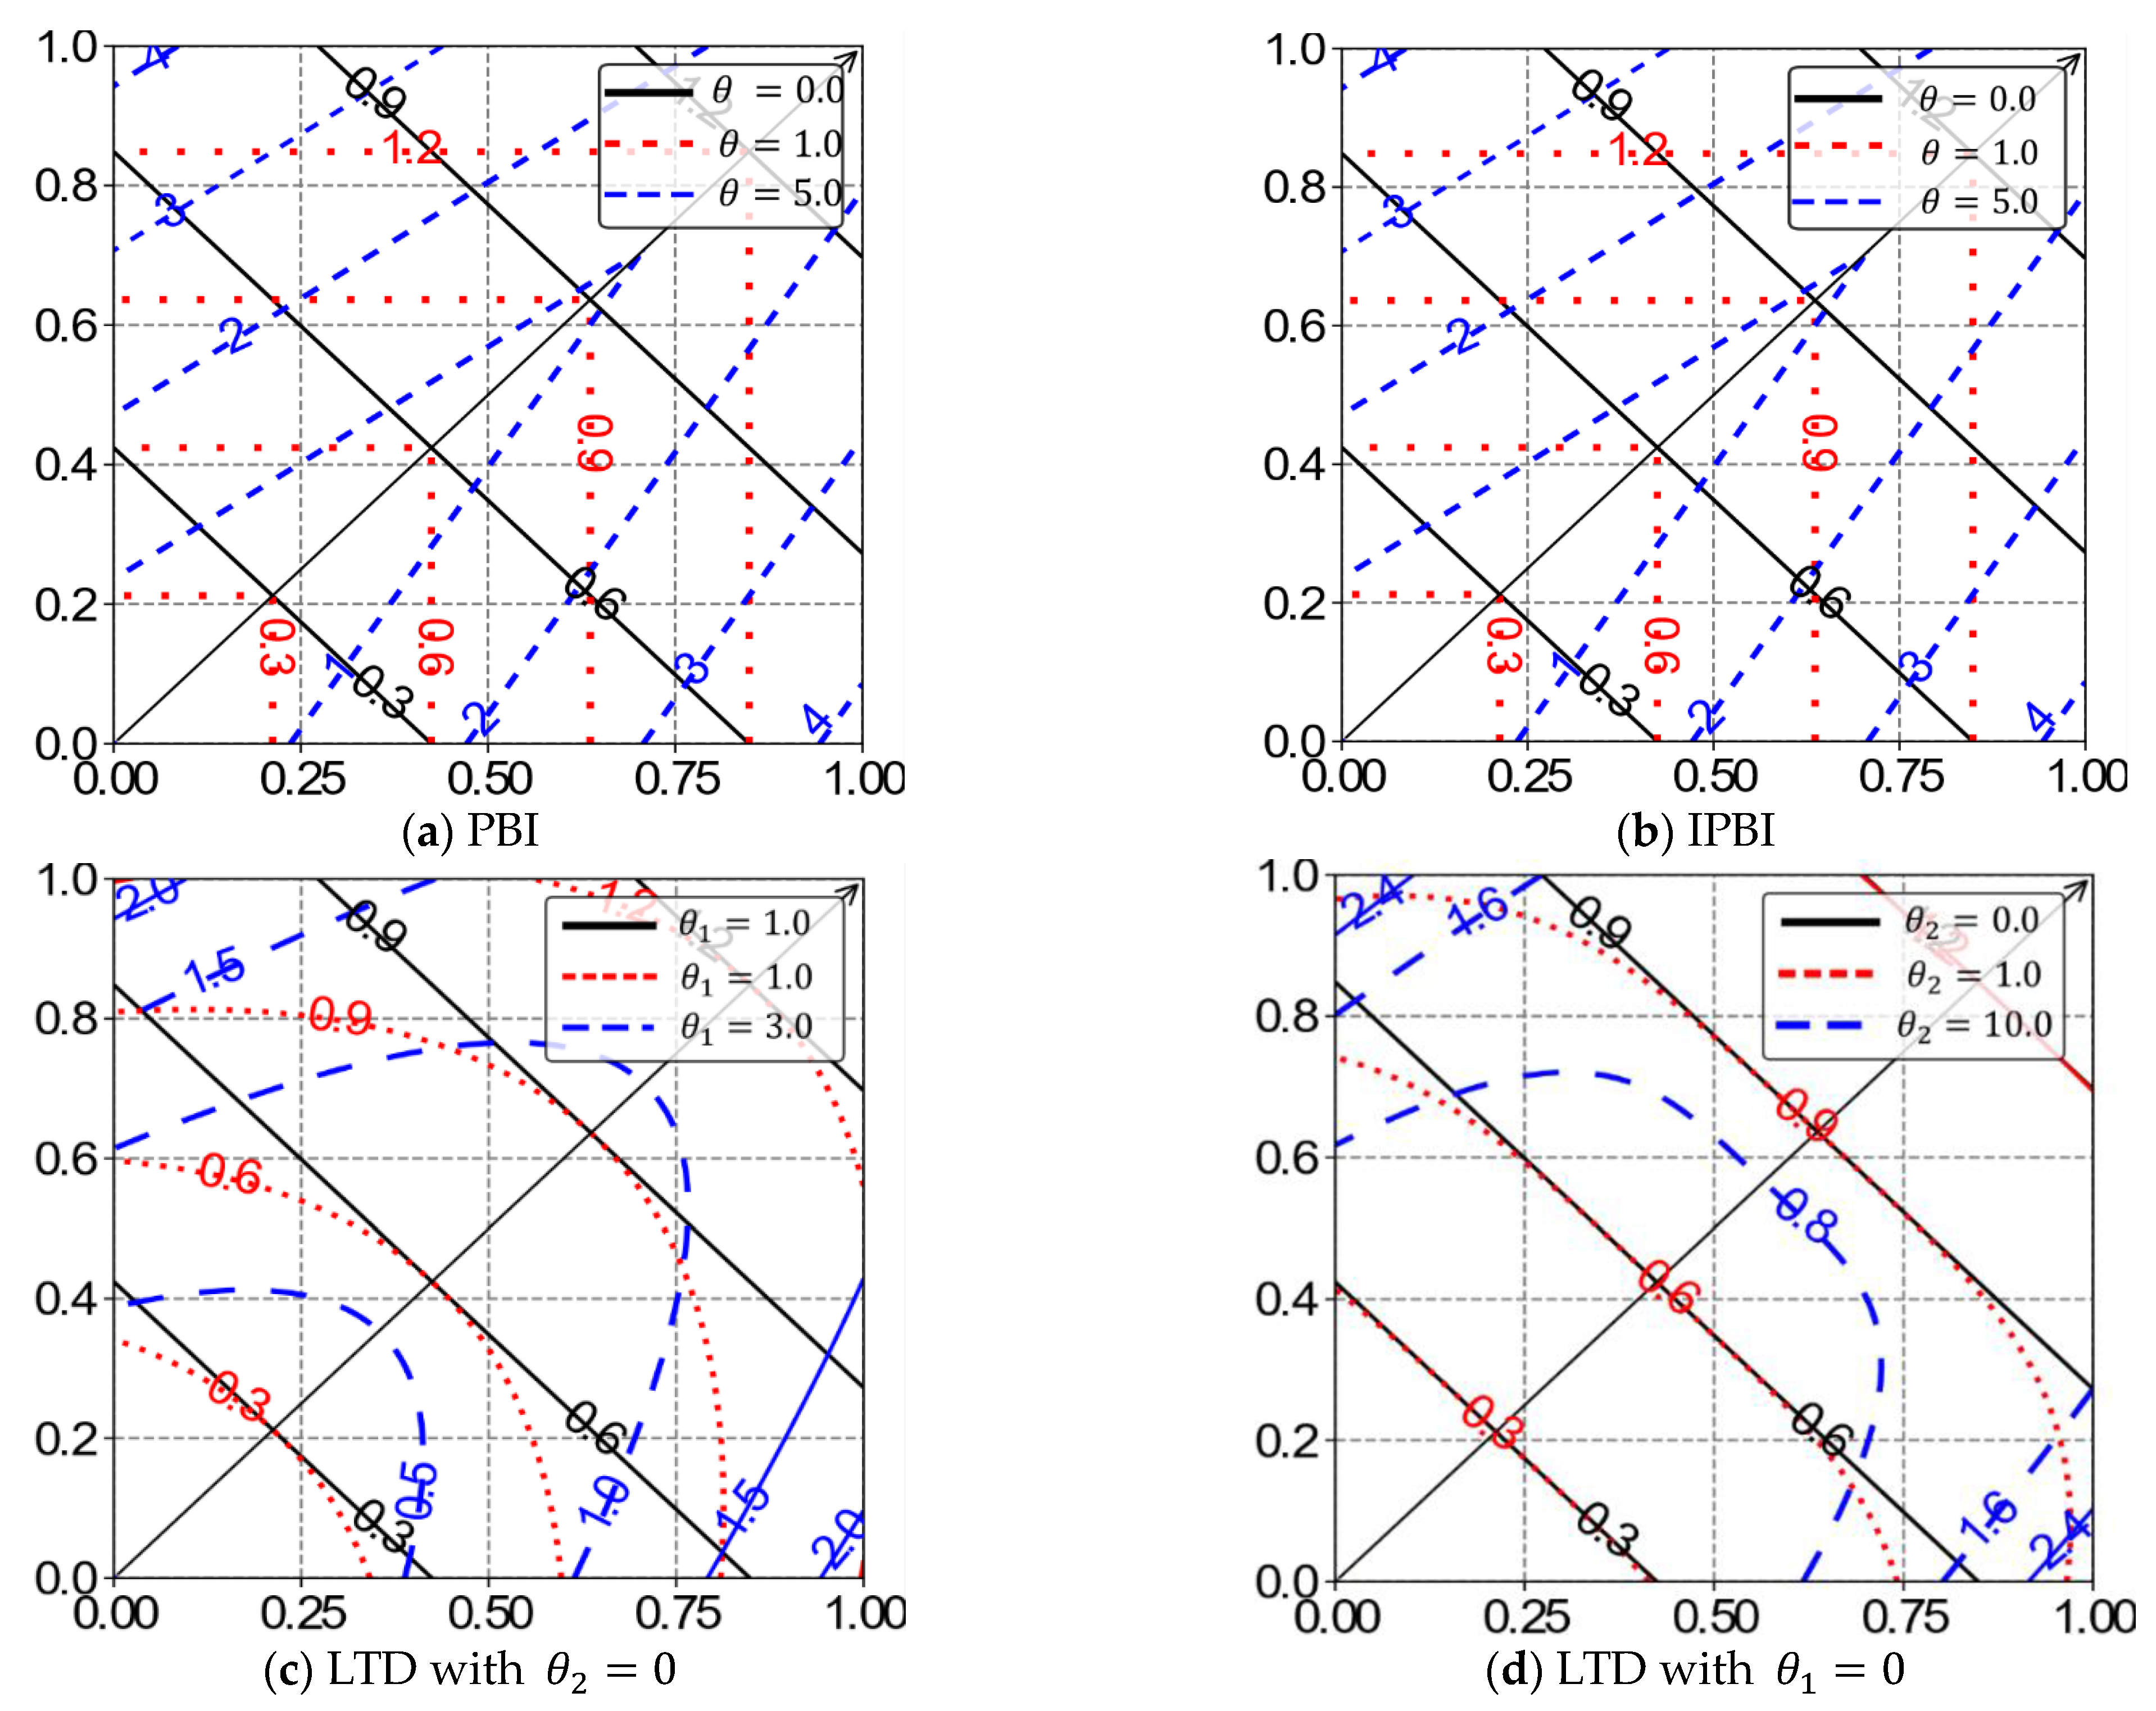
These variants focus on the contour line shape and the improvement region’s size that defines better solutions. The smaller improvement region emphasizes diversity while the converse emphasizes convergence. For PBI, the improvement region is controlled by the parameter from Equation (28). As observed from the equation, it functions like the TCH approach or WS approach when or , respectively. The significance of the improvement increases with decreasing values of Hence, an approach for developing PBI variants is by the adaptation of with respect to the shape of the Pareto Front [50,84]. The contours for some variants of PBI are shown in Figure 5.
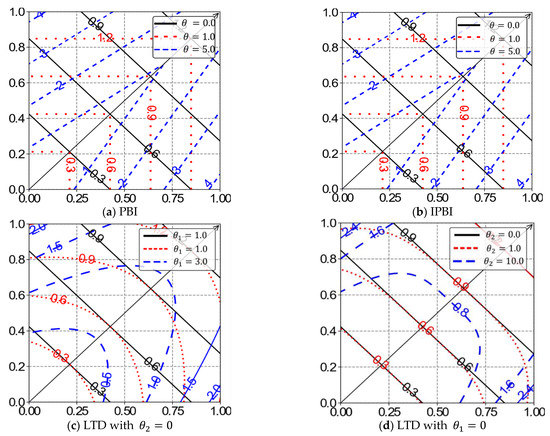
Figure 5.
Contour lines of the variants of the PBI approach.
Adaptive Penalty Scheme (APS)
In the adaptive penalty scheme (APS) [50], the penalty factor, increases cautiously as the evolution progresses according to the equation
where represents the generation count with maximum generation count : . APS strives to facilitate convergence at an earlier stage of the evolution and then gradually focuses on diversity later in the evolution process. Schemes based on APS include MOEA/D-PaP [84], NSGA-III-AASF, and NSGA-III-EPBI [85].
Subproblem-Based Penalty Scheme (SPS)
Another method of adapting the penalty is the subproblem-based penalty scheme (SPS). As the name implies, is independently assigned to each of the subproblems such that for the th subproblem:
where the parameters and are the penalty for the -th subproblem and -th element of the -th weight, respectively. The variable is the scaling factor that controls the size of the penalty.
Inverted PBI (IPBI)
The inverted PBI adopts an approach that does not adapt the penalty term. Instead, it uses the equation [51,52]:
where and . IPBI functions by pushing away the solution as far as possible from . As such, it often has similar characteristics to the traditional PBI but with the ability to search over a more comprehensive objective space. The contour lines for the IPBI are shown in Figure 5b.
The Augmented PBI (APBI)
The augmented format of the PBI uses augmented multiple distance metrics as follows:
where the parameters and control the underlying subproblem’s search attitude via the distribution and shape of the curvature contours and opening angle. In practice, a Gaussian process regression model is used to set and based on the manifold structure of the underlying PF. An example of this variant is the MOEA/D-LTD [53]. The contour lines for LTD with fixed and are shown in Figure 5c,d, respectively.
3.7.8. The General Framework for MOEA/D
MOEA/D utilizes an appropriate decomposition method to decompose the MOP based on the given problem. In this scenario, it is assumed that the TCH approach is employed; however, any other appropriate decomposition technique can be readily substituted.
The th objective function in the TCH decomposition method is defined as
where represents the weight vector from a set of evenly spread weight vectors , and represents the reference point. The neighborhood weight vector, , is defined by the set of nearest weight vectors, Usually, only the most recent solutions of neighboring subproblems are used for optimization. At each iteration, in the TCH-decomposed MOEA/D, the maintenance of certain data is described in [44]. The maintained information includes:
- 1.
- The population of the most recent solution to the N subproblems, .
- 2.
- The F values of these recent solutions, .
- 3.
- The set of optimal values for the objectives discovered so far, .
- 4.
- An external population, comprising solutions that are nondominated.
- 5.
- Refer to Algorithm 1 for the details of the MOEA/D algorithm [44].
With the help of the Euclidean distance parameter, the distance between two vectors is calculated. If objective normalization is performed, it is not essential to compute and beforehand. In this study, is substituted with , while is replaced by , which is the maximum value of objective ( in the current population. Consequently, is substituted with a new value, given by (36), during the update of neighboring solutions step.
| Algorithm 1: MOEA/D | |
| Input: (1) MOP (11); (2) Stopping criteria ; (3) N: Number of MOEA/D subproblems ; (4) N uniform spread of weight vectors (5) T: no. of weight vectors in the neighborhood of each weight vector Output: | |
| 1 | Initialization: |
| 2 | Compute the Euclidean distance between any two weight vectors and find the T closest weight |
| vectors to each weight vector. | |
| 3 | for do |
| 4 | – the T closest weight vectors to . |
| 5 | end for |
| 6 | Generate initial population randomly or by the problem-specific method. |
| 7 | Set . |
| 8 | Initialize by a problem-specific method |
| 9 | while the stopping criteria is not met do |
| 10 | Update: |
| 11 | for do |
| 12 | Reproduction: |
| 13 | Randomly select two indexes from , and generate a new solution |
| from and by using genetic operators | |
| 14 | Improvement: |
| 15 | Apply a problem-specific repair/improvement heuristic on to produce |
| 16 | Update |
| 17 | for to do |
| 18 | if then |
| 19 | |
| 20 | end if |
| 21 | end for |
| 22 | Update Neighboring Solutions: |
| 23 | for do |
| 24 | if |
| 25 | set and |
| 26 | end if |
| 27 | end for |
| 28 | Update EP: |
| 29 | Remove from EP all the vectors dominated by |
| 30 | Add to EP if no vectors in EP dominate |
| 31 | end for |
| 32 | end while |
4. The Proposed IMOEAD Approach: Description and Implementation
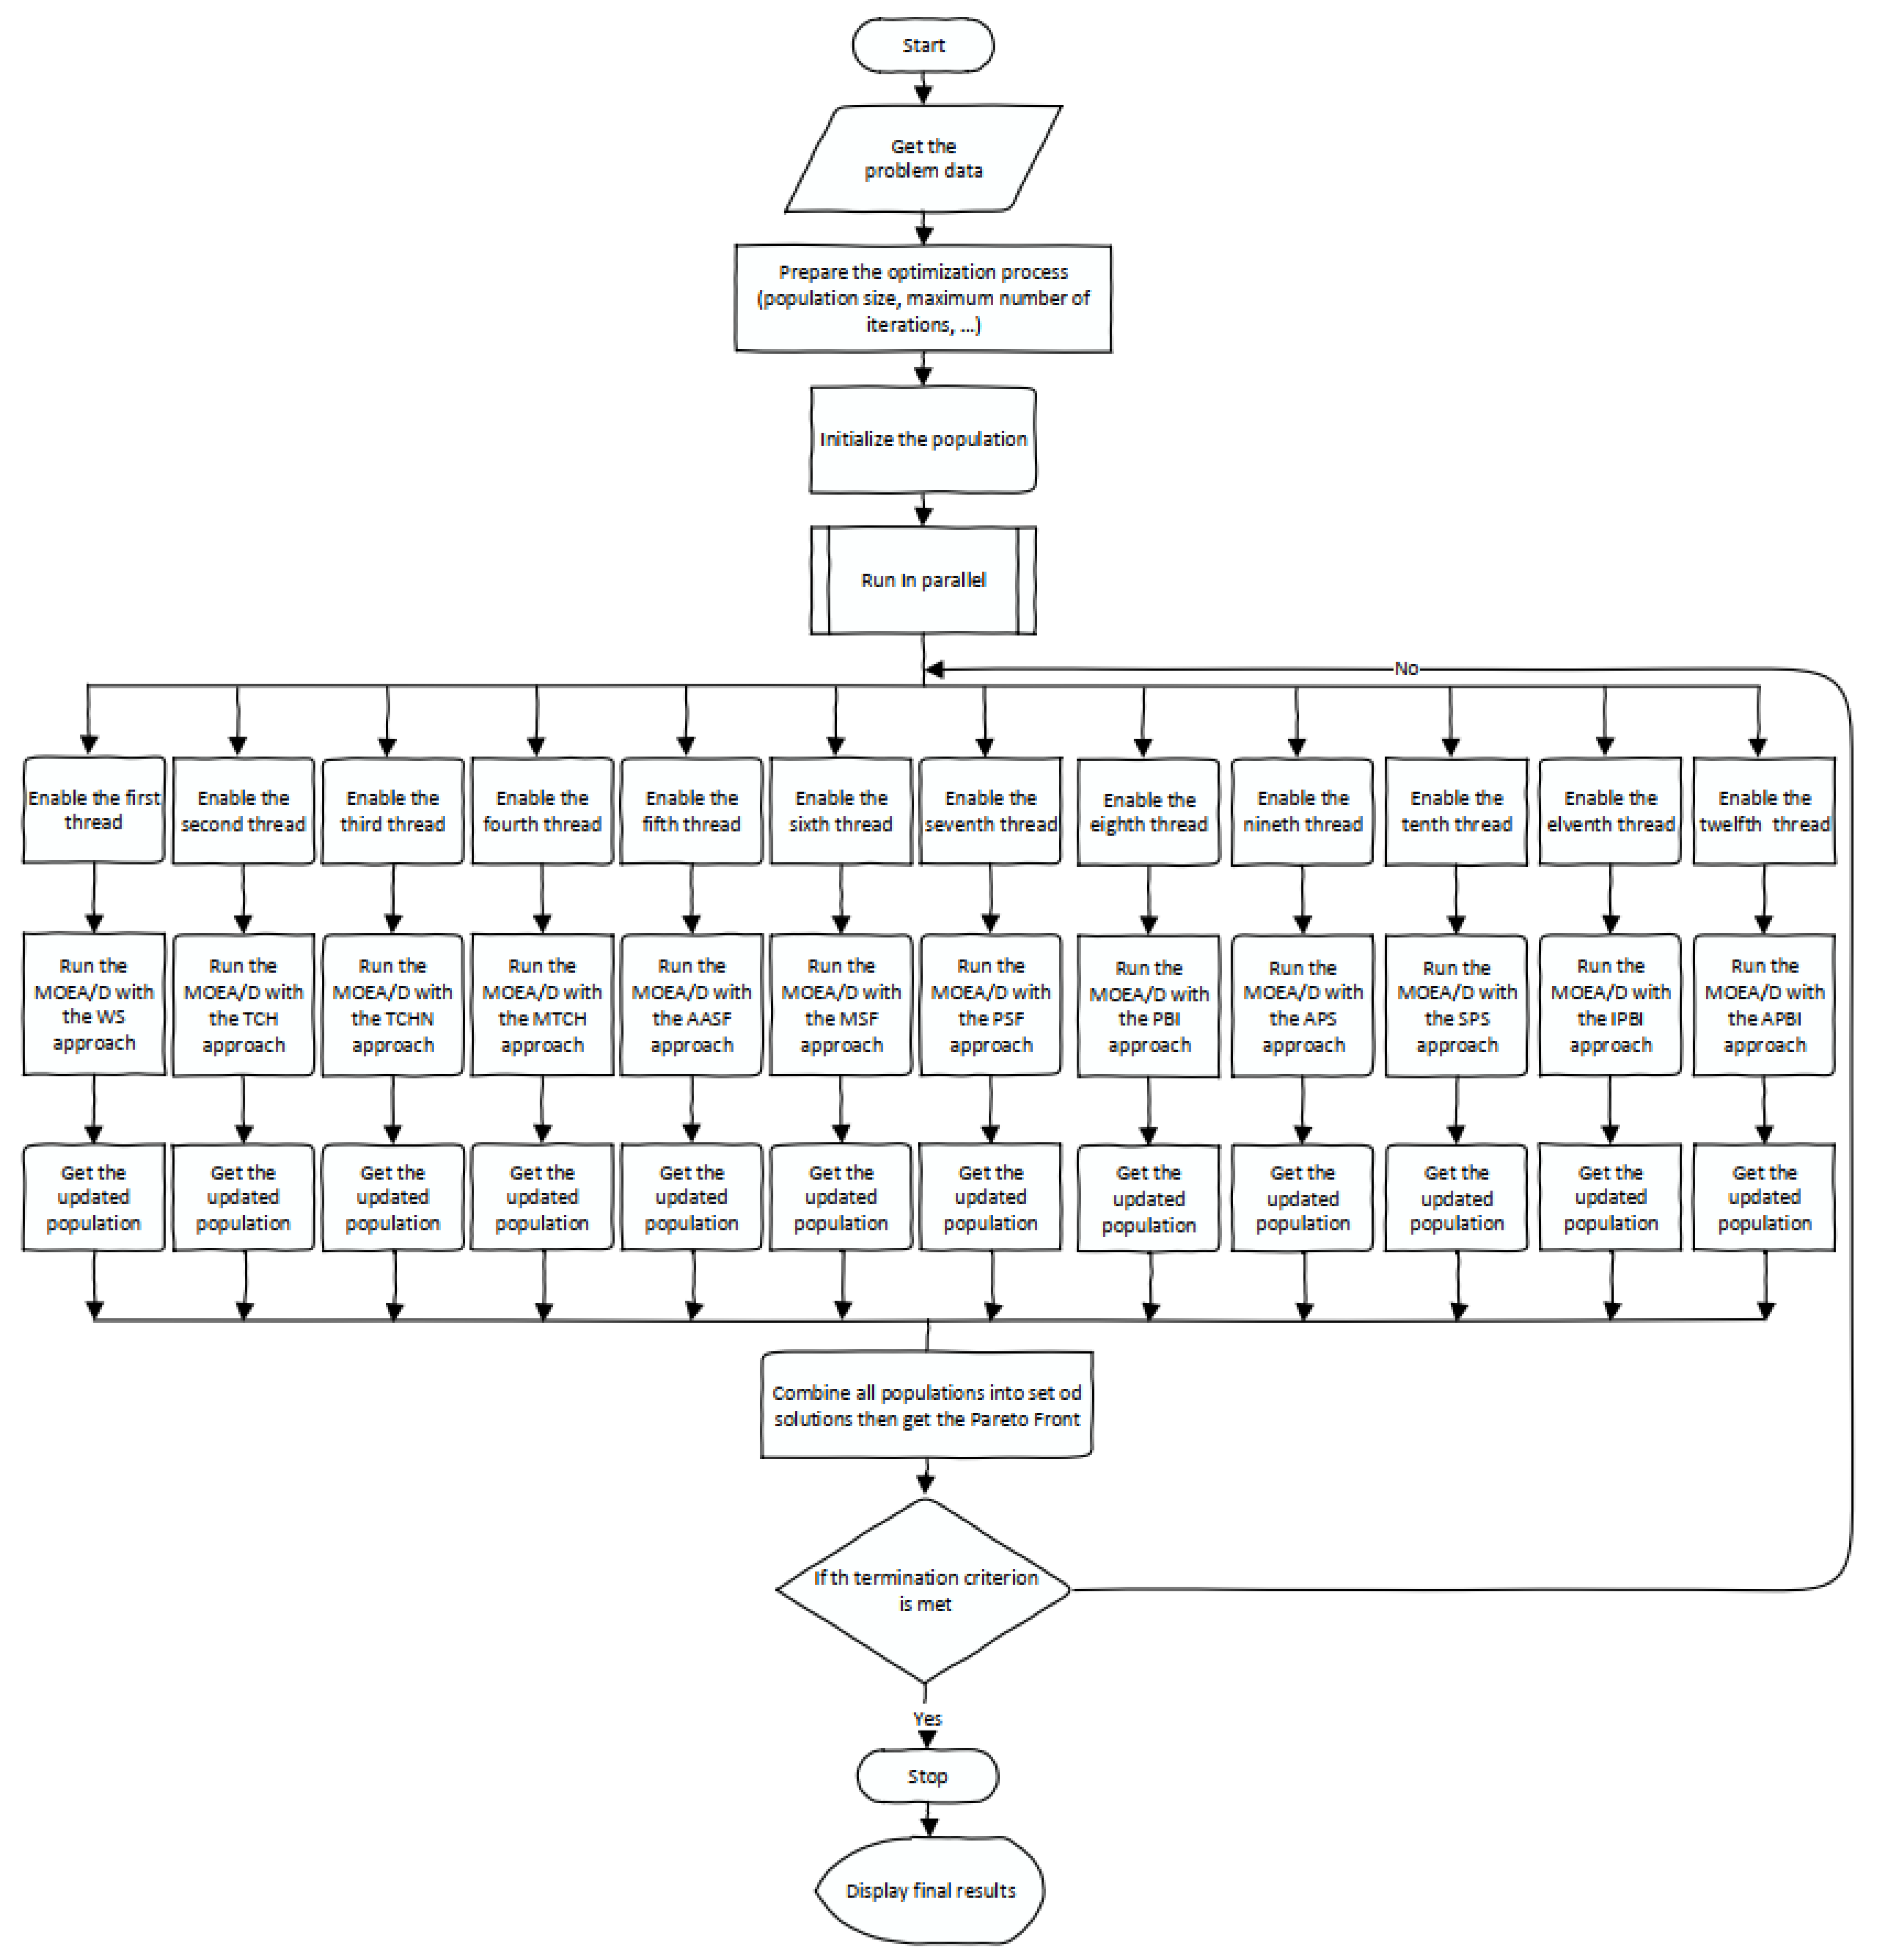
As aforesaid, in this paper, a new improved MOEA/D is proposed, developed, and implemented to optimally size a hybrid PV/Battery/Wind/Diesel microgrid system. This proposed approach combines the multiple decomposition techniques presented in Section 3.7 and it is noted as IMOEAD. It is implemented to solve the problem at hand, as shown in the flowchart of Figure 6.
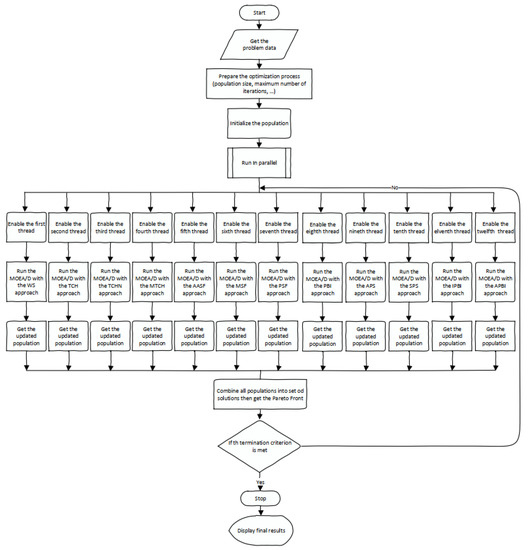
Figure 6.
Flowchart of the proposed approach.
It starts by collecting different data of the microgrid and its different components. Subsequently, the internal optimization parameters, such as the population size and maximum iteration count, can be specified by the user (designer). The population is then randomly initialized and generated in the search space. Then, 13 threads are open in parallel; for each one, a different decomposition technique is run separately (from the first to the thirteenth thread, ES, TCH, NTCH, MTCH, AASF, WMM, MSF, PSF, PBI, APS, SPS, IPBI, and ABPI are run in parallel). The population size for each algorithm is the same as the first one given in the initial data. Once the updated population for each algorithm is obtained, they are all combined in one population. The nondominated solutions are determined from this population. And the process runs again and again until the termination criterion is updated. Finally, the optimal results are displayed, and the designer takes the needed further steps to exploit these results.
5. Application Results and Discussion
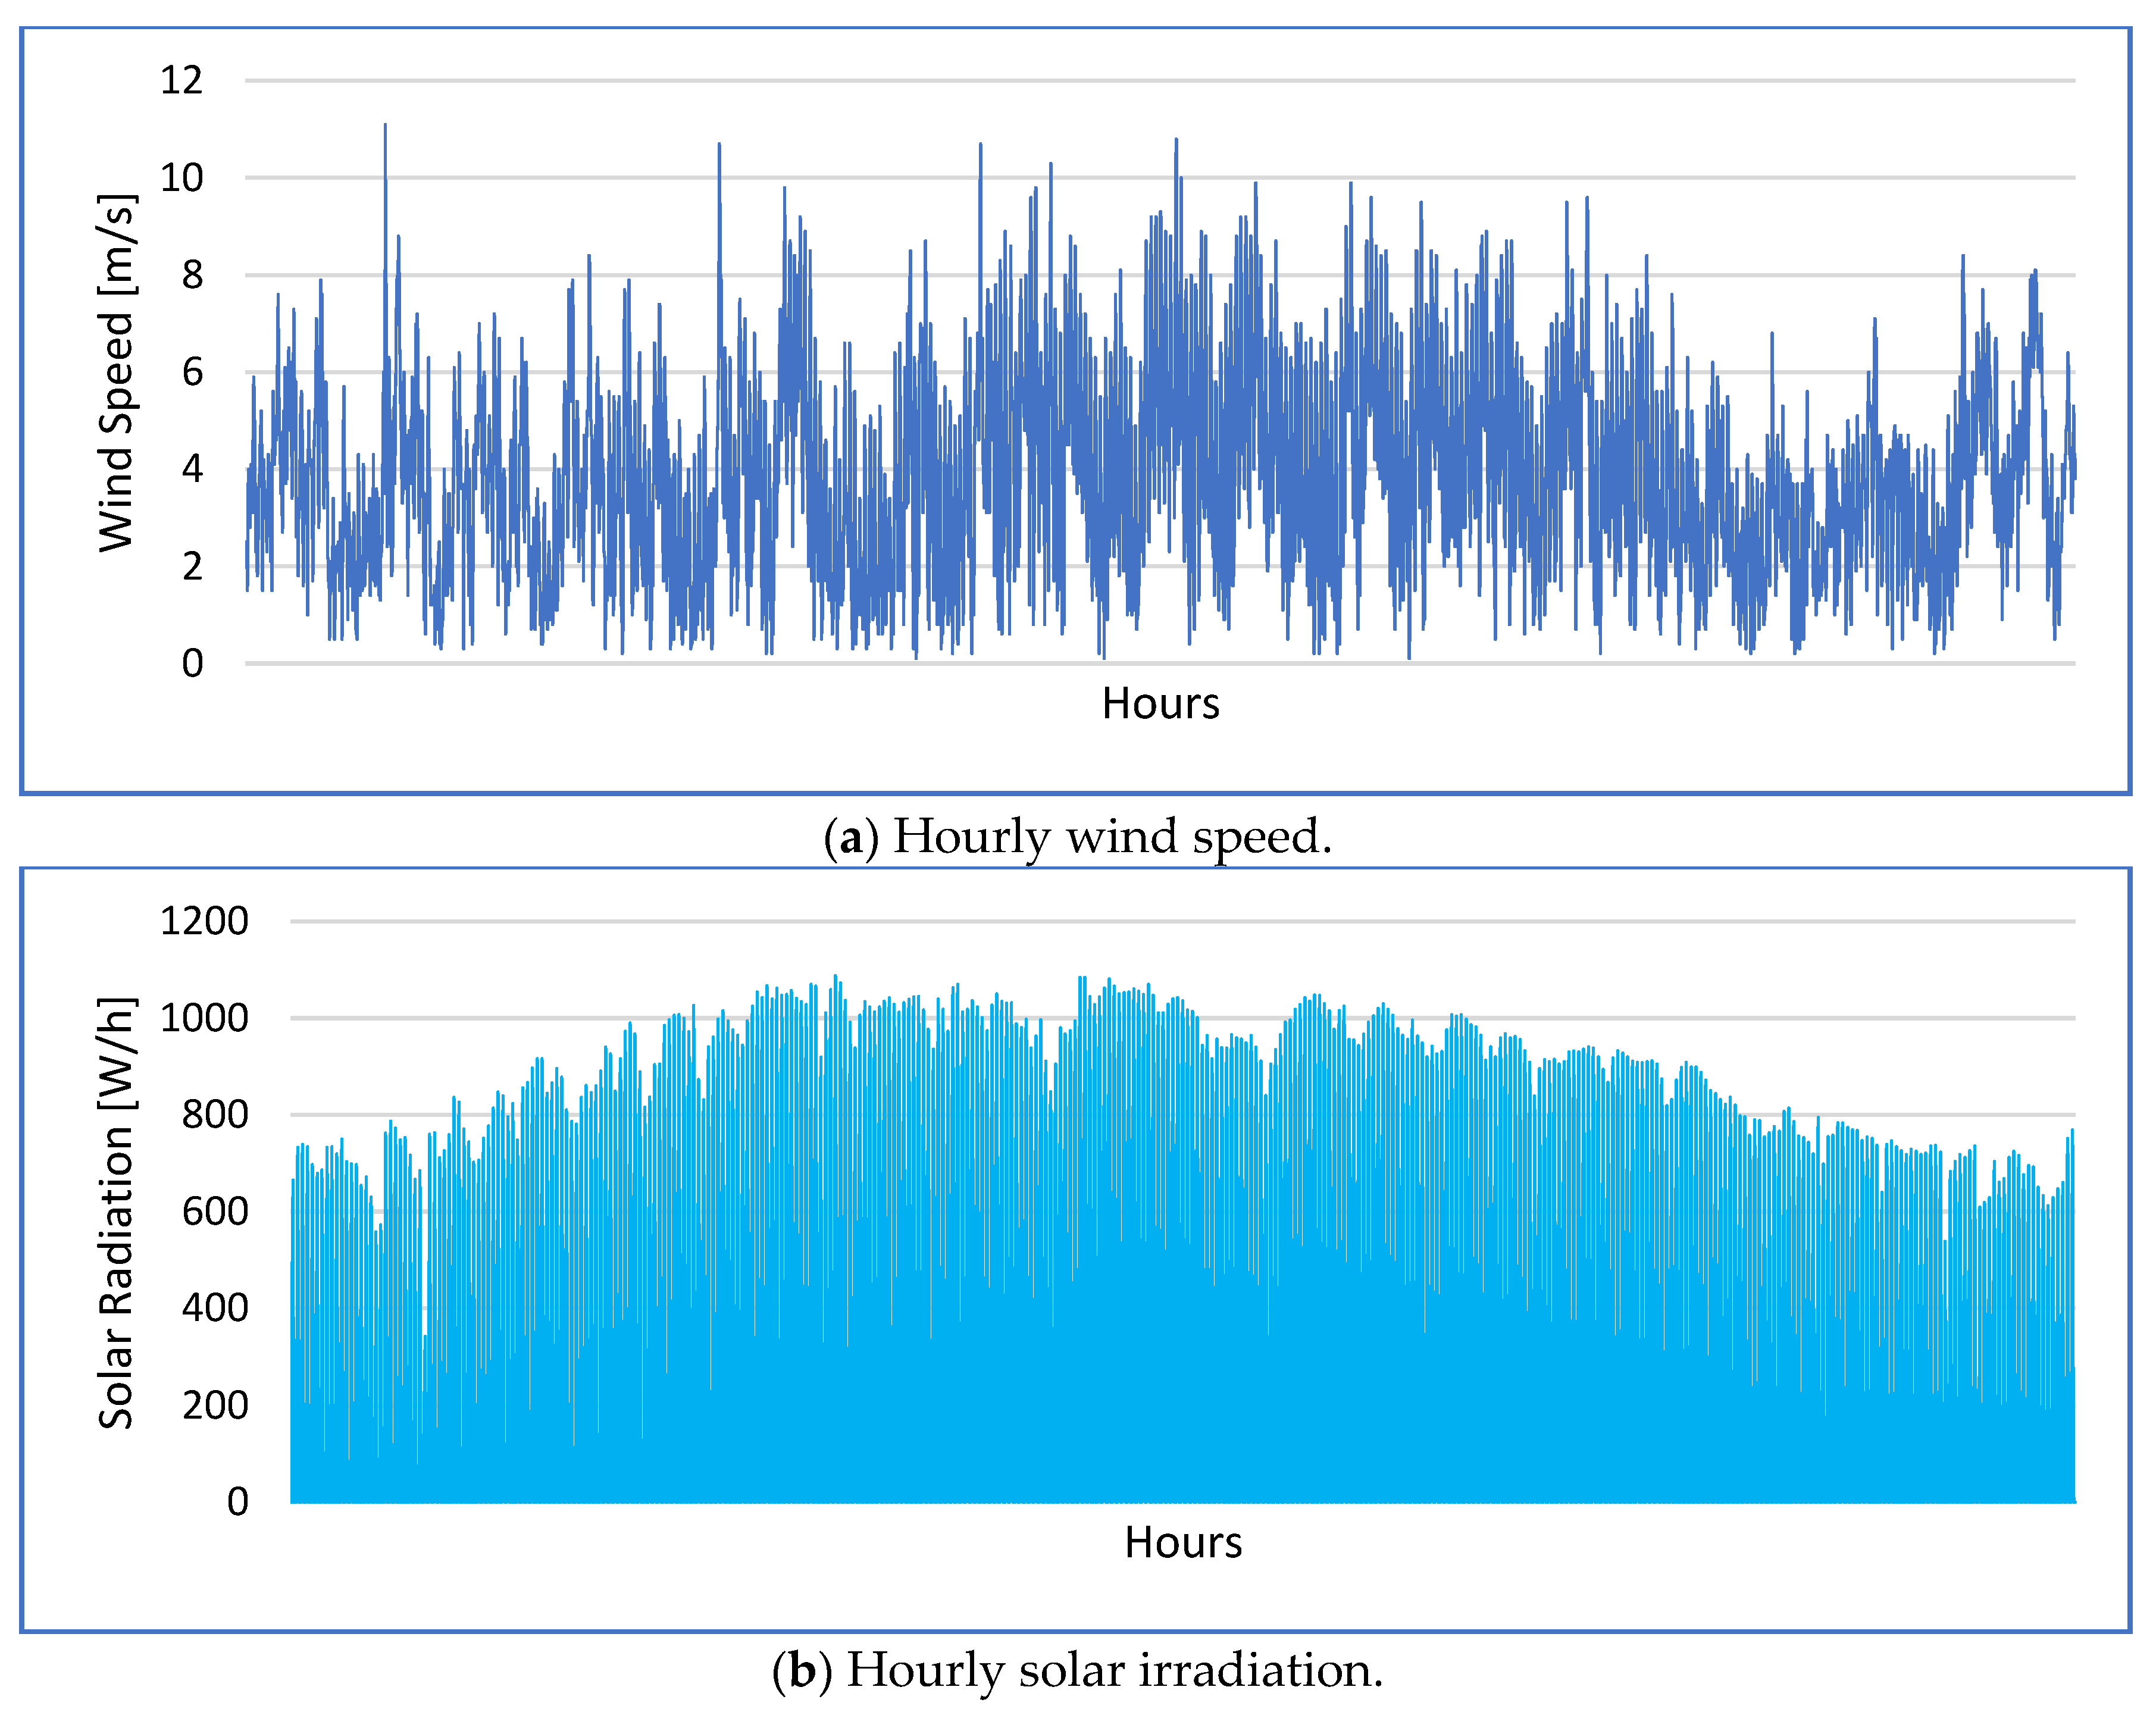
Yanbu is an industrial city in western Saudi Arabia, which has ample renewable energy resources. Yanbu is located at a latitude of 24°05′20″ North and a longitude of 38°03′49″ in the coastal area of the Red Sea [86,87]. Therefore, it is chosen as the case study region for demonstrating the proposed optimization approach. Based on previous research works, the average annual wind speed of 3.53 m/s and solar irradiation of 5.95 kWh/m2/day [88] are used in the problem formulation. Real weather data for Yanbu are utilized in the optimization process. The temperature in Yanbu ranges from 15 °C to 40 °C, with an average annual temperature of approximately 29 °C. The per-hour wind speed and solar irradiation data are illustrated in Figure 7a,b, respectively [86,87,88].
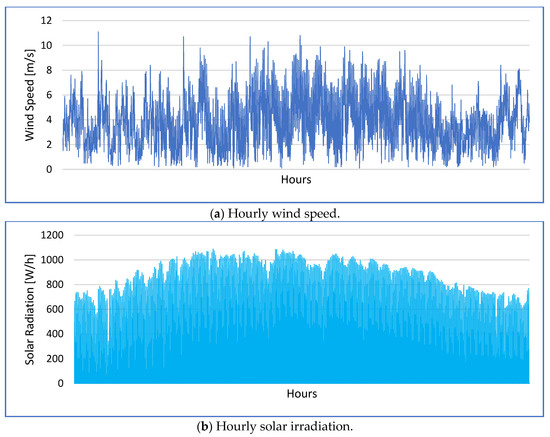
Figure 7.
Hourly data for the microgrid.
5.1. Investigated Cases
In this paper, twelve different cases are investigated. The lower and upper range of values for PV, NWT, NDiesel, and NAD are considered as [15, 45], [0, 10], [1, 4], and [1, 5], respectively. The first six cases investigate a microgrid of 5 houses whilst the remaining six cases investigate a microgrid of 10 houses. A summary of the investigated cases is given in Table 1. CASE 1.0 and CASE 2.0 represent the basic cases where neither uncertainty nor degradation is considered. In CASE 1.1 and CASE 2.1, uncertainty is taken into consideration, with 10% of load uncertainty at 1000 h per year. In CASE 1.2 and CASE 2.2, the same load uncertainty is considered at 2000 h per year. In CASE 1.3 and CASE 2.3, the effect of battery degradation is considered and investigated. CASE 1.4 and CASE 1.5 are similar to CASE 1.1 and CASE 1.2, and the effect of battery degradation is taken into consideration. Likewise, CASE 2.4 and CASE 2.5 are similar to CASE 2.1 and CASE 2.2 considering, in addition to the load uncertainty, the effect of battery degradation.

Table 1.
Summary of the investigated cases in this paper.
All simulations, modeling, and experiments are conducted using MATLAB commercial software on a personal computer with an Intel Core i7-6500U CPU @ 2.50 GHz and 5 GB RAM. The hourly load profile of a single house over a one-year timespan is generated through eQuest, a building energy simulation software [89]. The profiles, which are monthly averaged, can be found in [32], and the economic parameters of the HMS are listed in Table 2.

Table 2.
Economic parameters of the HMS [30].
5.2. Five Houses’ Cases
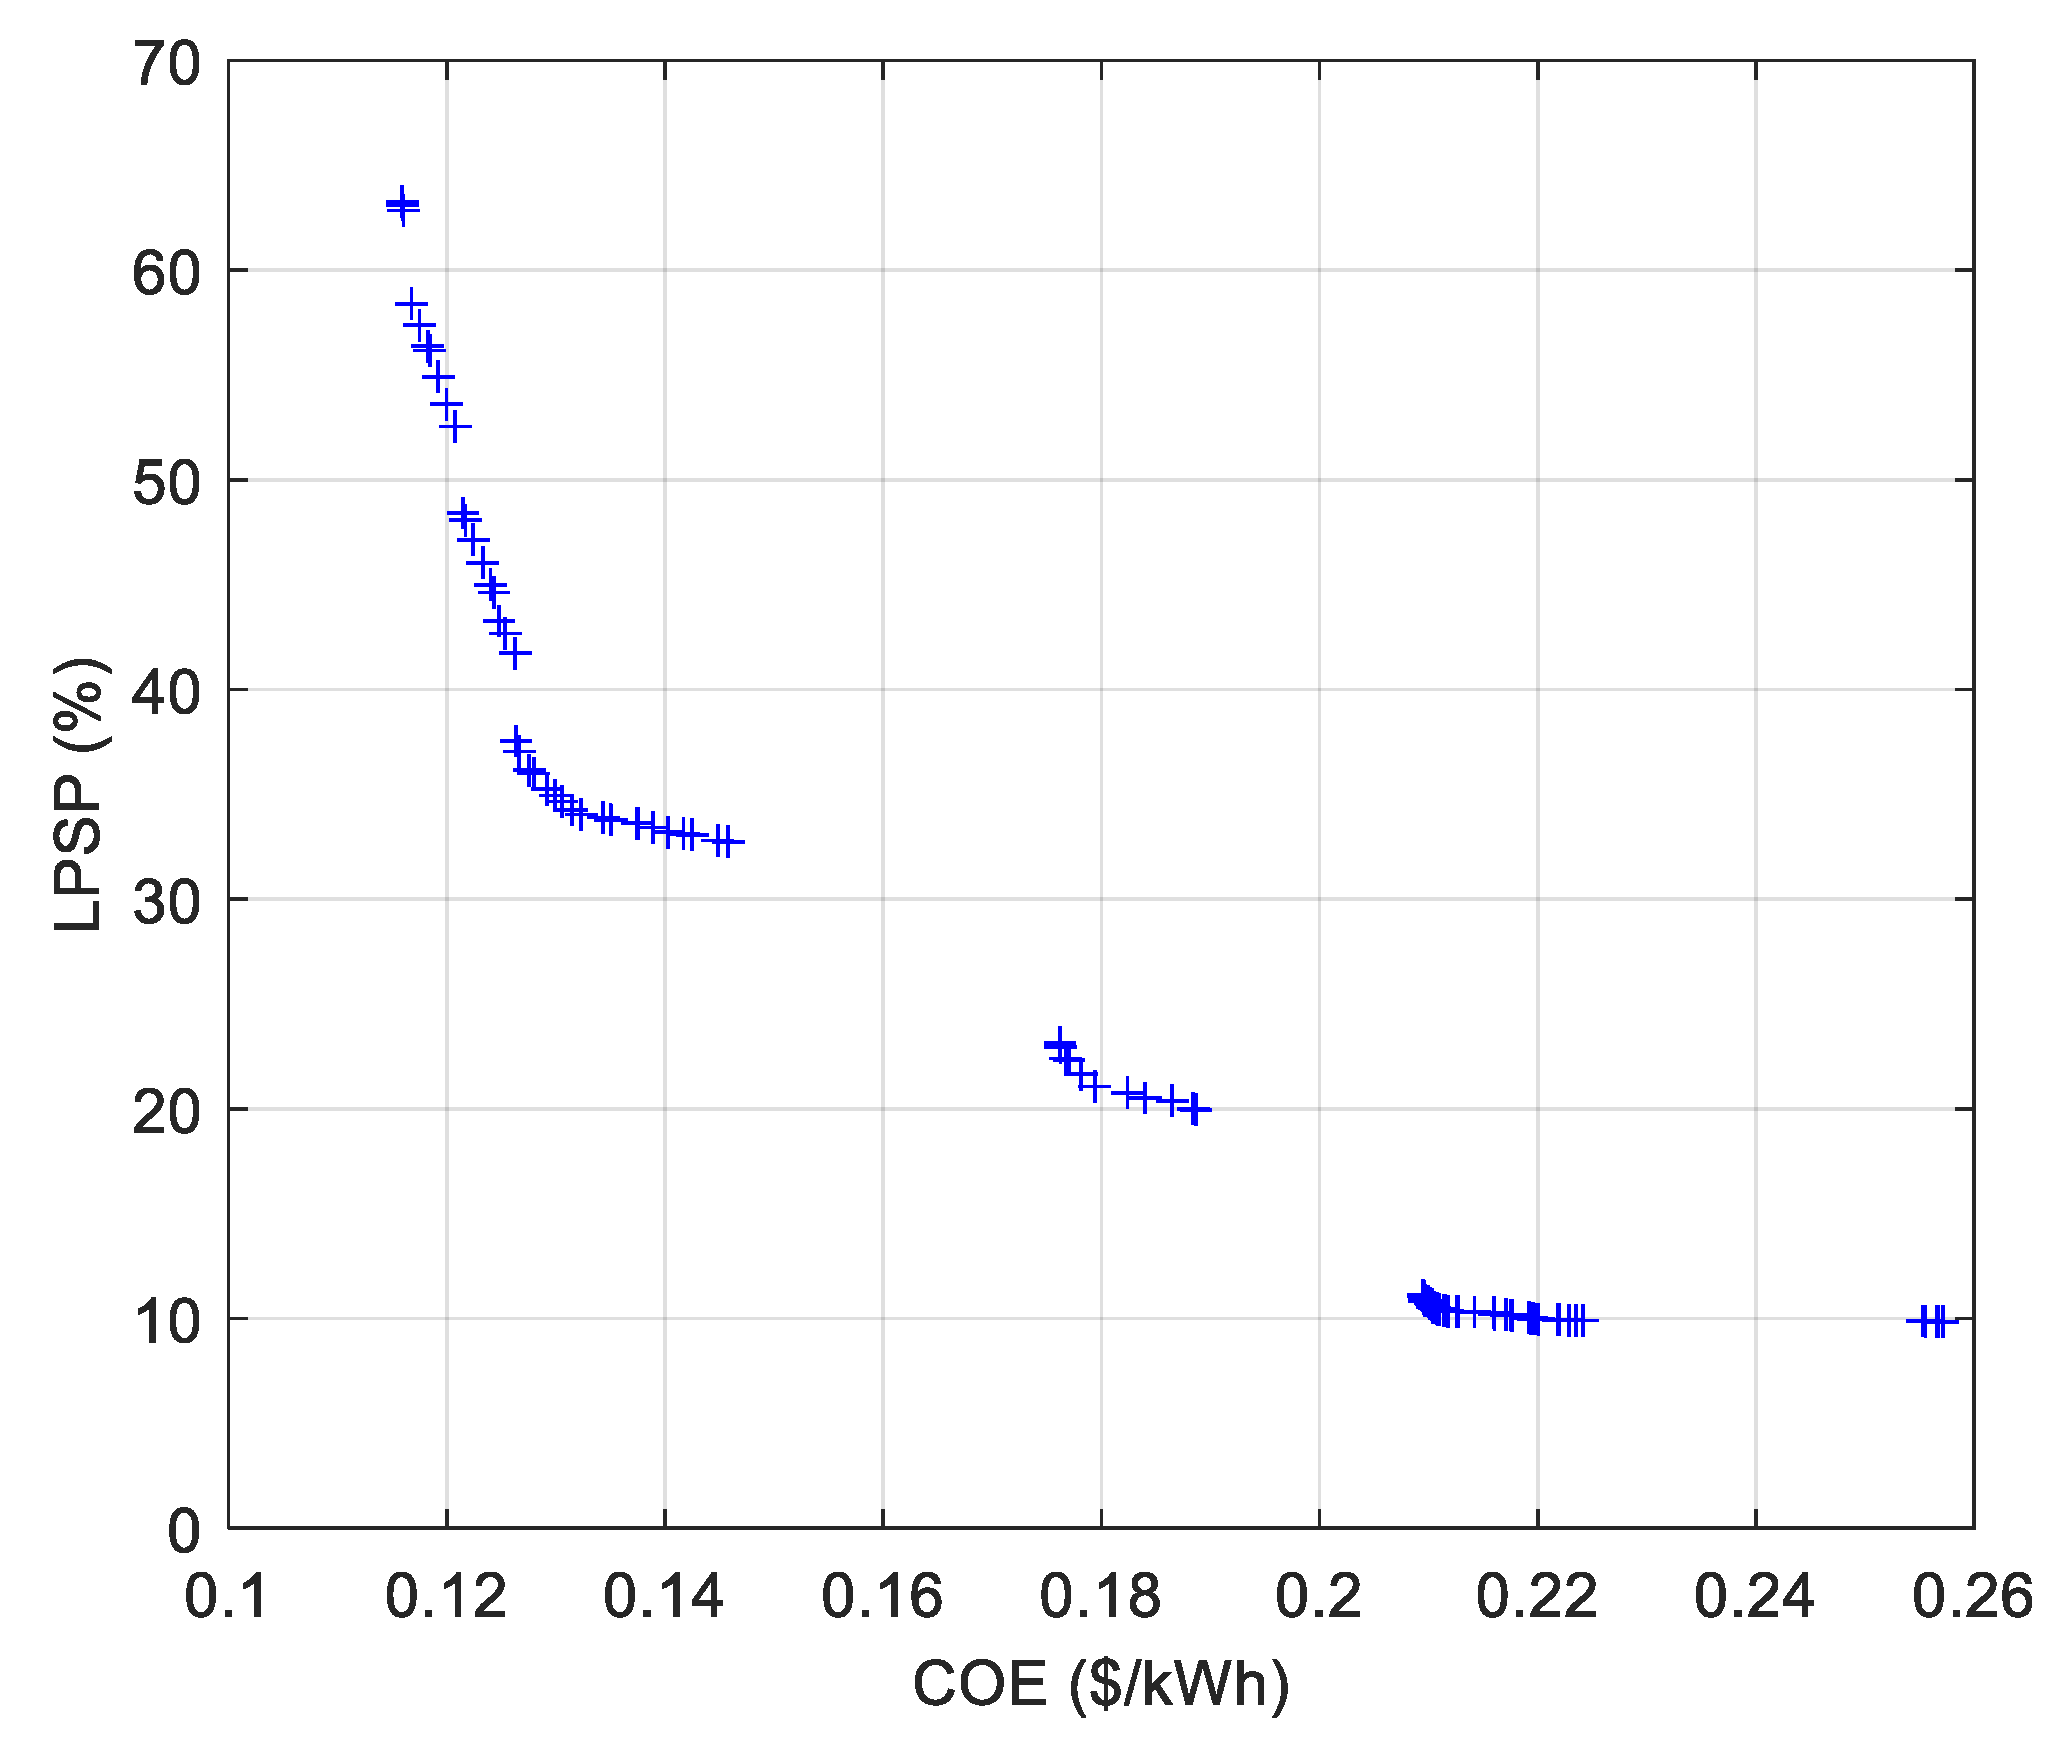
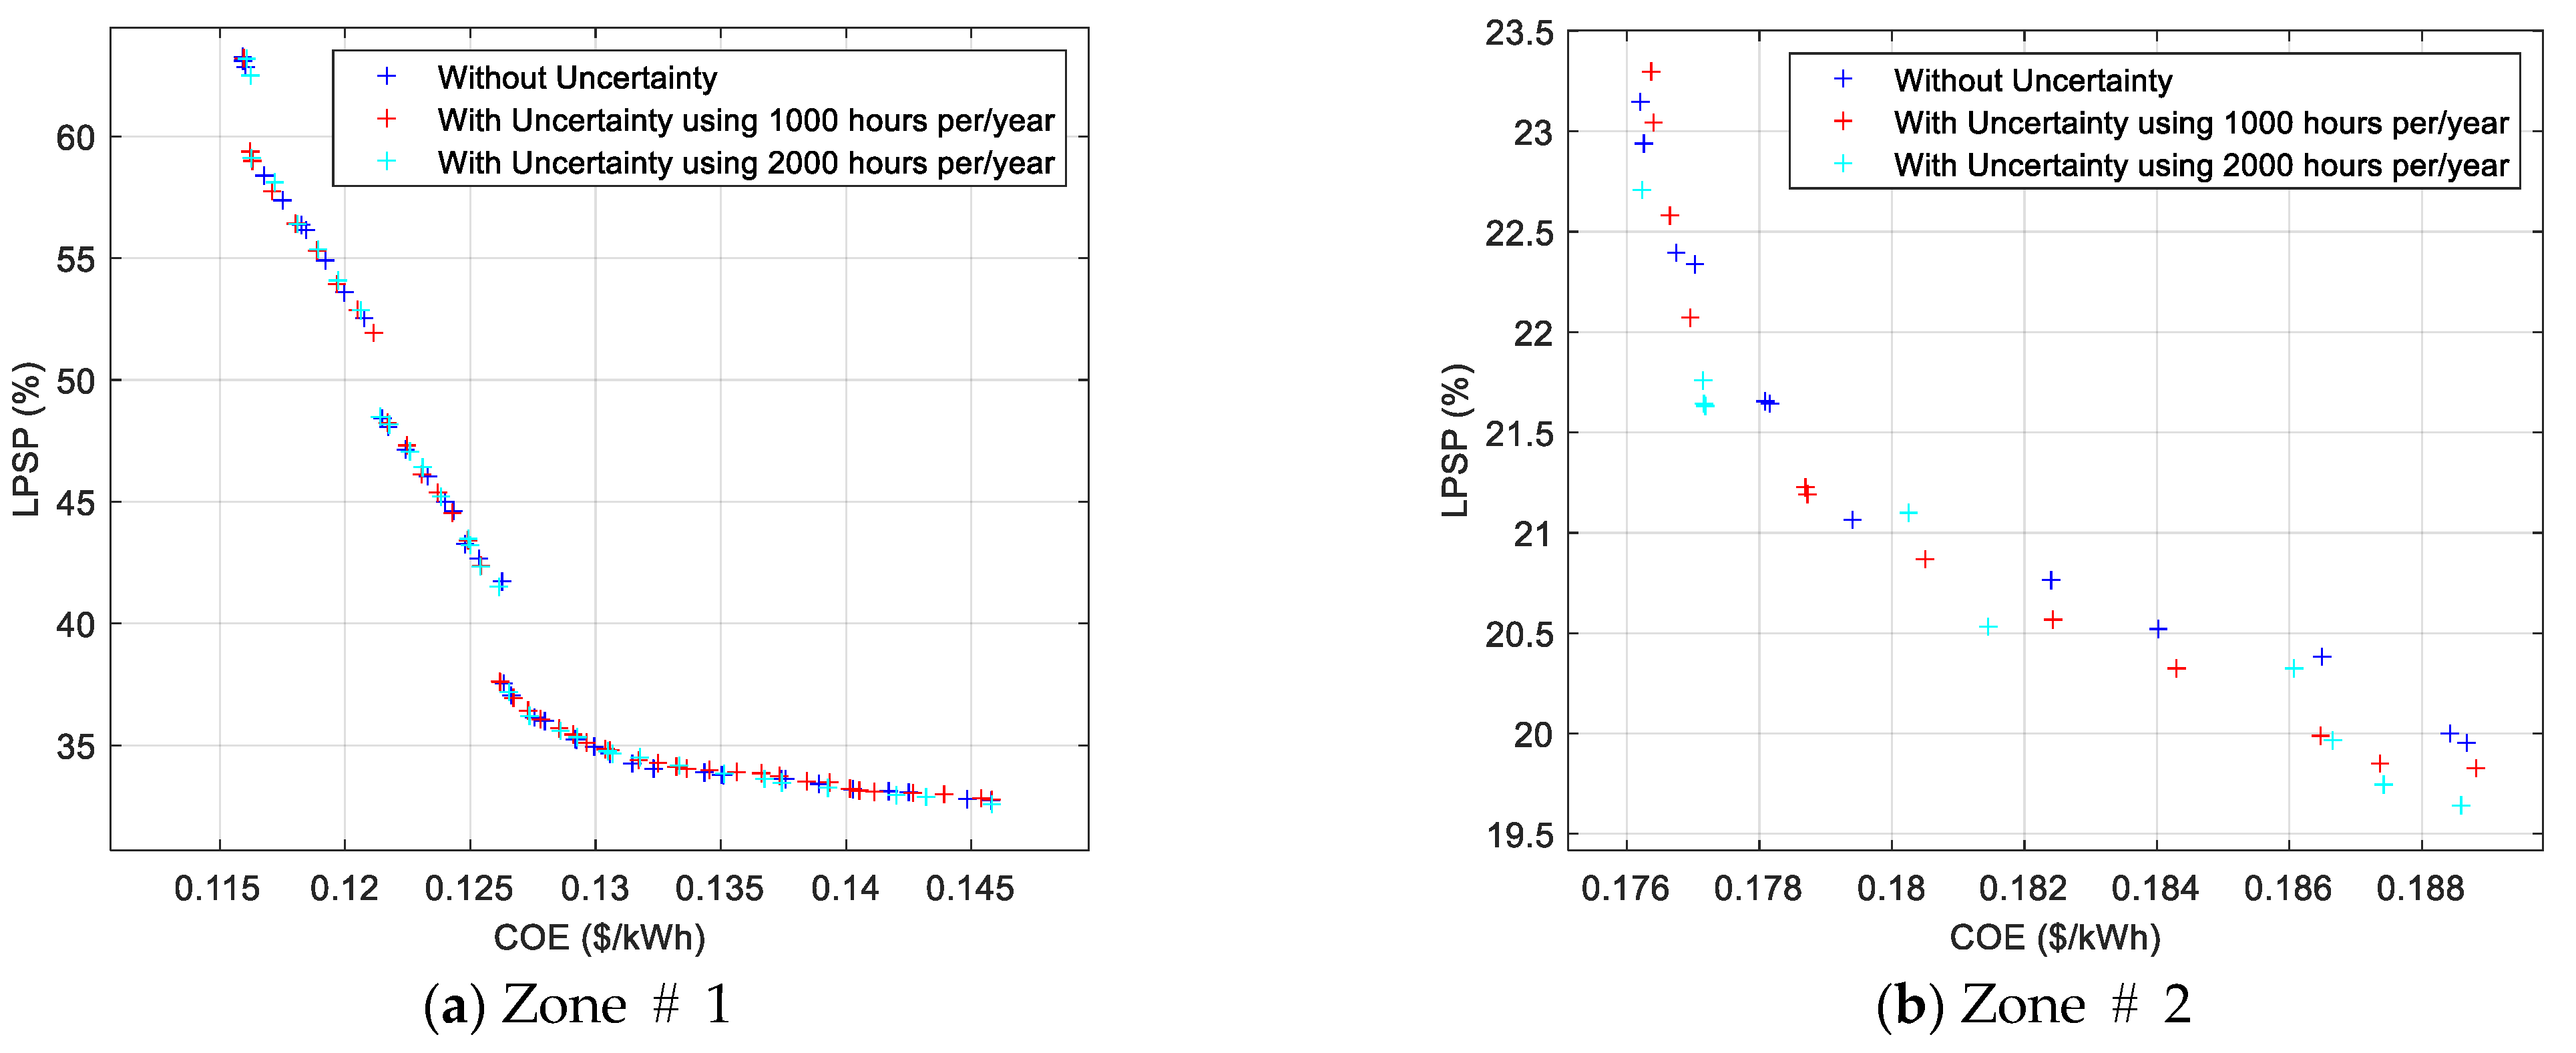
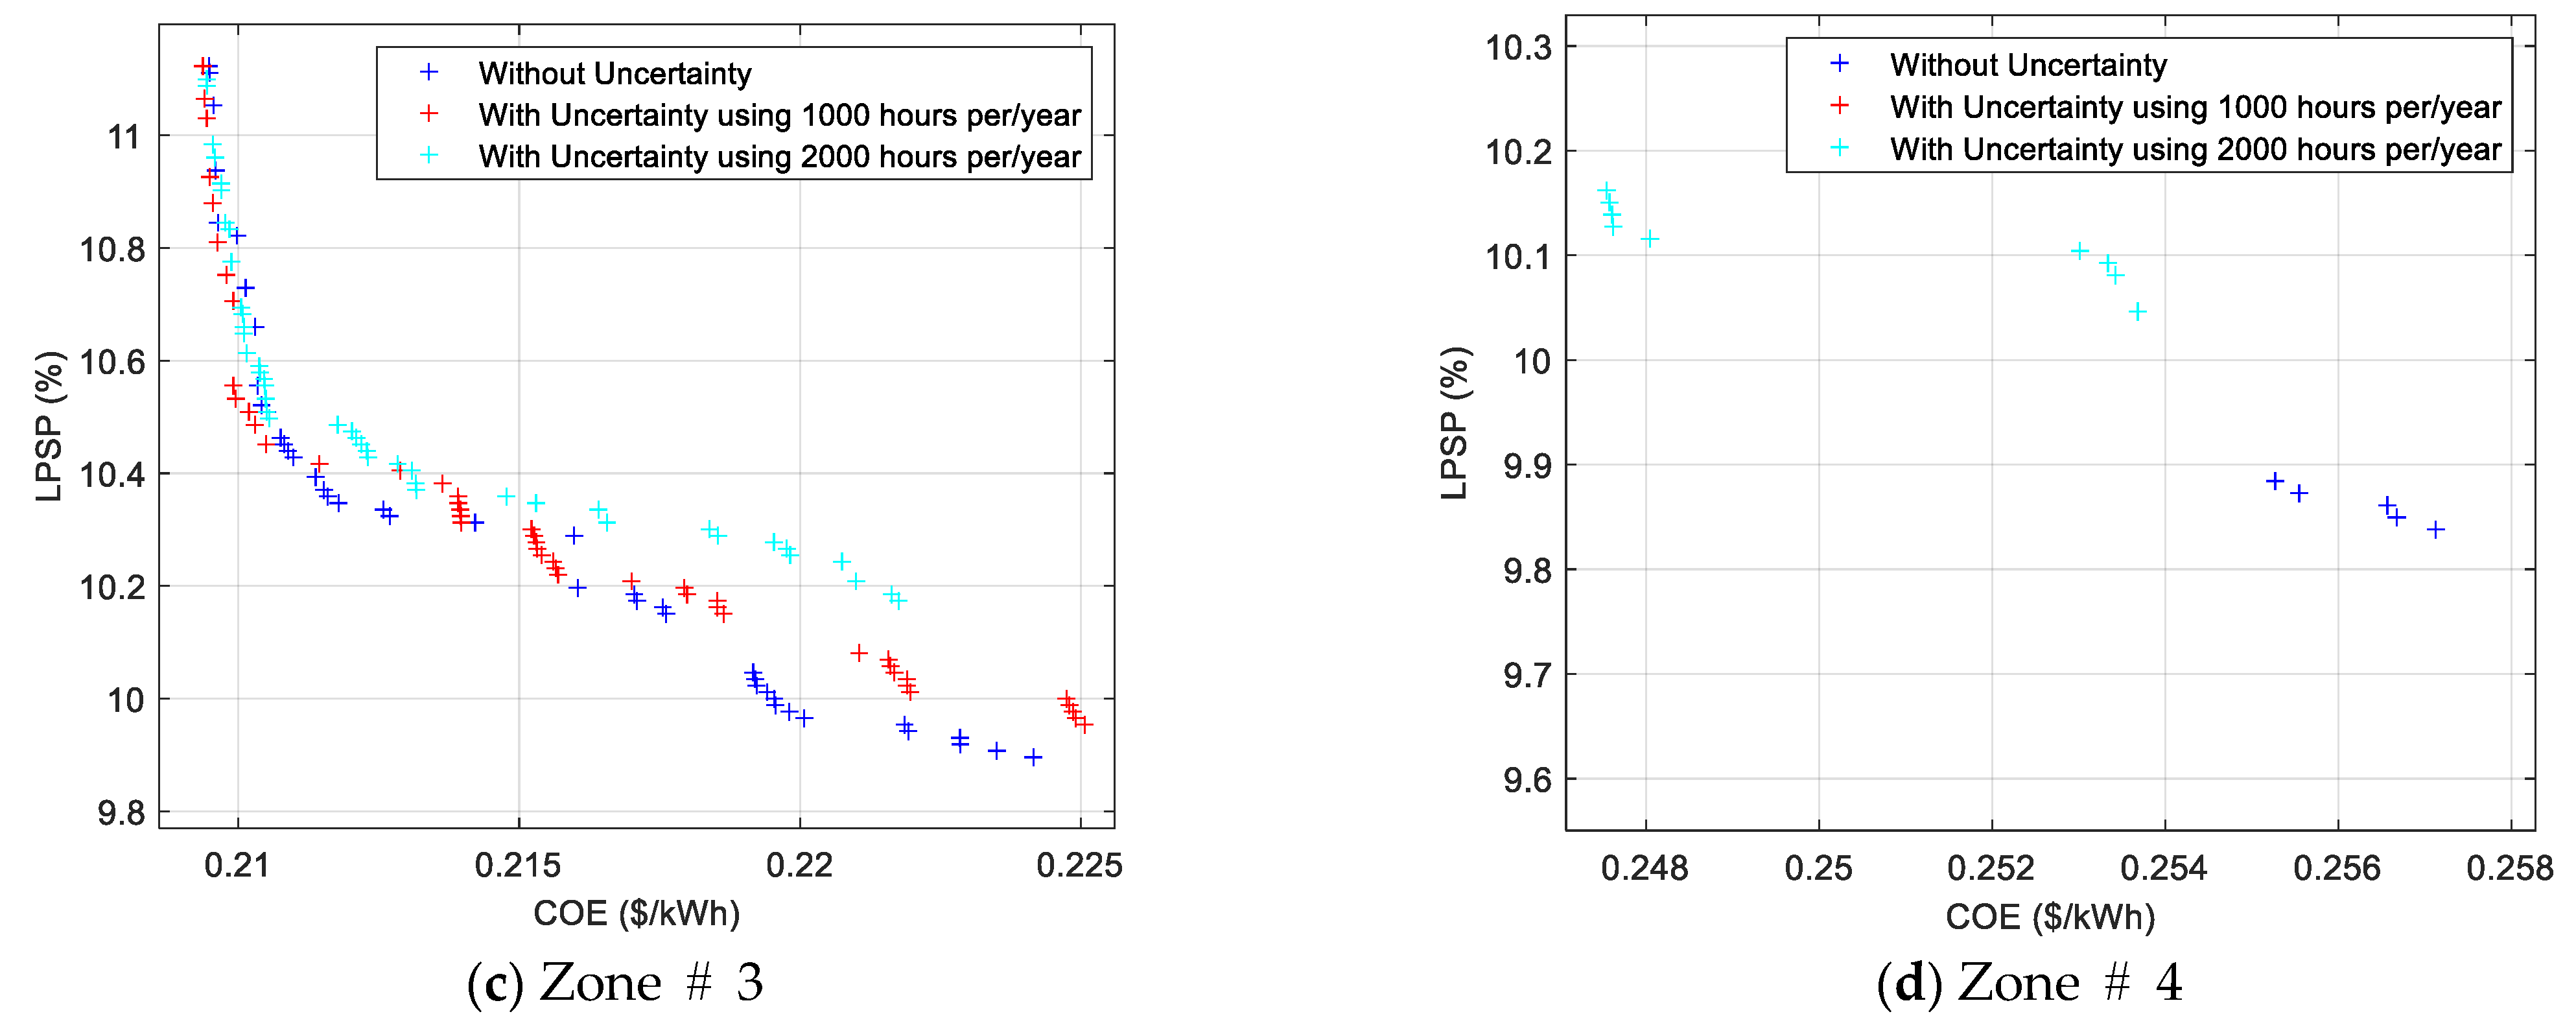
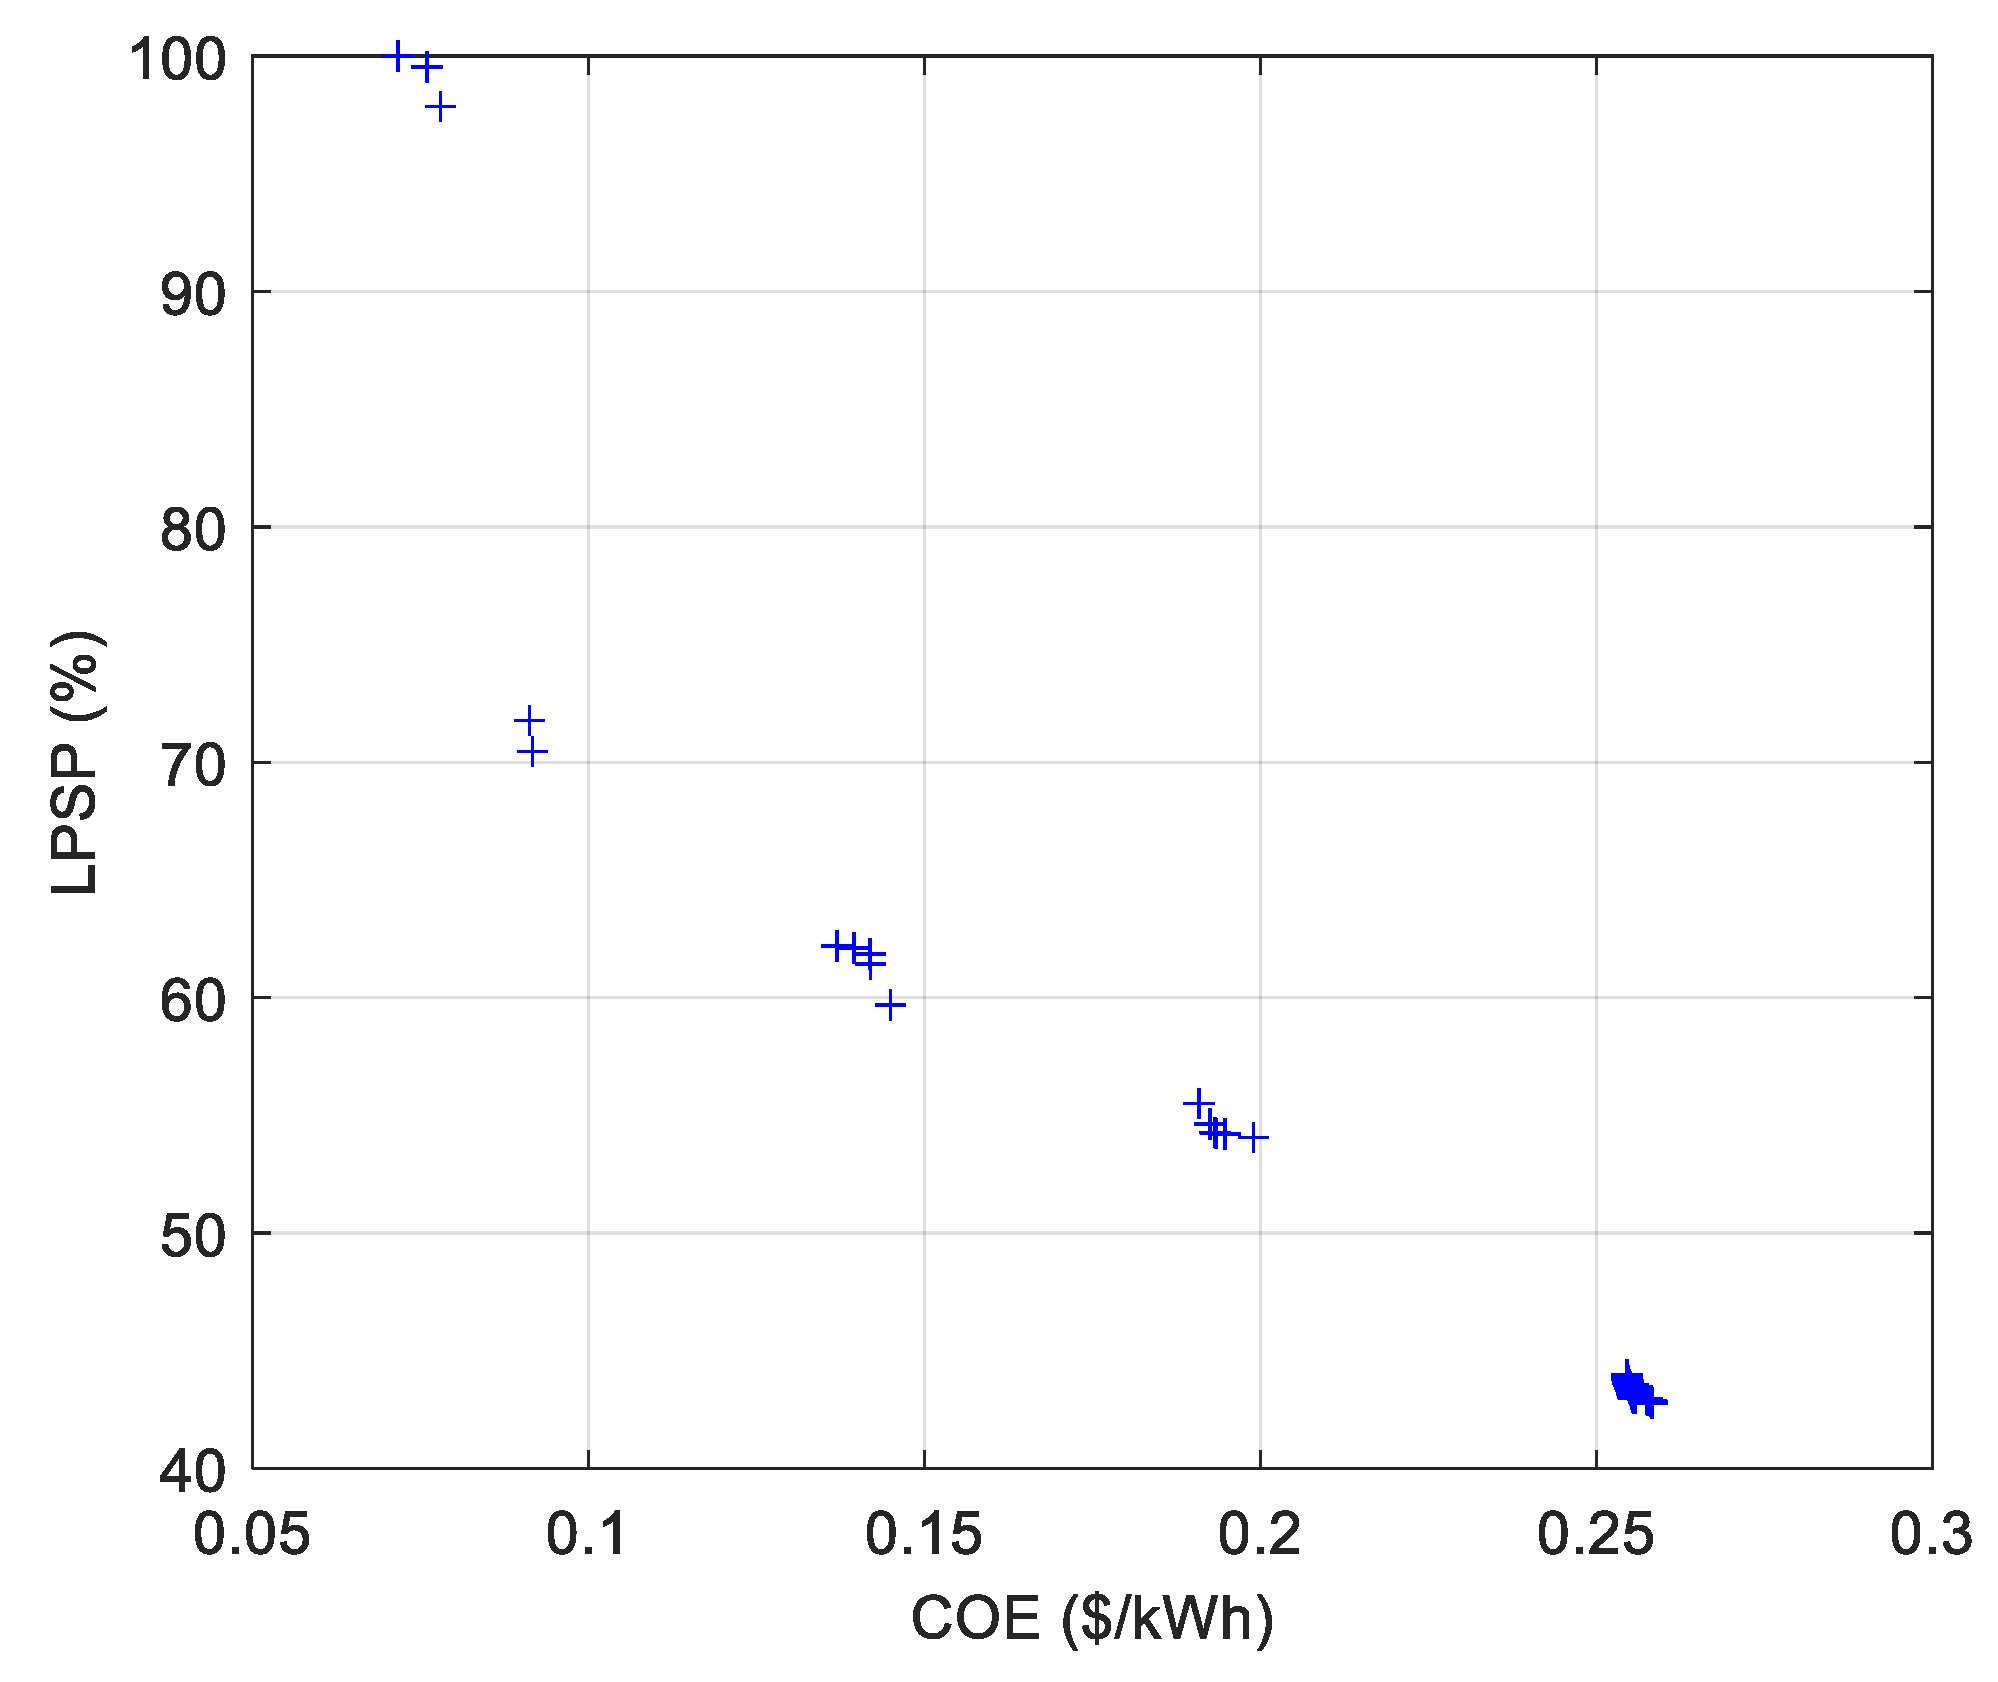
The proposed IMOEAD is applied to CASE 1.0 to CASE 1.5 by assuming a population of 100 candidates over 200 iterations. The PFs obtained for CASE 1.0 are represented in Figure 8. This front is composed of 100 solutions. It can be seen from Figure 8 that the obtained PF is not smooth (it can be decomposed into four small zones), which is mainly due to the discrete nature of some variables.
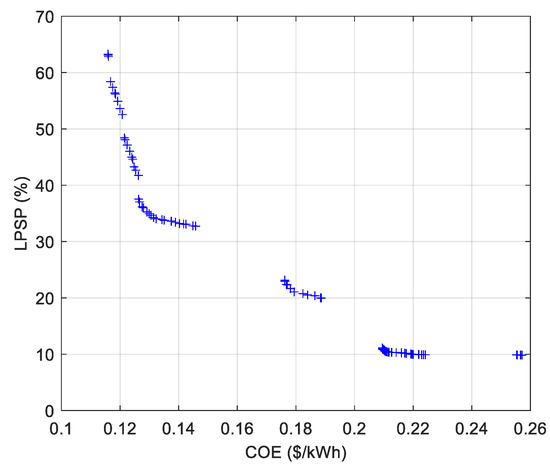
Figure 8.
The PF obtained for CASE 1.0 using the proposed IMOEAD approach.
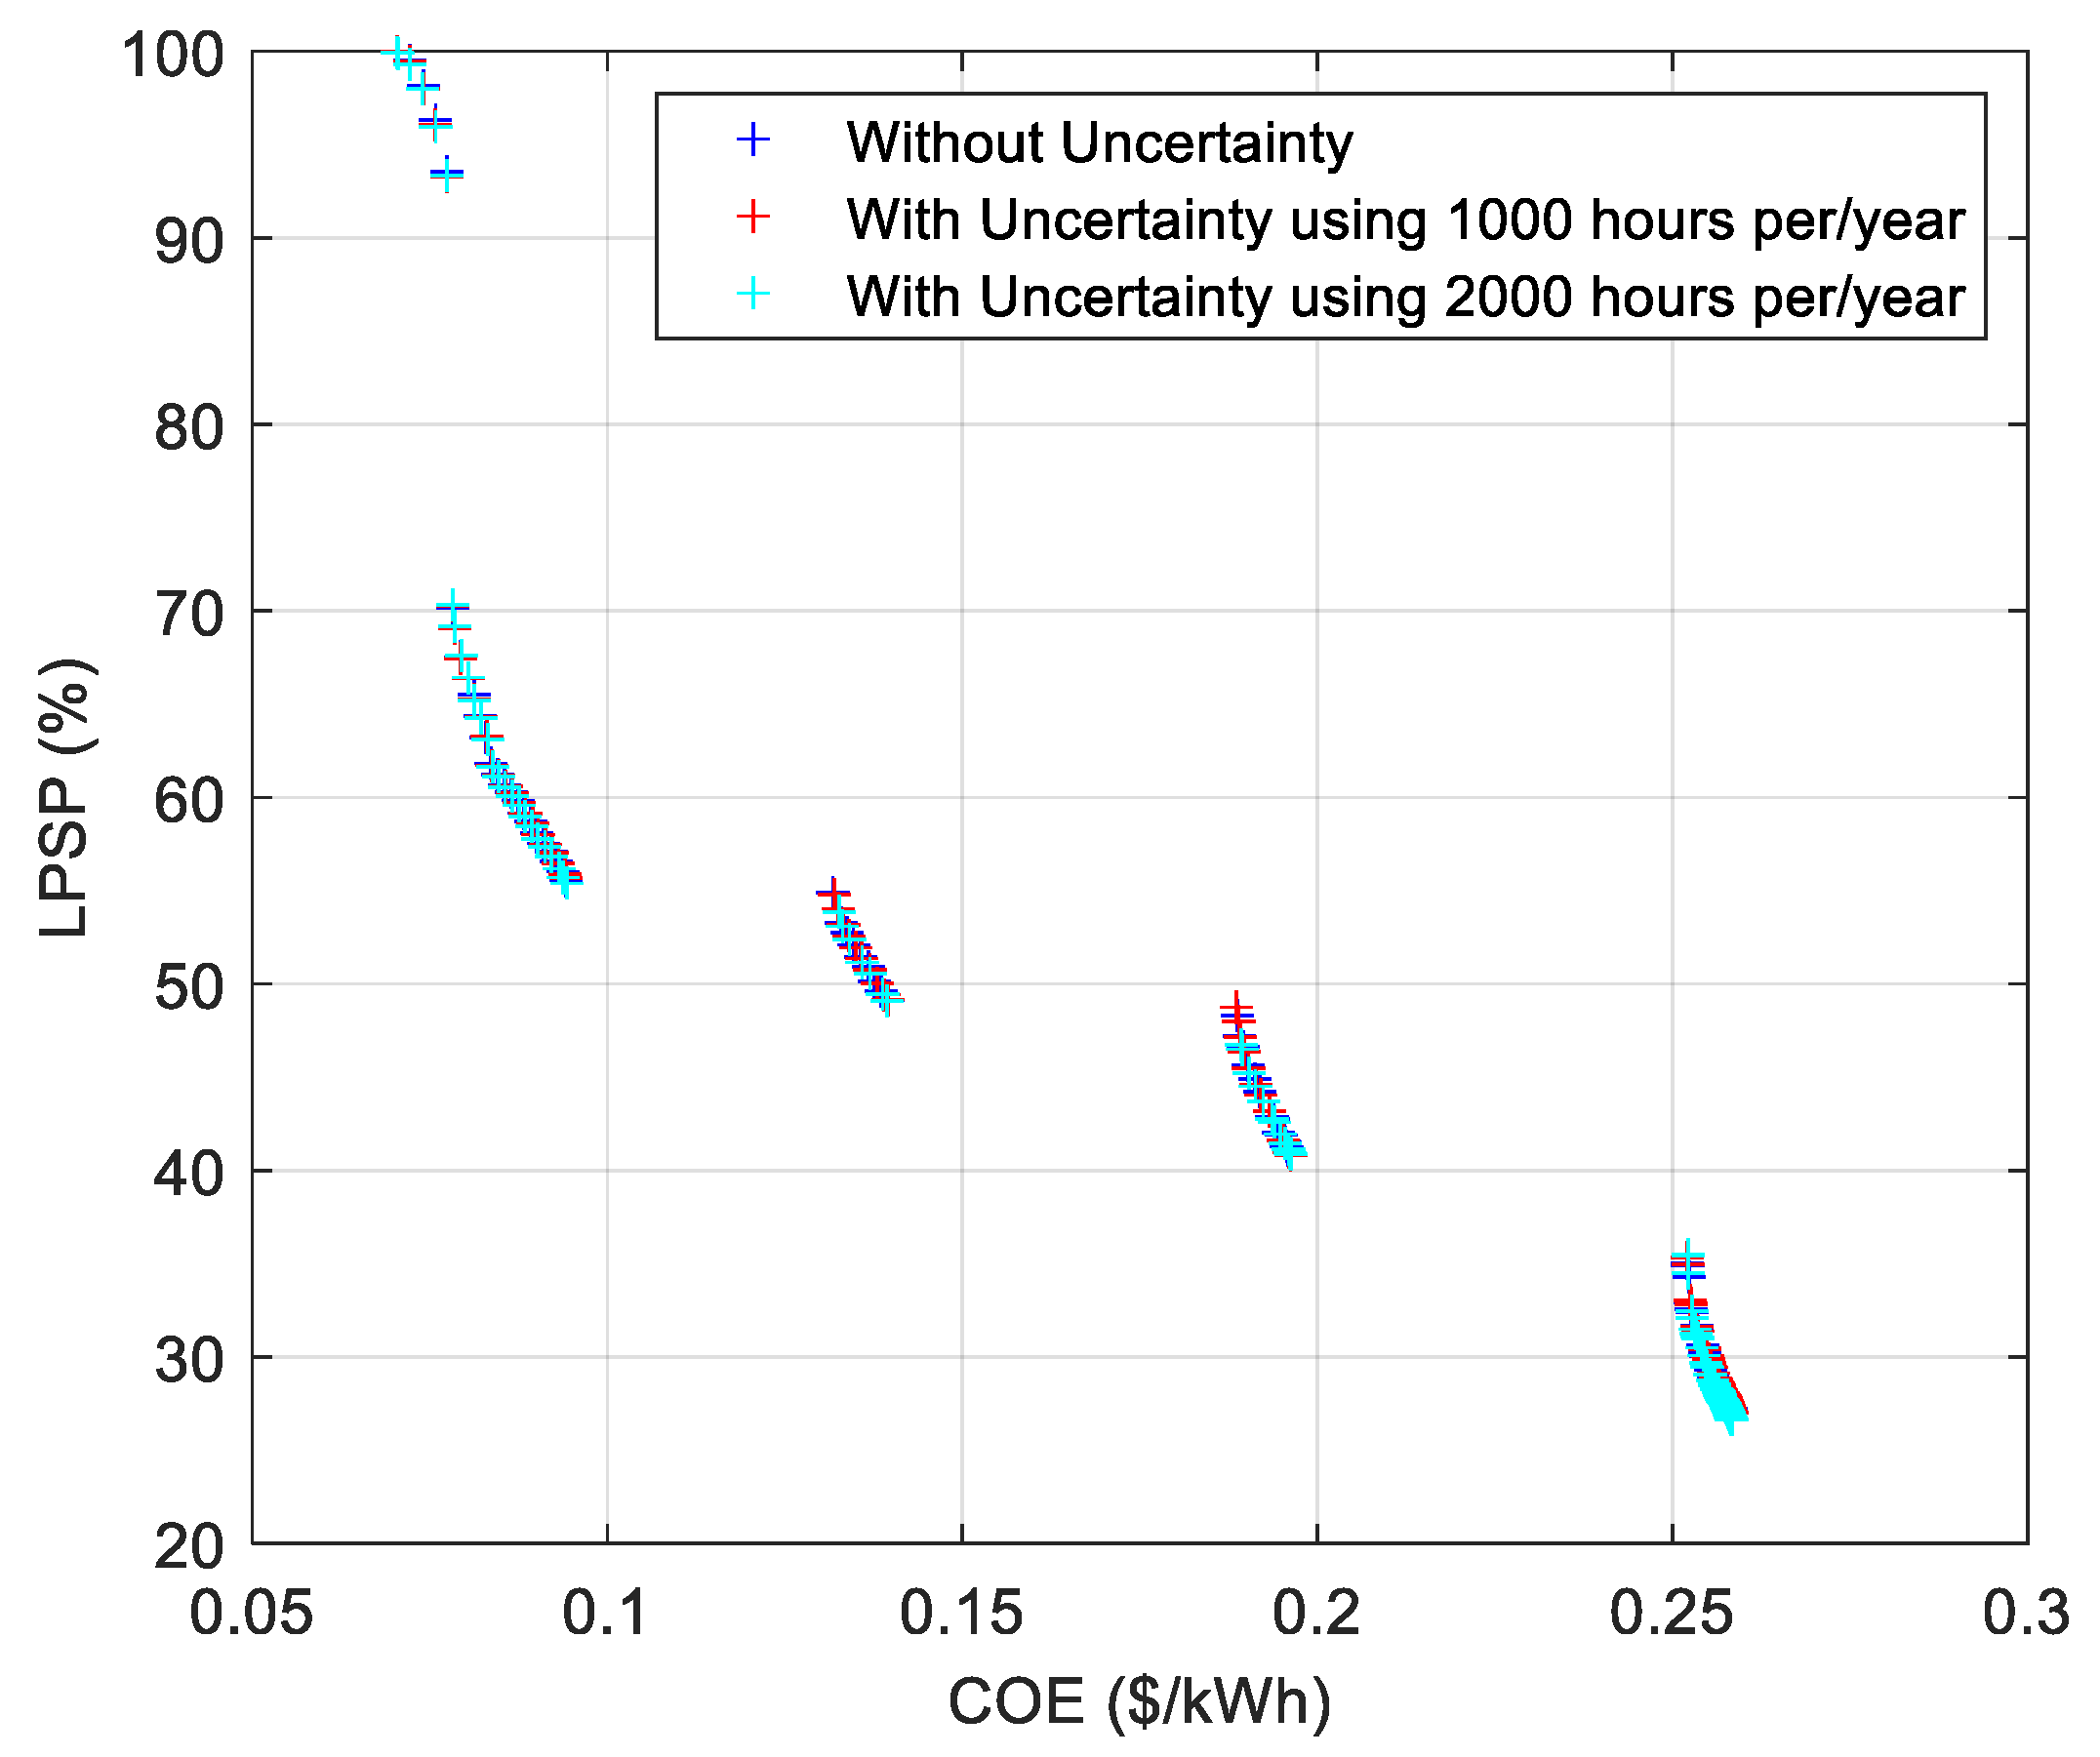
The resulting fronts for CASE 1.0, CASE 1.1, and CASE 1.2 are partitioned into four zones, and a magnified view of each zone is presented separately in Figure 9. The first zone shows similar results for the three cases. However, in the remaining zones, the results are different with and without considering the issue of uncertainty. It is worth mentioning that the IMOEAD obtains 100, 102, and 95 solutions for CASE 1.0, CASE 1.1, and CASE 1.2, respectively.
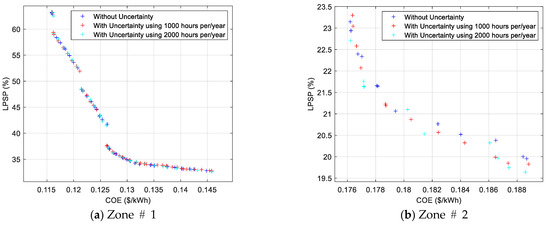
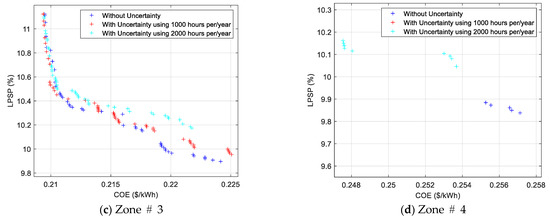
Figure 9.
Zoom on the PFs obtained for CASE 1.0, CASE 1.1, and CASE 1.2 using the proposed approach.
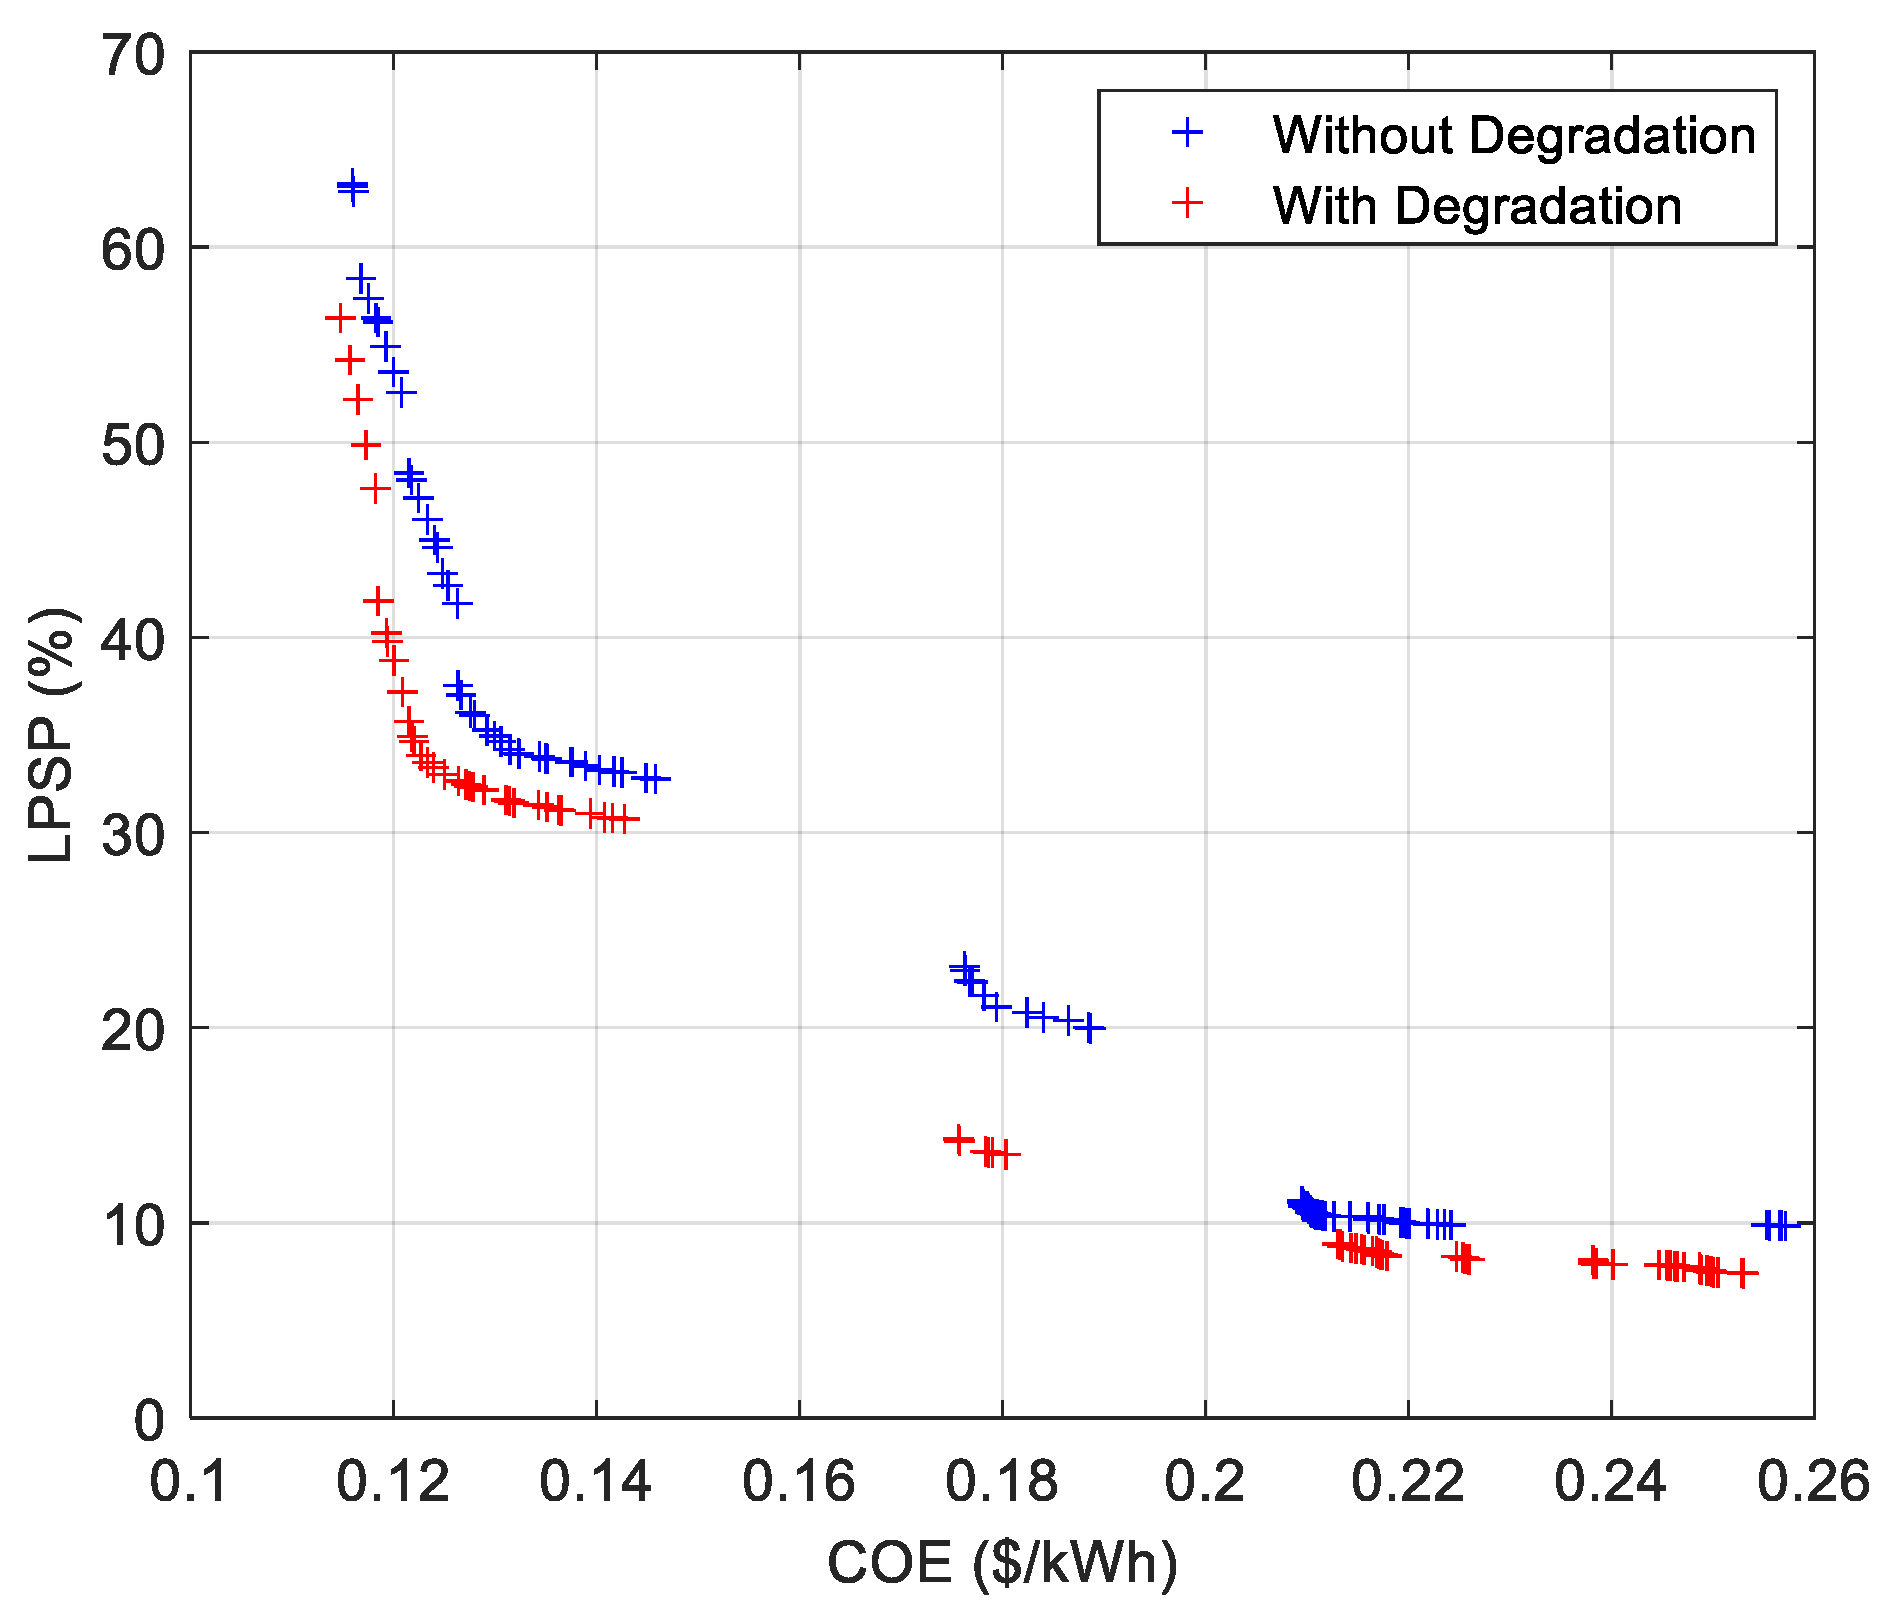
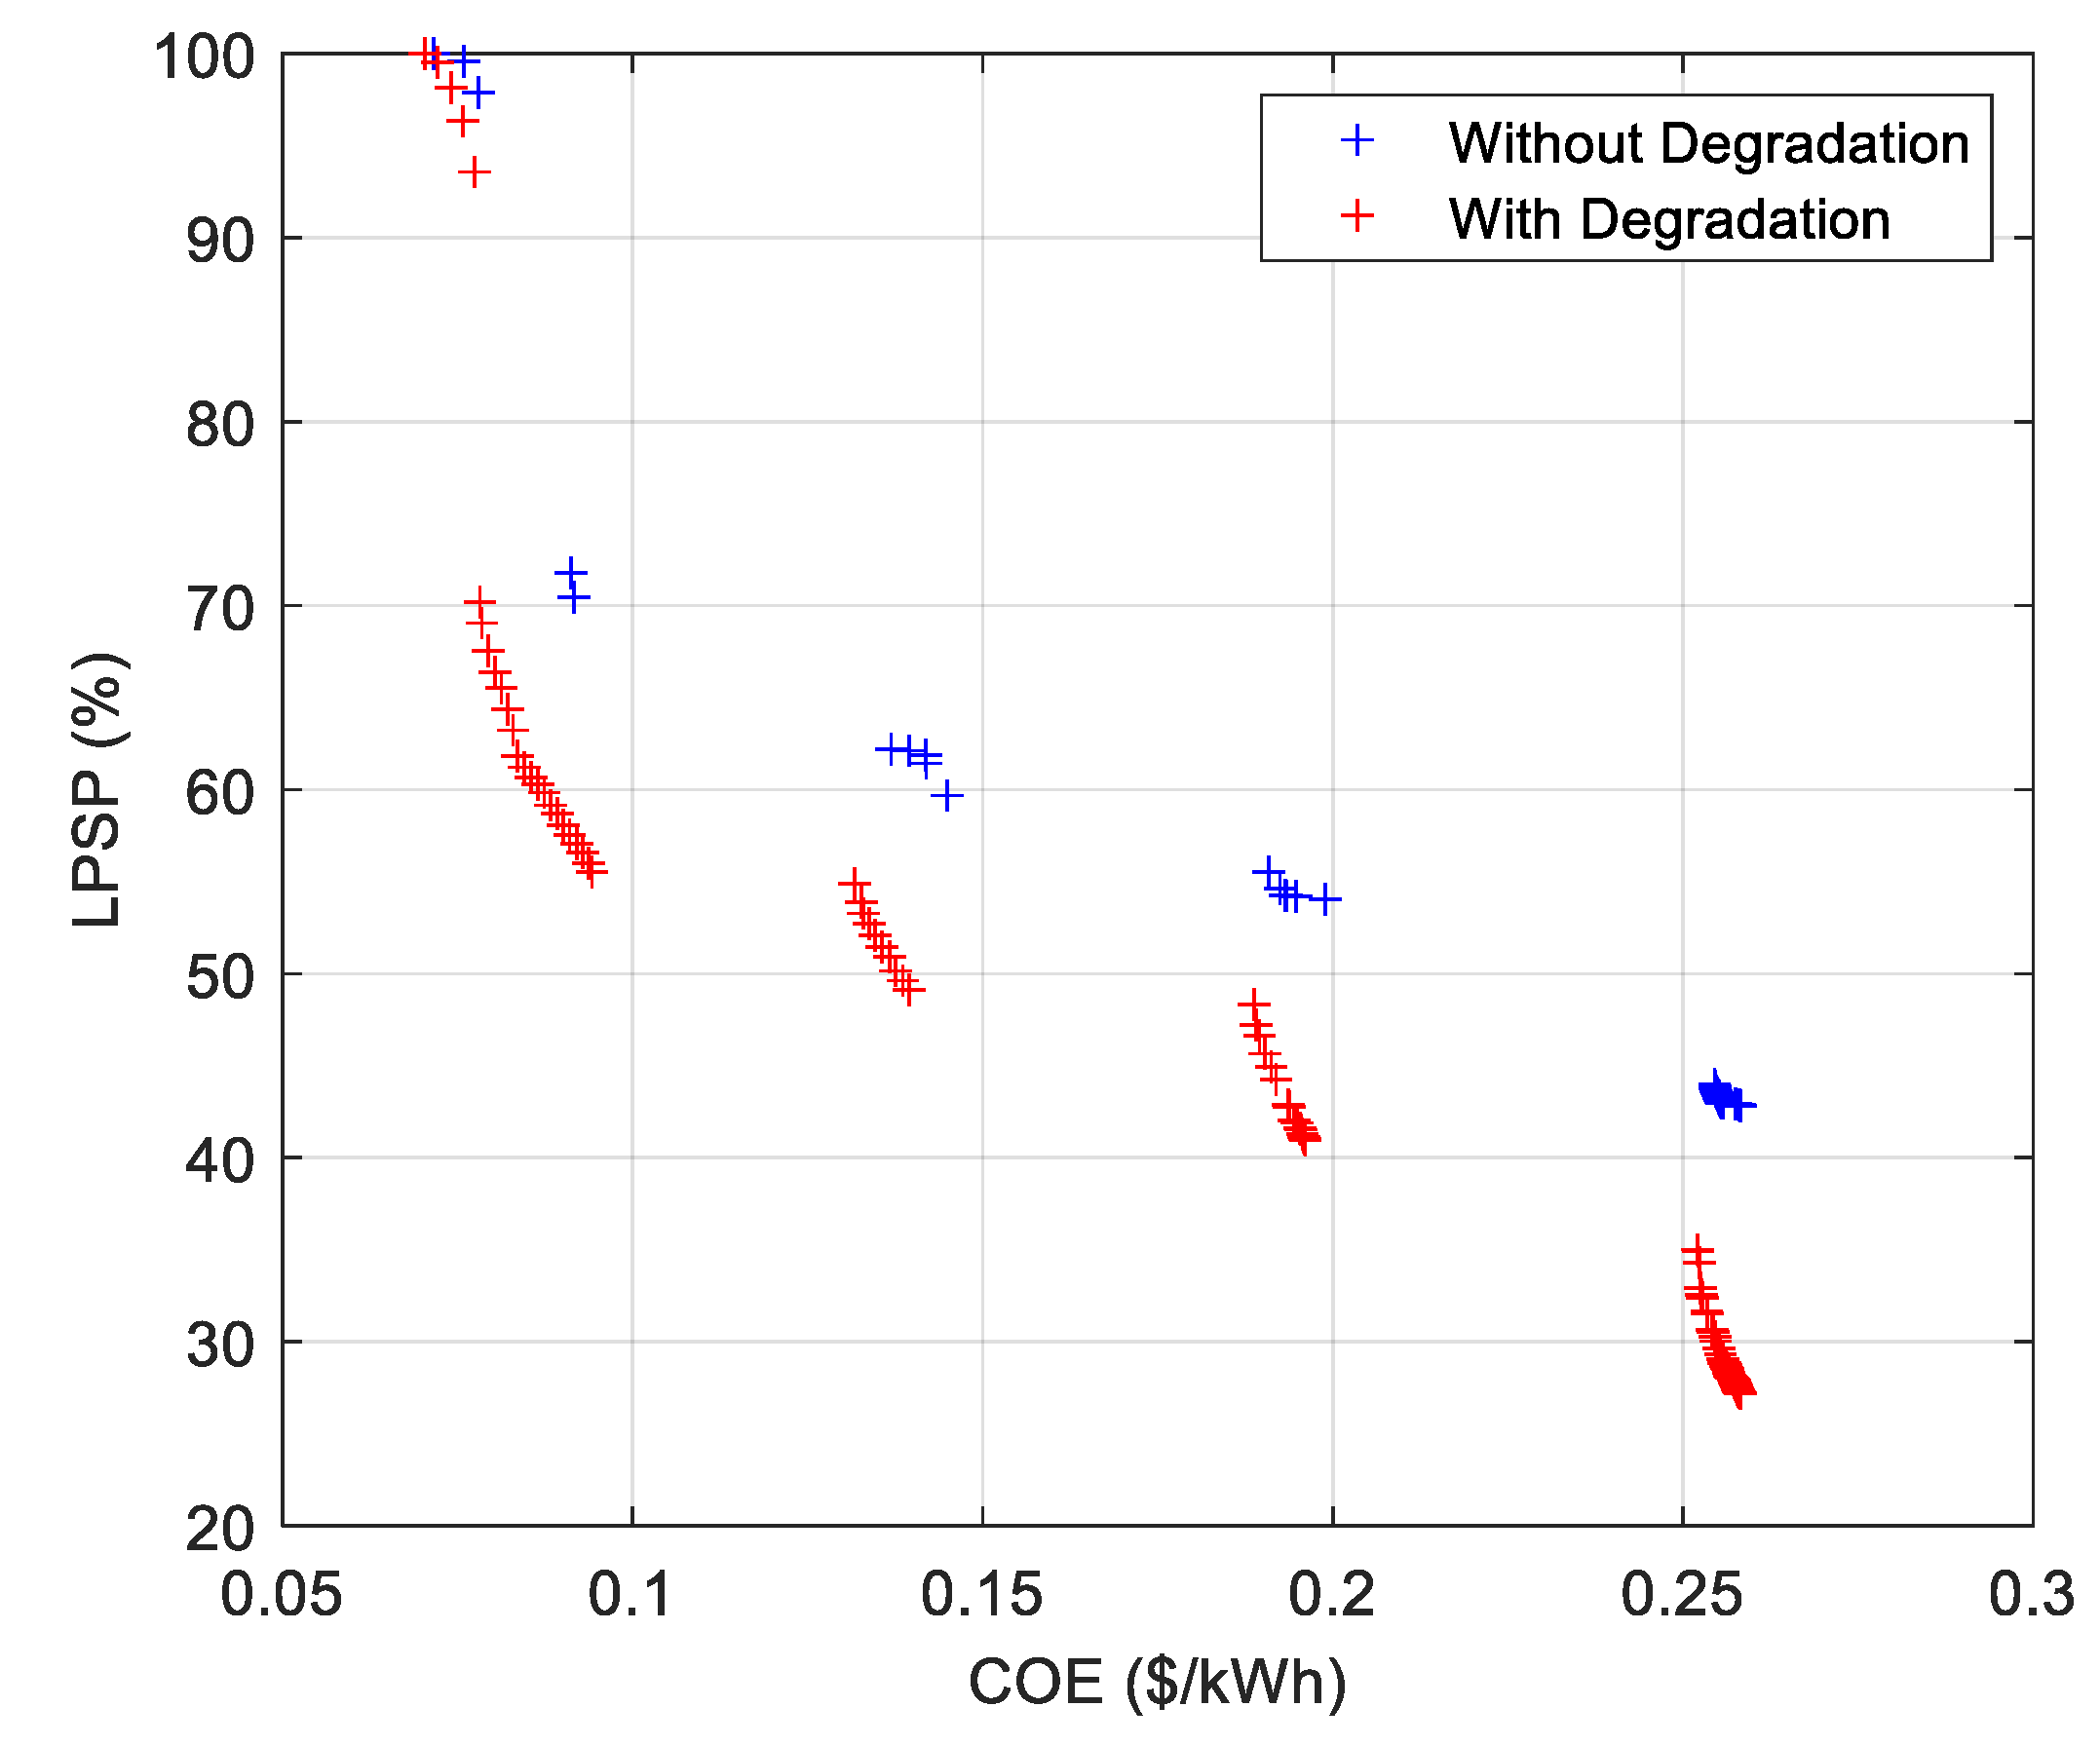
The PF obtained in the case considering no degradation in the batteries (i.e., in CASE 1.0, which is composed of 100 solutions) is compared to the PF obtained in the case considering degradation in the batteries (i.e., CASE 1.3, which is composed of 106 solutions) in Figure 10. There is a clear effect of battery degradation on the quality of the solutions, which is expected in real life.
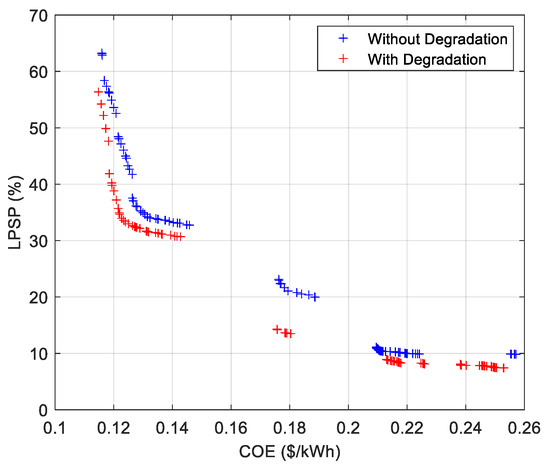
Figure 10.
Comparison between the PF obtained for CASE 1.0 and CASE 1.3 using the proposed IMOEAD approach.
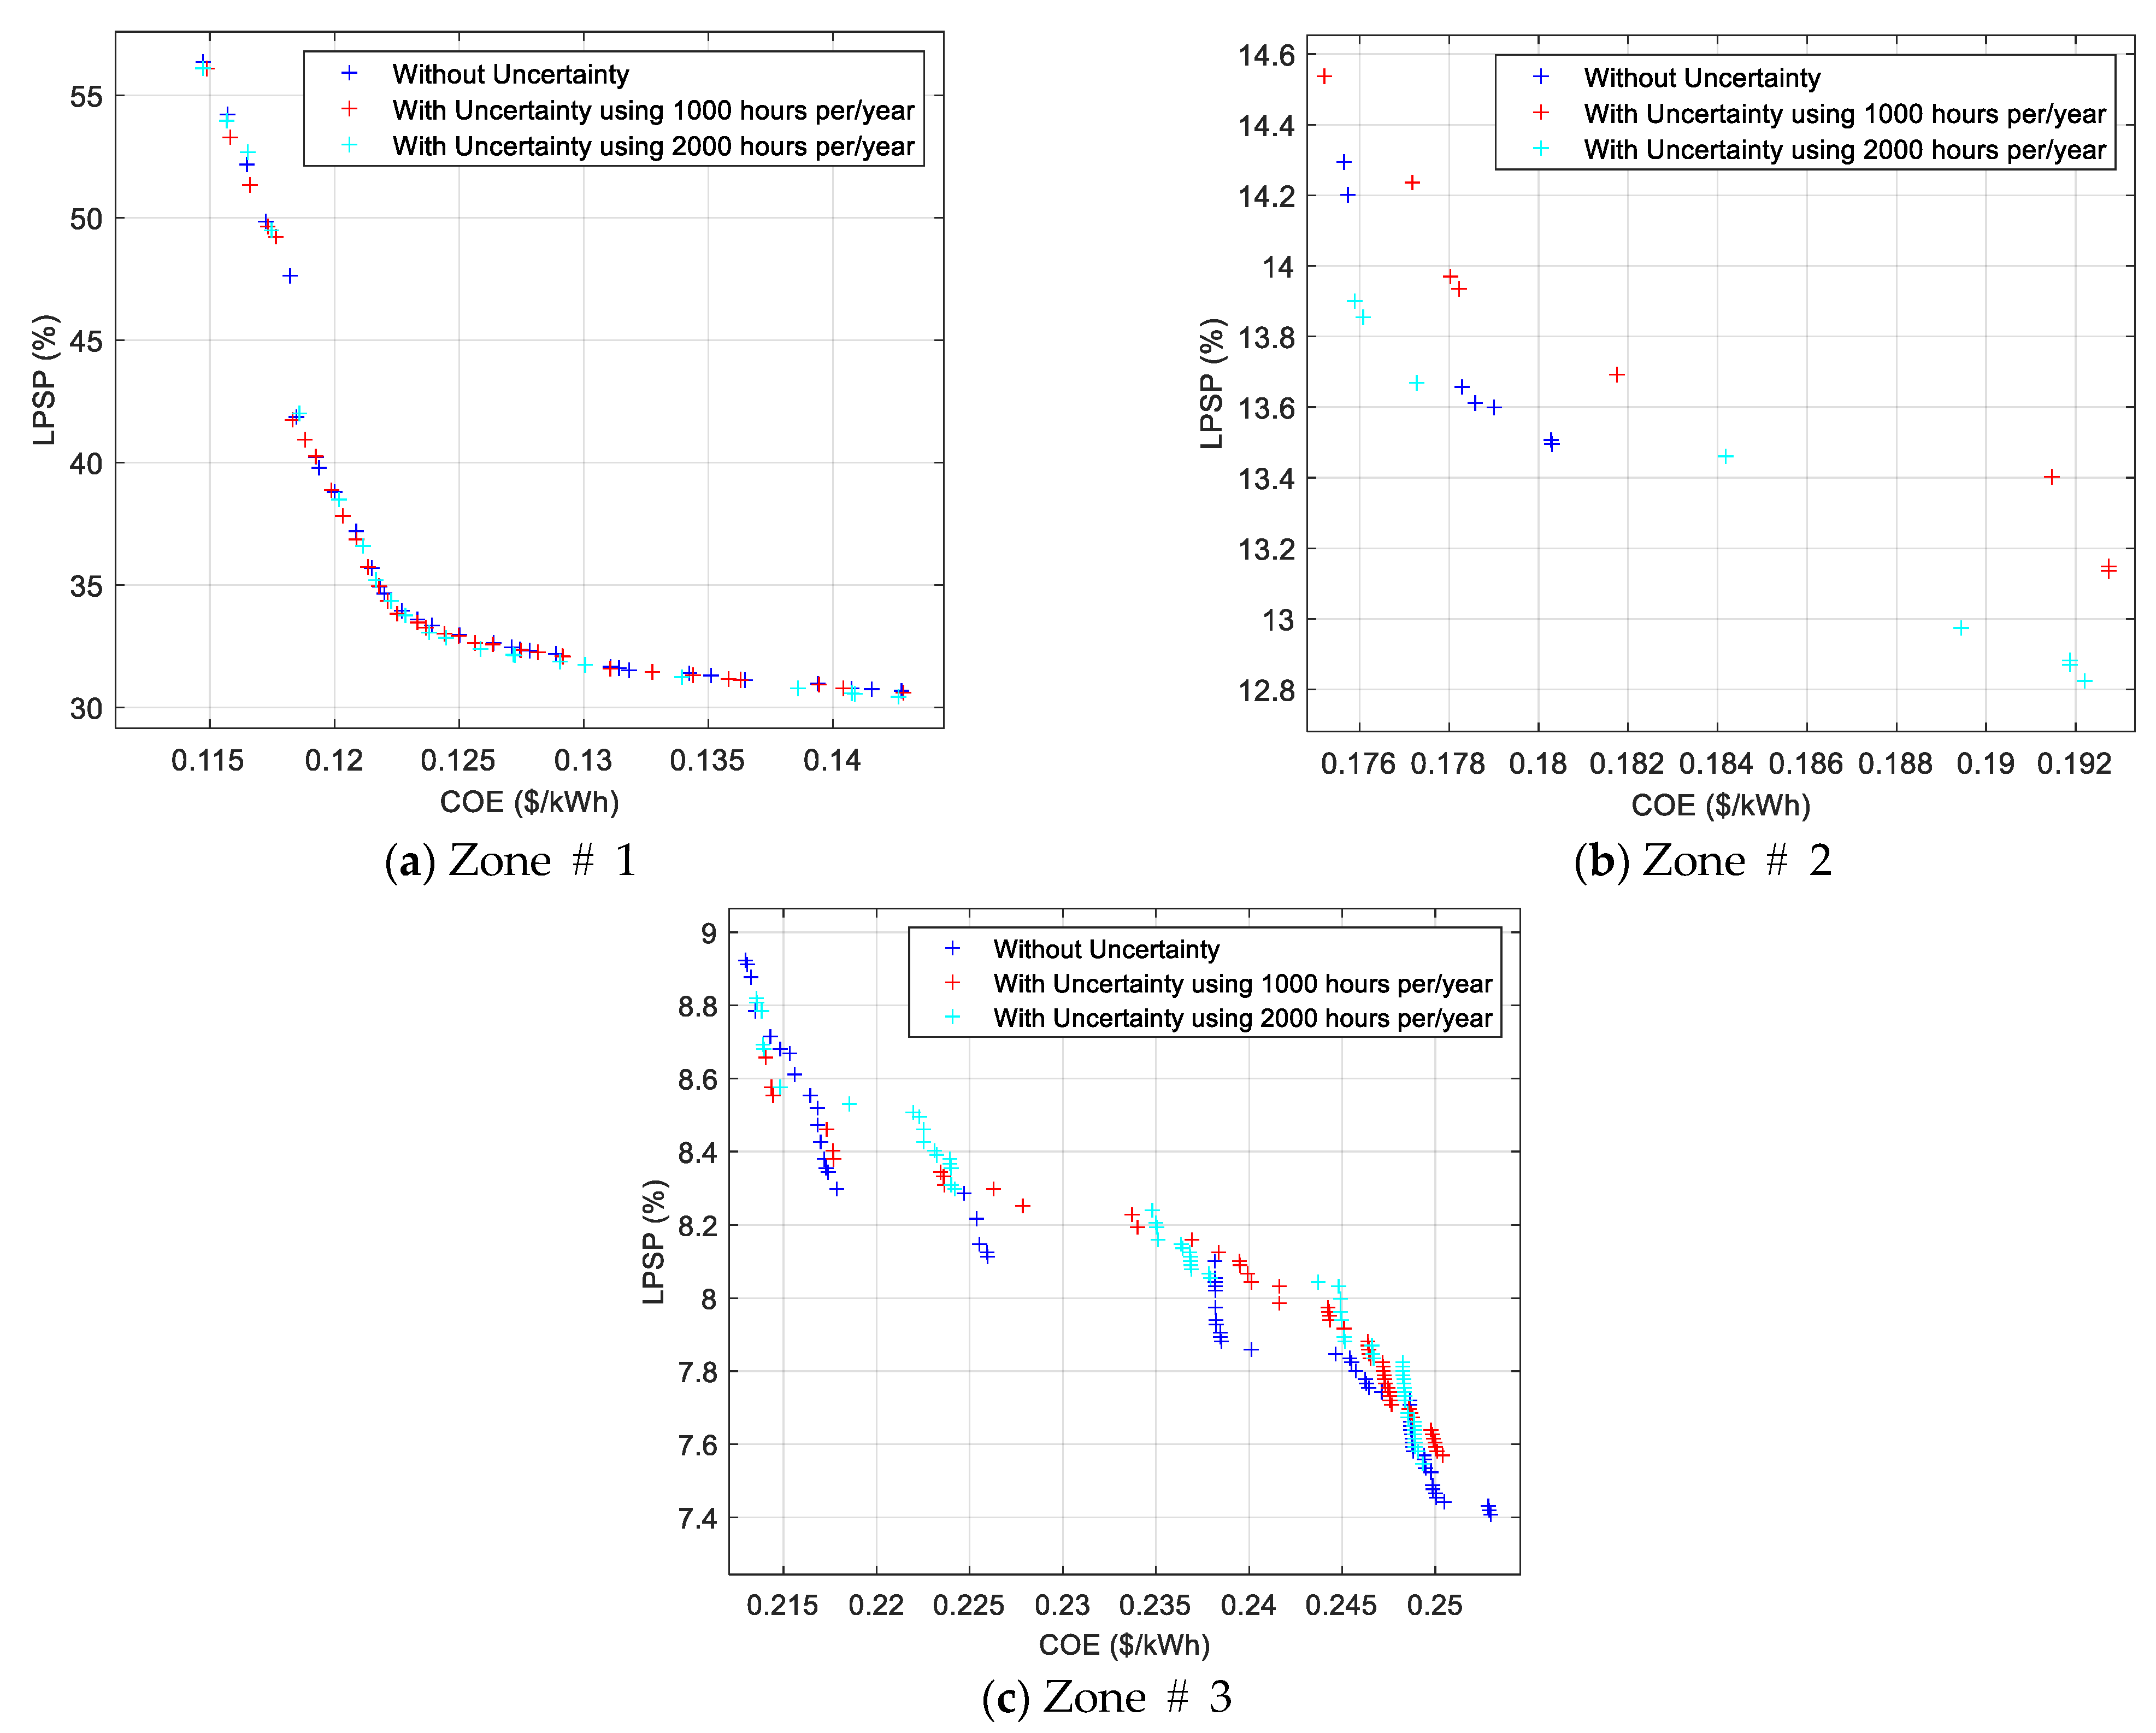
A comparison of the PFs obtained for the cases considering degradation (i.e., CASE 1.3, CASE 1.4, and CASE 1.5) is shown in Figure 11. In this figure, the PFs are decomposed into three separate zones, and for clear presentation, a zoomed-in version of each zone is presented. It can be seen from this figure that the uncertainty has very little effect on the first zone. However, this effect becomes significant in the remaining zones of the PF. Finally, it is worth mentioning that the numbers of nondominated solutions found using the IMOEAD for CASE 1.3, CASE 1.4, and CASE 1.5 are 106, 95, and 92, respectively.
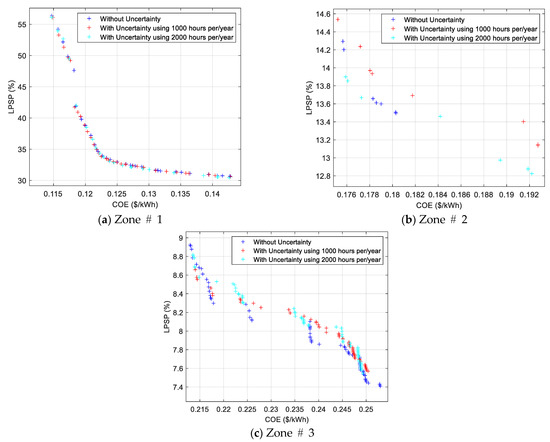
Figure 11.
Zoom on the PF obtained for CASE 1.3, CASE 1.4, and CASE 1.5 using the proposed approach.
Twenty selected solutions from each obtained PF for CASE 1.0, CASE 1.1, CASE 1.2, CASE 1.3, CASE 1.4, and CASE 1.5 are presented in Table 3, Table 4, Table 5, Table 6, Table 7 and Table 8, respectively. To make it easier, these solutions are arranged in order of COE results. Furthermore, some of the solutions are described herewith.

Table 3.
Twenty selected solutions for CASE 1.0.

Table 4.
Twenty selected solutions for CASE 1.1.

Table 5.
Twenty selected solutions for CASE 1.2.

Table 6.
Twenty selected solutions for CASE 1.3.

Table 7.
Twenty selected solutions for CASE 1.4.

Table 8.
Twenty selected solutions for CASE 1.5.
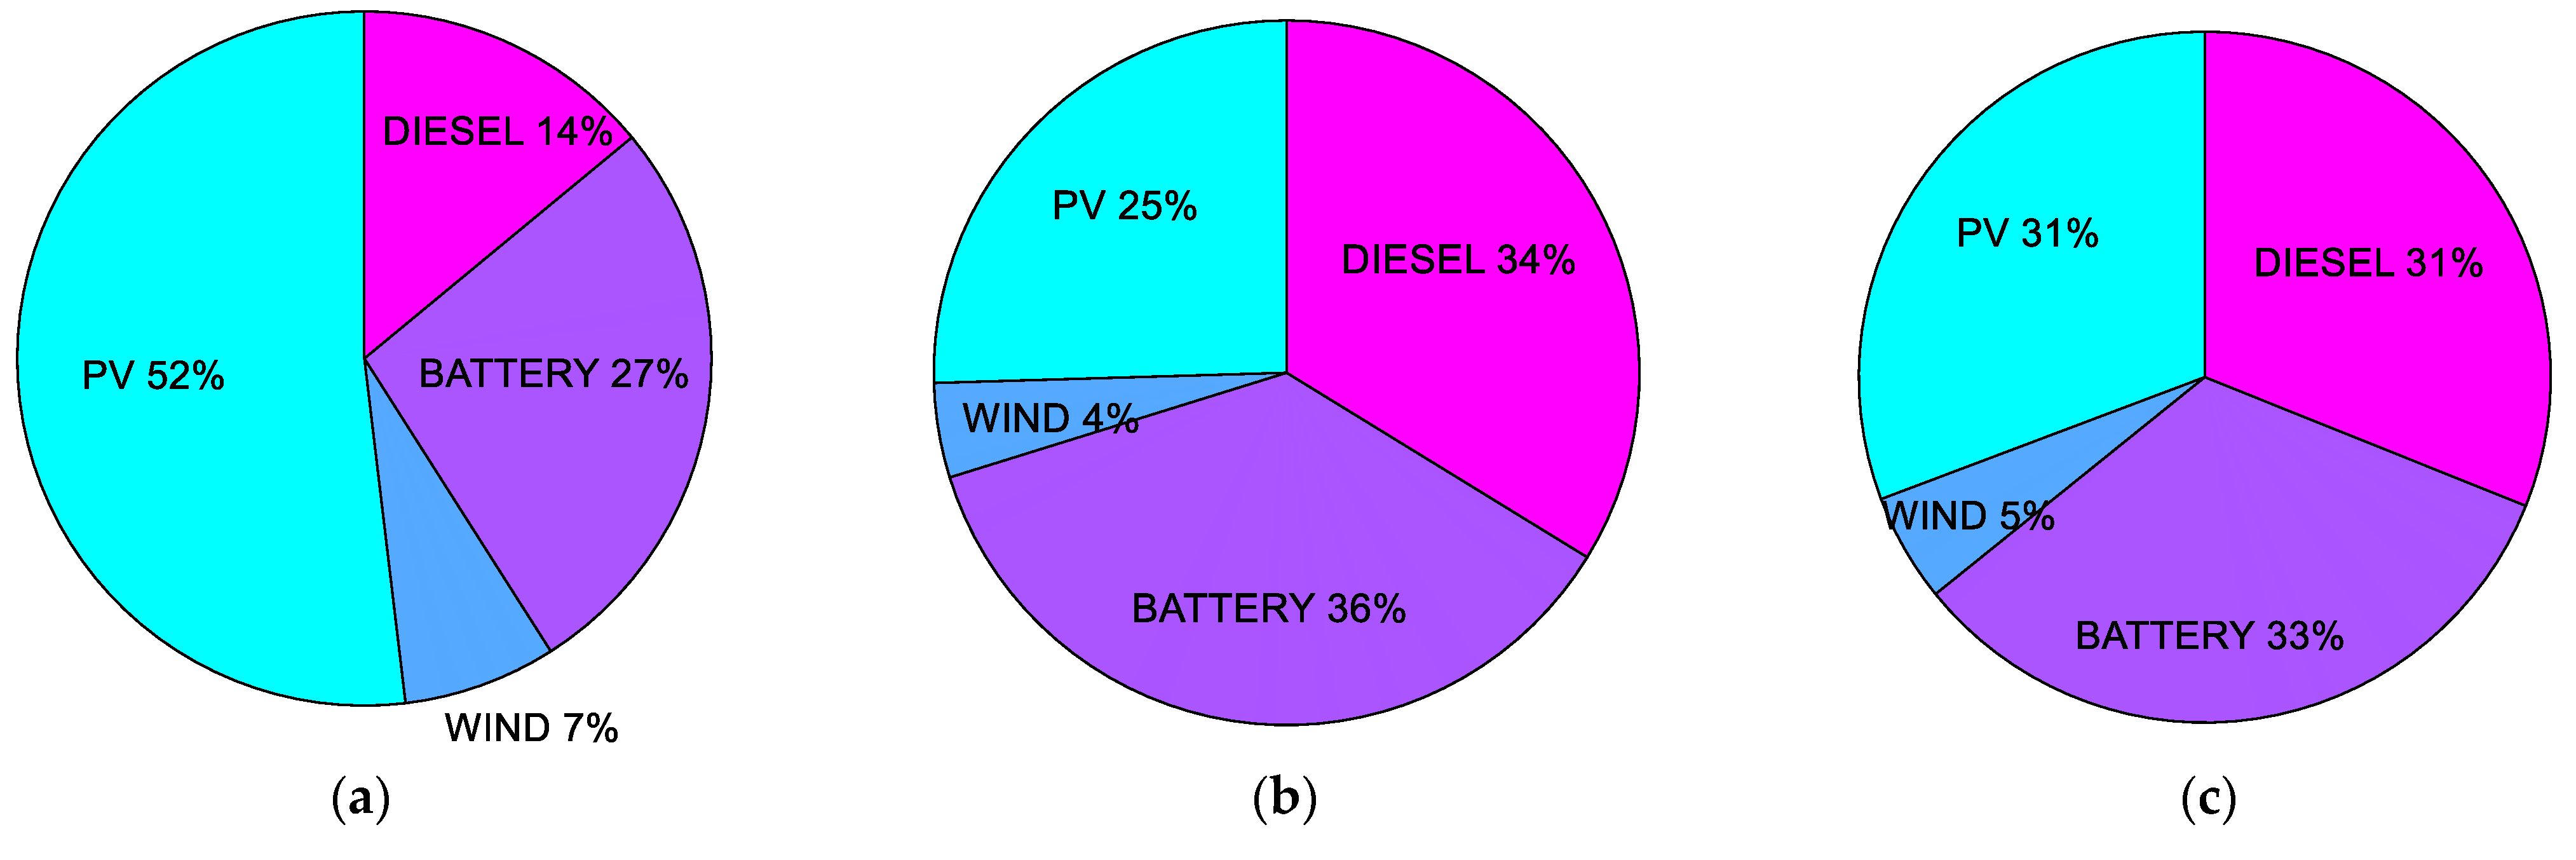
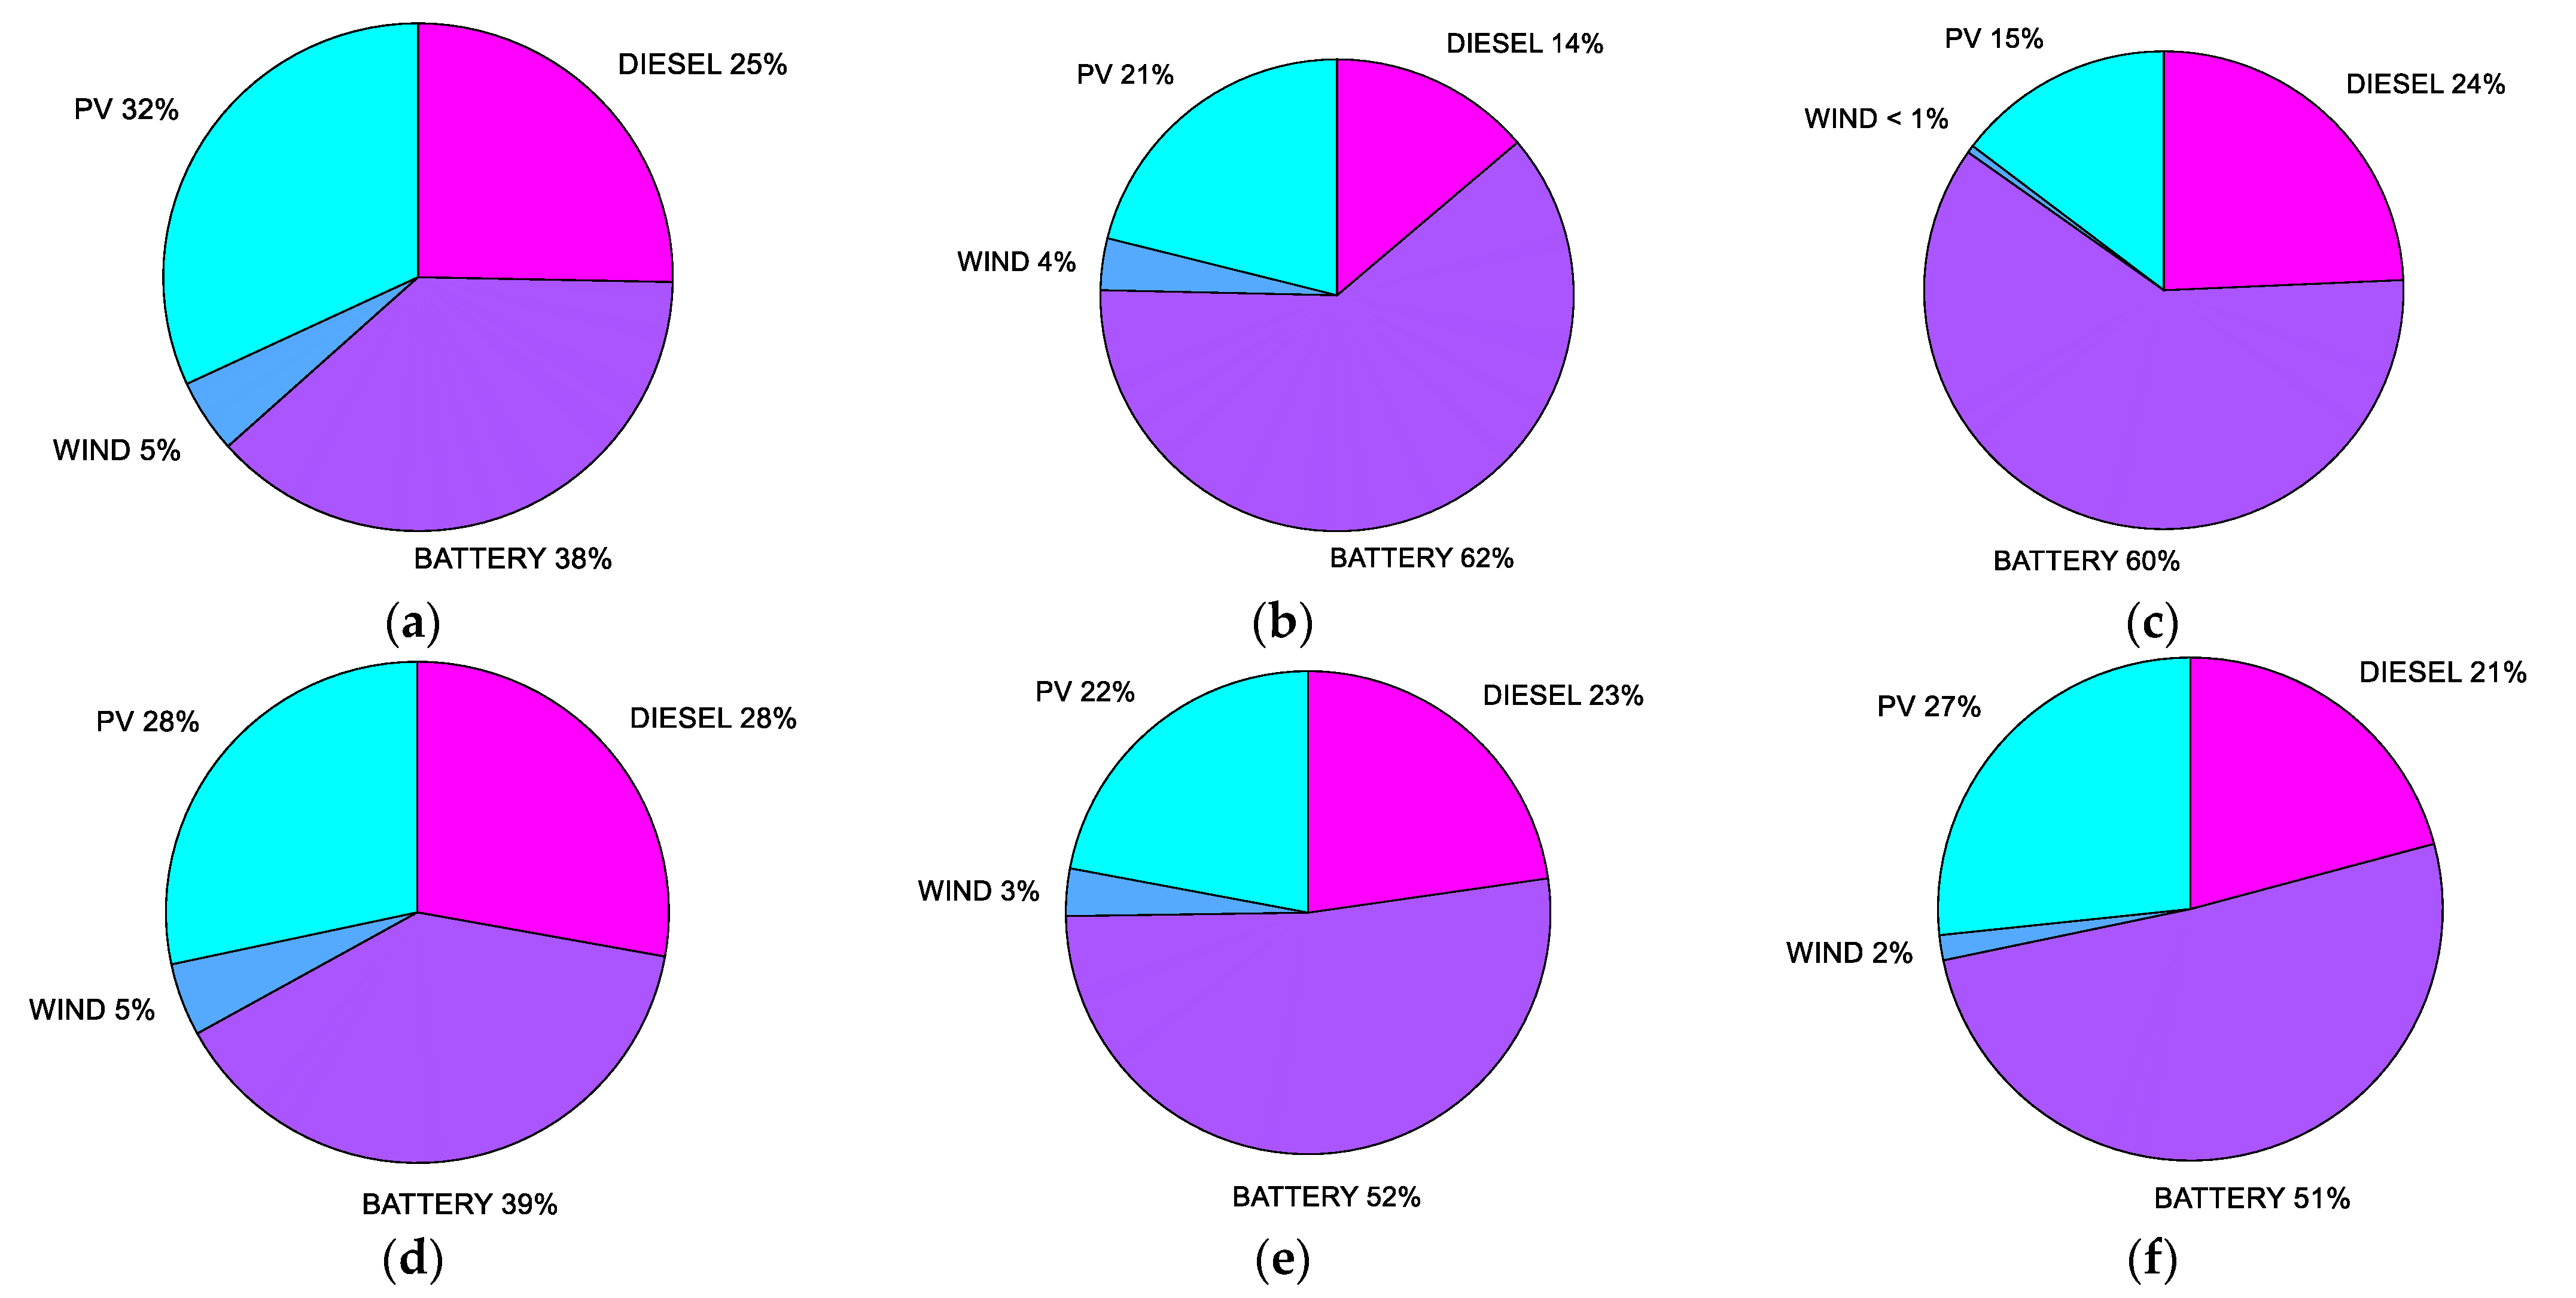
Solution #1 of CASE 1.0 is characterized by a system comprising a PV panels’ power of 43.43 kW, 5 days of autonomy, 9 WTs, and 3 diesel generators. The corresponding COE, LPSP, and RF values for this solution are 0.1159 USD/kWh, 63.10%, and 83.71%, respectively. The energy contribution of each source type, including PV panels, wind turbines, diesel generators, and batteries, can be found in in Figure 12a.
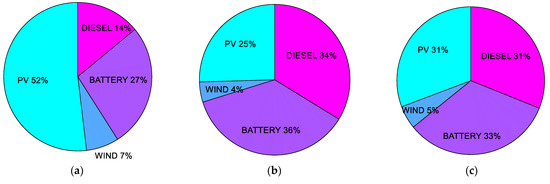
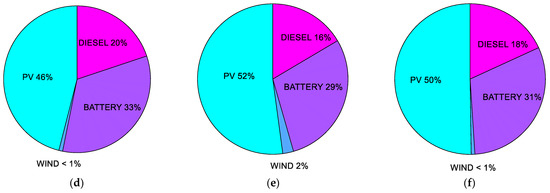
Figure 12.
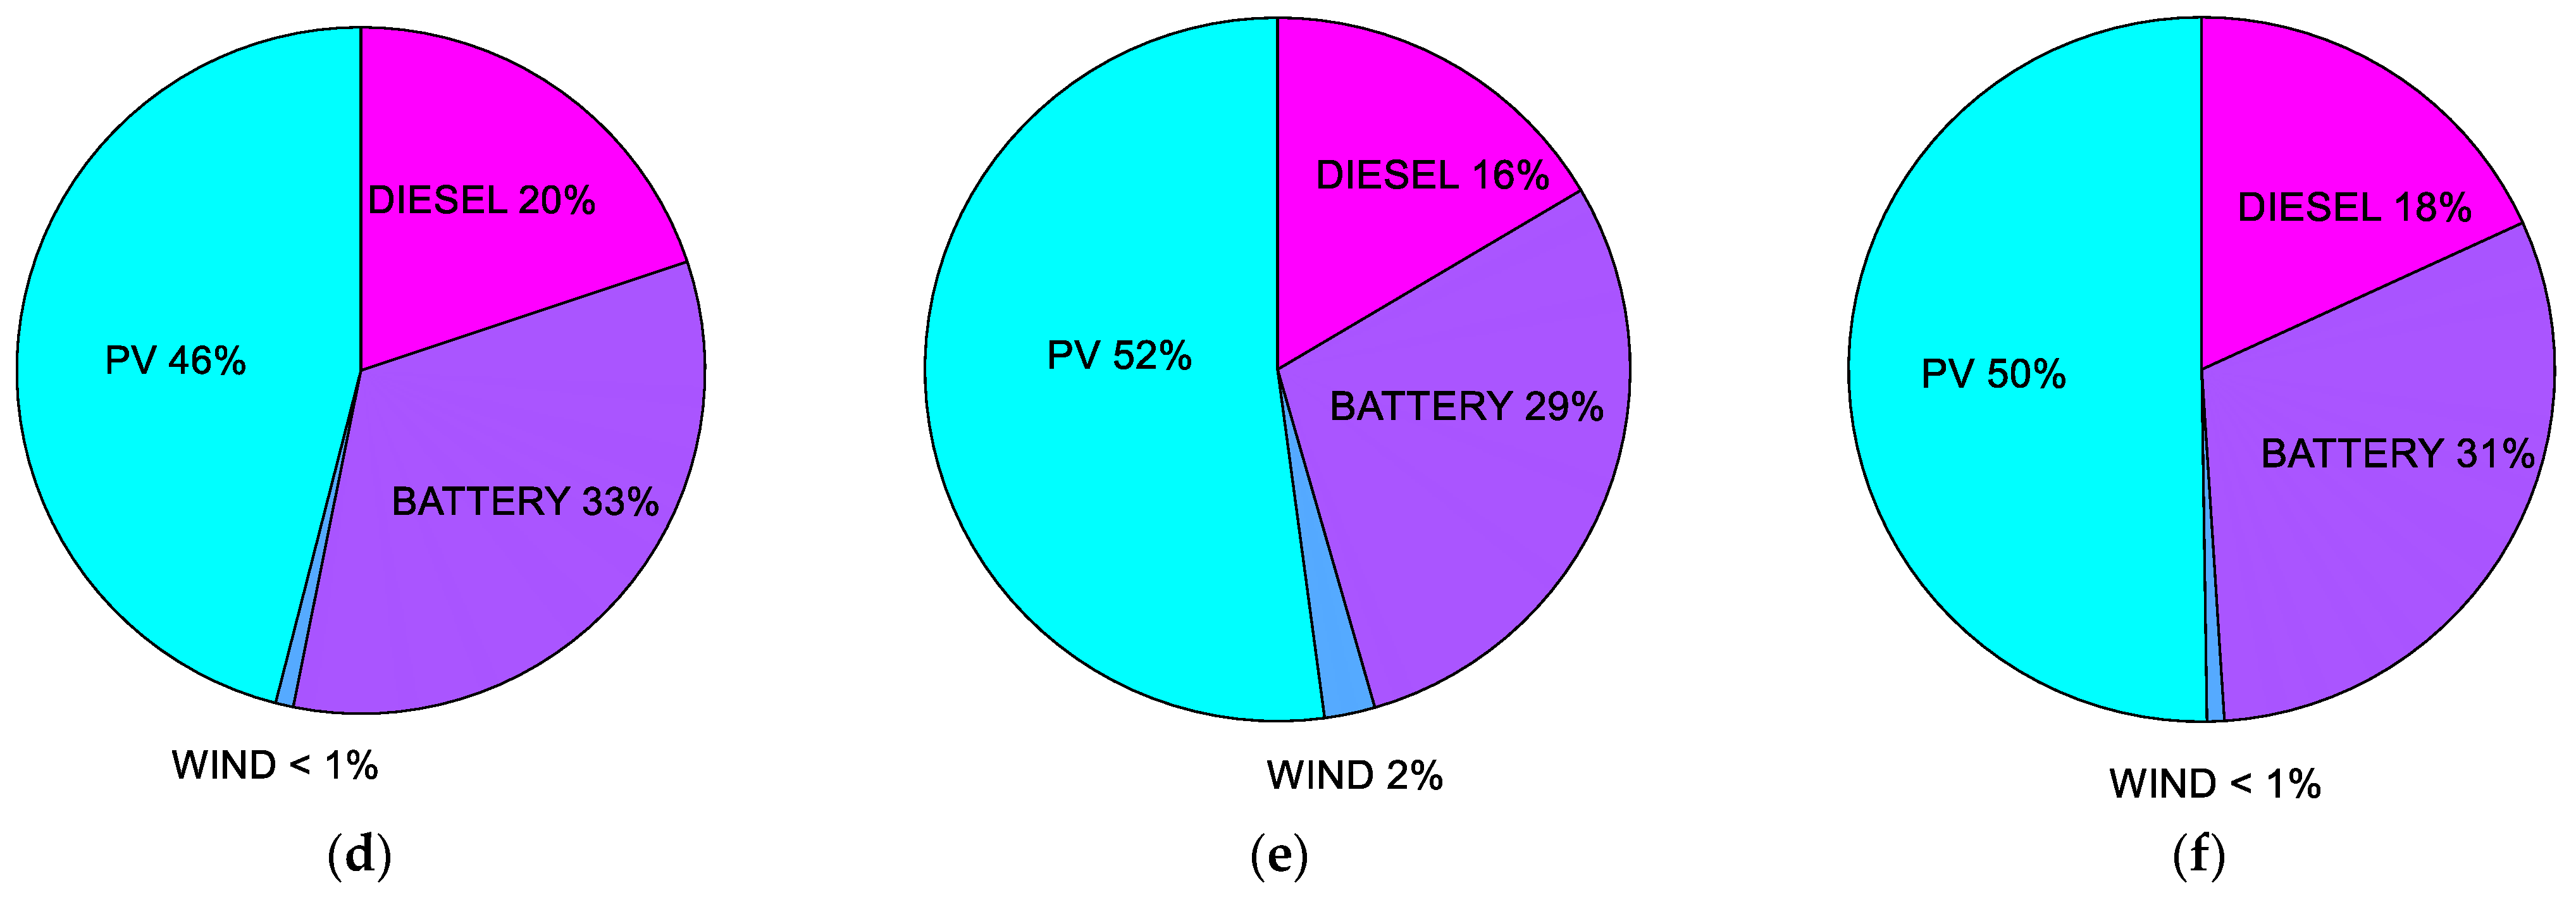
Pie chart of energy shares by various sources of HMSs for CASE 1: (a) for solution #1 of CASE 1.0, (b) for solution #19 of CASE 1.1, (c) for solution # 10 of CASE 1.2, (d) for solution # 5 of CASE 1.3, (e) for solution # 10 of CASE 1.4, and (f) for solution # 20 of CASE 1.5.
For solution # 1 of CASE 1.0, the system has a PV panels’ power of 43.43 kW, 5 days of autonomy, 9 WTs, and 3 diesel generators. This solution corresponds to a COE of 0.1159 USD/kWh, LPSP of 63.10%, and RF of 83.71%. Figure 12 presents the share of different energy resources: wind, diesel, PV, and battery.
For the # 10th solution of CASE 1.2, the system consists of 24.14 kW of PV panels, 1.25 days of autonomy, 6 wind turbines, and 4 diesel generators. The corresponding COE is 0.1238 USD/kWh, the LPSP is 45.21%, and the reserve factor (RF) is 54.91%. Figure 12c displays the energy contribution of each power source for this solution.
Another solution to be described here is solution # 5 of CASE 1.3. The system designed by this solution has a PV power of 36.5 kW, 5 days of autonomy, 1 WT, and 3 diesel generators. This gives a COE, an LPSP, and an RE of 0.1182 USD/kWh, 47.64%, and 75.20%, respectively. Furthermore, different contributions of each part for this solution are shown in Figure 12d.
In addition to the above-described solutions, two more solutions, namely, solution # 10 of CASE 1.4 and solution # 20 of CASE 1.5, are represented in Figure 12e,f, respectively.
5.3. Ten Houses’ Cases
Similar to the previous cases, the proposed IMOEAD has been tried on 10 house contained load cases to run CASE 2.0 to CASE 2.5, assuming a population size of 100 candidates over 200 iterations. The PF, which is composed of 87 nondominated solutions, obtained for CASE 2.0 is represented in Figure 13. For the same reasons mentioned before, the obtained PF is not smooth, and it is spread over five zones as it can be seen in Figure 13.
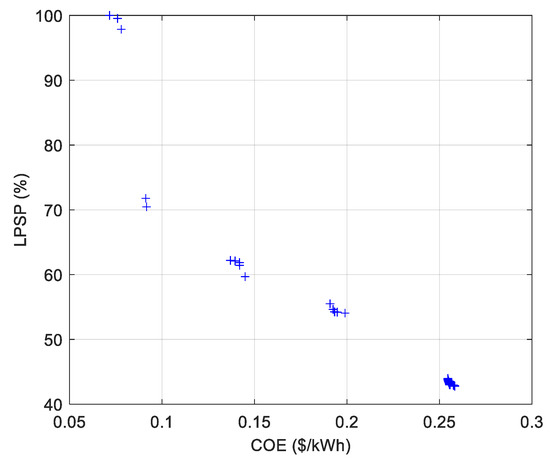
Figure 13.
IMOEAD provided PF for CASE 2.0.
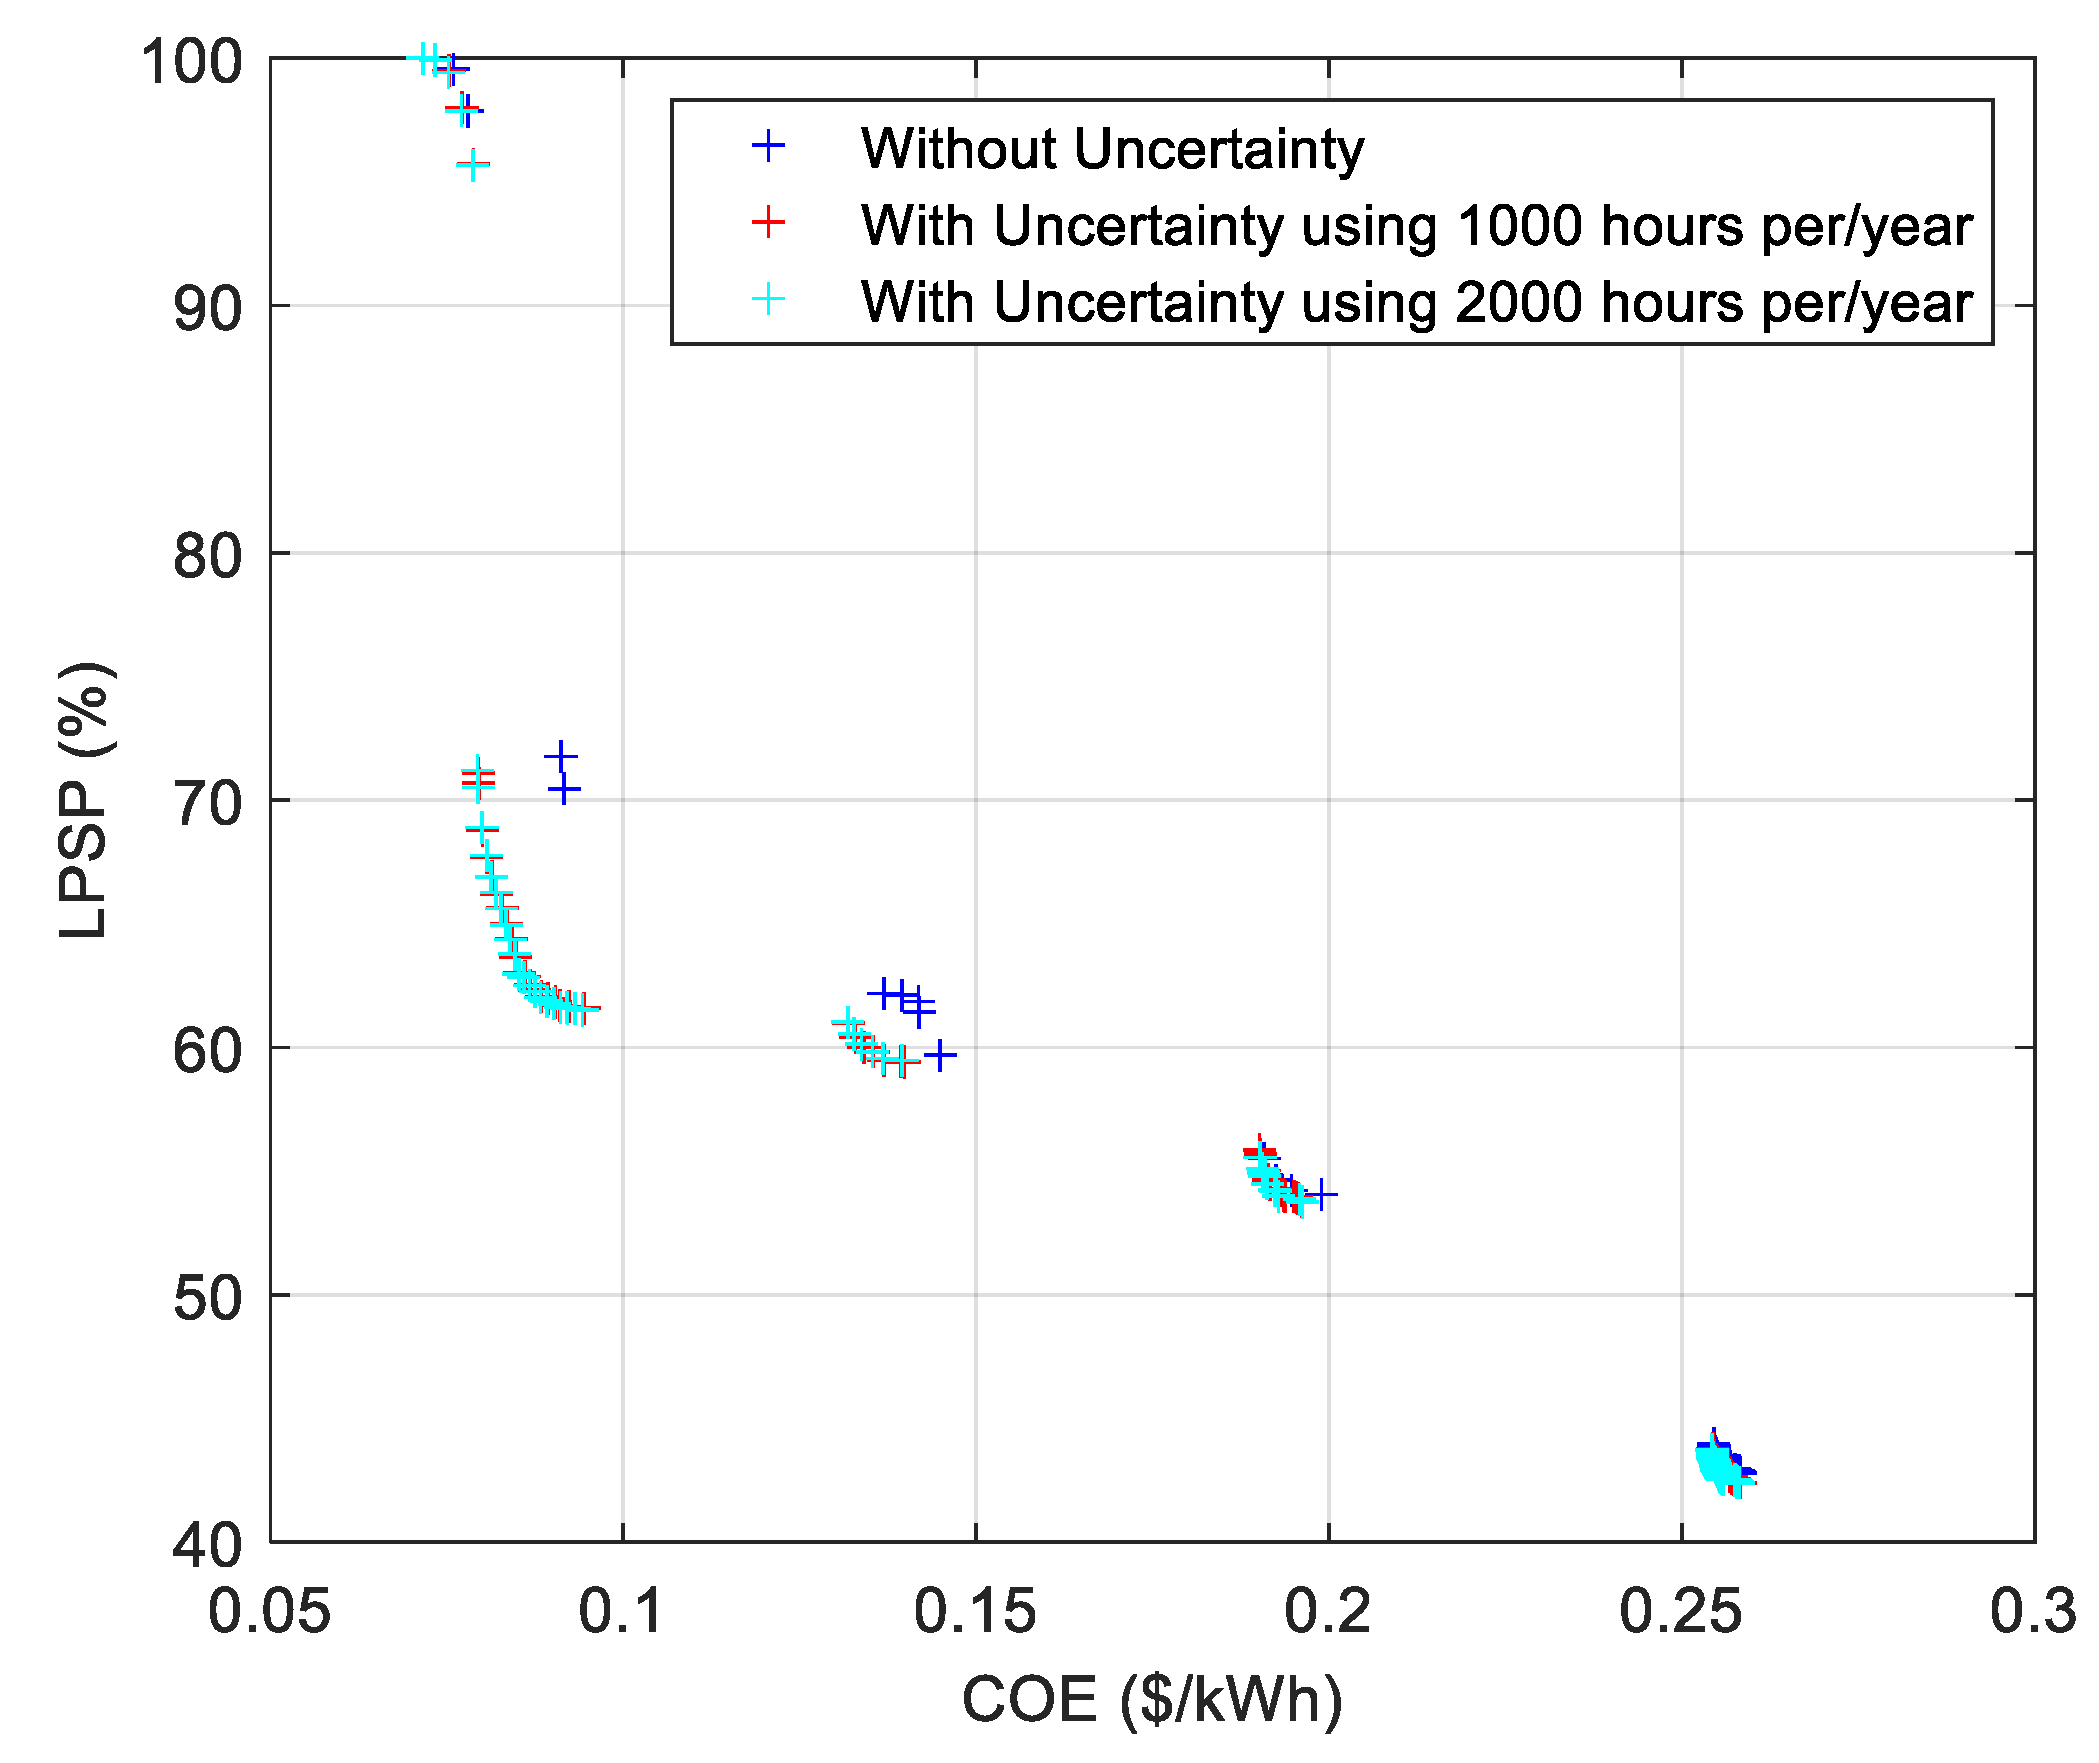
The resulting fronts for CASE 2.0, CASE 2.1, and CASE 2.2 (composed of 87, 109, and 102 solutions, respectively) are represented in Figure 14. In some zones, the results are like each other; however, in some other zones, they are quite different. However, the effect of load uncertainty is clearer in the cases of 10 houses than that of 5 houses.
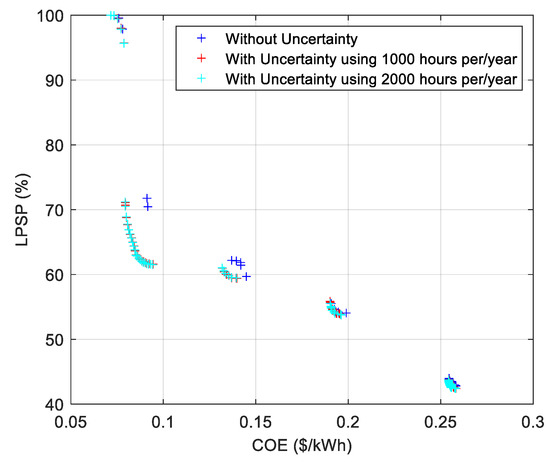
Figure 14.
IMOEAD-provided PF for CASE 2.0, CASE 2.1, and CASE 2.2.
The PF obtained in the case considering no degradation in the batteries (i.e., in CASE 2.0, which is composed of 87 solutions) and the one obtained in the case considering degradation in the batteries (i.e., CASE 2.3, which is composed of 140 solutions) are compared in Figure 15. It can be seen from this figure that there is a clear effect of the batteries’ degradation on the quality of the solutions like in the case of five houses.
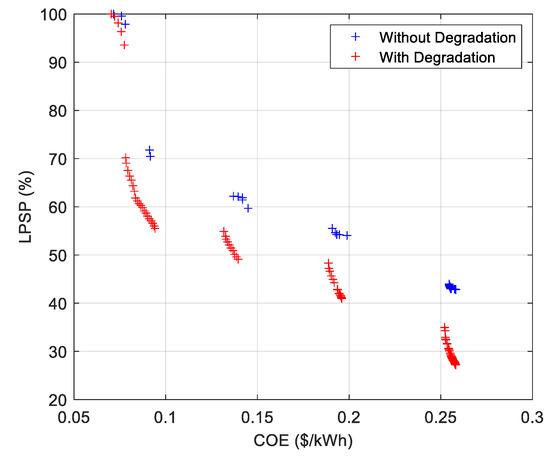
Figure 15.
Comparison between the PF obtained for CASE 2.0 and CASE 2.3 using the proposed IMOEAD approach.
A comparison of the PFs obtained for the cases considering degradation with or without load uncertainty (i.e., CASE 2.3, CASE 2.4, and CASE 2.5) is shown in Figure 16. It can be seen from this figure that the uncertainty has little effect on some zones and a significant impact on others. Finally, it is worth mentioning that the numbers of nondominated solutions for CASE 2.3, CASE 2.4, and CASE 2.5 are 140, 130, and 132, respectively.
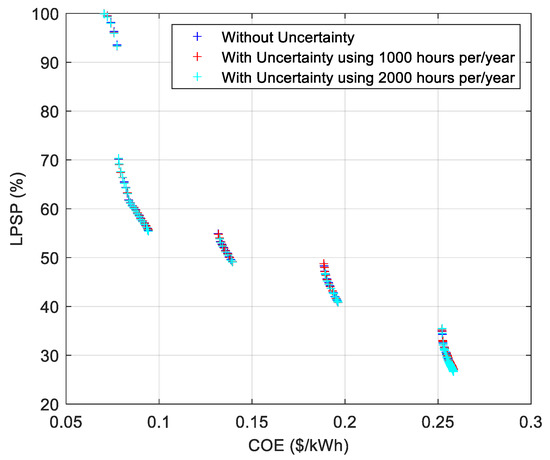
Figure 16.
Zoom on the PF obtained for CASE 2.3, CASE 2.4, and CASE 2.5 using the proposed approach.
For the cases related to 10 houses, twenty selected solutions from each obtained PF for CASE 2.0, CASE 2.1, CASE 2.2, CASE 2.3, CASE 2.4, and CASE 2.5 are tabulated in Table 9, Table 10, Table 11, Table 12, Table 13 and Table 14, respectively. The solutions are sorted based on the values of COE, for convenience. Furthermore, some of the selected solutions are described below.

Table 9.
Twenty selected solutions for CASE 2.0.

Table 10.
Twenty selected solutions for CASE 2.1.

Table 11.
Twenty selected solutions for CASE 2.2.

Table 12.
Twenty selected solutions for CASE 2.3.

Table 13.
Twenty selected solutions for CASE 2.4.

Table 14.
Twenty selected solutions for CASE 2.5.
For solution # 1 of CASE 2.0, the system has a PV panels’ power of 45 kW, 3.70 days of autonomy, 10 WTs, and 4 diesel generators. The energy contribution for each source type (i.e., PV panels, wind turbines, diesel generator, and battery) for solution #1 of CASE 2.0 can be found in Figure 17a, which has a COE of 0.0716 USD/kWh, LPSP of 99.99%, and RF of 66.12%.
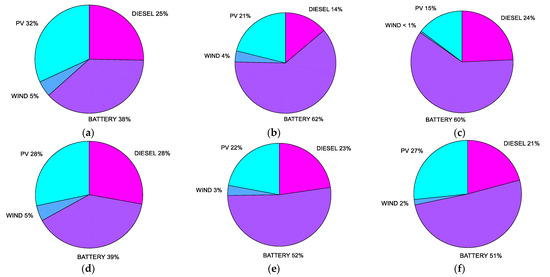
Figure 17.
Pie chart of energy shares by various sources of HMSs for CASE 2: (a) for solution #1 of CASE 2.0, (b) for solution #20 of CASE 2.1, (c) for solution # 7 of CASE 2.2, (d) for solution # 3 of CASE 2.3, (e) for solution # 9 of CASE 2.4, and (f) for solution # 13 of CASE 2.5.
For solution #20 of CASE 2.1, the system consists of a PV panels’ power of 23.69 kW, 2.37 days of autonomy, 6 WTs, and 1 diesel generators. This solution has a COE of 0.2556 USD/kWh, LPSP of 42.69%, and RF of 84.01%. The energy contribution from each source type for this solution is presented in Figure 17b.
For solution # 7 of CASE 2.2, the system has a PV panels’ power of 18.80 kW, 4.12 days of autonomy, 1 WTs, and 2 diesel generators. This solution has a COE of 0.0807 USD/kWh, LPSP of 67.77%, and RF of 67.86%. The energy contribution from various resources for this solution is presented in Figure 17c.
Another solution to that described here is solution # 3 of CASE 2.3. The system designed by this solution has a PV power of 39.95 kW, 4.86 days of autonomy, 10 WT, and 4 diesel generators. This gives a COE, an LPSP, and an RE of 0.0758 USD/kWh, 96.32%, and 61.45%, respectively. Furthermore, different contributions of each part for this solution are shown in Figure 17d.
In addition to the above-described solutions, two more solutions, namely, solution # 9 of CASE 2.4 and solution # 13 of CASE 2.5, are represented in Figure 17e,f, respectively.
6. Conclusions
In this paper, a multi-objective optimization problem considering LPSP and COE was formulated to determine the optimum size of a small-scale PV/Wind/Diesel HMS system for Yanbu, Saudi Arabia, while accounting for impacts of load uncertainty and battery deterioration. An improved approach based on the MOEA/D algorithm was proposed, implemented, and applied to solve the formulated problem. The experimental investigation included ten instances representing different scenarios for five and ten houses. For the five houses cases, CASE 1.0, CASE 1.1, CASE 1.2, CASE 1.3, CASE 1.0, and CASE 1.5, 100, 102, 95, 106, 95, and 92 solutions were obtained, respectively. In these cases, the PF could be divided into four different zones. An example of solutions for CASE 1.0 is a system with a PV panels’ power of 43.43 kW, 5 days of autonomy, 9 WTs, and 3 diesel generators corresponding to a COE of 0.1159 USD/kWh, LPSP of 63.10%, and RF of 83.71%. For the ten houses’ cases, CASE 1.0, CASE 1.1, CASE 1.2, CASE 1.3, CASE 1.0, and CASE, 1.5, 87, 109, 102, 140, 130, and 132 solutions were obtained, respectively. In these cases, the PF could be divided into five different zones. An example of a solution for CASE 2.0 is a system with a PV panels’ power of 45 kW, 3.70 days of autonomy, 10 WTs, and 4 diesel generators, which has a COE of 0.0716 USD/kWh, LPSP of 99.99%, and RF of 66.12%. Furthermore, this study found that battery degradation had a significant impact, while the effect of load uncertainty was moderate in some instances and heavy in others. The obtained PF or the set of nondominated solutions covered a wide range in each case. These results can aid the HMS designer/engineer in selecting the best solution, considering other factors or constraints that cannot be modeled mathematically.
Author Contributions
Conceptualization, H.R.E.H.B., M.S.S. and Y.A.S.; methodology, H.R.E.H.B., Y.A.S. and M.S.S.; software, H.R.E.H.B.; validation, Y.A.S., M.S.S. and S.M.A.; formal analysis, Y.A.S. and M.S.S.; investigation, H.R.E.H.B.; resources, H.R.E.H.B. and M.A.R.; writing—original draft preparation, H.R.E.H.B., M.A.R., Y.A.S., S.M.A. and M.S.S.; writing—review and editing, H.R.E.H.B., M.A.R., Y.A.S., S.M.A. and M.S.S.; visualization, Y.A.S.; supervision, H.R.E.H.B. and M.A.R.; project administration, H.R.E.H.B.; funding acquisition, H.R.E.H.B., M.S.S. and Y.A.S. All authors have read and agreed to the published version of the manuscript.
Funding
This research work was funded by institutional fund projects under no (IFP-A-01-2-1-2022). Therefore, authors gratefully acknowledge technical and financial support from the ministry of education and University of Hafr Al Batin, Saudi Arabia.
Institutional Review Board Statement
Not applicable.
Informed Consent Statement
Not applicable.
Data Availability Statement
Not applicable.
Conflicts of Interest
The authors declare no conflict of interest.
Abbreviations
| AASF | Augmented Achieving Scalarizing Function |
| AC | Alternating Current |
| AD | Autonomy Days |
| AIS | Artificial Immune System |
| APBI | Augmented-Penalty-based Boundary Intersection |
| APS | Adaptive Penalty Scheme |
| BI | Boundary Intersection |
| COE | Cost of Electricity |
| CRF | Capital Recovery Factor |
| CSA | Cuckoo Search Algorithm |
| DC | Direct Current |
| DE | Differential Evolution |
| DOD | Depth of Discharge |
| EMS | Energy Management System |
| GA | Genetic Algorithm |
| GOA | Grasshopper Optimization System |
| GWO | Grey Wolf Optimization |
| HMS | Hybrid Microgrid System |
| IEC | International Electrotechnical Commission |
| IGBT | Insulated-gate Bipolar Transistor |
| IMOEAD | Improved Decomposition Multi-Objective Evolutionary Algorithm |
| IPBI | Inverted-Penalty-based Boundary Intersection |
| LPSP | Loss of Power Supply Probability |
| LTD | Learning to Decompose |
| MILP | Mixed Integer Linear Programming |
| MIP | Mixed Integer Programming |
| MOEA | Multi-objective Evolutionary Algorithm |
| MOEA/D | Multi-objective Evolutionary Algorithm by Decomposition |
| MOEA/D-LTD | Multi-objective Evolutionary Algorithm by Decomposition using Learning to Decompose Paradigm |
| MOEA/D-PaP | Multi-objective Evolutionary Algorithm by Decomposition using Pareto Adaptive PBI |
| MOEA/D-Par | Multi-objective Evolutionary Algorithm by Decomposition using Pareto adaptive scalarizing functions |
| MOEA/D-Pas | Multi-objective Evolutionary Algorithm by Decomposition using Pareto Adaptive Scalarizing methods |
| MSF | Multiplicative Scalarizing Function |
| MTCH | Modified Tchebycheff |
| NAD | Number of Autonomy Days |
| NDiesel | Number of Diesel Generators |
| NPC | Net Profit Cost |
| NSGA | Non-dominated Sorting Genetic Algorithm |
| NSGA-III-AASF | Non-dominated Sorting Genetic Algorithm III using Augmented achievement scalarizing function |
| NSGA-III-EPBI | Non-dominated Sorting Genetic Algorithm III using Penalty-based Boundary Intersection |
| NTCH | Normalized Tchebycheff |
| NWT | Number of Wind Turbines |
| O&M | Operation and Maintenance |
| PBI | Penalty-based Boundary Intersection |
| PF | Pareto Front |
| PSF | Penalty-based Scalarizing Function |
| PSO | Particle Swarm Optimization |
| PV | Photovoltaic |
| RES | Renewable Energy Source |
| RF | Renewable Factor |
| SA | Simulated Annealing |
| SDE | Self-Adaptive Differential Evolution |
| SPS | Subproblem-based Penalty Scheme |
| STC | Standard Test Conditions |
| TCH | Tchebycheff |
| TLBO | Teaching-Learning-Based Optimization |
| TLBO | Teaching-Learning-Based Optimization |
| TS | Tabu Search |
| TS | Tabu Search |
| WS | Weighted Sum |
| WT | Wind Turbine |
| WWM | Weighted-Metrics-based Methods |
References
- Das, B.K.; Alotaibi, M.A.; Das, P.; Islam, M.S.; Das, S.K.; Hossain, M.A. Feasibility and Techno-Economic Analysis of Stand-Alone and Grid-Connected PV/Wind/Diesel/Batt Hybrid Energy System: A Case Study. Energy Strateg. Rev. 2021, 37, 100673. [Google Scholar] [CrossRef]
- Ellabban, O.; Abu-Rub, H.; Blaabjerg, F. Renewable Energy Resources: Current Status, Future Prospects and Their Enabling Technology. Renew. Sustain. Energy Rev. 2014, 39, 748–764. [Google Scholar] [CrossRef]
- Moghaddam, A.A.; Seifi, A.; Niknam, T.; Alizadeh Pahlavani, M.R. Multi-Objective Operation Management of a Renewable MG (Micro-Grid) with Back-up Micro-Turbine/Fuel Cell/Battery Hybrid Power Source. Energy 2011, 36, 6490–6507. [Google Scholar] [CrossRef]
- Hepbasli, A.; Alsuhaibani, Z. A Key Review on Present Status and Future Directions of Solar Energy Studies and Applications in Saudi Arabia. Renew. Sustain. Energy Rev. 2011, 15, 5021–5050. [Google Scholar] [CrossRef]
- Al-Abbadi, N.M. Wind Energy Resource Assessment for Five Locations in Saudi Arabia. Renew. Energy 2005, 30, 1489–1499. [Google Scholar] [CrossRef]
- Rehman, S.; Al-Abbadi, N.M. Wind Shear Coefficients and Energy Yield for Dhahran, Saudi Arabia. Renew. Energy 2007, 32, 738–749. [Google Scholar] [CrossRef]
- Bouchekara, H.R.A.-H.; Shahriar, M.S.; Javaid, M.S.; Sha’aban, Y.A.; Ramli, M.A.M. Multi-Objective Optimization of a Hybrid Nanogrid/Microgrid: Application to Desert Camps in Hafr Al-Batin. Energies 2021, 14, 1245. [Google Scholar] [CrossRef]
- Bouchekara, H.R.E.H.; Shahriar, M.S.; Irshad, U.B.; Sha’aban, Y.A.; Mahmud, M.A.P.; Javaid, M.S.; Ramli, M.A.M.; Farjana, S.H. Optimal Sizing of Hybrid Photovoltaic/Diesel/Battery Nanogrid Using a Parallel Multiobjective PSO-Based Approach: Application to Desert Camping in Hafr Al-Batin City in Saudi Arabia. Energy Rep. 2021, 7, 4360–4375. [Google Scholar] [CrossRef]
- Sultan, H.M.; Kuznetsov, O.N.; Diab, A.A.Z. Site Selection of Large-Scale Grid-Connected Solar PV System in Egypt. In Proceedings of the 2018 IEEE Conference of Russian Young Researchers in Electrical and Electronic Engineering, ElConRus 2018, St. Petersburg, Russia, 29 January–1 February 2018; Institute of Electrical and Electronics Engineers Inc.: New York, NY, USA, 2018; Volume 2018, pp. 813–818. [Google Scholar]
- Al-Ghussain, L.; Ahmed, H.; Haneef, F. Optimization of Hybrid PV-Wind System: Case Study Al-Tafilah Cement Factory, Jordan. Sustain. Energy Technol. Assess. 2018, 30, 24–36. [Google Scholar] [CrossRef]
- Diab, A.A.Z.; Sultan, H.M.; Mohamed, I.S.; Kuznetsov, O.N.; Do, T.D. Application of Different Optimization Algorithms for Optimal Sizing of PV/Wind/Diesel/Battery Storage Stand-Alone Hybrid Microgrid. IEEE Access 2019, 7, 119223–119245. [Google Scholar] [CrossRef]
- Himri, Y.; Malik, A.S.; Boudghene Stambouli, A.; Himri, S.; Draoui, B. Review and Use of the Algerian Renewable Energy for Sustainable Development. Renew. Sustain. Energy Rev. 2009, 13, 1584–1591. [Google Scholar] [CrossRef]
- Malik, A.Q. Assessment of the Potential of Renewables for Brunei Darussalam. Renew. Sustain. Energy Rev. 2011, 15, 427–437. [Google Scholar] [CrossRef]
- Mazzeo, D.; Matera, N.; De Luca, P.; Baglivo, C.; Maria Congedo, P.; Oliveti, G. Worldwide Geographical Mapping and Optimization of Stand-Alone and Grid-Connected Hybrid Renewable System Techno-Economic Performance across Köppen-Geiger Climates. Appl. Energy 2020, 276, 115507. [Google Scholar] [CrossRef]
- Dalton, G.J.; Lockington, D.A.; Baldock, T.E. Feasibility Analysis of Renewable Energy Supply Options for a Grid-Connected Large Hotel. Renew. Energy 2009, 34, 955–964. [Google Scholar] [CrossRef]
- Dalton, G.J.; Lockington, D.A.; Baldock, T.E. Case Study Feasibility Analysis of Renewable Energy Supply Options for Small to Medium-Sized Tourist Accommodations. Renew. Energy 2009, 34, 1134–1144. [Google Scholar] [CrossRef]
- Phuangpornpitak, N.; Kumar, S. User Acceptance of Diesel/PV Hybrid System in an Island Community. Renew. Energy 2011, 36, 125–131. [Google Scholar] [CrossRef]
- Phuangpornpitak, N.; Kumar, S. PV Hybrid Systems for Rural Electrification in Thailand. Renew. Sustain. Energy Rev. 2007, 11, 1530–1543. [Google Scholar] [CrossRef]
- Ma, T.; Yang, H.; Lu, L. A Feasibility Study of a Stand-Alone Hybrid Solar-Wind-Battery System for a Remote Island. Appl. Energy 2014, 121, 149–158. [Google Scholar] [CrossRef]
- Acuña, L.G.; Padilla, R.V.; Mercado, A.S. Measuring Reliability of Hybrid Photovoltaic-Wind Energy Systems: A New Indicator. Renew. Energy 2017, 106, 68–77. [Google Scholar] [CrossRef]
- Kaabeche, A.; Belhamel, M.; Ibtiouen, R. Techno-Economic Valuation and Optimization of Integrated Photovoltaic/Wind Energy Conversion System. Sol. Energy 2011, 85, 2407–2420. [Google Scholar] [CrossRef]
- Dali, M.; Belhadj, J.; Roboam, X. Hybrid Solar-Wind System with Battery Storage Operating in Grid-Connected and Standalone Mode: Control and Energy Management—Experimental Investigation. Energy 2010, 35, 2587–2595. [Google Scholar] [CrossRef]
- Agbossou, K.; Kolhe, M.; Hamelin, J.; Bose, T.K. Performance of a Stand-Alone Renewable Energy System Based on Energy Storage as Hydrogen. IEEE Trans. Energy Convers. 2004, 19, 633–640. [Google Scholar] [CrossRef]
- Wang, C.; Nehrir, M.H. Power Management of a Stand-Alone Wind/Photovoltaic/Fuel Cell Energy System. IEEE Trans. Energy Convers. 2008, 23, 957–967. [Google Scholar] [CrossRef]
- Bukar, A.L.; Tan, C.W.; Lau, K.Y. Optimal Sizing of an Autonomous Photovoltaic/Wind/Battery/Diesel Generator Microgrid Using Grasshopper Optimization Algorithm. Sol. Energy 2019, 188, 685–696. [Google Scholar] [CrossRef]
- HOMER. Available online: https://www.homerenergy.com/dynamic-content/press_releases/pr_doe012810.html (accessed on 15 June 2020).
- Erdinc, O.; Uzunoglu, M. Optimum Design of Hybrid Renewable Energy Systems: Overview of Different Approaches. Renew. Sustain. Energy Rev. 2012, 16, 1412–1425. [Google Scholar] [CrossRef]
- Mohammadi, M.; Hosseinian, S.H.; Gharehpetian, G.B. GA-Based Optimal Sizing of Microgrid and DG Units under Pool and Hybrid Electricity Markets. Int. J. Electr. Power Energy Syst. 2012, 35, 83–92. [Google Scholar] [CrossRef]
- Luna-Rubio, R.; Trejo-Perea, M.; Vargas-Vázquez, D.; Ríos-Moreno, G.J. Optimal Sizing of Renewable Hybrids Energy Systems: A Review of Methodologies. Sol. Energy 2012, 86, 1077–1088. [Google Scholar] [CrossRef]
- Borhanazad, H.; Mekhilef, S.; Gounder Ganapathy, V.; Modiri-Delshad, M.; Mirtaheri, A. Optimization of Micro-Grid System Using MOPSO. Renew. Energy 2014, 71, 295–306. [Google Scholar] [CrossRef]
- Ramli, M.A.M.; Bouchekara, H.R.E.H.; Alghamdi, A.S. Optimal Sizing of PV/Wind/Diesel Hybrid Microgrid System Using Multi-Objective Self-Adaptive Differential Evolution Algorithm. Renew. Energy 2018, 121, 400–411. [Google Scholar] [CrossRef]
- Bouchekara, H.R.E.H.; Javaid, M.S.; Shaaban, Y.A.; Shahriar, M.S.; Ramli, M.A.M.; Latreche, Y. Decomposition Based Multiobjective Evolutionary Algorithm for PV/Wind/Diesel Hybrid Microgrid System Design Considering Load Uncertainty. Energy Rep. 2021, 7, 52–69. [Google Scholar] [CrossRef]
- Rouhani, A.; Jabbari, M.; Honarmand, S. A Teaching Learning Based Optimization for Optimal Design of a Hybrid Energy System. Int. J. Electr. Comput. Energ. Electron. Commun. Eng. 2015, 9, 737–744. [Google Scholar]
- Katsigiannis, Y.A.; Georgilakis, P.S. Optimal Sizing of Small Isolated Hybrid Power Systems Using Tabu Search. J. Optoelectron. Adv. Mater. 2008, 10, 1241. [Google Scholar]
- Ekren, O.; Ekren, B.Y. Size Optimization of a PV/Wind Hybrid Energy Conversion System with Battery Storage Using Simulated Annealing. Appl. Energy 2010, 87, 592–598. [Google Scholar] [CrossRef]
- Sanajaoba, S.; Fernandez, E. Maiden Application of Cuckoo Search Algorithm for Optimal Sizing of a Remote Hybrid Renewable Energy System. Renew. Energy 2016, 96, 1–10. [Google Scholar] [CrossRef]
- Hatata, A.Y.; Osman, G.; Aladl, M.M. An Optimization Method for Sizing a Solar/Wind/Battery Hybrid Power System Based on the Artificial Immune System. Sustain. Energy Technol. Assess. 2018, 27, 83–93. [Google Scholar] [CrossRef]
- Gaabour, A.; Metatla, A.; Kelaiaia, R.; Bourennani, F.; Kerboua, A.; Kerboua Akerboua, A. Recent Bibliography on the Optimization of Multi-Source Energy Systems. Arch. Comput. Methods Eng. 2019, 26, 809–830. [Google Scholar] [CrossRef]
- Sinha, S.; Chandel, S.S. Review of Software Tools for Hybrid Renewable Energy Systems. Renew. Sustain. Energy Rev. 2014, 32, 192–205. [Google Scholar] [CrossRef]
- Emad, D.; El-Hameed, M.A.; Yousef, M.T.; El-Fergany, A.A. Computational Methods for Optimal Planning of Hybrid Renewable Microgrids: A Comprehensive Review and Challenges. Arch. Comput. Methods Eng. 2019, 27, 1297–1319. [Google Scholar] [CrossRef]
- Wang, R.; Li, G.; Ming, M.; Wu, G.; Wang, L. An Efficient Multi-Objective Model and Algorithm for Sizing a Stand-Alone Hybrid Renewable Energy System. Energy 2017, 141, 2288–2299. [Google Scholar] [CrossRef]
- Zhao, F.; Zhao, L.; Wang, L.; Song, H. A Collaborative LSHADE Algorithm with Comprehensive Learning Mechanism. Appl. Soft Comput. J. 2020, 96, 106609. [Google Scholar] [CrossRef]
- Saha, S.; Saini, G.; Chauhan, A.; Upadhyay, S.; Madurai Elavarasan, R.; Hossain Lipu, M.S. Optimum Design and Techno-Socio-Economic Analysis of a PV/Biomass Based Hybrid Energy System for a Remote Hilly Area Using Discrete Grey Wolf Optimization Algorithm. Sustain. Energy Technol. Assess. 2023, 57, 103213. [Google Scholar] [CrossRef]
- Zhang, Q.; Li, H. MOEA/D: A Multiobjective Evolutionary Algorithm Based on Decomposition. IEEE Trans. Evol. Comput. 2007, 11, 712–731. [Google Scholar] [CrossRef]
- Li, K. Decomposition Multi-Objective Evolutionary Optimization: From State-of-the-Art to Future Opportunities. arXiv 2021, arXiv:2108.09588. [Google Scholar] [CrossRef]
- Giagkiozis, I.; Fleming, P.J. Methods for Multi-Objective Optimization: An Analysis. Inf. Sci. 2015, 293, 338–350. [Google Scholar] [CrossRef]
- Wang, R.; Zhang, Q.; Zhang, T. Decomposition-Based Algorithms Using Pareto Adaptive Scalarizing Methods. IEEE Trans. Evol. Comput. 2016, 20, 821–837. [Google Scholar] [CrossRef]
- Wang, R.; Zhang, Q.; Zhang, T. Pareto Adaptive Scalarising Functions for Decomposition Based Algorithms. In Proceedings of the Evolutionary Multi-Criterion Optimization: 8th International Conference, Guimarães, Portugal, 29 March–1 April 2015; pp. 248–262. [Google Scholar]
- Jiang, S.; Yang, S.; Wang, Y.; Liu, X. Scalarizing Functions in Decomposition-Based Multiobjective Evolutionary Algorithms. IEEE Trans. Evol. Comput. 2018, 22, 296–313. [Google Scholar] [CrossRef]
- Yang, S.; Jiang, S.; Jiang, Y. Improving the Multiobjective Evolutionary Algorithm Based on Decomposition with New Penalty Schemes. Soft Comput. 2017, 21, 4677–4691. [Google Scholar] [CrossRef]
- Sato, H. Analysis of Inverted PBI and Comparison with Other Scalarizing Functions in Decomposition Based MOEAs. J. Heuristics 2015, 21, 819–849. [Google Scholar] [CrossRef]
- Sato, H. Inverted PBI in MOEA/D and Its Impact on the Search Performance on Multi and Many-Objective Optimization. In Proceedings of the 2014 Annual Conference on Genetic and Evolutionary Computation, Vancouver, BC, Canada, 12–16 July 2014; ACM: New York, NY, USA, 2014; pp. 645–652. [Google Scholar]
- Wu, M.; Li, K.; Kwong, S.; Zhang, Q.; Zhang, J. Learning to Decompose: A Paradigm for Decomposition-Based Multiobjective Optimization. IEEE Trans. Evol. Comput. 2019, 23, 376–390. [Google Scholar] [CrossRef]
- Bernal-Agustín, J.L.; Dufo-López, R.; Rivas-Ascaso, D.M. Design of Isolated Hybrid Systems Minimizing Costs and Pollutant Emissions. Renew. Energy 2006, 31, 2227–2244. [Google Scholar] [CrossRef]
- Justus, C.G. Wind Energy Statistics for Large Arrays of Wind Turbines (New England and Central U.S. Regions). Sol. Energy 1978, 20, 379–386. [Google Scholar] [CrossRef]
- Farrugia, R.N. The Wind Shear Exponent in a Mediterranean Island Climate. Renew. Energy 2003, 28, 647–653. [Google Scholar] [CrossRef]
- Jaramillo, O.A.; Borja, M.A. Wind Speed Analysis in La Ventosa, Mexico: A Bimodal Probability Distribution Case. Renew. Energy 2004, 29, 1613–1630. [Google Scholar] [CrossRef]
- Bañuelos-Ruedas, F.; Angeles-Camacho, C.; Rios-Marcuello, S. Analysis and Validation of the Methodology Used in the Extrapolation of Wind Speed Data at Different Heights. Renew. Sustain. Energy Rev. 2010, 14, 2383–2391. [Google Scholar] [CrossRef]
- Bechrakis, D.A.; Sparis, P.D. Simulation of the Wind Speed at Different Heights Using Artificial Neural Networks. Wind Eng. 2000, 24, 127–136. [Google Scholar] [CrossRef]
- Patel, M.R. Wind and Solar Power Systems: Design, Analysis, and Operation; Taylor & Francis: Oxfordshire, UK, 2006; ISBN 9780849315701. [Google Scholar]
- IEC International Standard 61400-1; Wind Turbines—Part 1: Design Requirements. IEC International Standard: Geneva, Switzerland, 2005.
- IEC International Standard. Wind Energy Generation Systems-Part 3-1: Design Requirements for Fixed Offshore Wind Turbines; International Electrotechnical Commission: Geneva, Switzerland, 2019; ISBN 978-2-8322-6600-7. [Google Scholar]
- Yue, X.; Zhang, J.; Dong, Y.; Chen, Y.; Shi, Z.; Xu, X.; Li, X.; Liang, Z. Reversible Li Plating on Graphite Anodes through Electrolyte Engineering for Fast-Charging Batteries. Angew. Chem. Int. 2023, 62, e202302285. [Google Scholar] [CrossRef] [PubMed]
- Hossain Lipu, M.S.; Ansari, S.; Miah, M.S.; Hasan, K.; Meraj, S.T.; Faisal, M.; Jamal, T.; Ali, S.H.M.; Hussain, A.; Muttaqi, K.M.; et al. A Review of Controllers and Optimizations Based Scheduling Operation for Battery Energy Storage System towards Decarbonization in Microgrid: Challenges and Future Directions. J. Clean. Prod. 2022, 360, 132188. [Google Scholar] [CrossRef]
- Wang, L.; Singh, C. PSO-Based Multi-Criteria Optimum Design of a Grid-Connected Hybrid Power System with Multiple Renewable Sources of Energy. In Proceedings of the 2007 IEEE Swarm Intelligence Symposium, SIS 2007, Honolulu, HI, USA, 1–5 April 2007; pp. 250–257. [Google Scholar]
- Korpaas, M.; Holen, A.T.; Hildrum, R. Operation and Sizing of Energy Storage for Wind Power Plants in a Market System. Int. J. Electr. Power Energy Syst. 2003, 25, 599–606. [Google Scholar] [CrossRef]
- El-Hefnawi, S.H. Photovoltaic Diesel-Generator Hybrid Power System Sizing. Renew. Energy 1998, 13, 33–40. [Google Scholar] [CrossRef]
- Ashari, M.; Nayar, C.V. An Optimum Dispatch Strategy Using Set Points for a Photovoltaic (PV)-Diesel-Battery Hybrid Power System. Sol. Energy 1999, 66, 1–9. [Google Scholar] [CrossRef]
- Skarstein, Ø.; Uhlen, K. Design Considerations with Respect to Long-Term Diesel Saving in Wind/Diesel Plants. Wind Eng. 1989, 13, 72–87. [Google Scholar]
- Azoumah, Y.; Yamegueu, D.; Ginies, P.; Coulibaly, Y.; Girard, P. Sustainable Electricity Generation for Rural and Peri-Urban Populations of Sub-Saharan Africa: The “Flexy-Energy” Concept. Energy Policy 2011, 39, 131–141. [Google Scholar] [CrossRef]
- Deshmukh, M.K.; Deshmukh, S.S. Modeling of Hybrid Renewable Energy Systems. Renew. Sustain. Energy Rev. 2008, 12, 235–249. [Google Scholar] [CrossRef]
- Diaf, S.; Diaf, D.; Belhamel, M.; Haddadi, M.; Louche, A. A Methodology for Optimal Sizing of Autonomous Hybrid PV/Wind System. Energy Policy 2007, 35, 5708–5718. [Google Scholar] [CrossRef]
- Darras, C.; Sailler, S.; Thibault, C.; Muselli, M.; Poggi, P.; Hoguet, J.C.; Melscoet, S.; Pinton, E.; Grehant, S.; Gailly, F.; et al. Sizing of Photovoltaic System Coupled with Hydrogen/Oxygen Storage Based on the ORIENTE Model. Int. J. Hydrogen Energy 2010, 35, 3322–3332. [Google Scholar] [CrossRef]
- Paniagua Sánchez-Mateos, J. Reliability-Constrained Microgrid Design. Master’s Thesis, KTH School of Electrical Engineering and Computer Science, Stockholm, Sweden, 2016. [Google Scholar]
- Alsaidan, I.; Alanazi, A.; Gao, W.; Wu, H.; Khodaei, A. State-of-the-Art in Microgrid-Integrated Distributed Energy Storage Sizing. Energies 2017, 10, 1421. [Google Scholar] [CrossRef]
- Alsaidan, I.; Khodaei, A.; Gao, W. Determination of Optimal Size and Depth of Discharge for Battery Energy Storage in Standalone Microgrids. In Proceedings of the 2016 North American Power Symposium (NAPS), Denver, CO, USA, 18–20 September 2016. [Google Scholar] [CrossRef]
- Moradzadeh, M.; Abdelaziz, M.M.A. A New MILP Formulation for Renewables and Energy Storage Integration in Fast Charging Stations. IEEE Trans. Transp. Electrif. 2020, 6, 181–198. [Google Scholar] [CrossRef]
- Amini, M.; Khorsandi, A.; Vahidi, B.; Hosseinian, S.H.; Malakmahmoudi, A. Optimal Sizing of Battery Energy Storage in a Microgrid Considering Capacity Degradation and Replacement Year. Electr. Power Syst. Res. 2021, 195, 107170. [Google Scholar] [CrossRef]
- ur Rehman, W.; Bo, R.; Mehdipourpicha, H.; Kimball, J.W. Sizing Battery Energy Storage and PV System in an Extreme Fast Charging Station Considering Uncertainties and Battery Degradation. Appl. Energy 2022, 313, 118745. [Google Scholar] [CrossRef]
- Kaabeche, A.; Belhamel, M.; Ibtiouen, R. Sizing Optimization of Grid-Independent Hybrid Photovoltaic/Wind Power Generation System. Energy 2011, 36, 1214–1222. [Google Scholar] [CrossRef]
- Yang, H.; Zhou, W.; Lu, L.; Fang, Z. Optimal Sizing Method for Stand-Alone Hybrid Solar-Wind System with LPSP Technology by Using Genetic Algorithm. Sol. Energy 2008, 82, 354–367. [Google Scholar] [CrossRef]
- Rajkumar, R.K.; Ramachandaramurthy, V.K.; Yong, B.L.; Chia, D.B. Techno-Economical Optimization of Hybrid Pv/Wind/Battery System Using Neuro-Fuzzy. Energy 2011, 36, 5148–5153. [Google Scholar] [CrossRef]
- Wu, M.; Li, K.; Kwong, S.; Zhang, Q. Evolutionary Many-Objective Optimization Based on Adversarial Decomposition. IEEE Trans. Cybern. 2020, 50, 753–764. [Google Scholar] [CrossRef]
- Ming, M.; Wang, R.; Zha, Y.; Zhang, T. Pareto Adaptive Penalty-Based Boundary Intersection Method for Multi-Objective Optimization. Inf. Sci. 2017, 414, 158–174. [Google Scholar] [CrossRef]
- Singh, H.K.; Deb, K. Investigating the Equivalence between PBI and AASF Scalarization for Multi-Objective Optimization. Swarm Evol. Comput. 2020, 53, 100630. [Google Scholar] [CrossRef]
- Rehman, S. Prospects of Wind Farm Development in Saudi Arabia. Renew. Energy 2005, 30, 447–463. [Google Scholar] [CrossRef]
- Rehman, S.; Ahmad, A. Assessment of Wind Energy Potential for Coastal Locations of the Kingdom of Saudi Arabia. Energy 2004, 29, 1105–1115. [Google Scholar] [CrossRef]
- Ramli, M.A.M.; Hiendro, A.; Al-Turki, Y.A. Techno-Economic Energy Analysis of Wind/Solar Hybrid System: Case Study for Western Coastal Area of Saudi Arabia. Renew. Energy 2016, 91, 374–385. [Google Scholar] [CrossRef]
- Alaidroos, A.; He, L.; Krarti, M. Feasibility of Renewable Energy Based Distributed Generations in Yanbu, Saudi Arabia. In Proceedings of the World Renewable Energy Forum, WREF 2012, Including World Renewable Energy Congress XII and Colorado Renewable Energy Society (CRES) Annual Conference, Denver, CO, USA, 13–17 May 2012; Volume 5, pp. 3826–3833. [Google Scholar]
Disclaimer/Publisher’s Note: The statements, opinions and data contained in all publications are solely those of the individual author(s) and contributor(s) and not of MDPI and/or the editor(s). MDPI and/or the editor(s) disclaim responsibility for any injury to people or property resulting from any ideas, methods, instructions or products referred to in the content. |
© 2023 by the authors. Licensee MDPI, Basel, Switzerland. This article is an open access article distributed under the terms and conditions of the Creative Commons Attribution (CC BY) license (https://creativecommons.org/licenses/by/4.0/).

