Article

Enhancement of CO2 Absorption Process Using High-Frequency Ultrasonic Waves

1
CO2 Research Center (CO2RES), Chemical Engineering Department, Universiti Teknologi PETRONAS, Bandar Seri Iskandar 32610, Malaysia
2
Carbon Capture, Utilization & Storage (CCUS) R&D Department, PETRONAS Research Sdn Bhd, Jalan Ayer Itam, Kawasan Institusi Bangi, Kajang 43000, Malaysia
3
German Malaysian Institute, Jalan Ilmiah, Kajang 43000, Malaysia
*
Author to whom correspondence should be addressed.
Sustainability 2023, 15(14), 11064; https://doi.org/10.3390/su151411064
Submission received: 12 May 2023 / Revised: 5 June 2023 / Accepted: 8 June 2023 / Published: 14 July 2023

Abstract

:
The advancement of efficient carbon capture technology is vital for the transition to a net-zero carbon future. Critical developments in ultrasonic irradiation can be used to enhance the conventional CO2 absorption process. For example, sonophysical effects such as acoustic streaming, acoustic cavitation, acoustic fountain and atomization induced by the propagation of high-frequency ultrasonic waves in a liquid medium can enhance the mixing and create a larger interfacial area for gas–liquid mass transfer. In this study, the performance of a continuous ultrasonic-assisted CO2 absorption process using MDEA was investigated. The design of experiment (DOE) was used to study the effect of the gas flowrate, liquid flowrate and ultrasonic power on CO2 absorption performance. Based on the findings, ultrasonic power was the most significant parameter affecting the CO2 outlet concentration, liquid-to-gas ratio (L/G) and mass transfer coefficient (KGa), which confirmed that ultrasonic irradiation has a significant impact on the intensification of the CO2 absorption process. The optimum condition to achieve the target CO2 absorption performance was numerically determined and validated with experimental tests. The results from the verification runs were in good agreement with the predicted values, and the average error was less than 10%.

Graphical Abstract

1. Introduction

Recently, the term sustainability has been broadly used in programs, initiatives and actions to preserve particular resource areas such as human, social, economic and environmental areas. These are also known as the four pillars of sustainability. Environmental sustainability, as described by the United Nations (UN), is meeting the needs of the present without compromising the ability of future generations to meet their own needs [1]. Environmental sustainability is essential to preserve natural resources such as clean water, air and wildlife for future generations. Based on this concept, industrial development shall result in positive economic outcomes without harming the environment for short- or long-term applications.
Nevertheless, the greenhouse gases (GHGs) released into the atmosphere during industrialization and urbanization has been increasing yearly and contributing to global warming issues and climate change. Other environmental issues due to excess GHGs in the atmosphere include increasing seawater levels, the melting of ice sheets and glaciers, oceanic storms, species extinction and the disturbance of ecosystems [2]. Total global GHGs emissions between 2010 and 2019 have averaged around 54.4 gigatons of CO2 equivalent, with about 14 gigatons (26%) coming from industrial applications [3]. Carbon capture, utilization and storage (CCUS) are one of the potential solutions that can overcome this climate change issue [4,5]. It is a promising pathway to decarbonize fossil-based power and industrial sectors to sustainably transition to a net-zero emission energy future [2]. An analysis conducted by the Intergovernmental Panel on Climate Change (IPCC) and the International Energy Agency (IEA) has shown that it is impossible to achieve “Net Zero” by 2050 without CCUS [4]. Currently, CCUS technologies are costly and energy intensive, which hinders their commercialization despite decades of developments. Therefore, intentions to improve the overall economics of CCUS technology have become the main focal point. However, most of the CO2 conversion and utilization technologies are still in the developing stage [5]. The overall cost for CCUS technology is expected to be $22–80 per tone of CO2 removed by 2025 [2,5].
Carbon capture from industrial applications is one of the critical ways to reduce CO2 emission to the atmosphere and is one of the requirements to meet the Paris Agreement, which is to limit global warming to well below 1.5 °C and to pursue efforts to limit it to 2.0 °C by 2030 [6]. Carbon capture is classified into precombustion capture, postcombustion capture and oxyfuel combustion [2,4,5]. In each of the CO2 capture systems, the type of CO2 separation technologies varies depending on the partial pressure of CO2, the composition of the gas to be treated and the location of the process [2]. The captured CO2 can be further processed into other valuable materials, which is better known as carbon capture and utilization (CCU). Subsequently, if the captured CO2 cannot be utilized directly, it will be transported and permanently stored in the subsurface, which is also known as carbon capture and storage (CCS). In the oil and gas industry, natural gas produced from the field sometimes contains a high concentration of CO2. Therefore, it is essential to handle the excess CO2 without damaging the natural environment. Natural gas containing high concentrations of CO2 needs to be treated through the gas sweetening process to meet the pipeline quality, meet the calorific values of the sales gas and avoid crystallization during the liquefaction process [7,8]. The gas sweetening process ensures the treated natural gas can be transported through the pipelines and further processed into valuable products through the downstream process. The captured CO2 is usually injected back into the field or any depleted field nearby for offshore operation [9].
Currently, natural gas sweetening processes are carried out by traditional amine absorption systems followed by thermal regeneration by using high-pressure packed towers and bubble columns [8,10,11,12,13]. The chemical absorption technology exhibits a high separation efficiency (>90%) with minimal hydrocarbon loss. It can remove the CO2 concentration to a deficient trace level. It also exhibits a high separation efficiency in removing CO2 at relatively low pressure conditions [2].
The efficiency of the absorption process is mainly driven by the chemical reaction between the CO2 and solvents. Several types of solvents have been reported in the literature, but amine-based solvents such as monoethanolamine (MEA), diethanolamine (DEA), N-methyldiethanolamine (MDEA), diglycolamine (DGA), di-2-propanolamine (DIPA) and 2-amino-2-methyl-1-propanol (AMP) are typically used in the industry for CO2 removal due to its high reaction rate [14,15]. In this process, the CO2 reacts with the amine solvent through an exothermic reversible reaction to form a soluble carbonate salt. The CO2 can be released when the amine solution containing the carbonate salt is heated during the regeneration process in the stripping column. The ability of the amine-based solvent to remove CO2 is highly dependent on the solubility, the reaction rate and the mass transfer properties [16]. The composition of these amine-based solvents is continuously changed in industrial applications to optimize the CO2 removal efficiency.
Although chemical absorption technology using packed towers and bubble columns as contactors have been used in industries for decades, several disadvantages are observed. For example, high equipment corrosion rates, flooding at high flowrates, unloading at low flowrates, channeling, foaming and amine degradation issues lead to difficulties in mass transfer between gas and liquid [14,17,18,19]. The process is also energy intensive to regenerate a large amount of solvent [20]. Additionally, it is known for its bulky size and excessive equipment tonnage, making the technology unfavorable for offshore operations [12,21,22].
Ultrasonic irradiation is one of the methods that can be used to enhance the gas–liquid mass transfer and further intensify the CO2 absorption process. The propagation of ultrasound waves in a liquid medium will generate sonophysical and sonochemistry effects such as acoustic streaming, acoustic cavitation, acoustic fountain and atomization that can enhance mixing, promote the formation of radicals and increase the surface area for mass transfer to occur, which will lead to a higher removal efficiency. By having a higher removal efficiency, the overall size and weight of an absorber can be further reduced. Additionally, some of the ultrasound waves will be converted to heat energy that will give a heating effect to the liquid medium. The heating effect will help to reduce the energy needed to preheat the solvent for the absorption process. Figure 1 shows the fluid motion induced by high-frequency ultrasonic irradiation in a liquid medium.
Experimental works on batch systems have been executed to study the effect of operating parameters on the enhancement of the ultrasonic-assisted gas–liquid mass transfer process, such as the effect of ultrasonic frequency, power, sonicated liquid height and volume and distance of ultrasonic transducer [24,25,26,27,28,29,30,31,32,33]. The experimental study on batch systems was conducted to investigate the fundamental theories of high-frequency ultrasonic waves on the absorption process. Generally, from the batch system experimental study, the gas–liquid mass transfer coefficient was found to increase with the increase in ultrasonic power but decrease with the increase in sonicated liquid height, volume and distance from the ultrasonic transducer [23]. However, industrial applications are operated in continuous systems for more effective and cost-saving operations than batch systems. Compared to the batch process, the hydrodynamic of the continuous process is highly dependent on the gas and liquid flowrate. The residence time in the continuous process varies according to the gas and liquid flowrate, affecting the absorption performance [34]. Therefore, it is essential to investigate the ultrasonic effect on the CO2 absorption process in the continuous system to provide helpful insight for further improvement.
In this study, the performance of a continuous ultrasonic-assisted absorption process for the removal of CO2 from a binary N2/CO2 feed gas mixture using MDEA as the chemical solvent was explored. The effect of the operating parameters such as the gas flowrate, liquid flowrate and ultrasonic power on the CO2 removal performance was investigated. Finally, the optimum conditions for the ultrasonic-assisted absorption process were determined by using the design of experiment (DOE) approach.

2. Materials and Methods

2.1. Material

Among the amine-based solvents, MDEA is widely used as the solvent to treat the natural gas sweetening process due to its higher absorption capacity, lower regeneration energy, lower degradation rate and less corrosiveness [35,36,37]. In tertiary amines such as MDEA, the reaction with CO2 occurs by the formation of a bicarbonate ion when the CO2 dissolves in water and by the protonation of the amine via the base-catalyzed hydration of CO2 due to the lack of the necessary N-H bond [15,38]. The hydration reaction is slower than the carbamate formation from the direct reaction between the primary and secondary amine with CO2 through the Zwitterion mechanism [15,36,38]. Despite its slower reactivity with CO2 as compared to primary and secondary amines, MDEA is preferred due to its higher loading capacity, which is 1 mole of CO2 per mole of amine [12]. The following chemical reactions occur in an aqueous MDEA solution when CO2 is present [16,35]:
CO 2 + H 2 O HCO 3 + H +
HCO 3 CO 3 2 + H +
H 2 O OH + H +
R R R NH R R R N + H +
where R corresponds to a methyl group and R′ to an ethanol group.
A tertiary amine, methyldietanolamine (MDEA) (supplied by Revlogi Materials), was used in this study. The pure MDEA was diluted with distilled water to achieve a 41–42 wt% concentration. The fresh MDEA solution was then loaded with pure CO2 gas (supplied by Air Products) through the absorption process at 70 barg to achieve a semilean loading of 0.2 mol/mol. The amine concentration and loading were determined using the titration method with 0.5 N hydrochloric acid (HCL) and 0.5 N potassium hydroxide (KOH).
In this study, due to safety reasons, the flammable methane gas, which is the main component in natural gas, was substituted with N2 gas [39]. Additionally, N2 is an inert gas with a solubility lower than CO2; thus, it will not affect the absorption performance [40,41]. For the feed gas, pure CO2 gas (supplied by Air Products) was mixed with pure N2 gas (supplied by Air Products) according to the volumetric flowrate by using the mass flow controller to meet the target composition of 25 vol% CO2. This mixture was used to mimic the composition of natural gas. The feed gas setup was constructed according to the method previously described by Chan et al. [42].

2.2. Titration Method

The amine concentration and loading were determined by using the titration method. For amine concentration determination, the amine samples were titrated with 0.5 N hydrochloric acid (HCl) [43]. A total of 5 g of amine samples were mixed with 95 mL of distilled water and stirred at 400 rpm using a magnetic stirrer. The pH of the solution was measured by using a pH meter (HANNA HI8424 Portable pH meter). The solution was then titrated with 0.5 N HCl until pH 4.5 was achieved. The weight of the amine sample, the pH of the solution before and after titration and the volume of the 0.5 N HCl solution used were recorded. The concentration of the amine solution in wt% was calculated by using the following formula:
( V HCl × N HCl × 11.9163 W s ) = wt %   amine
where V HCl   ( mL ) is the volume of HCl used to titrate the sample in mL, N HCl is the normality of the HCl solution and W s ( g ) is the weight of the sample.
For amine loading determination, the amine samples were titrated with 0.5 N potassium hydroxide (KOH) [43]. A total of 20 g of the amine sample was weighed. Then, 125 mL of methanol, in which the pH was adjusted to 11.2, was prepared by adding a few drops of 0.5 N KOH solution into the methanol solution. The amine sample and pH-adjusted methanol solution were mixed and stirred at 400 rpm by using the magnetic stirrer. The pH of the mixture was measured by using the pH meter (HANNA HI8424 Portable pH meter). The mixture was then titrated with 0.5 N KOH until the pH of the mixture returned to 11.2. The weight of the amine sample, the pH of the mixture before and after titration, and the volume of the 0.5 N KOH used were recorded. The concentration (wt%) of acid gas in the amine solution was determined by using the following formula:
( V KOH W s V KOH , f W s , f ) × N KOH × 4.4 =   wt %   acid   gas
where V KOH   ( mL ) is the volume of KOH used to titrate the sample, V KOH , f   ( mL ) is the volume of KOH used to titrate the fresh solvent, W s , f ( g ) is the weight of the fresh solvent and N KOH is the normality of the KOH solution.
The acid gas loading (mol CO2/mol amine) was calculated based on the amine and acid gas concentration by using Equations (5) and (6):
( wt %   acid   gas   × 2.708 wt %   amine ) = Acid   gas   loading

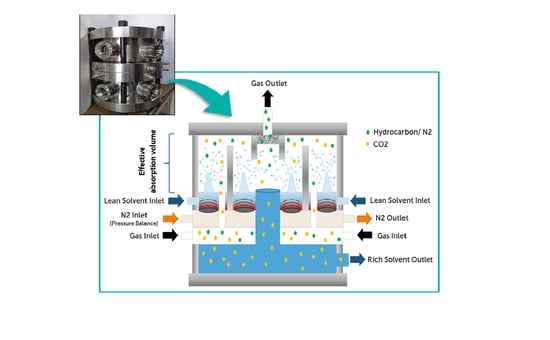
2.3. Lab Scale Setup

An integrated ultrasonic-assisted absorption with a solvent regeneration system pilot test rig was developed to study the effect of operating conditions on the continuous ultrasonic-assisted absorption process for the removal of CO2. The schematic diagram and the actual pilot test rig setup of the integrated system are shown in Figure 2. To the best of our knowledge, no literature to date has reported the development, installation and operation of a pilot-scale ultrasonic-assisted CO2 absorption process using chemical solvents.
The feed gas of 25 vol% CO2 and 75 vol% N2 was premixed into the compressor suction vessel at 20 barg before being compressed to 70 barg into the ultrasonic absorber with a total volume of 2.4 L. The lean amine solvent from the amine tank was preheated to 60 °C by using thermal oil in the shell-tube heat exchanger before being pumped into the ultrasonic absorber by using the high-pressure (HP) amine pump. In the ultrasonic absorber, 32 ultrasonic transducers were used to generate the 1.7 MHz high-frequency ultrasonic waves to enhance the CO2 absorption process. The CO2 composition in the treated gas was analyzed by using the IR analyzer. The rich amine solvent discharged from the ultrasonic absorber was sent to the HP flash vessel (operated at 9 barg) before being heated to 90 °C by using the thermal oil in the shell-tube heat exchanger to regenerate the solvent. The released CO2 gas was flashed out in the low pressure (LP) flash vessel operated at 1 barg and vented to a safe location. The regenerated amine solvent was cooled down by using cooling water in the shell-tube heat exchanger before being recycled into the amine tank. The amine concentration and acid gas loading in the amine solvent were analyzed by using the titration method.

2.4. Design of Experiment (DOE)

The effect of three operating parameters such as the gas flowrate, liquid flowrate and ultrasonic power on the CO2 absorption performance was investigated. The test matrix was developed by using a central composite design (CCD) coupled with response surface methodology (RSM) in the Design Expert v13.0 software. Table 1 shows the parameters and levels in this study. The selected range is based on the capability of the system installed for the testing. A total of 21 runs were generated by using the CCD-RSM method. Three responses were analyzed and optimized, which were the CO2 outlet concentration (mol%); liquid-to-gas ratio (L/G), which is the ratio of the solvent circulation rate whereby the amount of acid gas removed is usually expressed in the unit gallons amine per lbmol of acid gas removed (gal/lbmol CO2); and the overall mass transfer coefficient (KGa) (mol/m3.s.Pa). Based on the experimental results, the optimum conditions for the absorption process were determined.

2.5. Ultrasonic Power Generation

The piezoelectric transducer generates the ultrasound waves. Piezoelectricity is a phenomenon where an electric charge is generated in response to applied mechanical stress on a particular material. Conversely, mechanical displacement can be produced when the electrical field is applied to the material [44,45,46]. In this study, the electric current was applied to the 1.7 MHz piezoelectric transducers made from lead, zirconate, and titanate (PZT) ceramic material. The electric field will distort the crystal and force it to vibrate to produce ultrasonic waves.
The correlation between the total ultrasonic power for 32 units of transducers and the power system voltage is shown in Figure 3. In this work, the testing was conducted at an ultrasonic power of 0 W, 200 W and 400 W. Therefore 0 V, 27 V and 40 V of electricity were supplied by the power system to the ultrasonic transducers to generate the desired ultrasonic power.

2.6. Liquid-to-Gas Ratio (L/G) Determination

The L/G indicates the efficiency of or difficulties with removing the pollutant. In this case, it is the CO2 being removed from natural gas. A higher L/G indicates a less efficient removal rate; therefore, achieving a low L/G in an absorption process is more favorable as it indicates a higher removal efficiency and lower liquid pumping rates. The L/G was determined by:
L G = F L C CO 2
where F L is the liquid flowrate in gal/min and C CO 2 is the amount of CO2 absorbed in lbmol/min. C CO 2 can be determined from the equation
C CO 2 = η × F G × y CO 2 , in × 453.6
where η is the removal efficiency, F G is the inlet gas flowrate in standard liters per minute (SLPM) and y CO 2 , in is the inlet CO2 mol fraction. The removal efficiency was calculated based on the CO2 inlet and outlet concentration as per the equation below [47]:
η = ( y CO 2 , in y CO 2 , out y CO 2 , in ) × 100
where y CO 2 , out is the outlet CO2 mol fraction.

2.7. Mass Transfer Coefficient Determination

The enhancement of the CO2 absorption performance is commonly described as the overall mass transfer coefficient (KGa) derived from the thermodynamics, kinetics and hydrodynamics of the CO2 absorption system [48]. For packed columns, the KGa can be determined by using the following differential equation [48,49]:
K G a = G I P ( y CO 2 , G y CO 2 * ) ( dY CO 2 , G dZ )
where G I is the gas velocity in mol/m2.h; P is the operating pressure in Pa; y CO 2 , G and y CO 2 * are the mole fraction of CO2 in the gas stream and equilibrium mol fraction of CO2, respectively; Y CO 2 , G is the mole ratio of CO2 in the gas stream; and Z is the column height.
In this study, the above differential equation was rewritten in terms of the CO2 concentration entering and leaving the ultrasonic absorber. The mass transfer driving force was replaced by the log mean concentration driving force, as suggested by M. Yusof et al. [34]. The liquid phase was assumed to be well mixed from the acoustic streaming effect and a large amount of solvent in the ultrasonic-assisted absorber. The gas phase composition changes continuously as the amine solvent absorbs the CO2; thus, a log mean concentration driving force should be used as follows [34]:
K G a = F V ( y CO 2 , in y CO 2 , out ) Δ P LM
Δ P LM = P [ ( y CO 2 , in y CO 2 , out ) ln ( y CO 2 , in y CO 2 , out ) ]
where F V is the gas flowrate per unit volume (mol/m3.s) and Δ P LM is the log mean pressure.

3. Results and Discussion

Table 2 shows the test matrix for the 21 experimental runs generated by using the DOE. The results of the three responses included the CO2 outlet concentration, L/G and mass transfer coefficient (KGa). In this study, the target was to reduce the CO2 inlet concentration from 25% to less than 6.5% (to meet the sales gas application), minimize the L/G and maximize the mass transfer coefficient KGa.

3.1. Effect of Operating Condition on CO2 Outlet Concentration

From Table 2, it is observed that the target CO2 outlet concentration (which is less than 6.5%) could only be achieved in Run 5, 16 and 21. These findings show that the operating parameters significantly affect the absorption performance, which is the CO2 outlet concentration from the ultrasonic-assisted absorber. The results of the analysis of variance (ANOVA) for the CO2 outlet response that was obtained during the experiment is shown in Table 3. The ANOVA showed the model’s fitness, the significance of each parameter and their interactions. For a 95% confidence level, the model, parameters and their interactions are considered significant if the p-value is less than 0.05.
Based on Table 3, the reduced quadratic model significantly predicted the CO2 outlet response, with a predicted R2 value of 0.9905. The lack of fit was insignificant since its p-value was more than 0.05. A, B, C, AC, BC and A2 were the most significant terms in the model. The other terms that were not significant, which had a p-value of more than 0.05, were removed from the model to improve the prediction accuracy. The reduced quadratic model in terms of the actual factors suggested by the DOE software (Design Expert v13.0) for the prediction of the CO2 outlet response is as follows:
CO 2   Outlet   ( mol % ) = 15.93 + 2.95 F G 0.9414 F L 5.62 C + 1.40 AP US 0.7277 ( F L P US ) 1.31 F G 2
The F-value in Table 3 shows that the ultrasonic power was the most significant parameter since it had the highest F-value, followed by the gas flowrate and the gas flowrate and ultrasonic power interactions. Even though the liquid flowrate was less significant as compared to the other parameters, it still had a significant impact on the CO2 outlet concentration as the p-value for the factor was less than 0.05.
Figure 4 shows the contour of the CO2 outlet response for the two most significant factors, which were the ultrasonic power and gas flowrate at the highest liquid flowrate. It was observed that the CO2 outlet was reduced by 83% as the ultrasonic power increased from 0 W to 400 W due to the higher sonophysical enhancement such as the acoustic streaming and acoustic fountain that led to better mixing, further reduced the liquid film resistance and produced more interfacial area for mass transfer to occur [34,50,51]. The increase in the gas flowrate from 20 SLPM to 40 SLPM reduced the absorption efficiency and increased the CO2 outlet concentration by four times compared with the sale gas specification (6.5%). This is because the reaction rate of tertiary amines such as MDEA is slower than the primary and secondary alkanolamines; thus, the increase in the gas flowrate will reduce the residence time for the absorption process.
Figure 5 shows the interaction between the gas flowrate and liquid flowrate for the CO2 outlet response at 400 W ultrasonic power. The target CO2 outlet concentration of less than 6.5 mol% could only be achieved at the lowest gas flowrate (20 SLPM). The increase in the liquid flowrate from 0.2–0.5 SLPM further improved the ultrasonic-assisted absorption process by 54% as a higher liquid flowrate induced higher turbulence and subsequently reduced the liquid film resistance. Therefore, a higher liquid flowrate was preferred for the absorption process enhancement [43].

3.2. Effect of Operating Condition on L/G

Based on Table 2, the L/G response was in the range of 122–919.3 gal/lbmol. The ANOVA table for the L/G response is shown in Table 4. From Table 4, the reduced two-factors interaction (2FI) model was significant at predicting the L/G response with a predicted R2 value of 0.9904. The lack of fit was found to be not significant since its p-value was more than 0.05. A, B, C, AB and BC were the significant terms in the model, with a p-value of less than 0.05. The reduced 2FI model in terms of the actual factors suggested by the DOE analysis for the prediction of the L/G response was as follows:
L G ( gal lbmol ) = 325.22 20.02 F G + 117.33 F L 125.42 P US 11.79 ( F G F L ) 48.75 BP US
From the F-value in Table 4, it was found that the ultrasonic power was the most significant parameter that affected the L/G response, followed by the liquid flowrate and the interactions between the liquid flowrate and ultrasonic power. Even though the gas flowrate was less significant than the other parameters when it came to influencing the L/G response, it was still significant as the p-value was less than 0.05.
Figure 6 shows the contour of the L/G response for the two most significant factors, which were the ultrasonic power and liquid flowrate. A lower L/G was preferred for the ultrasonic-assisted absorption process because it contributed to lower solvent circulation rates, which led to lower solvent pumping and heater power consumption for amine regeneration. Based on the figure, the L/G was 55% lower as the ultrasonic power increased from 0 W to 400 W due to the sonophysical and sonochemistry effect from ultrasonic irradiation. This shows that absorption with ultrasonic irradiation had a higher removal efficiency than absorption without an ultrasound.
The sensitivity of the L/G towards the liquid flowrate and ultrasonic power is shown in Figure 7. From Figure 7, the lower L/G could be achieved at a lower liquid flowrate due to less solvent being pumped into the absorber. However, at a constant liquid flowrate, the increase in the ultrasonic power from 0 to 400 W significantly reduced the L/G due to more CO2 absorption, indicating a higher removal efficiency under ultrasonic irradiation. The CO2 removal enhancement by ultrasonic irradiation was more substantial at a higher liquid flowrate. At a 0.2 SLPM liquid flowrate, the increase in the ultrasonic power from 0 to 400 W led to a 55% L/G reduction, while at a 0.5 SLPM liquid flowrate, the L/G reduction was 59%. This shows that CO2 absorption into the MDEA solvent with ultrasonic irradiation was better than the absorption process without it, as it allowed more CO2 to be absorbed into the MDEA solvent even at a lower liquid flowrate.
Figure 8 shows the effect of the gas flowrate and ultrasonic power on the L/G response at 0.5 SLPM of the liquid flowrate. The increase in the gas flowrate generally introduced more CO2 molecules into the absorber. However, due to the slow kinetic reaction between the CO2 and MDEA solvent, the increase in the gas flowrate did not significantly improve the absorption performance. Sonophysical and sonochemistry enhancement by ultrasonic irradiation significantly impacted the L/G reduction; however, it did not significantly improve the chemical reaction rate as it was still limited by the gas holdup and residence time in the absorber.

3.3. Effect of Operating Conditions on Mass Transfer Coefficient, KGa

In Table 2, the response for the mass transfer coefficient, KGa, from the experimental runs was between 1.64 × 10⁻⁷–1.97 × 10⁻⁶ mol/m3.s.Pa. The ANOVA table for the KGa response is shown in Table 5. The reduced quadratic model was significantly predicted the KGa response with a predicted R2 of 0.9977. The lack of fit was insignificant since the p-value was more than 0.05. A, B, C, AB, AC, BC, B2 and C2 were the significant terms in the model with a p-value less than 0.05. From the F-value in the ANOVA table, ultrasonic power and its quadratic term were the most significant parameters that affected the KGa response, followed by the liquid flowrate. The reduced quadratic model in terms of the actual factor suggested by the DOE software for the prediction of the KGa response is as follows:
K G a ( mol m 3 . s . Pa ) = 6.293 × 10 07 3.039 × 10 08 F G + 2.05 × 10 07 F L + 3.951 × 10 07 P US   1.046 × 10 07 ( F G F L ) 1.475 × 10 07 ( F G P US ) + 1.199 × 10 07 ( F L P US )   + 1.232 × 10 07 F L 2 + 2.179 × 10 07 P US 2
Figure 9 shows the contour of the KGa response for the ultrasonic power and gas flowrate interactions. A higher KGa value indicates a higher absorption efficiency per unit volume for the absorption process. From Figure 9, it was observed that the KGa value increased 2.25 times as the ultrasonic power increased from 0 to 400 W due to the sonophysical and sonochemistry effect that further intensified the CO2 absorption process that has been explained previously. The increase in the gas flowrate did not seem to increase the mass transfer performance since a higher KGa was obtained at a lower gas flowrate. At this condition, it was presumed that the liquid side mass transfer resistance primarily controlled the gas–liquid mass transfer process. Therefore, the reduction in the mass transfer resistance on the gas phase by increasing the gas flowrate did not have a significant impact on the absorption performance [52]. The amount of CO2 absorbed into the MDEA solvent was limited by molecular diffusion, regardless of the gas load at the feed gas stream.
This can be further explained by Figure 10. At a constant gas flowrate of 20 SLPM, the increase in the liquid flowrate will further enhance the CO2 removal efficiency and increase the mass transfer coefficient KGa. This is because increasing the liquid flowrate will introduce more turbulence on the liquid side and reduce the mass transfer resistance on the liquid side. Furthermore, a higher liquid flowrate will increase the number of amine molecules in the absorber and improve the absorption capacity of the solvent [52]. A higher liquid flowrate also will increase the velocity of the solvent, which will help to keep the concentration gradient of the CO2 in the solvent low and enhance the rate of diffusion and CO2 removal rate. The presence of ultrasonic irradiation further enhances the CO2 removal rate because the acoustic fountain and streaming phenomena will enhance the gas–liquid mixing and increase the interfacial area for mass transfer to occur. This effect is clearly shown as the KGa increased almost three times as the ultrasonic power increased from 0 to 400 W at a liquid flowrate of 0.5 LPM and gas flowrate of 20 SLPM.

3.4. Ultrasonic-Assisted CO2 Absorption Process Optimization

The operating conditions under the current study showed a significant effect on the continuous ultrasonic-assisted CO2 absorption performance. The optimum condition for the ultrasonic-assisted CO2 absorption process was determined by using the response surface methodology (RSM) numerical optimization feature of the Design Expert v13.0 software. The optimization criteria and the desired goal for process optimization are shown in Table 6. Based on the criteria, 70 solutions were proposed, and the solution with the highest desirability of 0.808 was chosen. The selected optimized condition was the gas flowrate of 20 SLPM, liquid flowrate of 0.2 LPM and ultrasonic power of 400 W. The predicted responses at this optimum condition are shown in Figure 11.
Verification runs were conducted to verify the proposed optimized condition by the software, and the results for the CO2 outlet, L/G and KGa are shown in Figure 12, Figure 13 and Figure 14, respectively. The experimental values were compared with the predicted values by the software. For the CO2 outlet response, the average error was 2.6%, and the standard deviation was 0.153. These findings showed a good agreement between the experimental data and the predicted values. Similar to the L/G response, good agreements between the actual experimental data and the predicted values were observed with an average error of 0.66% and a standard deviation of 1.12. For the KGa, the actual experimental data were slightly higher than the predicted value, as shown in Figure 14. The average error between the experimental data and the predicted value was 9.84%, with a standard deviation of 2.11 × 10⁻⁸. All three responses agreed well with the predicted values; therefore, the optimum condition suggested by the software was considered valid and reliable.

4. Conclusions

In this work, the effect of operating parameters such as the gas flowrate, liquid flowrate and ultrasonic power on the CO2 outlet, L/G and KGa were investigated. Based on the ANOVA analysis, ultrasonic power was the most significant parameter affecting the overall ultrasonic-assisted CO2 absorption process performance. This justifies that ultrasonic irradiation showed significant enhancement to the gas–liquid mass transfer as compared to the process without an ultrasound. A process optimization study was conducted to find the optimum operating parameters for the ultrasonic-assisted CO2 absorption process using the DOE. The proposed optimum condition to achieve the target CO2 outlet of 6.5% with minimum L/G and maximum KGa was at a 20 SLPM gas flowrate, 0.2 LPM liquid flowrate and 400 W ultrasonic power. The results from verification runs showed a good agreement with the predicted values; therefore, the optimum condition suggested by the DOE software is considered valid and reliable.
However, this optimization is limited to the MDEA solvent only. Other alkanolamine and acoustic solvents with different kinetic reaction rates with CO2 might have dissimilar optimized conditions in the ultrasonic-assisted CO2 absorption system. Since ultrasonic power was the most significant parameter affecting the CO2 absorption performance, identifying the optimum ultrasonic power that can provide significant gas–liquid mass transfer enhancement and simultaneously be economical for the operation is crucial. As a way forward, further studies on ultrasonic power optimization and technoeconomic analysis for this intensification process is recommended for future improvement.

Author Contributions

Conceptualization, A.M.T. and K.K.L.; methodology, A.M.T.; software, A.M.T.; validation, A.M.T. and S.M.M.Y.; formal analysis, A.M.T., S.M.M.Y., N.A. and S.Z.; investigation, A.M.T., S.M.M.Y. and S.Z.; writing—original draft preparation, A.M.T.; writing—review and editing, A.M.T., K.K.L. and U.P.; visualization, A.M.T.; supervision, K.K.L. All authors have read and agreed to the published version of the manuscript.

Funding

This research was funded by the PETRONAS Research Fund and YUTP-PRG Research grant (015PBC-013).

Institutional Review Board Statement

Not applicable.

Informed Consent Statement

Not applicable.

Data Availability Statement

Not applicable.

Acknowledgments

This work was technically supported by Universiti Teknologi PETRONAS and PETRONAS Research Sdn Bhd under the Master Research Agreement.

Conflicts of Interest

The authors declare no conflict of interest. The funders had no role in the design of the study; in the collection, analyses or interpretation of data; in the writing of the manuscript; or in the decision to publish the results.

References

  1. Patterson, N. What Is Environmental Sustainability? Goals with Examples. In South. New Hampsh. Univ. 2022. Available online: https://www.snhu.edu/about-us/newsroom/stem/what-is-environmental-sustainability#:~:text=WhatistheMeaningof,tomeettheirownneeds (accessed on 3 May 2023).
  2. Dziejarski, B.; Krzyżyńska, R.; Andersson, K. Current status of carbon capture, utilization, and storage technologies in the global economy: A survey of technical assessment. Fuel 2023, 342, 127776. [Google Scholar] [CrossRef]
  3. United Nations. Emissions Gap Report 2022: The Closing Window; United Nations Environment Programme: Nairobi, Kenya, 2022. [Google Scholar]
  4. Lin, Q.; Zhang, X.; Wang, T.; Zheng, C.; Gao, X. Technical Perspective of Carbon Capture, Utilization, and Storage. Engineering 2022, 14, 27–32. [Google Scholar] [CrossRef]
  5. Hasan, M.M.F.; Zantye, M.S.; Kazi, M.K. Challenges and opportunities in carbon capture, utilization and storage: A process systems engineering perspective. Comput. Chem. Eng. 2022, 166, 107925. [Google Scholar] [CrossRef]
  6. Gabrielli, P.; Gazzani, M.; Mazzotti, M. The Role of Carbon Capture and Utilization, Carbon Capture and Storage, and Biomass to Enable a Net-Zero-CO2 Emissions Chemical Industry. Ind. Eng. Chem. Res. 2020, 59, 7033–7045. [Google Scholar] [CrossRef] [Green Version]
  7. Isa, F.; Suleman, H.; Zabiri, H.; Maulud, A.S.; Ramasamy, M.; Tufa, L.D.; Shariff, A.M. An overview on CO2 removal via absorption: Effect of elevated pressures in counter-current packed column. J. Nat. Gas Sci. Eng. 2016, 33, 666–677. [Google Scholar] [CrossRef]
  8. George, G.; Bhoria, N.; Alhallaq, S.; Abdala, A.; Mittal, V. Polymer membranes for acid gas removal from natural gas. Sep. Purif. Technol. 2016, 158, 333–356. [Google Scholar] [CrossRef]
  9. Solbraa, E. Carbon Capture and Storage Experiences From the Sleipner Field. In Distillation Absorption; Technische Universiteit Eindhoven: Eindhoven, The Netherlands, 2010; pp. 43–48. [Google Scholar]
  10. Faiz, R.; Li, K.; Al-marzouqi, M. H2S absorption at high pressure using hollow fibre membrane contactors. Chem. Eng. Process. 2014, 83, 33–42. [Google Scholar] [CrossRef]
  11. Brau, J.; Neveux, T.; Louis-louisy, M. Assessment of amine solvent flexibility in the OCTAVIUS project. Energy Procedia 2017, 114, 1366–1379. [Google Scholar] [CrossRef]
  12. Yu, C.; Huang, C.; Tan, C. A Review of CO2 Capture by Absorption and Adsorption. Aerosol Air Qual. Res. 2012, 12, 745–769. [Google Scholar] [CrossRef] [Green Version]
  13. Norouzbahari, S.; Shahhosseini, S.; Ghaemi, A. CO2 chemical absorption into aqueous solutions of piperazine: Modeling of kinetics and mass transfer rate. J. Nat. Gas Sci. Eng. 2015, 26, 1059–1067. [Google Scholar] [CrossRef]
  14. Lin, S.; Chiang, P.; Hsieh, C.; Li, M.; Tung, K. Absorption of carbon dioxide by the absorbent composed of piperazine and 2-amino-2-methyl-1-propanol in PVDF membrane contactor. J. Chin. Inst. Chem. Eng. 2008, 39, 13–21. [Google Scholar] [CrossRef]
  15. Vega, F.; Cano, M.; Camino, S.; Fernández, L.M.G.; Portillo, E.; Navarrete, B. Solvents for Carbon Dioxide Capture. In Carbon Dioxide Chemistry Capture Oil Recover; IntechOpen Limited: London, UK, 2018. [Google Scholar] [CrossRef] [Green Version]
  16. Huttenhuis, P.J.G.; Agrawal, N.J.; Hogendoorn, J.A.; Versteeg, G.F. Gas solubility of H2S and CO2 in aqueous solutions of N-methyldiethanolamine. J. Pet. Sci. Eng. 2007, 55, 122–134. [Google Scholar] [CrossRef] [Green Version]
  17. Sea, B.; Park, Y.; Lee, K. Comparison of Porous Hollow Fibers as a Membrane Contactor for Carbon Dioxide Absorption. J. Ind. Eng. Chem. 2002, 8, 290–296. [Google Scholar]
  18. Yeon, S.; Lee, K.; Sea, B.; Park, Y.; Lee, K. Application of pilot-scale membrane contactor hybrid system for removal of carbon dioxide from flue gas. J. Memb. Sci. 2005, 257, 156–160. [Google Scholar] [CrossRef]
  19. deMontigny, D.; Tontiwachwuthikul, P.; Chakma, A. Comparing the Absorption Performance of Packed Columns and Membrane Contactors. Ind. Eng. Chem. Res. 2005, 44, 5726–5732. [Google Scholar] [CrossRef]
  20. Dindore, V.Y.; Brilman, D.W.F.; Feron, P.H.M.; Versteeg, G.F. CO2 absorption at elevated pressures using a hollow fiber membrane contactor. J. Memb. Sci. 2004, 235, 99–109. [Google Scholar] [CrossRef] [Green Version]
  21. Le Grange, P.; Sheilan, M.; Spooner, B. How to Limit Amine Systems Failures. Chem. Eng. 2017, 916. Available online: https://www.thechemicalengineer.com/features/how-to-limit-amine-systems-failures/ (accessed on 3 May 2023).
  22. Tay, W.H.; Lau, K.K.; Lai, L.S.; Shariff, A.M.; Wang, T. Current development and challenges in the intensified absorption technology for natural gas purification at offshore condition. J. Nat. Gas Sci. Eng. 2019, 71, 102977. [Google Scholar] [CrossRef]
  23. Tamidi, A.M.; Lau, K.K.; Khalit, S.H. A review of recent development in numerical simulation of ultrasonic-assisted gas-liquid mass transfer process. Comput. Chem. Eng. 2021, 155, 107498. [Google Scholar] [CrossRef]
  24. Gondrexon, N.; Renaudin, V.; Boldo, P.; Gonthier, Y.; Bernis, A.; Petrier, C. Degassing effect and gas-liquid transfer in a high frequency sonochemical reactor. Chem. Eng. J. 1997, 66, 21–26. [Google Scholar] [CrossRef]
  25. Kumar, A.; Gogate, P.R.; Pandit, A.B.; Delmas, H.; Wilhelm, A.M. Gas-Liquid Mass Transfer Studies in Sonochemical Reactors. Ind. Eng. Chem. Res. 2004, 43, 1812–1819. [Google Scholar] [CrossRef]
  26. Kumar, A.; Gogate, P.R.; Pandit, A.B.; Marie, A.; Delmas, H. Investigation of induction of air due to ultrasound source in the sonochemical reactors. Ultrason. Sonochem. 2005, 12, 453–460. [Google Scholar] [CrossRef]
  27. Laugier, F.; Andriantsiferana, C.; Wilhelm, A.M.; Delmas, H. Ultrasound in gas–liquid systems: Effects on solubility and mass transfer. Ultrason. Sonochem. 2008, 15, 965–972. [Google Scholar] [CrossRef] [PubMed] [Green Version]
  28. Herran, N.S.; Lopez, J.L.C.; Perez, J.A.S. Gas–liquid Mass Transfer in Sonicated Bubble Columns. Effect of Reactor Diameter and Liquid Height. Ind. Eng. Chem. Res. 2012, 51, 2769–2774. [Google Scholar] [CrossRef]
  29. Dong, Z.; Yao, C.; Zhang, X.; Xu, J.; Chen, G.; Zhao, Y.; Yuan, Q. A high-power ultrasonic microreactor and its application in gas–liquid mass transfer intensification. Lab Chip 2015, 15, 1145–1152. [Google Scholar] [CrossRef]
  30. Sajjadi, B.; Asgharzadehahmadi, S.; Asaithambi, P.; Abdul Raman, A.A.; Parthasarathy, R. Investigation of mass transfer intensification under power ultrasound irradiation using 3D computational simulation: A comparative analysis. Ultrason. Sonochem. 2017, 34, 504–518. [Google Scholar] [CrossRef] [PubMed]
  31. Tay, W.H.; Barashaid, A.A.B.; Lau, K.K.; Mohd Shariff, A. Effect of Solution Height on Carbon Dioxide Absorption using High Frequency Ultrasonic Irradiation. Chem. Eng. Trans. 2017, 56, 1225–1230. [Google Scholar] [CrossRef]
  32. Tay, W.H.; Lau, K.K.; Shariff, A.M. High frequency ultrasonic assisted mass transfer for water batch reactor. ARPN J. Eng. Appl. Sci. 2016, 11, 1660–1665. [Google Scholar]
  33. Tay, W.H.; Lau, K.K.; Shariff, A.M. High frequency ultrasonic-assisted chemical absorption of CO2 using monoethanolamine (MEA). Sep. Purif. Technol. 2017, 183, 136–144. [Google Scholar] [CrossRef]
  34. Yusof, S.M.M.; Lau, K.K.; Shariff, A.M.; Tay, W.H.; Mustafa, N.F.A.; Lock, S.S.M. Novel continuous ultrasonic contactor system for CO2 absorption: Parametric and optimization study. J. Ind. Eng. Chem. 2019, 79, 279–287. [Google Scholar] [CrossRef]
  35. Zare, A.; Mirzaei, S. Removal of CO2 and H2S using aqueous alkanolamine solusions. World Acad. Sci. Eng. Technol. 2009, 37, 194–203. [Google Scholar]
  36. Qian, Z.; Xu, L.; Li, Z.; Li, H.; Guo, K. Selective absorption of H2S from a gas mixture with CO2 by aqueous N-methyldiethanolamine in a rotating packed bed. Ind. Eng. Chem. Res. 2010, 49, 6196–6203. [Google Scholar] [CrossRef]
  37. Pal, P.; AbuKashabeh, A.; Al-Asheh, S.; Banat, F. Role of aqueous methyldiethanolamine (MDEA) as solvent in natural gas sweetening unit and process contaminants with probable reaction pathway. J. Nat. Gas Sci. Eng. 2015, 24, 124–131. [Google Scholar] [CrossRef]
  38. Rodríguez, N.; Mussati, S.; Scenna, N. Optimization of post-combustion CO2 process using DEA-MDEA mixtures. Chem. Eng. Res. Des. 2011, 89, 1763–1773. [Google Scholar] [CrossRef]
  39. Airgas. Methane Safety Data Sheet; Airgas: Radnor, PA, USA, 2020. [Google Scholar]
  40. Airgas. Nitrogen Safety Data Sheet; Airgas: Radnor, PA, USA, 2021. [Google Scholar]
  41. Nakhaei-Kohani, R.; Taslimi-Renani, E.; Hadavimoghaddam, F.; Mohammadi, M.R.; Hemmati-Sarapardeh, A. Modeling Solubility of CO2–N2 Gas Mixtures in Aqueous Electrolyte Systems Using Artificial Intelligence Techniques and Equations of State; Nature Publishing Group: London, UK, 2022. [Google Scholar]
  42. Chan, Z.P.; Wang, T.; Li, L.; Kang, G.; Manan, N.A.; Cao, Y. Discussion on water condensation in membrane pores during CO2 absorption at high temperature. Membranes 2020, 10, 407. [Google Scholar] [CrossRef]
  43. Yusop Nurida, M.; Norfadilah, D.; Siti Aishah, M.R.; Zhe Phak, C.; Saleh, S.M. Monitoring of CO2 Absorption Solvent in Natural Gas Process Using Fourier Transform Near-Infrared Spectrometry. Int. J. Anal. Chem. 2020, 2020, 9830685. [Google Scholar] [CrossRef] [Green Version]
  44. Daquan, X. Physics of Ultrasound. In New York Sch. Reg. Anesth. 2022. Available online: https://www.nysora.com/topics/equipment/physics-of-ultrasound/#toc_REFERENCES (accessed on 14 June 2022).
  45. Gallego-Juarez, J.A. Piezoelectric ceramics and ultrasonic transducers. J. Phys. E 1989, 22, 804–816. [Google Scholar] [CrossRef]
  46. Edvardsson, M. What Is Piezoelectricity? In Biolin Sci. 2020. Available online: https://www.biolinscientific.com/blog/what-is-piezoelectricity (accessed on 18 February 2023).
  47. Kang, G.; Chan, Z.P.; Saleh, S.B.M.; Cao, Y. Removal of high concentration CO2 from natural gas using high pressure membrane contactors. Int. J. Greenh. Gas Control 2017, 60, 1–9. [Google Scholar] [CrossRef]
  48. Aroonwilas, A.; Veawab, A. Characterization and Comparison of the CO2 Absorption Column. Ind. Eng. Chem. Res. 2004, 43, 2228–2237. [Google Scholar] [CrossRef]
  49. Setameteekul, A.; Aroonwilas, A.; Veawab, A. Statistical factorial design analysis for parametric interaction and empirical correlations of CO2 absorption performance in MEA and blended MEA/MDEA processes. Sep. Purif. Technol. 2008, 64, 16–25. [Google Scholar] [CrossRef]
  50. Shokrollahi, F.; Lau, K.K.; Tay, W.H. Performance comparison of ultrasonic-assisted and magnetic stirred absorption methods for CO2 separation. SN Appl. Sci. 2020, 2, 1217. [Google Scholar] [CrossRef]
  51. Tay, W.H.; Lau, K.K.; Shariff, A.M. High frequency ultrasonic-assisted CO2 absorption in a high pressure water batch system. Ultrason. Sonochem. 2016, 33, 190–196. [Google Scholar] [CrossRef] [PubMed]
  52. Tan, L.S.; Shariff, A.M.; Lau, K.K.; Bustam, M.A. Factors affecting CO2 absorption efficiency in packed column: A review. J. Ind. Eng. Chem. 2012, 18, 1874–1883. [Google Scholar] [CrossRef]
Figure 1. Fluid motions resulting from the propagation of ultrasound wave in liquid medium. Adapted with permission from Ref. [23].
Sustainability 15 11064 g001
Figure 2. Integrated ultrasonic-assisted pilot test rig for CO2 removal: (a) schematic diagram, (b) actual pilot test rig setup installed.
Sustainability 15 11064 g002
Figure 3. Correlation between power system voltage and total ultrasonic power for 32 units of transducers.
Sustainability 15 11064 g003
Figure 4. The contour of CO2 outlet response for ultrasonic power and gas flowrate.
Sustainability 15 11064 g004
Figure 5. Interaction between gas flowrate and liquid flowrate at 400 W ultrasonic power for CO2 outlet response.
Sustainability 15 11064 g005
Figure 6. Contour of L/G response for ultrasonic power and liquid flowrate.
Sustainability 15 11064 g006
Figure 7. Interaction between ultrasonic power and liquid flowrate at 40 SLPM gas flowrate for L/G response.
Sustainability 15 11064 g007
Figure 8. Interaction between gas flowrate and ultrasonic power at 0.5 SLPM liquid flowrate for L/G response.
Sustainability 15 11064 g008
Figure 9. The contour of KGa response for ultrasonic power and gas flowrate interactions.
Sustainability 15 11064 g009
Figure 10. Interaction between liquid flowrate and ultrasonic power at 20 SLPM gas flowrate for mass transfer coefficient (KGa) response.
Sustainability 15 11064 g010
Figure 11. Predicted response at optimized condition.
Sustainability 15 11064 g011
Figure 12. Verification runs for CO2 outlet response.
Sustainability 15 11064 g012
Figure 13. Verification runs for L/G response.
Sustainability 15 11064 g013
Figure 14. Verification runs for KGa response.
Sustainability 15 11064 g014
Table 1. Operating condition parameters.
ParametersUnitSymbolLevel
(−1)(0)(+1)
Gas Flowrate (FG)SLPMA203040
Liquid Flowrate (FL)LPMB0.20.350.5
Ultrasonic Power (PUS)WC0200400
Table 2. Test matrix and results for CO2 outlet concentration, L/G and mass transfer coefficient.
RunGas Flowrate, FG (SLPM)Liquid Flowrate, FL (LPM)Ultrasonic Power, PUS (W)Response 1: CO2 Outlet (mol%)Response 2: L/G (gal/lbmol)Response 3: KGa (mol/m3.s.Pa)
1400.2023.4583.61.64 × 10−7
2300.35018.1423.24.51 × 10−7
3200.5018.5919.32.92 × 10−7
4300.3520016.2340.45.92 × 10−7
5200.24005.9134.21.30 × 10−6
6300.3540010200.81.24 × 10−6
7400.540011.6234.71.41 × 10−6
8300.220017.2210.55.28 × 10−7
9300.3520016336.86.03 × 10−7
10200.3520012.5350.66.39 × 10−7
11300.520015.5451.96.50 × 10−7
12400.240014.9122.09.70 × 10−7
13300.3520016.4329.76.01 × 10−7
14400.5021.3745.73.36 × 10−7
15400.3520018.4313.26.00 × 10−7
16200.54002.7293.11.97 × 10−6
17200.2018.4372.82.90 × 10−7
18300.3520016.4333.25.96 × 10−7
19250.354008.1216.01.26 × 10−6
20250.24009.7132.61.08 × 10−6
21200.354005230.31.43 × 10−6
Table 3. ANOVA for CO2 outlet concentration.
SourceSum of SquaresdfMean SquareF-Valuep-Value
Prob > F
Model—Reduced Quadratic521.09686.85695.29<0.0001Significant
A—Gas Flowrate 75.30175.30602.84<0.0001
B—Liq Flowrate8.2218.2265.79<0.0001
C—Ultrasonic Power290.311290.312324.17<0.0001
AC12.61112.61100.92<0.0001
BC3.9913.9931.95<0.0001
A27.3217.3258.57<0.0001
Residual1.62130.1249
Lack of fit1.1990.13261.230.4510Not Significant
R20.9969
Adjusted R20.9955
Predicted R20.9905
Table 4. ANOVA for L/G.
SourceSum of SquaresdfMean SquareF-Valuep-Value
Prob > F
Model—Reduced 2FI1.314 × 105526,272.56833.68<0.0001Significant
A—Gas Flowrate2798.6512798.6588.81<0.0001
B—Liq Flowrate31,174.34131,174.34989.22<0.0001
C—Ultrasonic Power68,031.70168,031.702158.78<0.0001
AB580.941580.9418.430.0016
BC3810.1613810.16120.90<0.0001
Residual315.141031.51
Lack of fit257.14736.731.900.3219Not Significant
R20.9976
Adjusted R20.9964
Predicted R20.9904
Table 5. ANOVA for mass transfer coefficient.
SourceSum of SquaresdfMean SquareF-Valuep-Value
Prob > F
Model—Reduced Quadratic3.407 × 10−1284.259 × 10−131868.64<0.0001Significant
A—Gas Flowrate2.574 × 10−1512.574 × 10−1511.290.0121
B—Liq Flowrate4.812 × 10−1414.812 × 10−14211.10<0.0001
C—Ultrasonic Power4.006 × 10−1314.006 × 10−131757.60<0.0001
AB3.209 × 10−1413.209 × 10−14140.81<0.0001
AC4.135 × 10−1414.135 × 10−14181.41<0.0001
BC1.434 × 10−1411.434 × 10−1462.91<0.0001
B21.909 × 10−1411.909 × 10−1483.76<0.0001
C21.099 × 10−1311.099 × 10−13482.29<0.0001
Residual1.596 × 10−1572.279 × 10−16
Lack of fit6.883 × 10−1632.294 × 10−161.010.4750Not Significant
R20.9995
Adjusted R20.9990
Predicted R20.9977
Table 6. Optimization criteria for process optimization study.
ParametersGoalLower LimitUpper Limit
A: Gas FlowrateIn range20 SLPM40 SLPM
B: Liquid FlowrateIn range0.2 LPM0.5 LPM
C: Ultrasonic PowerIn range0 W400 W
CO2 OutletTarget: 6.5 mol%2.7 mol%21.3 mol%
L/GMinimize122 (gal/lbmol CO2)452 (gal/lbmol CO2)
KGaMaximize2.49 × 10−7 (mol/m3.s.Pa)1.97 × 10−6 (mol/m3.s.Pa)
Disclaimer/Publisher’s Note: The statements, opinions and data contained in all publications are solely those of the individual author(s) and contributor(s) and not of MDPI and/or the editor(s). MDPI and/or the editor(s) disclaim responsibility for any injury to people or property resulting from any ideas, methods, instructions or products referred to in the content.

