Article

Does Clean Energy Reduce Environmental Pollution under the Environmental Kuznets Curve Hypothesis in Sri Lanka?

by
Eswaran Velayutham
School of Business, University of Southern Queensland, Toowoomba, QLD 4350, Australia
Sustainability 2023, 15(14), 10983; https://doi.org/10.3390/su151410983
Submission received: 18 April 2023 / Revised: 11 July 2023 / Accepted: 11 July 2023 / Published: 13 July 2023

Abstract

:
This study explores the nexus among clean energy, economic growth, urbanization, trade openness, and carbon dioxide (CO2) emissions nexus in an emerging economy, Sri Lanka. An autoregressive distributed lag (ARDL) econometric technique and different diagnostic tests are used to investigate the linkages. The pairwise Graner causality approach is applied to investigate the causality direction. The estimated results have confirmed that clean energy and urbanization reduce carbon emissions, whereas trade openness induces carbon emissions in the long run in Sri Lanka. The findings revealed the non-existence of the environmental Kuznets curve (EKC) hypothesis in Sri Lanka. In contrast, the pollution haven hypothesis (PHH) exists between trade openness and carbon dioxide emissions in Sri Lanka. Regarding causal relationships, there is bi-directional causality between clean energy and urbanization. This study reports a unidirectional causality from clean energy to CO2 emissions, economic development to carbon emissions, urbanization and trade and CO2 emissions to urbanization and trade. Based on the above findings, this study recommends some policy recommendations.

1. Introduction

People worldwide experience severe and frequent extreme weather conditions, such as heatwaves, floods, fires, and drought due to climate change. The recent report by the International Panel on Climate Change (IPCC) indicates that greenhouse emissions (GHEs) induced by 1.10 °C since before industrialization are set to reach 1.50 °C by 2020 arising from unsustainable energy use, manufacturing, and other factors within countries and between individuals [1]. Climate change harms humanity, and each country should take appropriate action to mitigate human-induced GHE. Many countries have converted unsustainable energy to alternative green energy sources to address this issue.
The existing literature examines the nexus between renewable energy use and economic growth; however, no consensus has yet been reached [2]. Dependence on non-renewable energy consumption, such as fossil fuel dependency, boosts economic growth and induces environmental problems in many South Asian countries [3]. On the other hand, renewable or clean energy consumption produces less or zero GHE, and governments need to warrant appropriate economic development. Clean energy supports sustainable development and helps environmental sustainability as it depends on non-carbohydrate energy sources, which do not generate GHE during production [4].
Previous studies on the nexus between CO2 emissions, energy use, economic growth, urbanization, and trade openness found different findings due to varying control variables, data periods, econometric estimations, and the social-economic conditions of the country of study [5]. Therefore, individual countries reflecting on the association between clean energy and CO2 emissions might provide different outcomes. For various reasons, this study selected Sri Lanka as an emerging country to explore the impact of clean energy, economic development, urbanization, and trade openness on carbon emissions. First, Sri Lanka is experiencing an energy shortage and mostly depends on fossil fuel energy which emits significant carbon emissions [6]. Sri Lanka concentrates on discontinuing the use of non-renewable energy by 2050 and is entirely dependent on 100% green energy sources to meet Sri Lankan energy needs by 2050 [7]. Second, to our knowledge, this is the first study investigating the clean energy–carbon emission nexus in Sri Lanka. These research findings might help policymakers in setting a sustainable energy plan to use green energy sources to mitigate environmental pollution.
This research uses data from 1971 to 2014 to see the impact of clean energy, economic development, urbanization, and trade openness on carbon emissions under the EKC hypothesis in an emerging market setting in Sri Lanka. This study adopts different time series econometric approaches: Augmented Dickey–Fuller test, Phillips–Perron test, autoregressive distribution lag bound test, and pairwise Granger causality test, with additional diagnostic tests adopted to find the results. This study explores the relationship between CO2 emissions, clean energy, economic development, urbanization, and trade openness in Sri Lanka. Second, the study aims to see the direction of causality between CO2 emissions, clean energy, economic development, urbanization, and trade openness in Sri Lanka. Finally, this study tests the validity of the environmental Kuznets curve (EKC) hypothesis and pollution haven hypothesis (PHH) in Sri Lanka.
The remaining study is structured as follows: Section 2 provides a brief literature survey on carbon emissions, clean energy, economic development, urbanization, and trade openness. The data and methodology are explained in Section 3. Section 4 reports empirical results and their discussion. Finally, a conclusion, policy recommendations, and limitations of the study are provided in Section 5.

2. Literature Review

Previous studies on the relationship between carbon emissions and economic growth in Sri Lanka have not considered clean energy and provided mixed results of the EKC hypothesis. Alabi et al. [8] examined the connection between CO2 emissions, economic growth, the square of economic growth, energy use, tourism, urbanization, trade openness, and financial development in Sri Lanka. First, they found that the EKC hypothesis is invalid for Sri Lanka. Second, energy consumption and tourism increase environmental pollution, while urbanization reduces environmental degradation in Sri Lanka. Gasimli et al. [9] studied the nexus between energy use, trade, urbanization, and CO2 emissions using the ARDL approach. They found that energy use and trade increase environmental degradation, but urbanization reduces pollution in Sri Lanka. Naradda Gamage et al. [10] examined the nexus between CO2 emissions, economic growth, economic growth squares, energy use, and tourism using dynamic ordinary least squares (DOLS) data from 1974 to 2013. They found that energy use and tourism contribute to environmental pollution in Sri Lanka. However, they did not find validity in the EKC hypothesis in Sri Lanka.
Rahman and Alam [5] explored the connection between CO2 emissions, clean energy, population density, urbanization, economic growth, and trade openness in Bangladesh using data from 1973 to 2014. Researchers employ the ARDL bound testing approach to investigate the long-run association and the Toda–Yamamoto Granger causality test to see the causal directions. They found that clean energy reduces environmental pollution, but population density, urbanization, and economic growth are stimulating environmental pollution in Bangladesh. Sun et al. [11] explored the association between economic growth squares, solar energy technology, and CO2 emissions using the ARDL. They found that solar energy technology contributes a positive effect in reducing environmental pollution in China. They found validity in the EKC hypothesis in China.
Under the EKC framework, Jun et al. [12] investigated the association between CO2 emission globalization, non-renewable energy use, and economic growth for selected South Asian countries using data from 1985 to 2018. First, they found that the EKC hypothesis was valid for South Asian economies. Second, globalization and non-renewable energy contribute to environmental damage in South Asia. Moreover, their findings indicate that the existence of the EKC framework in Sri Lanka suggests that when economic growth surges, environmental pollution also upsurges in the early stages of development, but after the threshold point, environmental pollution starts to decline with the rise in economic growth. There is a contradiction among the researchers’ findings of the presence of the EKC hypothesis in Sri Lanka.
Ahmad et al. [13] examine the nexus between energy use, economic development, and carbon emissions in India using the ARDL model from 1971 to 2014. This study reports that the existence of the EKC framework is validated in the Indian economy. This research finds a positive association between energy use and carbon emissions. Using the environmental Kuznets curve (EKC) hypothesis, Sulaiman et al. [14] analyze the effect of electricity generated by consuming renewable energy sources on the environment and trade openness from 1980 to 2009, applying the ARDL approach in Malaysia. This study confirms the presence of the EKC hypothesis in Malaysia. In addition, they found that trade openness harms carbon emissions in the long run. Rahman and Kashem [15] investigate the relationship between carbon emissions, energy consumption, and industrial growth in Bangladesh from 1972 to 2011 using the ARDL bound testing methodology. The results indicate that industrial production and energy use have a significant positive effect on the carbon emissions in Bangladesh, but they did not investigate the EKC framework validity.
Uddin et al. [16] investigated the long-run causality relationship between energy use, economic growth, carbon emissions, and trade openness from 1971 to 2006 in Sri Lanka. The result revealed an unidirectional causality running from economic development to CO2 emissions and energy use. Using time series data from 1960 to 2009 in Japan, Hossain [17] studied the dynamic casual association between CO2 emissions, energy use, economic development, foreign trade, and urbanization. This research reports unidirectional causalities from energy use and trade openness to CO2 emissions, trade openness to energy use, CO2 emissions to economic development, and economic development to trade openness.
Shahbaz et al. [18] examined the relationship between economic growth, electricity consumption, urbanization, and environmental degradation in the United Arab Emirates (UAE) using the quarter frequency data from 1975 to 2011 and the ARDL bound testing model. This study found an inverted U-shaped association between economic development and carbon emissions. Electricity use decreases carbon emissions. In addition, this study reports a positive association between urbanization and carbon emissions. Using the EKC hypothesis by undertaking a comparative analysis between India and China over the period 1971–2012 by using the ARDL, Pal and Mitra [19] investigate the relationship between economic activity, energy consumption, trade openness, and CO2 emissions. This study showed the long-run impact on economic activity and trade openness and the short-run effect on energy use on carbon emissions. Furthermore, this study reports the N-shaped association between carbon emissions and economic activity and fails to validate the EKC hypothesis.
Sani et al. [20] explored the link between economic growth, industrialization, energy use, and CO2 emissions in Nigeria (1981–2019) using the ARDL method. The results reveal that economic development and energy use positively correlate with CO2 emissions, while industrialization has an inverse relationship with CO2 emissions. Ozgur et al. [21] analyzed the impact of nuclear energy use on carbon emissions. They tried to confirm the EKC hypothesis using the Fourier ARDL approach using data from 1970 to 2016 in India. This study demonstrates the validity of the EKC hypothesis in India. The negative association between nuclear energy use and CO2 emissions suggests that nuclear power development is vital to reaching green and sustainable development in India. Xue et al. [4] probed the effects of clean energy on carbon emissions in France from 1987 to 2019, controlling urbanization, economic development, and policy uncertainty. The researchers found that clean energy does not contribute to carbon emissions, while economic growth and policy uncertainty induce carbon emissions in France.
Table 1 summarizes previous research findings related to the energy–income–emission nexus. Most of the research tested the EKC hypothesis and found contradictory mixed results. A few studies supported the EKC hypothesis [18,21,22]. Some other studies did not validate the EKC hypothesis [8,19,20]. Most importantly, Rahman and Alam [5] investigated the relationship between clean energy and carbon emissions using Bangladeshi data, but they did not test the EKC hypothesis. The above summary of findings indicates mixed results due to the selection of country, econometric methods, sample data selection period, and variables. Limited studies focus on clean energy, economic development, and carbon emission nexus. This study fills this research gap by examining the above nexus.
Existing literature on the relationship between environmental degradation and economic development examined the EKC hypothesis presented by [23]. The EKC hypothesis indicates that initially, environmental degradation increases with the rise of economic growth until attaining a threshold level of economic development; however, after that point, ecological degradation decreases [24]. The EKC hypothesis proposes a connection between economic growth and environmental pollution in an inverted U-sharped curve [25]. In addition to the EKC hypothesis, this study adopts pollution haven hypothesis (PHH) to test the relationship between trade openness and CO2 emissions.
The impact of trade openness on CO2 emissions has sought more attention in recent years [5,26]. Trade openness plays a significant role in a country’s economy, measured as the proportion of imports and exports to the country’s GDP [27]. The import and export trading activities use natural resources that may harm the environment. Trade openness uses advanced technologies with dirty energy that improves economic growth and the standard of living and emits more carbon emissions in developing countries [26]. This confirms the existence of the PHH [28]. Recently, scholars tried to validate the PHH with the EKC hypothesis [29,30,31,32,33]. Liu et al. [34] investigated the relationship between energy use, economic growth, trade openness, foreign direct investment, and ecological footprint in Pakistan to test the validity of the EKC hypothesis and the PHH. The authors found support for both hypotheses. Dagar et al. [35] tested the PHH with the role of foreign direct investment, validating the PHH. Firoj et al. [31] investigated the EKC hypothesis with the PHH in Bangladesh and validated the EKC and invalidated the PHH. Another study from Bangladesh by Raihan [36] examined the EKC and the PHH and validated both. Ozturk et al. [37] investigated financial development and ecological footprint in South Asia, bridging the EKC and the PHH and supporting the EKC and the PHH for South Asian countries. Luo et al. [38] examined the EKC and the PHH in Asian economies and found support for both. Naqvi et al. [39] investigated the relationship between foreign direct investment, economic development, urbanization, natural resources, biomass energy usage, and ecological footprint in 87 middle-income countries and supported both hypotheses. Yilani et al. [28] investigated the PHH and the EKC hypothesis in Indonesia and provided evidence of the validity of both views.
Table 2 summarizes recent research findings on the validity of the PHH and the EKC hypotheses. Most previous researchers investigated the impact of foreign direct investment and economic growth on CO2 emissions or ecological footprint to test the PHH and the EKC hypotheses. A country’s trade openness significantly uses natural resources for international trade, contributing to environmental pollution [27]. In addition, mixed evidence is reported in the existing literature on the effect of trade openness on environmental pollution. Managi et al. [40] and Yilanci et al. [28] validated the PHH between trade openness and environmental pollution. Copeland and Taylor [41] and Kearsley and Riddel [42] found no relationship between trade openness and ecological impact. To the best of our knowledge, existing literature focused on environmental pollution studies and unexplored the validity of the EKC and the PHH hypotheses in the context of Sri Lanka. This study will try to fill this research gap.

3. Data and Methodology

3.1. Data

This study scrutinizes the link between clean energy, economic growth, the square of economic growth, urbanization, trade openness, and carbon emissions using annual data from 1971 to 2014 in Sri Lanka. This research employs carbon emissions (CO2) per capita measured in metric tons as the proxy for environmental pollution. Clean energy is defined as alternative and nuclear energy as a fraction of total energy consumption. The variable definitions, abbreviations, and units of measure are specified in Table 3. All data were downloaded from the World Development Indicator (WDI), World Bank (WDI, World Bank (2022)).

3.2. Model Specification

The following multivariate model is used to explore the long- and short-run association between clean energy (CEN), economic growth (GDP), the square of economic growth (GDP2), urbanization (URB), trade openness (TRD), and CO2 emissions (CO2).
CO2 = β0 + β1CEN + β2GDP + β3GDP2 + β4URB + β5TRD + εt
where CO2 is carbon emissions, CEN is clean energy, GDP is the GDP per capita, GDP2 is the square of GDP per capita, β0 is the constant term, and ε is the error term. Β1 to β5 indicate the coefficients of the independent variables.
Equation (1) is converted to a natural logarithm format as follows:
lnCO2 = β0 + β1lnCEN + β2lnGDP + β3lnGDP2 + β4lnURB + β5lnTRD + εt
where ln indicates the natural logarithm and others are as mentioned in Equation (1).

3.3. Unit Root Tests

This research uses augmented Dickey–Fuller (ADF) [44]) and Phillips and Perron [45] to verify whether the variables are stationary or not. The Fisher test of unit root using ADF estimates the regression equation as follows:
Y t = α + β t   + θ y t 1 + j = 1 n μ i Y t 1 + e t
where α is the intercept, β is the coefficient on the time trend T, μ is the coefficient on the lagged dependent variable, n is the number of lags, and e is random error.
Phillips and Perron [45] suggest the following unit root test:
Y t = α + β t   + θ y t 1 + e t

3.4. Autoregressive Distributed Lag (ARDL) Bound Test

Prior research tested the co-integration relationship between the studied variables employing Engle and Granger [46], Phillips and Hansen [47], and Johansen and Juselius [48] co-integration tests, which have some drawbacks of estimation about the series of integration. Pesaran et al. [49] introduce the ARDL bound test to investigate the long-run co-integration association, which is superior in comparison with the co-integration tests introduced by Engle and Granger [46], Phillips and Hansen [47], and Johansen and Juselius [48]. First, the ARDL bound test investigates the long-run association among variables, whether the underlying repressors are integrated of order I(0), I(1), or marginally integrated. Second, this ARDL test is an efficient estimator even if there is a small sample size. Third, this approach provides reasonable estimations of the long-run model and accurate statistics, even if some of the repressors are endogenous. Fourth, these procedures assess long- and short-run parameters simultaneously. Finally, this test incorporates a dynamic error correction model [50], which is deduced by a linear transformation [51].
l n C O 2 t = β 0 + i = 1 p 1 β 1 i l n C O 2 t 1 + i = 1 p 2 β 2 i l n C E N t 1 + i = 1 p 3 β 3 i l n G D P t 1 + i = 1 p 4 β 4 i G D P 2 t 1 + i = 1 p 5 β 5 i l n U R B t 1 + i = 1 p 6 β 6 i l n T R D t 1 + β 7 l n C O 2 t 1 + β 8 l n C E N t 1 + β 9 G D P t 1 + β 10 G D P 2 t 1 + β 11 U R B t 1 + β 12 T R D t 1 + ε t
where ∆ and ε indicate the first difference and the error term, respectively and the p1, p2, p3, p4, p5, and p6 are the number of lags based on the Akaike information criterion (AIC). Pesaran et al. [49] develop the lower critical bound (LCB) and upper critical bound (UCB) and F-statistic, which checks that the null hypothesis is H0: β7 = β8 = β9 = β10 = β11 = β12 = 0 of taking no co-integration between the variables in Equation (5) and the alternative hypothesis of the long-run co-integration is H1: β7β8β9β10β11β12 = 0.

4. Results and Discussion

Table 4 reports the summary statistics of the variables in the original value. The mean CO2 emission in metric tons is 0.415, which ranges between the minimum and maximum values of 0.200 and 0.847, with a standard deviation of 0.206. The average clean energy value is 3.163, between 1.473 and 5.400, with a variability value of 0.952. The average value of GDP per capita is USD 1655.27, which ranges between USD 712.84 and 3694.30 with a standard deviation of USD 830.84. On average, trade (% of GDP) has a mean value of 67.51% and the lowest and highest values of 46.21% and 88.64%, respectively. The average percentage of the urban population is 18.36%, which falls between 17.697% and 18.676%, with variability scores of 0.255.
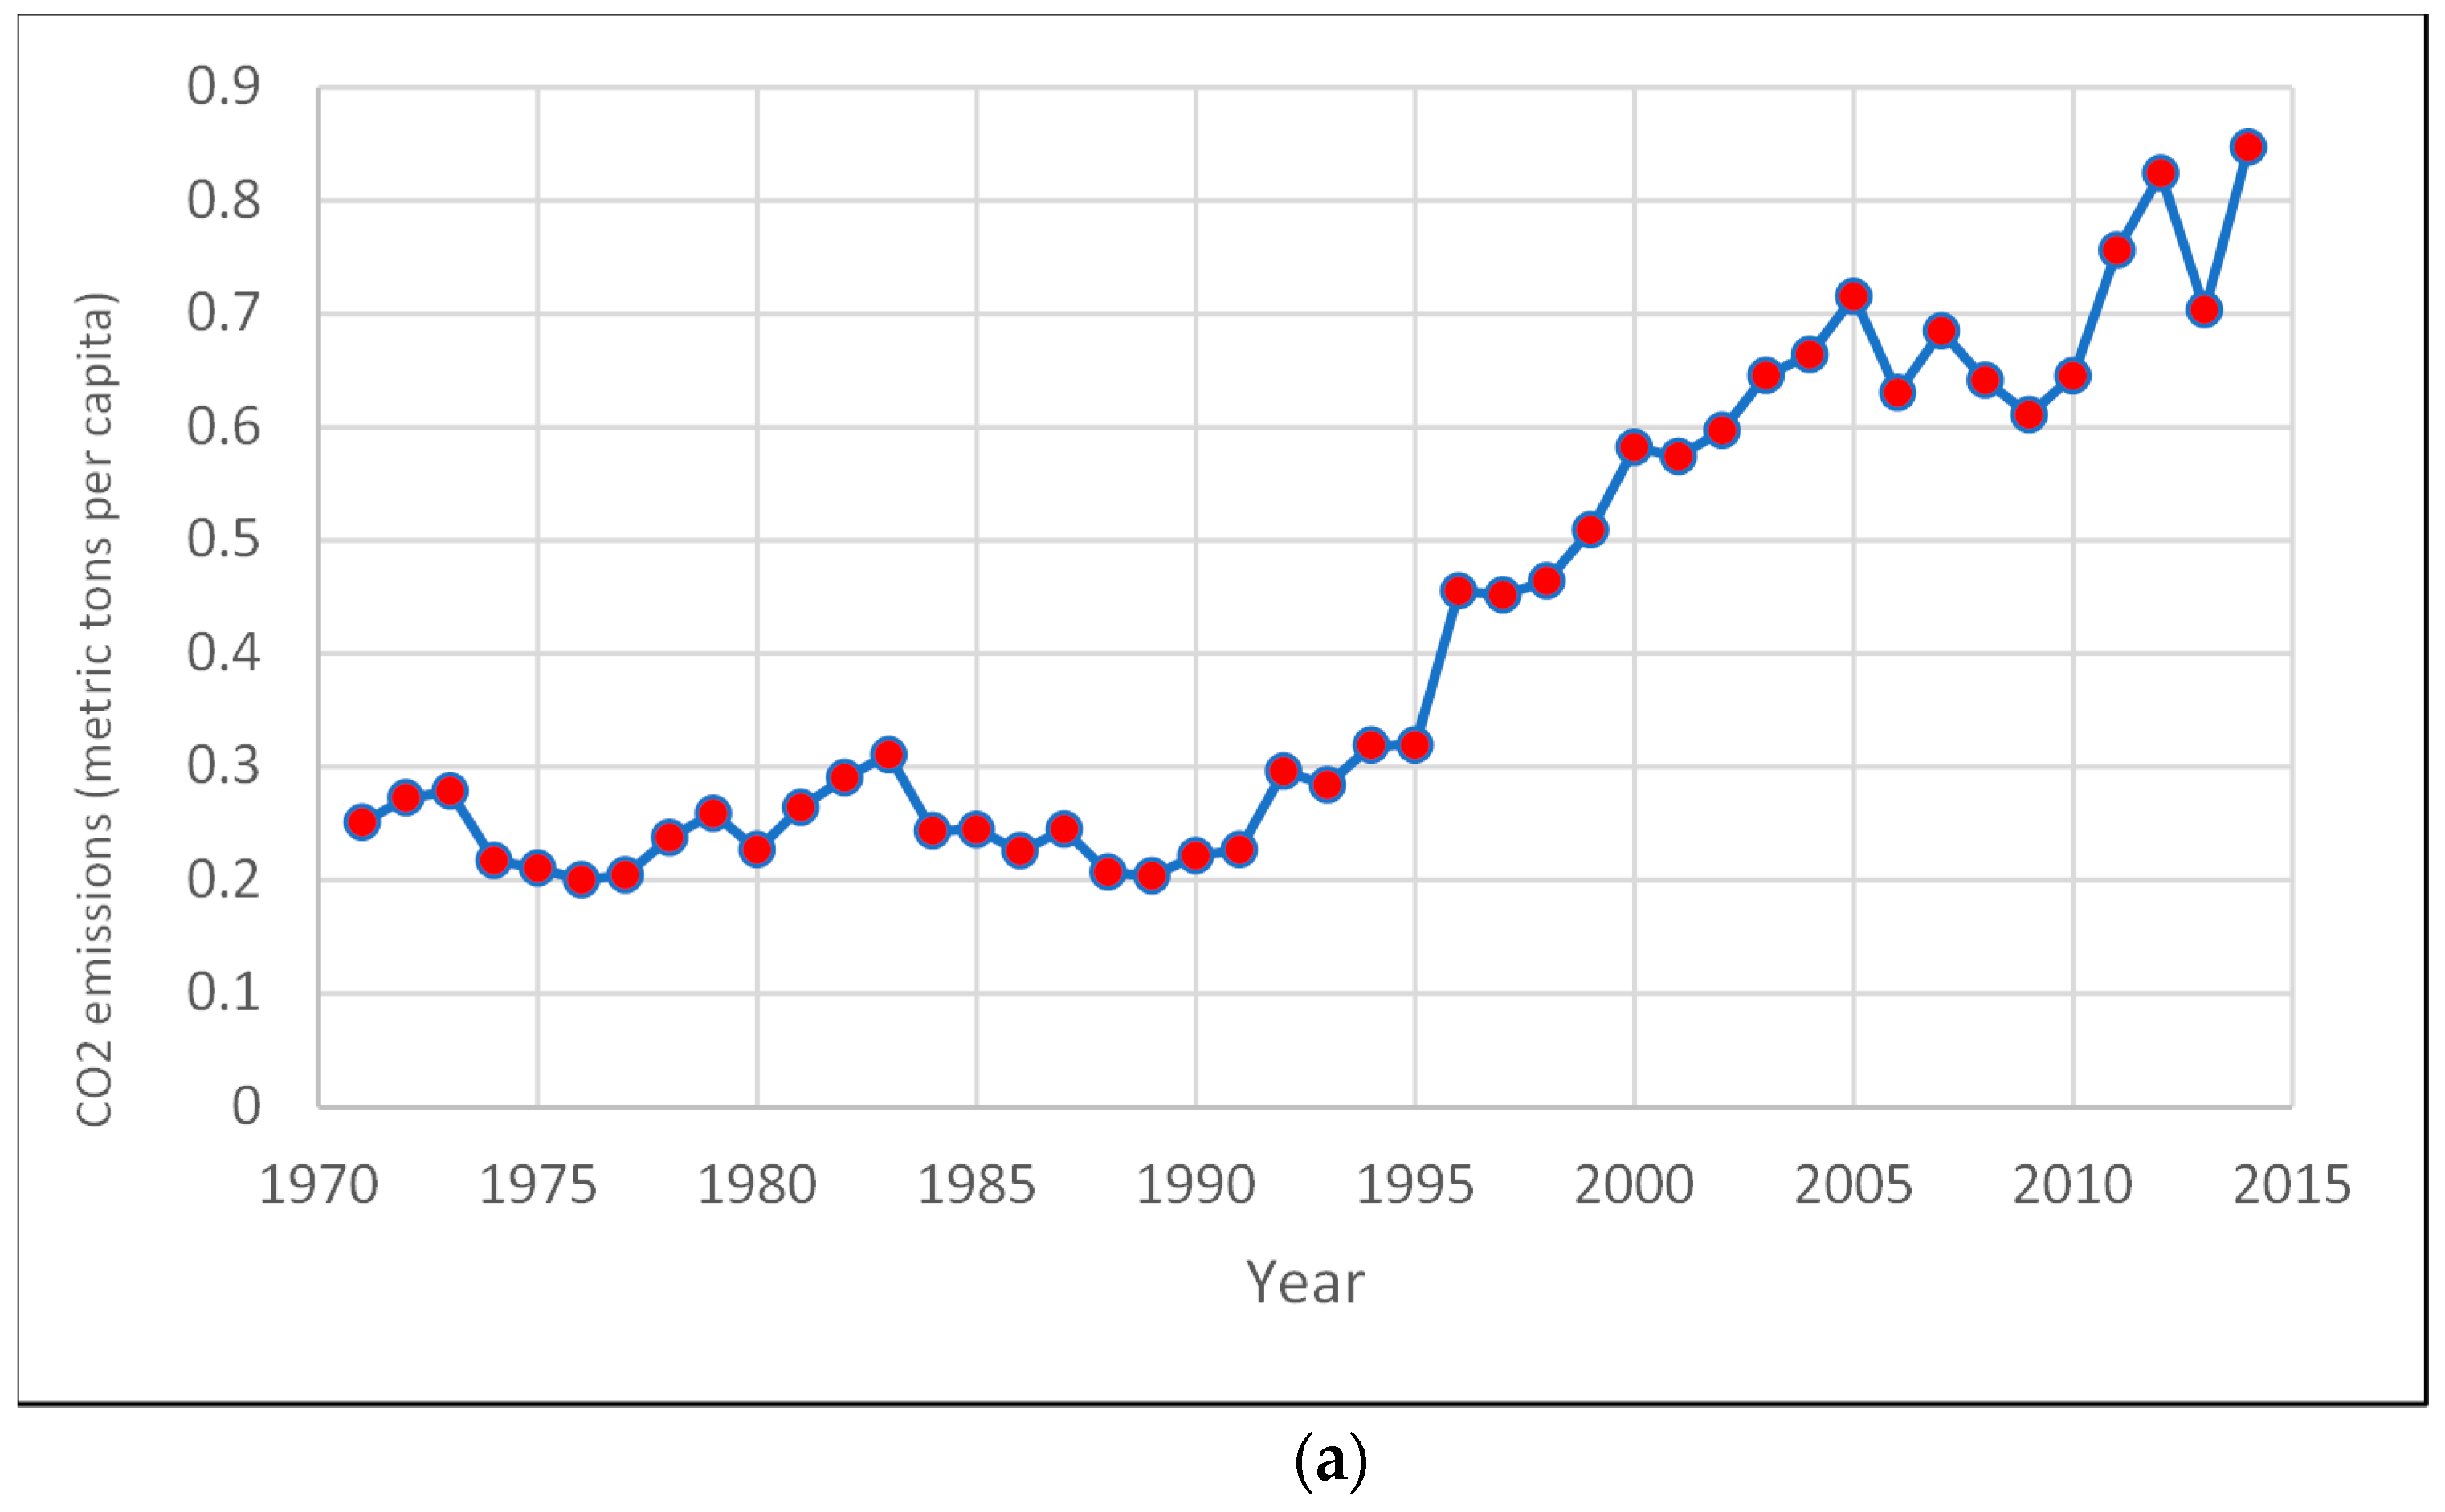
Figure 1a shows the trends of CO2 emissions in Sri Lanka that have significantly increased since 1971 and dropped in 2009, then increased until 2012 and again dropped in 2013, and again started to increase. Figure 1b reports alternative and nuclear energy trends in Sri Lanka. There is a more fluctuating trend in clean energy. Figure 1c shows an upward trend in GDP per capita. Figure 1d presents that the urban population increased from 1971 to 1983 and sharply dropped until 2013. Figure 1e shows year-by-year fluctuation in trade openness throughout the studied period.
The unit root test results of the examined variables using the ADF and the PP are presented in Table 5. The variables of lnCO2, lnCEN, lnGDP, and lnTRD have unit roots at the level but no unit roots at their first difference under the indicated ADF and PP unit root tests. They are stationary at the first difference I(1). The variable of lnURB has no unit root test at the level and unit root test at their first difference under ADF and PP unit root tests. It is stationary at level I(0). Therefore, the selected variables have fallen as either I(1) or I(0) but not I(2). As a result, this study could adopt the ARDL bound testing approach to explore the long-run relationship among the variables.
Following Jayanthakumaran et al. [52], Ahmed et al. [53], and Wang [54], this study selects a lag length of four based on AIC.
Table 6 shows the ARDL bound test results (1, 0, 0, 1, 0, 4). The calculated F-statistic of 9.123 is larger than the upper value of 4.15 and statistically significant at 1% level, revealing that long-run co-integration between the studied variables is present.
Table 7 displays the results of the long-run relationship among the studied variables. The coefficient of CEN is −0.210, negative, and statistically significant at a 1% level, demonstrating that clean energy use mitigates environmental pollution in Sri Lanka. This finding shows that a 1% increase in clean energy use in Sri Lanka contributes to a 0.21% reduction in carbon dioxide emissions. This evidence is supported by Rahman and Alam [5] for Bangladesh but contradicted by Xue et al. [4] for France, who finds an insignificant negative impact of clean energy on carbon emissions. The GDP and square of GDP coefficients are −8.255 and 0.625, which are negative and positive, respectively, implying that this study found no support for the KEC framework in Sri Lankan economy. This evidence is supported by the previous Sri Lankan studies of Alabi et al. [8], Gasimli et al. [9], and Naradda Gamage et al. [10] but contradicted by Nasreen et al. [22], who document the existence of the KEC hypothesis for Sri Lanka. This study finds a negative and significant association between urbanization and carbon emissions in Sri Lanka. This finding is consistent with a previous study on Sri Lanka [9]. The coefficient of trade openness is positive and significant, implying that trade openness induces CO2 emissions in Sri Lanka, validating the PHH. The findings confirm that a 1 percent change in trade openness causes a 1.44 percent increase in CO2 emissions in Sri Lanka. The results are consistent with those of Dou et al. [55], Chhabra et al. [26], Managi et al. [40], and Yilanci et al. [28], who validated the PHH between trade openness and environmental pollution. Copeland and Taylor [41] and Kearsley and Riddel [42] found no relationship between trade openness and ecological impact.
This study gives evidence in support of the invalidity of the EKC and the validity of the PHH. These findings are consistent with Nawaz [33] for South Asia and Bakirtas and Cerin [56] for Mexico, Indonesia, Korea, Turkey, and Australia. The non-existence of the EKC in Sri Lanka could be due to the country’s initial stage of development, the role of technological innovation, environmental and economic policies of the government [33]. In addition, the impact of trade openness on CO2 emissions in Sri Lanka is positive and supports the PHH. In the future, the existence of the EKC can be possible if Sri Lanka uses more clean energy than fossil-fuel energy for their international trading activities. Clean international trading activities could lead to sustainable economic growth. Dong et al. [57] and Dong [58] found evidence that a country using renewable energy consumption can reduce environmental pollution and helps in supporting sustainable economic growth.
The results from short-run error correction methods are stated in Table 8. The short-run coefficient of the square of GDP is 0.619, which is positive and significant at the 1% level. The short-run coefficient of the first difference of trade openness is 0.589, which is positive and significant at a 1% level. Nonetheless, the first lag of the first difference, the second lag of the first difference, and the third lag of the first difference of trade openness are −0.964, −0.718, and −0.389, respectively, which are negative and statistically significant. The assessed lagged error correction term (ECTt−1) is −1.086, which is negative and statistically significant at a 1% level, suggesting that there are long-run associations between clean energy, economic growth, the square of economic growth, urbanization, trade openness, and carbon emissions and every year 108.6% error will be adjusted toward the long-run equilibrium.
Table 9 reports the results of diagnostic tests of serial correlation tests, heteroskedasticity, and normality. This study finds no serial correlation or heteroskedasticity and the residuals are normally distributed. This study also finds that both CUSUM and CUSUMSQ are well within critical bounds, as shown in Figure 2 and Figure 3.
This study uses a pairwise Granger causality test to examine the connection between the studied variables. Table 10 reports the results of pairwise Granger causality test. The findings reveal unidirectional causality running from clean energy to carbon emissions, economic growth to carbon emissions, carbon emissions to urbanization, carbon emissions to trade openness, economic growth to urbanization, and economic growth to trade openness. There is evidence of bidirectional causality between urbanization and clean energy.

5. Conclusions and Policy Implications

This study explores the impact of clean energy, economic growth, the square of economic growth, urbanization, and trade openness on carbon emissions using time series data from 1971 to 2014 in Sri Lanka. This research adopts various econometric techniques associated with time series data, such as unit root tests of ADF and PP, ARDL bound testing approach, error correction method, and Granger causality test to achieve the results. This ARDL bound testing method study finds short-run and long-run co-integration between carbon emissions, economic growth, the square of economic growth, urbanization, and trade openness. The finding confirms that clean energy use contributes to carbon dioxide emission reduction in Sri Lanka in the long run. This finding indicates that a 1% increase in clean energy use contributes to a 0.21% reduction in carbon dioxide emissions. This evidence is supported by Rahman and Alam [5] for Bangladesh but contradicted by Xue et al. [4] for France, who found an insignificant negative impact of clean energy on carbon emissions.
Economic growth is negatively associated with carbon dioxide emissions, whereas economic growth squared has a positive association with carbon dioxide emissions in Sri Lanka. These findings did not validate the inverted U-shape relationship between economic growth and carbon dioxide emissions, implying that this study finds no support for the KEC framework in Sri Lanka in the long run. These findings are consistent with Alabi et al. [8], Gasimli et al. [9], and Naradda Gamage et al. [10]. Urbanization improves the environmental quality in the long run in Sri Lanka. One of the reasons for reducing carbon dioxide emissions is a decrease in the percentage of the urban population in Sri Lanka since 1982. This finding is supported by Gasimli et al. [9]. Trade openness is positively correlated with carbon dioxide emissions and is significant, implying that trade openness induces environmental degradation in Sri Lanka in the long run supporting the PHH. This finding is supported by Naradda Gamage et al. [10] and Rahman and Alam [5] for Bangladesh. Using the PHH hypothesis, Copeland and Taylor [41], and Kearsley and Riddel [42] found no relationship between trade openness and environmental impact. Managi et al. [40] and Yilanci et al. [28] validated the PHH between trade openness and environmental impact. The import and export sectors in Sri Lanka did not use environmentally friendly technology to mitigate carbon dioxide emissions [10].
The current research findings would help policymakers in making an effective decision related to environmentally friendly energy consumption. First, policymakers should make an appropriate green energy policy to look for alternative energy sources to mitigate carbon emissions, as it is sharply increasing in Sri Lanka. Second, policymakers should consider incentives for the users of clean energy. For this purpose, the government and the banking sector should jointly undertake initiatives. Third, the government should consider imposing a carbon tax on international traders who use fossil-fuel-generated energy for their international trading activities. Finally, policymakers should implement a policy encouraging import and export traders to use green energy.
This study has several limitations. First, this study considers only an emerging country, Sri Lanka. Therefore, the obtained findings may not apply to developed countries. Second, this study includes carbon emissions as an independent variable. There are other types of GHE variables, such as ecological footprint, sulfur dioxide emission, and deforestation rate. Finally, the unavailability of data for some essential variables is another limitation of this study. This study examines the relationship between trade openness and CO2 to validate the PHH. Future research should consider other variables, such as foreign direct investment and ecological footprint to test the PHH with other econometric methods for proper policy implementation.

Funding

This research received no external funding.

Institutional Review Board Statement

Not applicable.

Informed Consent Statement

Not applicable.

Data Availability Statement

The dataset for this study were downloaded from World Development Indicator, World Bank: https://databank.worldbank.org/source/world-development-indicators (accessed on 26 May 2022).

Conflicts of Interest

The authors declare no conflict of interest.

References

  1. IPCC. AR6 Synthesis Report. 2023. Available online: https://www.ipcc.ch/report/ar6/syr/ (accessed on 1 June 2023).
  2. Madaleno, M.; Nogueira, M.C. How Renewable Energy and CO2 Emissions Contribute to Economic Growth, and Sustainability—An Extensive Analysis. Sustainability 2023, 15, 4089. [Google Scholar] [CrossRef]
  3. Xue, L.; Haseeb, M.; Mahmood, H.; Alkhateeb, T.T.Y.; Murshed, M. Renewable energy use and ecological footprints mitigation: Evidence from selected South Asian economies. Sustainability 2021, 13, 1613. [Google Scholar] [CrossRef]
  4. Xue, C.; Shahbaz, M.; Ahmed, Z.; Ahmad, M.; Sinha, A. Clean energy consumption, economic growth, and environmental sustainability: What is the role of economic policy uncertainty? Renew. Energy 2022, 184, 899–907. [Google Scholar] [CrossRef]
  5. Rahman, M.M.; Alam, K. Clean energy, population density, urbanization and environmental pollution nexus: Evidence from Bangladesh. Renew. Energy 2021, 172, 1063–1072. [Google Scholar] [CrossRef]
  6. Adikari, A.P.; Liu, H.; Dissanayake, D.; Ranagalage, M. Human Capital and Carbon Emissions: The Way forward Reducing Environmental Degradation. Sustainability 2023, 15, 2926. [Google Scholar] [CrossRef]
  7. Dasanayaka, C.H.; Perera, Y.S.; Abeykoon, C. Analysis of the effects of renewable energy utilization towards the economic growth of Sri Lanka: A structural equation modelling approach. Clean. Eng. Technol. 2022, 6, 100377. [Google Scholar] [CrossRef]
  8. Alabi, M.K.; Ojuolape, M.A.; Yaqoob, J. Economic Growth and Environmental degradation nexus in Sri Lanka. Sri Lanka J. Soc. Sci. Humanit. 2021, 1, 135–145. [Google Scholar] [CrossRef]
  9. Gasimli, O.; Naradda Gamage, S.K.; Shihadeh, F.; Rajapakshe, P.S.K.; Shafiq, M. Energy, trade, urbanization and environmental degradation nexus in Sri Lanka: Bounds testing approach. Energies 2019, 12, 1655. [Google Scholar] [CrossRef] [Green Version]
  10. Naradda Gamage, S.K.; Hewa Kuruppuge, R.; Haq, I.U. Energy consumption, tourism development, and environmental degradation in Sri Lanka. Energy Sources Part B Econ. Plan. Policy 2017, 12, 910–916. [Google Scholar] [CrossRef]
  11. Sun, Y.; Li, M.; Zhang, M.; Khan, H.S.U.D.; Li, J.; Li, Z.; Sun, H.; Zhu, Y.; Anaba, O.A. A study on China’s economic growth, green energy technology, and carbon emissions based on the Kuznets curve (EKC). Environ. Sci. Pollut. Res. 2021, 28, 7200–7211. [Google Scholar] [CrossRef]
  12. Jun, W.; Mughal, N.; Zhao, J.; Shabbir, M.S.; Niedbała, G.; Jain, V.; Anwar, A. Does globalization matter for environmental degradation? Nexus among energy consumption, economic growth, and carbon dioxide emission. Energy Policy 2021, 153, 112230. [Google Scholar]
  13. Ahmad, A.; Zhao, Y.; Shahbaz, M.; Bano, S.; Zhang, Z.; Wang, S.; Liu, Y. Carbon emissions, energy consumption and economic growth: An aggregate and disaggregate analysis of the Indian economy. Energy Policy 2016, 96, 131–143. [Google Scholar] [CrossRef]
  14. Sulaiman, J.; Azman, A.; Saboori, B. The potential of renewable energy: Using the environmental Kuznets curve model. Am. J. Environ. Sci. 2013, 9, 103. [Google Scholar] [CrossRef]
  15. Rahman, M.M.; Kashem, M.A. Carbon emissions, energy consumption and industrial growth in Bangladesh: Empirical evidence from ARDL cointegration and Granger causality analysis. Energy Policy 2017, 110, 600–608. [Google Scholar] [CrossRef]
  16. Uddin, M.G.S.; Bidisha, S.H.; Ozturk, I. Carbon emissions, energy consumption, and economic growth relationship in Sri Lanka. Energy Sources Part B: Econ. Plan. Policy 2016, 11, 282–287. [Google Scholar] [CrossRef]
  17. Hossain, S. An econometric analysis for CO2 emissions, energy consumption, economic growth, foreign trade and urbanization of Japan. Low Carbon Econ. 2012, 3, 92–105. [Google Scholar] [CrossRef] [Green Version]
  18. Shahbaz, M.; Sbia, R.; Hamdi, H.; Ozturk, I. Economic growth, electricity consumption, urbanization and environmental degradation relationship in United Arab Emirates. Ecol. Indic. 2014, 45, 622–631. [Google Scholar] [CrossRef]
  19. Pal, D.; Mitra, S.K. The environmental Kuznets curve for carbon dioxide in India and China: Growth and pollution at crossroad. J. Policy Model. 2017, 39, 371–385. [Google Scholar] [CrossRef]
  20. Sani, Y.S.; Abubakar, I.Y.; Adam, S.B.; Dharwal, M.; Singh, P.; Sharma, P. Economic growth and environmental degradation in developing world: Evidence from Nigeria (1981–2019). Mater. Today Proc. 2020, 49, 3177–3180. [Google Scholar] [CrossRef]
  21. Ozgur, O.; Yilanci, V.; Kongkuah, M. Nuclear energy consumption and CO2 emissions in India: Evidence from Fourier ARDL bounds test approach. Nucl. Eng. Technol. 2021, 54, 1657–1663. [Google Scholar] [CrossRef]
  22. Nasreen, S.; Anwar, S.; Ozturk, I. Financial stability, energy consumption and environmental quality: Evidence from South Asian economies. Renew. Sustain. Energy Rev. 2017, 67, 1105–1122. [Google Scholar] [CrossRef]
  23. Grossman, G.M.; Krueger, A.B. Environmental Impacts of a North American Free Trade Agreement; National Bureau of Economic Research: Cambridge, MA, USA, 1991. [Google Scholar]
  24. Grossman, G.M.; Krueger, A.B. Economic growth and the environment. Q. J. Econ. 1995, 110, 353–377. [Google Scholar] [CrossRef] [Green Version]
  25. Stern, D.I. The Environmental Kuznets Curve. In International Society for Ecological Economics, Internet Encyclopaedia of Ecological Economics; Department of Economics, Rensselaer Polytechnic Institute: Troy, NY, USA, 2003. [Google Scholar]
  26. Chhabra, M.; Giri, A.K.; Kumar, A. Do trade openness and institutional quality contribute to carbon emission reduction? Evidence from BRICS countries. Environ. Sci. Pollut. Res. 2023, 30, 50986–51002. [Google Scholar] [CrossRef]
  27. Wu, H. Trade openness, green finance and natural resources: A literature review. Resour. Policy 2022, 78, 102801. [Google Scholar] [CrossRef]
  28. Yilanci, V.; Cutcu, I.; Cayir, B.; Saglam, M.S. Pollution haven or pollution halo in the fishing footprint: Evidence from Indonesia. Mar. Pollut. Bull. 2023, 188, 114626. [Google Scholar] [CrossRef] [PubMed]
  29. Akram, R.; Fareed, Z.; Xiaoli, G.; Zulfiqar, B.; Shahzad, F. Investigating the existence of asymmetric environmental Kuznets curve and pollution haven hypothesis in China: Fresh evidence from QARDL and quantile Granger causality. Environ. Sci. Pollut. Res. 2022, 29, 50454–50470. [Google Scholar] [CrossRef] [PubMed]
  30. Bulut, U. Environmental sustainability in Turkey: An environmental Kuznets curve estimation for ecological footprint. Int. J. Sustain. Dev. World Ecol. 2021, 28, 227–237. [Google Scholar] [CrossRef]
  31. Firoj, M.; Sultana, N.; Khanom, S.; Rashid, M.H.U.; Sultana, A. Pollution haven hypothesis and the environmental Kuznets curve of Bangladesh: An empirical investigation. Asia-Pac. J. Reg. Sci. 2023, 7, 197–227. [Google Scholar] [CrossRef]
  32. Mahmood, H. Trade, FDI, and CO2 emissions nexus in Latin America: The spatial analysis in testing the pollution haven and the EKC hypotheses. Environ. Sci. Pollut. Res. 2023, 30, 14439–14454. [Google Scholar] [CrossRef]
  33. Nawaz, S.M.N.; Alvi, S.; Akmal, T. The impasse of energy consumption coupling with pollution haven hypothesis and environmental Kuznets curve: A case study of South Asian economies. Environ. Sci. Pollut. Res. 2021, 28, 48799–48807. [Google Scholar] [CrossRef]
  34. Liu, Y.; Sadiq, F.; Ali, W.; Kumail, T. Does tourism development, energy consumption, trade openness and economic growth matters for ecological footprint: Testing the Environmental Kuznets Curve and pollution haven hypothesis for Pakistan. Energy 2022, 245, 123208. [Google Scholar] [CrossRef]
  35. Dagar, V.; Ahmed, F.; Waheed, F.; Bojnec, Š.; Khan, M.K.; Shaikh, S. Testing the pollution haven hypothesis with the role of foreign direct investments and total energy consumption. Energies 2022, 15, 4046. [Google Scholar] [CrossRef]
  36. Raihan, A. Exploring environmental Kuznets curve and pollution haven hypothesis in Bangladesh: The impact of foreign direct investment. J. Environ. Sci. Econ. 2023, 2, 25–36. [Google Scholar] [CrossRef]
  37. Ozturk, I.; Farooq, S.; Majeed, M.T.; Skare, M. An empirical investigation of financial development and ecological footprint in South Asia: Bridging the EKC and pollution haven hypotheses. Geosci. Front. 2023. [Google Scholar] [CrossRef]
  38. Luo, R.; Ullah, S.; Ali, K. Pathway towards sustainability in selected Asian countries: Influence of green investment, technology innovations, and economic growth on CO2 emission. Sustainability 2021, 13, 12873. [Google Scholar] [CrossRef]
  39. Naqvi, S.A.A.; Hussain, M.; Hussain, B.; Shah, S.A.R.; Nazir, J.; Usman, M. Environmental sustainability and biomass energy consumption through the lens of pollution Haven hypothesis and renewable energy-environmental kuznets curve. Renew. Energy 2023, 212, 621–631. [Google Scholar] [CrossRef]
  40. Managi, S.; Hibiki, A.; Tsurumi, T. Does trade openness improve environmental quality? J. Environ. Econ. Manag. 2009, 58, 346–363. [Google Scholar] [CrossRef]
  41. Copeland, B.R.; Taylor, M.S. Trade, growth, and the environment. J. Econ. Lit. 2004, 42, 7–71. [Google Scholar] [CrossRef]
  42. Kearsley, A.; Riddel, M. A further inquiry into the pollution haven hypothesis and the environmental Kuznets curve. Ecol. Econ. 2010, 69, 905–919. [Google Scholar] [CrossRef]
  43. Rahman, M.M.; Alam, K. CO2 Emissions in Asia–Pacific Region: Do Energy Use, Economic Growth, Financial Development, and International Trade Have Detrimental Effects? Sustainability 2022, 14, 5420. [Google Scholar] [CrossRef]
  44. Dickey, D.A.; Fuller, W.A. Distribution of the estimators for autoregressive time series with a unit root. J. Am. Stat. Assoc. 1979, 74, 427–431. [Google Scholar]
  45. Phillips, P.C.; Perron, P. Testing for a unit root in time series regression. Biometrika 1988, 75, 335–346. [Google Scholar] [CrossRef]
  46. Engle, R.F.; Granger, C.W. Co-integration and error correction: Representation, estimation, and testing. Econom. J. Econom. Soc. 1987, 55, 251–276. [Google Scholar] [CrossRef]
  47. Phillips, P.C.; Hansen, B.E. Statistical inference in instrumental variables regression with I(1) processes. Rev. Econ. Stud. 1990, 57, 99–125. [Google Scholar] [CrossRef]
  48. Johansen, S.; Juselius, K. Maximum likelihood estimation and inference on cointegration—With appucations to the demand for money. Oxf. Bull. Econ. Stat. 1990, 52, 169–210. [Google Scholar] [CrossRef]
  49. Pesaran, M.H.; Shin, Y.; Smith, R.J. Bounds testing approaches to the analysis of level relationships. J. Appl. Econom. 2001, 16, 289–326. [Google Scholar] [CrossRef]
  50. Utesheva, A.; Simpson, J.R.; Cecez-Kecmanovic, D. Identity metamorphoses in digital disruption: A relational theory of identity. Eur. J. Inf. Syst. 2016, 25, 344–363. [Google Scholar] [CrossRef] [Green Version]
  51. Mohamed, H.; Jebli, M.B.; Youssef, S.B. Renewable and fossil energy, terrorism, economic growth, and trade: Evidence from France. Renew. Energy 2019, 139, 459–467. [Google Scholar] [CrossRef]
  52. Jayanthakumaran, K.; Verma, R.; LIU, Y. CO2 emissions, energy consumption, trade and income: A comparative analysis of China and India. Energy Policy 2012, 42, 450–460. [Google Scholar] [CrossRef]
  53. Ahmed, K.; Shahbaz, M.; Qasim, A.; Long, W. The linkages between deforestation, energy and growth for environmental degradation in Pakistan. Ecol. Indic. 2015, 49, 95–103. [Google Scholar] [CrossRef]
  54. Wang, B.; Wang, Z. Imported technology and CO2 emission in China: Collecting evidence through bound testing and VECM approach. Renew. Sustain. Energy Rev. 2018, 82, 4204–4214. [Google Scholar]
  55. Dou, Y.; Zhao, J.; Malik, M.N.; Dong, K. Assessing the impact of trade openness on CO2 emissions: Evidence from China-Japan-ROK FTA countries. J. Environ. Manag. 2021, 296, 113241. [Google Scholar] [CrossRef] [PubMed]
  56. Bakirtas, I.; Cetin, M.A. Revisiting the environmental Kuznets curve and pollution haven hypotheses: MIKTA sample. Environ. Sci. Pollut. Res. 2017, 24, 18273–18283. [Google Scholar] [CrossRef] [PubMed]
  57. Dogan, E.; Inglesi-Lotz, R. The impact of economic structure to the environmental Kuznets curve (EKC) hypothesis: Evidence from European countries. Environ. Sci. Pollut. Res. 2020, 27, 12717–12724. [Google Scholar] [CrossRef]
  58. Dogan, E.; Seker, F.; Bulbul, S. Investigating the impacts of energy consumption, real GDP, tourism and trade on CO2 emissions by accounting for cross-sectional dependence: A panel study of OECD countries. Curr. Issues Tour. 2017, 20, 1701–1719. [Google Scholar] [CrossRef]
Figure 1. (a) CO2 emissions (metric tons per capita). (b) Alternative and nuclear energy (% of total energy use). (c) GDP per capita (constant 2015 USD). (d) Urban population (% of total population). (e) Trade (% of GDP).
Sustainability 15 10983 g001aSustainability 15 10983 g001bSustainability 15 10983 g001c
Figure 2. The plot of the cumulative sum of recursive residuals.
Sustainability 15 10983 g002
Figure 3. The cumulative sum of squares of recursive residuals plot.
Sustainability 15 10983 g003
Table 1. Summary of the results of prior literature.
Author(s)Time SpanArea of StudyMethodologyFindings
Alabi et al. [8]1971–2014Sri LankaARDL bound testing approachEnergy use expands carbon emissions. The EKC hypothesis is not validated.
Gasimli et al. [9]1978–2014Sri LankaARDL bound testing approachEnergy consumption raises carbon emissions. The EKC hypothesis is not found.
Naradda Gamage et al. [10]1974–2014Sri LankaDOLSEnergy use increases carbon emissions. The EKC hypothesis is not validated.
Rahman and Alam [5]1973–2014BangladeshARDL bound testing approachClean energy reduces carbon emissions. The EKC hypothesis is not tested.
Shahbaz et al. [18]1975–2011United Arab EmiratesARDL bound testing approachEnergy consumption increases CO2 emissions; it supported the EKC hypothesis.
Pal and Mitra [19]1971–2012India and ChinaARDL bound testing approachThere is an N-shaped association between carbon emissions and economic activity. The EKC hypothesis does not exist.
Sani et al. [20]1981–2019NigeriaARDL bound testing approachEnergy use increases CO2 emissions; the EKC hypothesis is not supported.
Ozgur et al. [21]1970–2016IndiaARDL bound testing approachEnergy consumption increases carbon emissions; the EKC hypothesis is not supported.
Nasreen et al. [22]1980–2012South Asian EconomiesARDL bound testing approachThe EKC hypothesis is validated in Pakistan, India, Bangladesh, and Sri Lanka, but not in Nepal.
Table 2. Summary of the results of prior literature on the EKC and the PHH.
Author/sSampleEconomiesVariablesTechniquesValidity of EKC and PHH
Akram et al. [29]1982–2018ChinaCO2 emissions, GDP, foreign direct investment, and international tradeQuantile ARDLValidated both hypotheses
Bulut [30]1970–2016TurkeyEcological footprint, GED, foreign direct investment, renewable energy use, and industrializationARDL bound test and DOLSValidated EKC but not PHH
Dagar et al. [35]1990–2014Lower-middle-income, upper-middle-income, and high-incomeEcological footprint, economic growth, and foreign direct investmentPMGValidated PHH but did not test the EKC hypothesis
Firoj et al. [31]1986–2018BangladeshCO2, trade openness, financial development, foreign direct investment, capital formation, energy use, and urbanizationARDL bound testValidated the EKC but did not validate the PHH
Luo et al. [38]2001–2019Selected Asian countriesCO2, green investment, technology innovation, and economic growthFMOLS and DOLSValidated both hypotheses
Naqvi et al. [39]1990–201787 middle-income countriesEcological footprint, economic growth, foreign direct investment, biomass energy consumption, natural resources, and urbanizationAMGValidated both hypotheses
Ozturk et al. [37]1971–2018South Asian economiesEcological footprint, GDP, energy consumption, financial development, and foreign direct investmentFMOLS, DOLS, and PMCValidated both hypotheses
Rahman and Alam [43]1960–202017 Asia-Pacific countriesCO2, energy use, economic growth, trade openness, and financial developmentDriscoll and Kraay’s standard error and PCSEValidated EKC but not PHH
Yilanci et al. [28]1976–2018IndonesiaFishing footprint, fishery production, foreign direct investment, and GDPARDL bound testValidated EKC but not PHH
Table 3. Description of variables.
VariablesAbbreviationDefinitionUnit of Measure
CO2 emissionsCO2Quantity of CO2 emissionsMetric tons per capita
Clean energy CENAlternative and nuclear energy Percentage of total energy use
Economic growth GDPGDP per capita Constant 2015 USD
Urbanization URBUrban population (%) Percentage of the total population
Trade opennessTRDTrade Percentage of GDP
Table 4. Description statistics.
VariableMeanMedianStandard DeviationMinimumMaximumN
CO2 emissions0.4150.3030.2060.2000.84744
Alternative and nuclear energy3.1633.0110.9521.4735.40044
GDP per capita1655.2701376.004830.839726.7873694.30044
Urban18.36018.3880.22517.69718.67644
Trade67.50568.00211.66146.22588.63644
Table 5. The results of the unit root test.
ADF TestPP Test
Constant and TrendConstant and Trend
LevelFirst DifferenceLevelFirst Difference
lnCO2−2.330−7.460 ***−2.248−7.465 ***
lnCEN−3.068−8.917 ***−2.884−9.876 ***
lnGDP−0.709−6.455 ***−0.804−6.434 ***
lnURB−6.995 ***−0.743−4.642 ***−1.023
lnTRD−1.441−5.855 ***−1.474−5.845 ***
Notes: *** indicate statistical significance at 1%.
Table 6. The results of the bound test.
Critical ValueF-Statistic: 9.123
Lower Bound 0(1)Upper Bound 1(1)
1%3.064.15
5%2.393.38
10%2.083.00
Table 7. The results of the long-run relationship.
VariableCoefficientStandard Errort-StatisticProb.
Constant40.519 ***9.6094.2170.000
lnCEN−0.210 ***0.063−3.3320.002
lnGDP−8.255 ***1.929−4.2780.000
lnGDP20.625 ***0.1304.8110.000
lnURB−7.035 ***2.175−3.2350.003
lnTRD1.435 ***0.1877.6930.000
Notes: *** indicate statistical significance at 1%.
Table 8. The ARDL co-integrating short-term error-correction model (1, 0, 0, 1, 0, 4).
VariableCoefficientStandard Errort-StatisticProb.
Constant44.014 ***13.3933.2860.003
D(lnGDP2)0.619 ***0.0659.4940.000
D(lnTRD)0.589 ***0.1384.2800.000
D(lnTRD)(−1)−0.964 ***0.182−5.2860.000
D(lnTRD)(−2)−0.718 ***0.135−5.2960.000
D(lnTRD)(−3)−0.389 **0.155−2.5070.018
ECT(−1)−1.086 ***0.123−8.8060.000
Notes: ** and *** indicate statistical significance at 5%, and 1%, respectively. The maximum lag to be used is four. Akaike information criterion chooses the optimal lag structure.
Table 9. Diagnostic tests.
TestF-Statistics (Prob.)Finding
Breusch–Godfrey serial correlation LM test0.104 (0.902)There is no serial correlation
Breusch–Pagan–Godfrey heteroskedasticity test0.390 (0.949)There is no heteroskedasticity
Jarque–Bera normality test2.337 (0.311)Residuals are normally distributed
Table 10. The results of pairwise Granger causality test.
Null Hypothesis:F-StatisticCausality
CE→CO211.948 ***CE→CO2 (unidirectional causality)
CO2→CE0.045
GDP→CO25.702 **GDP→CO2 (unidirectional causality)
CO2→GDP0.060
URB→CO20.308CO2→URB (unidirectional causality)
CO2→URB47.300 ***
TRD→CO20.906CO2→TRD (unidirectional causality)
CO2→TRD4.093 **
GDP→CE0.225-
CE→GDP0.159
URB→CE3.775 *URB↔CE (bidirectional causality)
CE→URB3.433 *
TRD→CE0.090-
CE→TRD0.654
URB→GDP0.067GDP→URB (unidirectional causality)
GDP→URB62.303 ***
TRD→GDP0.000GDP→TRD (unidirectional causality)
GDP→TRD3.892 *
TRD→URB0.166-
URB→TRD0.048
Notes: ***, **, and * denotes significant level at 1%, 5%, and 10%, respectively.
Disclaimer/Publisher’s Note: The statements, opinions and data contained in all publications are solely those of the individual author(s) and contributor(s) and not of MDPI and/or the editor(s). MDPI and/or the editor(s) disclaim responsibility for any injury to people or property resulting from any ideas, methods, instructions or products referred to in the content.

