Review

Current Utilization and Further Application of Zooplankton Indices for Ecosystem Health Assessment of Lake Ecosystems

1
Department of Environmental Science and Engineering, Kyung Hee University, Yongin 17104, Republic of Korea
2
Department of Biology Education, Kongju National University, Gongju 32560, Republic of Korea
3
Water Environmental Engineering Research Division, National Institute of Environmental Research, Incheon 22689, Republic of Korea
4
Department of Environmental Education, Sunchon National University, Suncheon 57922, Republic of Korea
*
Authors to whom correspondence should be addressed.
Sustainability 2023, 15(14), 10950; https://doi.org/10.3390/su151410950
Submission received: 20 May 2023 / Revised: 10 July 2023 / Accepted: 11 July 2023 / Published: 12 July 2023

Abstract

:
For the sustainable use of lake ecosystem services—water resources, aquatic habitats for biodiversity conservation, and aesthetic values as waterfront space—ecosystem health assessments using biota are implemented as important national environmental monitoring projects. Zooplankton play a key role as an important linkage in the material circulation as secondary producers in lake ecosystems. At the same time, they influence the composition and biomass of other communities through biological interactions. In this review, we summarize useful zooplankton indices for ecosystem health assessment and suggest considerations for their use. Suggestions are provided for the practical application of indirectly measured zooplankton biomass, as well as the potential and limitations of eDNA application, which has recently been actively utilized in biological monitoring.

1. Introduction

1.1. Aquatic Ecosystem Health and Sustainable Aquatic Ecosystem Management

As the ecosystem management paradigm has shifted from a simple conservation concept toward sustainable ecosystem services, monitoring and evaluation are increasingly recognized as an important part of national projects [1,2,3,4,5,6]. Ecosystem health applies the concept of “health”—which is generally used to indicate human mental and physical well-being—at a regional level (ecosystem, basin, landscape, etc.) [4]. This concept was introduced to identify issues with ecosystem functioning, and seek causes and solutions [2,4]. Various changes can occur when an ecosystem is subjected to excessive stress (abnormal decrease or increase in primary productivity; decrease in nutrient reuse efficiency; decrease in species diversity as a result of loss of sensitive species; increase in instability; increase in species that weaken the resistance of their hosts, e.g., pests and parasites; decrease in size of individuals and reduced activity; and increased pollutant circulation), and can ultimately lead to ecosystem destruction [2].
A healthy ecosystem is basically defined as stable and sustainable [1,2,3,4,5,6]. The health of ecosystems can be evaluated using three factors: vigor, organization, and resilience. Vigor (ecosystem growth and activity) can be measured in terms of material and energy circulation and primary productivity within the ecosystem. Organization (complexity of ecosystem structure) includes the interactions between ecosystem components, which may shift with changes in species diversity and entity activity. Resilience is the ability of an ecosystem to maintain its structure and function under stress [2] (Figure 1).
When evaluating the health of an ecosystem, it is most effective to use multiple indicators, rather than a single indicator, to identify any dysfunctions [7,8,9]. Signs of ecosystem disturbance may appear as the system approaches collapse, or may not appear at all [2]. As the stresses applied to an ecosystem are complex, it is necessary to understand the resulting changes.

1.2. Health Assessment of Aquatic Ecosystems and Application of Biotic Indices

Ecosystem health assessments using multiple indicators have been implemented in various countries. Aquatic ecosystem health assessments have been developed to help manage national water resources [10,11,12,13,14,15,16]. Both physicochemical and biological indicators are generally used when evaluating the health of an aquatic ecosystem [10,12,17,18,19]. While the measurement and integration of physicochemical indicators using exact numerical standards does not present significant challenges, the evaluation standards for bioindicators are more ambiguous [20]. Since the criteria used should be different for each ecosystem (aquatic system), the development of biological indices (bio indices) for health assessment of aquatic ecosystems are generally conducted regionally and integrated at the national level [21].
Ecosystems comprise a set of biotic communities and the abiotic environment that contains them [22]. Thus, bio indices are an indispensable tool for assessing the health of aquatic ecosystems [20]. While physical and chemical indicators temporarily indicate the health status of aquatic ecosystems, biological communities are constantly exposed to environmental interference and change, and their responses are integrative [23]. Therefore, using bio indices to assess the health of aquatic ecosystems can be highly effective.
The European Union has implemented the Water Framework Directive (WFD) to manage aquatic ecosystems, special habitats, and water resources across Europe [11,12]. The aquatic ecosystems of Europe are divided into rivers, lakes, and coastal and transitional waters, and management targets are determined based on water systems rather than political criteria. A system for evaluation has also been established. In WFD, rather than focusing on the development of an evaluation index suitable for each system, the emphasis is on standardizing the results of health evaluations already being implemented in each country. For rivers, ecosystem health is evaluated using phytobenthos, phytoplankton, macrophytes, macroscopic invertebrates, benthic macroinvertebrates, and fish communities, whereas in estuaries, health is evaluated using phytoplankton, macroalgae, angiosperms, and benthic invertebrates. In lakes, periphyton, macro invertebrates, phytoplankton, fish communities, and large aquatic plants are used (Figure 2).
The US Department of the Environment has designed and been conducting National Aquatic Resources Surveys (NARS) as a state cooperative program to assess the health of US rivers, shores, wetlands, and lakes [11,12,13,14]. The program focused on the development of an index that could evaluate the overall status of the nation’s aquatic ecosystems using randomly selected points. For rivers, health of the water system is evaluated using periphyton, benthic macroinvertebrates, and fish communities; in coastal waters, benthic macroinvertebrates, chlorophyll a, and ecological fish tissue contaminants are used for evaluation. The health of wetlands is evaluated using vegetation and algae, and the health of lakes is evaluated using benthic macroinvertebrates, chlorophyll a, zooplankton, phytoplankton, macrophytes, and fish communities (Figure 3).
Figure 2. Biological indicators used in European Union (EU) and United States (US) aquatic ecosystems health assessments. ● means biological indicators used in EU, ▶ means used in the US, and ◆ means used in both.
Sustainability 15 10950 g002
Figure 3. Changes in aquatic ecosystems that can be identified through zooplankton. (a) Biomass of secondary product; (b) changes in the microbial food web and grazing food web as the community changes; (c) the quality of total organic C circulating with in the aquatic ecosystem food web; (d) ecosystem shifts as a result of climate change; (e) zooplankton shifts as a result of toxic substances.
Sustainability 15 10950 g003

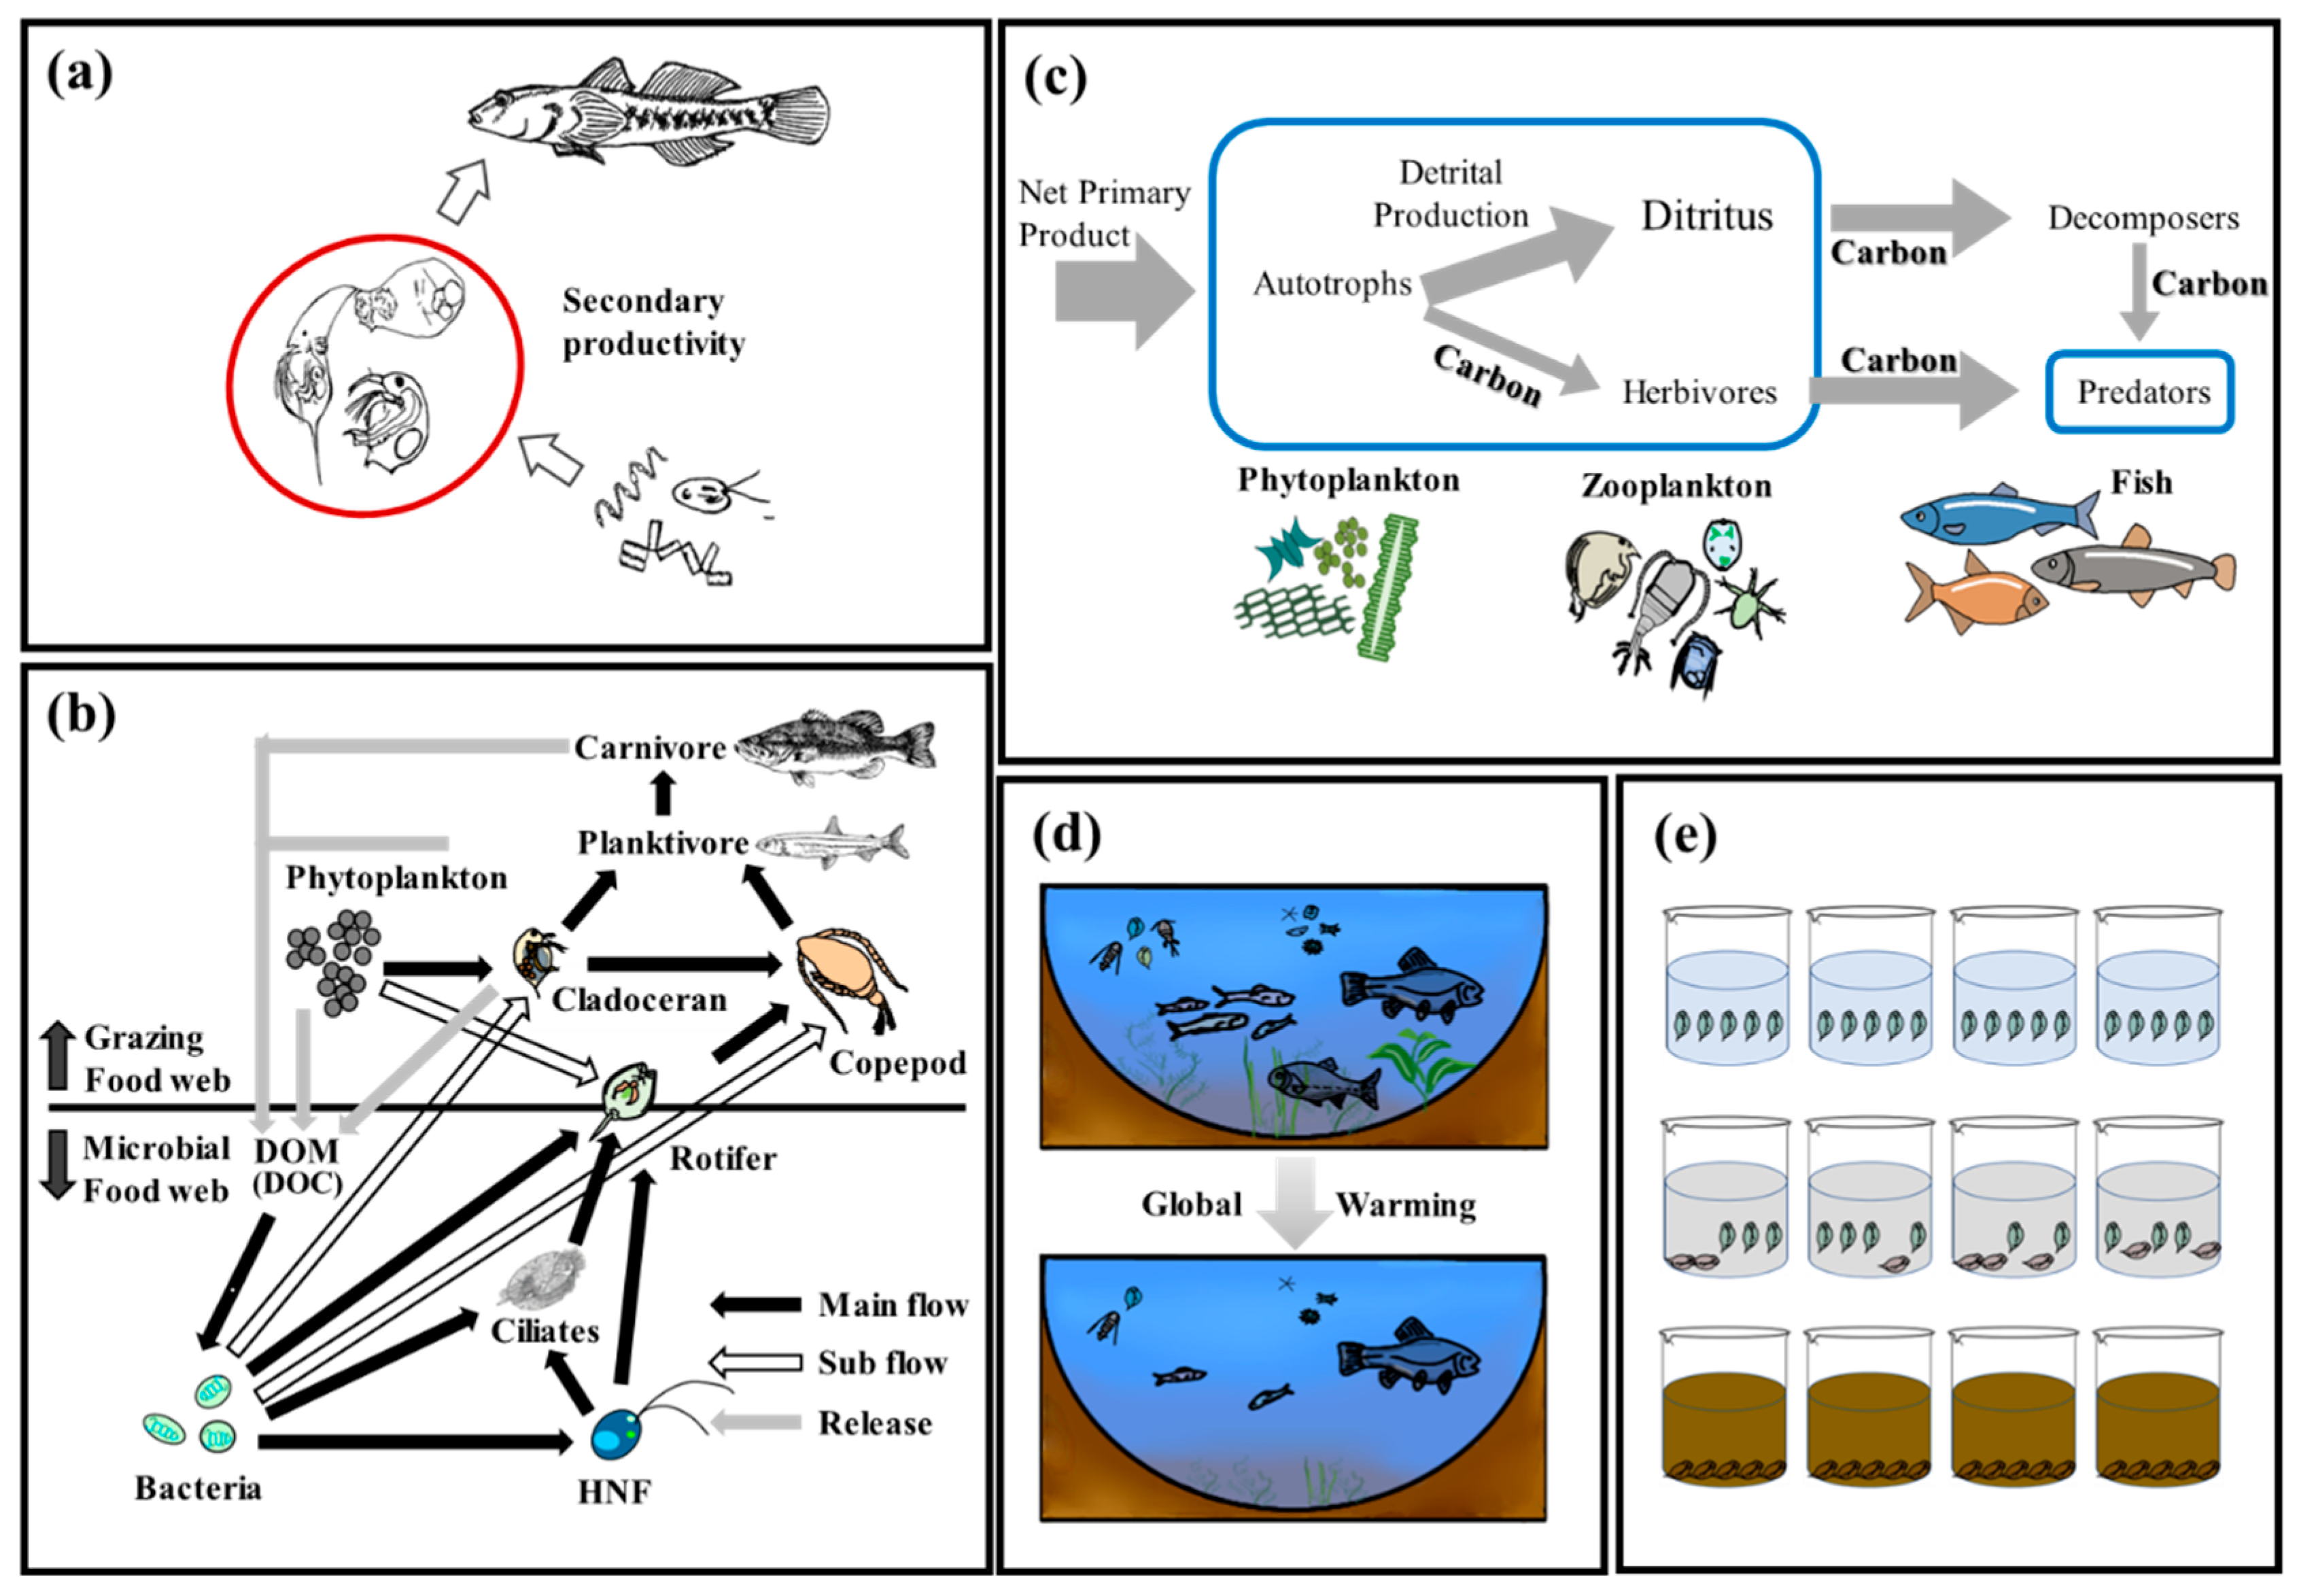
2. Zooplankton as Bioindicators for Monitoring and Assessing Lake Ecosystem Health

2.1. The Role of Zooplankton in Lake Ecosystems

Lake ecosystems are enclosed areas with a long residence time and endogenous organic matter produced by macrophytes, sessile algae, and phytoplankton [24]. Externally introduced organic matter and pollutants are circulated within the lake through biological food webs [25]. Therefore, information related to energy and material flow, acquired by identifying changes in biological interactions among lake organisms within the food web, can be effectively used to represent the health status of the overall lake ecosystem [20].
Within lake food webs, zooplankton contains key species, which have a major influence on ecosystem function and stability. Zooplankton are a food source not only for planktivorous fish species, but also for juveniles of most fish species, including piscivorous fish, which are top predators, as well as grazers that control phytoplankton and bacterial populations [26,27,28]. Therefore, identifying changes in zooplankton communities (individual size, biomass, population, community structure, etc.) within lake ecosystems is an important task for effective lake management [29,30].
In a broad sense, zooplankton may include various Protozoa, such as Ciliophora and Amoebozoa, but zooplankton that can be easily quantified using a 60 μm zooplankton net—a common collecting tool—includes Rotifera, Cladocera, and Copepoda [31]. Rotifera are the most common taxa, appearing in almost all lake and river ecosystems. They have a wide variety of forms, including thick-shelled, non-shelled, and soft-shelled species [32]. Rotifera have potential as biological indicators of a lake’s trophic state, as they have a short life cycle and respond rapidly to environmental changes, making them well-adapted to dynamic environments [33,34]. Cladocera are Crustacea that swim using long tentacles and branched antennae that extend like arms [35]. They consume phytoplankton through filter-feeding; at the same time, they are a preferred food source for planktivorous fish. Through these biological interactions, Cladocera occupies an intermediate trophic level in the lake food web and plays an important role in material and energy circulation and water quality in lake ecosystems [36,37,38,39,40]. There are approximately 2800 freshwater Copepoda species, over a total of 13,000 described species [41]. Copepoda exhibit a very wide range of lifestyles, from predation to parasitism and, like Cladocera, serve as a food source for planktivorous fish. As such, these species also play an important role in material and energy circulation in aquatic ecosystems [42]. As mentioned above, zooplankton vary in size and swimming ability, are found at various trophic levels, and include species with different feeding characteristics and food selectivity. The distribution of zooplankton is influenced by abiotic limits, methods and means of distribution, and biological interactions [43,44,45,46]. In the event of an ecosystem disturbance, the structure of the community changes rapidly, leading to a simplification of the community and the disappearance of species. However, the resting ability of all zooplankton allows them to remain inactive in each lake and reestablish themselves in the water column when favorable conditions return. Using these changes in community composition, it becomes possible to effectively evaluate the health of the lake ecosystem [34,47,48,49].
Owing to their sensitivity to environmental changes and their important role in the freshwater food web, zooplankton species have been used effectively to assess the trophic state of water bodies [34,38,45,50]. In aquatic ecosystem monitoring, zooplankton indices can be used to indicate the overall health of the system. Information about the lake environment related to energy flow and material flow through biological interactions within the food web can be identified through (1) the biomass of important secondary producers; (2) changes in the microbial food web and grazing food web as the zooplankton community changes; (3) the quality improvement of total organic C circulating within the aquatic ecosystem food web; and (4) ecological shifts as a result of climate change or toxic substances [51,52,53,54,55,56] (Figure 3). In addition, for biomanipulated lakes where planktivorous were removed to maximize the zooplankton grazing effect for water quality maintenance, indices regarding zooplankton composition (indices representing the recovery of Cladocera, particularly genus Daphnia) can be used as evidence to confirm the success of biomanipulation [57,58].

2.2. Zooplankton Communities’ Response Patterns to Environmental Change

Studies on zooplankton community-based indices to diagnose ecological and environmental status of lakes have long been conducted [26,38]. Broadly, zooplankton species are used as indicators of (i) eutrophication in a comprehensive sense, including water quality; (ii) watershed development and land use; and (iii) biological interactions (bottom-up and top-down pressures). Changes in zooplankton communities are measured in terms of the abundance, richness, and biomass of specific taxa. In recent studies on zooplankton indicators, the use of biomass has become more common [34,48,49,50].
The responses of zooplankton communities to lake eutrophication can be classified in a taxon-specific manner. Zooplankton community characteristics suggested to be inversely proportional to the progress of eutrophication include species richness, average size, and the Calanoida/(Cyclopoida + Cladocera) abundance ratio [43]. Potential indicator species that appear in eutrophic lakes and increase in abundance with eutrophication include Keratella cochlearis f. tecta, K. tropica, Brachionus budapestinensis, and B. calyciflorus. In contrast, the abundances of Conochilus unicornis, C. dossuarius, C. coenobasis, and Ascomorpha ovalis increase as the trophic state is lowered, and these species have been suggested as oligotrophic indicators [33,43,59] (Table 1).
Zooplankton community indicators that are reportedly inversely proportional to the total P concentration in a water body include species richness, body weight of planktonic Crustacea, the biomass ratio of Daphnia spp. among Crustacea, and the biomass and abundance of Calanoida among Copepoda [60]. Factors suggested to be proportional to the total P concentration include the proportions of biomass and the abundance of Cyclopoida among Copepoda. In an analysis of zooplankton samples from 146 lakes in the northeastern United States, the Ca concentration (hardness) of the water appeared to be proportional to the abundance of large Cladocera (e.g., Daphnia pulex, D. pulicuria, D. schodleri, and D. galeata mendotae), and inversely proportional to that of small Rotifera (<0.2 mm) [61] (Table 1).
It has also been suggested that increases in the total P concentration, Chlorophyll a concentration, and anthropogenic land use in a watershed can lead to a decrease in the species richness of Calanoida and large Cladocera, and the abundance of Daphnia pulicaria, a large crustacean. Increases in the abundance and richness of small Cladocera (e.g., Bosminidae, Chidoridae), Rotifera, Cyclopoida, Nauplius and Skistodiaptomus pallidus have also been reported [46,62] (Table 1).
In the western United States, the biomass of large Cladocera (D. pulex complex) and Cyclopoida (Diacyclops thomasi) reportedly increases as lakes become deeper and cooler, and with an increase in unproductive land use and forested catchment in the watershed [63]. The biomass of small Cladocera (Daphnia retrocurva, Diaphanosoma spp., Cydorus sphaericus) and Cyclopoida (Tropocyclops prasinus) increases as watershed land becomes more productive and is affected by agriculture [63]. It has also been suggested that the body length of Cladocera and the biomass of Daphnidae decrease as water temperature increases and latitude decreases [63] (Table 1).
In terms of biological interactions, the specialist Cladocera and Calanoida species, commonly found in eutrophic lakes, were identified [46]. The biomass of Rotifera and Cyclopoida reportedly increases as bottom-up pressures increase, including both direct and indirect pressures caused by nutrient salts (total P) and Chlorophyll a, while the biomass of Calanoida and Cladocera decreases [64] (Table 1).
The average body weight of Cladocera and the biomass ratio of zooplankton/phytoplankton reportedly decrease as the biomass of planktivorous fish increases [60]. At low latitudes, the predation pressure on zooplankton by planktivorous fish, such as salmon (Oncorhynchus spp.), lake trout (Salvelinus spp.), and gizzard shad (Dorosoma cepedianum), is high, affecting the size and biomass of Cladocera and Copepoda [63] (Table 1).
In previous studies related to zooplankton indicators, regardless of region or disturbance factors, the abundance or biomass of large Cladocera, Calanoida Copepoda, decreased as disturbances increased (total P concentration, predation pressure of fish, commercial land use in watersheds, etc.). In contrast, the abundance or biomass of small Cladocera, Rotifera, and Cyclopoida Copepoda showed an increasing trend (Table 1).
Although there is a common zooplankton community that responds to disturbance, zooplankton species may respond differently, depending on the area of occurrence and the disturbance. When developing a lake health evaluation index using the results from previous studies, an understanding of the zooplankton species inhabiting the target area is needed before a “good” index can be selected [21] (Table 1).
Alongside studies of changes in zooplankton communities in response to environmental change, research on group-specific separations of response factors and the formation of formulae have also been conducted. In a previous study of the degree of eutrophication of a lake ecosystem, the number of species of specific zooplankton taxa (Rotifera, Copepoda, and Cladocera) and a eutrophication index were used together. Index values < 0.2 indicated oligotrophic lakes, greater than 0.2 and less than 1 were mesotrophic, greater than 1 and less than 4 were eutrophic, and greater than 4 indicated hypertrophic lakes [65].
In summary, assessments of zooplankton community changes to evaluate the health of lake ecosystems have been conducted, but with variations in the zooplankton indicators, type of environmental disturbance, and zooplankton characteristics used. Inconsistencies in evaluation results using specific taxa have also been reported, with conflicting trends in the abundance or species composition [32]. Recently, a more comprehensive metric to evaluate a specific lake has been developed.
Table 1. Zooplankton individuals body specification and community indicator that related with environmental factors. * Abundance; ** biomass; *** richness of zooplankton. ● means related, - means not related with environmental factors.
Zooplankton
Indicators
Related Environment FactorsResponse to Increase of FactorsReference
EutrophicationChl-aTPWater HardnessProductive Land UseFish BiomassWater Temperature/Latitude
Total
Zooplankton ***
-----Decrease[43,60]
Mean body size------Decrease[43]
Rotifera *,**----Increase[46,62,64]
Small Rotifera *
(<0.2 mm)
------Decrease[61]
Small
Cladocera **
----Increase[46,62,63]
Large
Cladocera *,***
------Increase[61]
----Decrease[46,62,63,64]
Cladocera
body weight
-----Decrease[60]
Cladocera
mean body size
------Increase[61]
Daphnia spp./
Cladocera **
------Decrease[60]
Cyclpoida *,**----Increase[46,62,64]
Cyclopoida/
Copepoda *,**
------Increase[60]
Calanoida ***----Decrease[46,62,64]
Calanoida/
Copepoda *,**
------Decrease[60]

2.3. Zooplankton Indices for Freshwater Ecosystem Health Assessment

Recently, many multi-metric indices (MMI) for freshwater (especially lake) ecosystem health assessments have been developed and used. The multi-metric method using an integrated index responding to multiple co-varying stressors provides a more comprehensive assessment, and increases confidence in assessment [66,67]. This is obtained by eliminating the possible dilemmas arising when only a single index or assemblage attributed to the different types of indices responds differently to diverse stressor types [68].
The European ECOFRAME project (for the ecological quality and functioning of shallow lake ecosystems with respect to the needs of the European Water Framework Directive 2003), through the development of a zooplankton index for assessing shallow lakes, has shown that the ratio of specific taxonomic groups in zooplankton communities is more effective than using absolute values (e.g., number of species and abundance) for ecosystem assessment [12]. In this index, the zooplankton species were categorized according to their body size, and simple coefficients calculated based on the proportion of large-bodied zooplankton biomass were used. Zooplankton body size is an important factor in determining their susceptibility to fish predation and a prey selection spectrum for phytoplankton assemblages. In ecologically healthy lakes, riparian aquatic plant communities function as effective shelters for large zooplankton, which can shed predatory pressure of fish [69]. Thus, the proportion of large Cladocera is higher in ecologically healthy lakes than in unhealthy lakes. In this study, species between 0.2 and 5 mm (Diaphanosoma, Moina, Leydigia leydigii, Holopedium gibberum, and Simocephalus vetulus) were classified as large Cladocera. The large bodied-zooplankton category generally includes Cladocera and Copepoda larger than 0.48 mm in size; specifically, among Cladocera species, genera Ceriodaphnia, Moina, Diaphanosoma, and Daphnia are included, while Bosmina, Alona, and Chydorus are excluded [70]. As zooplankton are grazers of phytoplankton, the “zooplankton biomass/Chlorophyll a concentration” equation was created to calculate the predation pressure of zooplankton, and the phytoplankton biomass was replaced by the Chlorophyll a concentration. This index calculates the impact of zooplankton on phytoplankton as the ratio of producers to primary consumers [12] (Table 2).
Kane et al. [47] presented the Planktonic Index of Biotic Integrity(P-IBI) that can assess the health of Lake Erie at the catchment scale using appropriate metrics selected through factor analysis among candidate metrics suggested in the available literature. The study utilized seasonally varying scores to represent different environmental conditions throughout the year. The mean site score for each year was determined by summing the individual planktonic metric scores for June, July, and August and dividing by the number of metrics. Furthermore, the basin mean score was calculated by summing the average site scores and dividing by the number of sites. Subsequently, the lake-wide plankton IBI scores were obtained by summing the basin average scores and dividing by the number of basins. This index demonstrates a strong correspondence with traditional measures of lake nutrient status, reflecting the degree of eutrophication. The ratio of the total June phytoplankton biomass index scores ( CB jk ) directly uses the percentage values of Cyanobacteria abundance, Anabaena, Aphanizomonon, and Microcystis, which reduce water quality as undesirable algae, and the usefulness of the phytoplankton community as a food source. The Limnocalanus macrurus abundance metric score ( LM jk ) in July and the (Calanoida/[Cladocera + Cyclopoida]) ratio ( RJ jk ) in June decline together, indicating the food environment for the zooplankton community had deteriorated. Individual metrics using different plankton groups can provide information on benefit use impairment (BUI), which indicates the degree of eutrophication at different trophic levels. BUI can explain the damage to water resources by humans and assess the degree of impact on human health (e.g., water restriction), ecosystem function, or both [47] (Table 2).
Ejsmont-Karabin [34,50] developed an index to calculate TSI ROT and TSI CR (Indices of the trophic state of lakes), which are health status values of lakes using Rotifera and Crustacea. Through statistical analysis, the relationship between TSI SD + CHL —which is the average of TSI SD (trophic state index calculated by transparency) and TSI CHL (trophic state index calculated by the concentration of Chlorophyll a)—and zooplankton indicators that can indicate the trophic state of the lake (e.g., Rotifera abundance, Crustacea abundance, and Cyclopoida biomass) was identified, and a relational equation was presented. This equation indicates the trophic state of the lake using zooplankton. Lakes with TSI ROT and TSI CR values <45 were presented as oligotrophic, 45–55 as mesotrophic, 55–65 as eutrophic, and >65 as hypertrophic. Keratella cochlearis, which is the most common rotifer that appears in most lakes, shows a tendency to increase the abundance of Keratella cochlearis f. tecta type, in which the posterior spine disappears when the lake is eutrophic [71,72]. In this study, the following data are presented as equations that can explain the trophic state of lakes: percentage of form tecta in the population of Keratella cochlearis, Rotifera numbers, Rotifera biomass, percentage of bacterivores in the total number of Rotifera, ratio of biomass to number, percentage of species indicative of high trophy in the indicative Rotifera group’s number, number of Crustacea, biomass of Cyclopoida, percentage of Cyclopoida biomass in the total biomass of Crustacea, ratio of the Cyclopoida biomass to the biomass of Cladocera, ratio of Cyclopoida to Calanoida numbers, and percentage of species indicative of high trophy in the indicative number of Crustacea [34,50] (Table 2).
A more specific index focusing on the biological interaction between zooplankton and phytoplankton, the grazing potential (GP) index, combining the zooplankton and phytoplankton indices, has been proposed [48]. The GP value, formed using the sum of specific species, provides important information on food web function in an easy and cost-effective manner by combining zooplankton and phytoplankton metrics. Lakes with high GP values show that large Cladocera and Copepoda occupy a large proportion of the total zooplankton biomass. However, lakes with low GP values show a trend toward increased phytoplankton biomass, or increased population density of small zooplankton. The variables used in GP are identified at the genus level rather than at the species level, making it easier to identify and calculate than an index that uses species-level information. In the B ED value calculation, a total phytoplankton index, a multiple (very good [1]; very bad [0]) was set in front of the variable to account for the relative edibility of phytoplankton [48] (Table 2).
On the other hand, index based on local biological assemblages and their interactions with environmental variables also has been developed. Ochocka [21] presented the Zooplankton Index of Polish Lakes’ Assessment (ZIPLAs), which showed the strongest correlation with transparency. Of the 31 candidate metrics, five were selected for use in the index, showing the strongest correlations with TP, TN, transparency, and PCA TOT (a cumulative nutrient load index calculated based on principal component analysis). The ecologically healthiest reference lakes were those that had no sources of pollution entering the water body, had the highest water quality status according to existing data, and had at least 80% natural land use within the watershed. Additionally, the dividing values of high (H), good (G), normal (M), poor (P), and very poor (B) indices were 75%, 50%, and 25% of the reference lake. CA/CY is the second most strongly correlated metric with TP for the ratio of Calnoida to Cyclopoida individual numbers, and the value of this index decreases with increasing eutrophication. Based on these results, it is clear that Calanoida prefer oligotrophic lakes. Zooplankton abundance (NZOL) is a commonly used index for assessing the trophic state of lakes [73,74,75]. This index is easy to calculate, decreases as TP concentrations increase, and is highly correlated with the nutrient status of the lake. The percentage of tecta in the population of Keratella cochlearis (TECTA) is an available indicator of the ecological status of lakes, particularly for lakes where Rotifera dominate and Cladocera and Copepoda are rare. In this study, Keratella cochlearis f. tecta, K. quadrata, Pompholyx sulcata, Filinia longicata, Anualeopsis fissa, Trichocerca pulchella, Brachionus undularis, and Brachionus dirsicornis were used as indicative species of high trophic levels. Rotifera species indicative of high trophic levels in the group that frequently occur in high-nutrient lakes can differ from country to country. Therefore, a list of national and regional indicator species should be used when assessing lakes using this index. The two diversity indices selected in this study were the Shannon–Weaver index and the Margalef index; however, of the two indices, the Margalef (d) index, which represents the number of species relative to the total number of individuals, in contrast to the Shannon–Weaver index, which has a statistically highly significant correlation with environmental variables. Consequently, ZIPLAs decreased as the pollution level of the lakes increased [21] (Table 2).
Stamou [49] presented the Zoo-IQ index, which includes zooplankton biomass and body size information. The metrics used in this index are the total abundance of zooplankton ( A zoo ) and total dry biomass of zooplankton ( B zoo ), which are indices of the response of zooplankton to phytoplankton. Under eutrophic conditions characterized by increased nutrient content and bottom-up pressure, A zoo and B zoo exhibit a tendency to rise, potentially impacting zooplankton population growth. The morphometric mean size of zooplankton ( MW zoo ) provides insights into the functioning of the pelagic food web in lakes, where the presence of large Cladocera (particularly Daphnia) and Calanoida can effectively control the entire size range of phytoplankton and even induce clear water phases. The mean size was not measured directly, but was calculated as the ratio of dry biomass to abundance. The ratio of large Cladocera to total Cladocera abundance ( R clad ) serves as an estimate of the changes in dominance among different functional groups, determined by Cladocera feeding mode. However, R clad and MW zoo decrease as eutrophication processes, reflecting changes in zooplankton groups’ domination patterns, with small-bodied species dominating in eutrophic lakes with Cyanobacteria blooms, but also the predation pressure by fish on large- bodied species. The metric value of the healthiest lake in the dataset was set as the reference value; the metric value was rated as good (5) if it was similar to the reference value; normal (3) if different from the reference value; and poor (1) if substantially different from the reference value. The sum of all metric scores was set as the Zoo-IQ value. This index is the result of synthesizing various stress factors, and can be used as an index to evaluate the decline in the general lake status [49] (Table 2).
Table 2. Zooplankton metrics developed for lake health assessment.
Zooplankton MetricsDescriptionParameterReference
Zoopl   lge : total = x y Ratio of large Cladocera frequently appearing in healthy lakex = Large Cladocera (>0.5 mm) individual number
y = Cladocera individual number
[12]
Zoopl : phyto = a b Effects of zooplankton predation on phytoplanktona = Cladocera and copepod biomass
b = Chlorophyll a concentration
P IBI = 1 B k = 1 B 1 S j = 1 S 1 M ( EA jk + CB jk                                                                 + RJ jk + LM jk + RA jk                                                                 + ZB jk ) Eutrophic < 3
3 ≤ Mesotrophic ≤ 4
4 < Oligotrophic
EA jk = June biomass of edible algae taxa metric score
CB jk = June% Mycrocystis, Anabaena, Aphanizomenon of total phytoplankton biomass metric score
RJ jk = June zooplankton ratio (Calanoida/(Cladocera + Cyclopoida)) metric score
LM jk = July Limnocalanus macrurus density metric score
RA jk = August zooplankton ratio (Calanoida/(Cladocera + Cyclopoida)) metric score
ZB jk = August Crustacea zooplankton biomass metric score
M = Number of metrics
S = Number of sites (within a basin)
B = Number of basins
[47]
TSI ROT 1 = 5.38 Ln N + 19.28
TSI ROT 2 = 5.63 Ln B + 64.47
TSI ROT 3 = 0.23 BAC + 44.30
TSI ROT 4 = 3.85 B : N 0.318
TSI ROT 5 = 0.187 TECTA                                                                                                     + 50.38 TSI ROT 6                                                           = 0.203 IHT + 40.0
A lake trophic state evaluation index using the Rotifera communityN = Rotifera numbers (ind./L)
B = Total biomass (mg w.wt./L)
BAC = Percentage of bacterivores in total numbers (%)
TECTA = Percentage of form tecta in the population of Keratella cochlearis (%)
B:N = Ratio of biomass to numbers (mg w.wt./ind.)
IHT = Percentage of species indicative of high trophy in the indicative group’s numbers (%)
[34]
TSI CR 1 = 25.5 N 0.142
TSI CR 2 = 57.6 B 0.081
TSI CR 3 = 40.9 CB 0.097
TSI CR 4 = 58.3 CY / CL 0.071
TSI CR 7 = 5.08 Ln CY / CA + 46.6
TSI CR 8 = 43.8 e 0.004 IHT
A lake trophic state evaluation index using the Crustacea communityN = Numbers of Crustacea (ind./L)
B = Biomass of Cyclopoida (mg w.wt./L)
CB = Percentage of Cyclopoida biomass in total biomass of Crustacea (%)
CY/CL = Ratio of the Cyclopoida biomass to the biomass of Cladocera
CY/CA = Ratio of Cyclopoida to Calanoida numbers
IHT = Percentage of species indicative of high trophy in the indicative group’s numbers (%)
[38]
GP = B ROT + B CLAD + 0.5 B COP B ED
B ED = 0.3 B CYANO + 0.5 B CHRYSO                                                           + 1 B CRYPTO +
1 B PRYMNESIO + 0.7 B DIATOMS + 0 B DINO                                                           + 0.3 B CONJ
An index that measures the ecological water quality of a lake by combining the dry biomass of plankton
Low GP values: high zooplankton biomass dominated
High GP values: increased phytoplankton biomass
B = dry biomass(mg/L)
ROT = Rotifera
CLAD = Cladocera
COP = Copepoda
CYANO = Cyanobacteria
CHLORO = Chlorophyta
CHRYSO = Chrysophyta
CHYPTO = Cryptophyta
PRYMNESIO = Prymnesiophyta
DIATOMS = Bacillariophyta
DINO = Dinophyta
CONJ = Conjugatophyta
[48]
ZIPLA s = CA CY + NZOL + TECTA + IHYROT + d 5 bad ≤ 0.189
0.189 < poor ≤ 0.376
0.377 ≤ moderate ≤ 0.565
0.566 ≤ good ≤ 0.754
0.755 ≤ High
CA/CY = Ratio of Calanoida to Cyclopoida individual numbers(ind./L)
NZOL = Zooplankton abundance(ind./L)
TECTA = Percentage of form tecta in the population of Keratella cochlearis(%)
IHTROT = Percentage of species indicative of high trophy in the indicative group’s number (%)
D = Margalef’s diversity index
[21]
Zoo IQ = A Zoo + B Zoo + MW Zoo                                                             + R Clad Bad ≤ 6
6 < Poor ≤ 10
10 < Moderate ≤ 14
14 < Good ≤ 18
18 < High
A Zoo   = Abundance (ind./L)
B Zoo   = Biomass (μg/L)
MW Zoo   = Mean body size (ind./μg)
R Clad   = Cladocera ratio
[49]

3. Proposing Perspectives for Advancing Zooplankton Indices

3.1. Application of Biomass in Calculating Zooplankton Index

Zooplankton communities’ responses to environmental changes have been primarily monitored by abundance, but population-based zooplankton community analyses do not reflect size differences among species [76,77]. Zooplankton have a wide size fraction, ranging from microscale to mesoscale, and these size differences among species lead to differences in their function and role within the food web of the aquatic ecosystem [78].
The role of zooplankton in aquatic food webs varies depending on their size, particularly for larger Cladocera, which have a direct impact on phytoplankton through grazing and are selectively consumed by fish, making them more important in energy transfer and nutrient cycling. Therefore, in assessing the functional aspects of zooplankton within the entire food web, the proportion of Cladocera, especially larger species, holds significant importance. Thus, the development of indices using biomass, rather than abundance, can more accurately and effectively represent the role of zooplankton in the food web. Comparing the ratios of Rotifera and Cladocera in lakes with different trophic statuses, it was observed that, in mesotrophic lakes, when calculated based on biomass, Cladocera accounted for 89% of the total, indicating a higher biomass compared to Rotifera. However, when calculated based on abundance, Cladocera represented only 43% of the total. Similarly, in eutrophic lakes, the proportion of Cladocera increased from 75%, based on abundance, to 99%, based on biomass. Consequently, using biomass, which is closely related to species size, in a mutually complementary manner to abundance, can provide a more accurate assessment of the community structure and function of zooplankton contributing to the material and energy cycles through biological interactions [79] (Figure 4).
The best biomass metric for estimating material and energy flow is dry weight, and measurements of dry weight generally require fresh individuals that are free of fluid loss and shrinkage due to chemical treatments such as formalin [51,80]. As fresh individuals are damaged in the process of measuring dry weight, samples for biomass measurement have a one-time characteristic. In addition, this process requires a lot of labor for identification, separation, and collection from the collected, dried, and weighed individuals [81]. As a complementary method, studies on zooplankton species’ length–weight relationships were conducted early on, and dry weight estimates were made using functional equations based on these studies [51,82,83]. For Cladocera and Copepoda species, dry weight can be estimated using linear regression equations between length and weight, and the dry weight of Rotifera can be estimated using equations that consider species-specific formula factors (FF), such as the ratio of volume of appendages to whole biovolume (%BV), along with length [84] (Table 3). Species-specific constants (ln a and b), FF, and %BV for each equation can be found in the GLNPO standard operating procedures [84], which present a compilation of values from various studies [51,85,86,87].
Figure 4. Comparison of the ratio of zooplankton species, Cladocera and Rotifera, using abundance (ind. L 1 ) and biomass (μg. L 1 ). The fall zooplankton community data collected through vertical tow sampling in oligotrophic (Lake Soyang), mesotrophic (Lake Chuncheon), and eutrophic (Lake Seo) lakes (unpublished data). Biomass of Rotifera and Cladocera were calculated using the length–weight conversion equation provided by the EPA [84].
Sustainability 15 10950 g004
Table 3. The formulae proposed by the GLNPO standard operating procedure for estimating zooplankton biomass from length are as in following table [84].
ClassificationFormula
Cladoceraln W = ln a + b × ln Lln a, b = species specific constants
Copepoda *
RotiferaBasicW = {(L3 × FF) + (%BV × L3 × FF)}
× 10−6 × WW:DW
w = the width measurement (μm)
FF = species specific formula factor
%BV = a percent of the volume of appendages to biovolume
10−6 = conversion to wet weight; assuming a density of 1)
WW:DW ** = conversion to dry weight from wet weight
CollothecaW = (w3 × FF) × 10−6 × WW:DW
Filinia
Trichocerca
Conochilus
Conochiloides
W = {(L × w2 × FF) + (%BV × L × w2 × FF)}
× 10−6 × WW:DW
Note: W (μg) means the dry weight estimate, and L means the length measurement. L unit of planktonic Crustacea (Cladocera, Copepoda) and Rotifera are set to mm and μm, respectively. * In the case of Copepoda nauplius, it is assumed to have a constant dry weight (0.400 μg) by Hawkins and Evans (1979) [88]. ** The genus Asplanchna has a WW:DW value of 0.039, while all other genera have a value of 0.1 [51,89].
Biomass is affected not only by local factors, such as water quality, biological interactions, and habitat environment, but also by geographical factors (e.g., latitude and longitude) and global factors (e.g., climate change) [77]. This has led to active research on changes in zooplankton biomass owing to changes in trophic conditions, predation pressure, and habitat disturbance in water bodies as well as ongoing research to derive formulas for more accurate biomass estimates and comparisons in water bodies with different geographic and physicochemical characteristics [60,63,64,76,77,90]. As a basic reference, the results of these studies have led to the development of various zooplankton biomass indices. Zooplankton, which play an intermediate role in aquatic ecosystem food webs, can be used to assess ecological water quality based on their changing biomass; this is because they consume primary producers, phytoplankton, and are predated by fish, reflecting a combination of physicochemical and biological factors associated with eutrophication of water bodies [48,49]. In addition, zooplankton biomass can be used as a biochemical index to track production movement within a food web as an essential element in the calculation of secondary production in a water body [91]. It can also be used as an index to assess the bioaccumulation of organic compounds, such as PAHs, enabling comprehensive monitoring of aquatic ecosystems in various aspects (e.g., health and stability) [92].

3.2. Application of eDNA to the Development of Zooplankton Indices

eDNA refers to free DNA as DNA complexes derived from living organisms, particularly in water, air, or soil environments [93]. eDNA has unprecedented advantages (high efficiency and low cost) in biodiversity studies, and has recently been applied to a wide range of aquatic ecosystem studies, including species richness and diversity and tracking target species for presence/absence determination [94,95].
The application of eDNA techniques is based on polymerase chain reaction (PCR), and can be approached in two ways: (1) by using species-specific primers to determine the presence or absence of a single species [96]; and (2) by metabarcoding, a method of determining the composition of the entire inhabiting taxonomic group [93]. Single-species confirmation has been applied in North America to monitor Bythotrephes longimanus, an invasive alien species from Europe [97]. However, most zooplankton species are cosmopolitan, limiting their application in invasive species-targeting studies. Furthermore, the methods to determine community composition have recently been applied primarily to biodiversity studies [98,99,100].
There are several considerations when analyzing the zooplankton community composition from DNA fragments in water. For vertebrates with a wide range of habitats, such as fish and Amphibia, eDNA techniques can be useful for determining the presence of target organisms, because DNA fragments can be detected using small volumes of water samples [101,102]. However, for zooplankton with small individual sizes, the detection efficiency of traditional net sampling may be higher than that of eDNA methods using raw water sampling, because a large volume of raw water is filtered and zooplankton abundance is highly concentrated in the sample collected by net towing.
However, it has the advantage of complementing the identification of species that are difficult to classify using traditional methods, such as the classification of conspecifics and siblings, and the identification of species in dormant eggs and larval stages, thereby improving resolution and efficiency, which are key issues in biodiversity monitoring [103,104]. Owing to these advantages, eDNA analyzers have been actively applied to abundance and species diversity monitoring based on zooplankton abundance. Recent studies have suggested that eDNA analysis methods can identify biodiversity with equal or better performance than morphological analysis methods [105,106]. For example, in the analysis of seasonal changes in zooplankton α-diversity, metabarcoding showed a consistent relationship with morphological methods in identifying changes in species composition of zooplankton and species diversity of Copepoda; 37 species were detected by metabarcoding analysis and 11 species by morphological analysis, demonstrating the applicability of eDNA analysis methods in monitoring species diversity [106].
Quantification of abundance and overall biodiversity index calculation based on detected gene abundance is one of the main issues of interest in the application of eDNA analysis techniques. For example, a study combined eDNA analysis with freshwater zooplankton monitoring to evaluate the applicability of eDNA analysis for species diversity monitoring by comparing the relative frequencies of amplicon sequence variants (ASVs) among metabarcoding techniques for abundance and diversity indices of each taxon (Rotifera, Cladocera, and Copepoda) [107]. In that study, the increase and decrease patterns of the relative abundance of Rotifera and Cladocera and those of ASVs were similar; in the case of the diversity index, the increase and decrease patterns of the index using microscopic data and the index calculated using ASVs were similar, confirming the positive potential of using eDNA analysis to quantify the relative abundance of zooplankton. However, owing to the lack of genetic information in current NGS databases, there is a tendency for discrepancies between eDNA metabarcoding and morphological analyses [108]. Furthermore, in the case of Rotifera in particular, the lack of NCBI data limits the number of species that can be detected through eDNA metabarcoding, which limits accurate monitoring of the entire zooplankton community [107].
In conclusion, although it is difficult to identify and quantitatively analyze all zooplankton species based on current genetic information, there is ample potential for metabarcoding applications for various indices calculated using the relative abundance of specific species. In particular, in the case of Calanoida and Cyclopoida, which are demanding extensive efforts and time, but are divided into sensitive and resistant species, and used in related indices, it is expected that the efficiency of applying indices using environmental DNA. In addition, DNA approach allows identification of copepodids and nauplii, which is not possible with morphological identification using microscope.

4. Conclusions

Biological indicators may represent the most notable environmental issues of the time. At the same time, the scope and area of interest that a biological indicator can reflect is limited to the techniques of sampling and the analytic methods for data collected at that time. In the 1980s, when studies on biological indicators of freshwater ecosystems using zooplankton had begun to be actively conducted, the most important environmental issue was the water quality problem in lakes and reservoirs due to eutrophication. Therefore, the focus of the zooplankton index was naturally on water quality, such as nutrient status, pollution by organic matter, and the consequent degree of eutrophication. Even now, in many countries, the problem of eutrophication remains unresolved, and the assessment of aquatic ecosystems using biological communities is used preferentially to diagnose eutrophication.
However, one of the most important environmental paradigms has now been shifted to the sustainable use of ecosystem services, which requires the management of water resources (e.g., water management considering the environment, social, and governance (ESG) approach) against various environmental changes and stresses, including climate change. Important national environmental monitoring programs are implemented for ecosystem health assessments using biota to ensure the sustainable use of valuable freshwater ecosystems, including water resources, aquatic habitats for biodiversity conservation, and aesthetic values as waterfront spaces. In line with this shift, a variety of new technologies are being incorporated into ecological research, enabling various quantitative approaches to the structure and function of aquatic food webs that were not possible with conventional methods in the past. Under the new environmental paradigm, both detailed and comprehensive information regarding the zooplankton community are required, including species-level information such as the elucidation of species-specific roles in the food web, and community diversity and ecosystem stability based on the mechanisms of biological interactions from the perspective of functional groups. The development of indices that can summarize the results and information obtained from those scientific approaches and express them in correct numbers is another important issue. Therefore, the summary of concept and application of the zooplankton-based biological indices and MMI, as well as suggestions for future issues such as new technologies applicable to zooplankton and aquatic ecosystems, will be useful not only for scientific approaches but also for the future management of water resources for their sustainable use.

Author Contributions

Conceptualization, Y.C., H.-J.O., K.-H.C. and H.-W.K.; validation, K.-H.C.; formal analysis, Y.C. and H.-J.O.; data curation, D.-H.L., H.-J.O. and Y.C.; writing—original draft preparation, Y.C., H.-J.O. and K.-H.C.; writing—review, K.-H.C. and H.-W.K.; writing—editing, H.-J.O. and K.-H.C.; visualization, Y.C. and D.-H.L.; supervision, K.-H.C., H.-W.K. and M.-H.J.; project administration, H.-W.K. and M.-H.J.; funding acquisition, K.-L.L. and M.-H.J. All authors have read and agreed to the published version of the manuscript.

Funding

This research was supported by the National Institute of Environmental Research (Grant no. NIER-2022-04-02-109).

Institutional Review Board Statement

Not applicable.

Informed Consent Statement

Not applicable.

Data Availability Statement

Not applicable.

Conflicts of Interest

The authors declare no conflict of interest. The funders had no role in the design of the study; in the collection, analyses, or interpretation of data; in the writing of the manuscript, or in the decision to publish the results.

References

  1. Schaeffer, D.J.; Herricks, E.E.; Kerster, H.W. Ecosystem health: I. Measuring ecosystem health. Environ. Manag. 1988, 12, 445–455. [Google Scholar] [CrossRef]
  2. Rapport, D.J. What constitutes ecosystem health? Perspect. Biol. Med. 1989, 33, 120–132. [Google Scholar] [CrossRef]
  3. Ulanowicz, R.E. Ecosystem health and trophic flow networks. In Ecosystem Health: New Goals for Environmental Management; Island Press: Washington, DC, USA, 1992; pp. 190–206. [Google Scholar]
  4. Rapport, D.J.; Costanza, R.; McMichael, A.J. Assessing ecosystem health. Trends Ecol. Evol. 1998, 13, 397–402. [Google Scholar] [CrossRef]
  5. Xu, F.L.; Tao, S.; Dawson, R.W.; Li, P.G.; Cao, J. Lake ecosystem health assessment: Indicators and methods. Water Res. 2001, 35, 3157–3167. [Google Scholar] [CrossRef] [PubMed]
  6. Rapport, D.J. The health of ecology and the ecology of health. Hum. Ecol. Risk Assess. 2002, 8, 205–213. [Google Scholar] [CrossRef]
  7. Davis, W.S.; Simon, T.P. (Eds.) Biological Assessment and Criteria: Tools for Water Resource Planning and Decision Making; CRC Press: Boca Raton, FL, USA, 1995. [Google Scholar]
  8. Barbour, M.T. Rapid Bioassessment Protocols for Use in Wadeable Streams and Rivers: Periphyton, Benthic Macroinvertebrates and Fish; US Environmental Protection Agency, Office of Water: Washington, DC, USA, 1999. [Google Scholar]
  9. Klemm, D.J.; Blocksom, K.A.; Fulk, F.A.; Herlihy, A.T.; Hughes, R.M.; Kaufmann, P.R.; Peck, P.R.; Stoddard, J.L.; Thoeny, W.T.; Griffith, M.B.; et al. Development and Evaluation of a Macroinvertebrate Biotic Integrity Index(MBII) for Regionally Assessing Mid-Atlantic Highlands Streams. Environ. Manag. 2003, 31, 656–669. [Google Scholar] [CrossRef] [PubMed]
  10. Kolpin, D.W.; Barbash, J.E.; Gilliom, R.J. Occurrence of pesticides in shallow groundwater of the United States: Initial results from the National Water-Quality Assessment Program. Environ. Sci. Technol. 1998, 32, 558–566. [Google Scholar] [CrossRef] [Green Version]
  11. Directive, W.F. Water framework directive. J. Ref. OJL 2000, 327, 1–73. [Google Scholar]
  12. Moss, B.; Stephen, D.; Alvarez, C.; Becares, E.; Bund, W.V.D.; Collings, S.E.; Donk, E.V.; Eyto, E.D.; Feldmann, T.; Fernández-Aláez, C.; et al. The determination of ecological status in shallow lakes—A tested system (ECOFRAME) for implementation of the European Water Framework Directive. Aquat. Conserv. Mar. Freshw. 2003, 13, 507–549. [Google Scholar] [CrossRef]
  13. US EPA. National Lakes Assessment: A Collaborative Survey of the Nation’s Lakes; Environmental Protection Agency, Office of Water and Office of Research and Development: Washington, DC, USA, 2009; p. 118. [Google Scholar]
  14. US EPA. National Wetland Condition Assessment 2001: Field Operations Manual; Environmental Protection Agency: Washington, DC, USA, 2011. [Google Scholar]
  15. US EPA. National Coastal Condition Assessment 2010; Environmental Protection Agency, Office of Water and Office of Research and Development: Washington, DC, USA, 2015; p. 129. [Google Scholar]
  16. US EPA. National Rivers and Streams Assessment 2008–2009: A Collaborative Survey; Environmental Protection Agency, Office of Water and Office of Research and Development: Washington, DC, USA, 2016; p. 131. [Google Scholar]
  17. Minshall, G.W. Towards a theory of macroinvertebrate community structure in stream ecosystems. Archiv. Hydrobiol. 1985, 104, 49–76. [Google Scholar] [CrossRef]
  18. Jeppesen, E.; Jensen, J.P.; Søndergaard, M.; Lauridsen, T.; Pedersen, L.J.; Jensen, L. Top-down control in freshwater lakes: The role of nutrient state, submerged macrophytes and water depth. Hydrobiologia 1997, 342, 151–164. [Google Scholar] [CrossRef]
  19. Zaghloul, A.; Saber, M.; Gadow, S.; Awad, F. Biological indicators for pollution detection in terrestrial and aquatic ecosystems. Bull. Natl. Res. Cent. 2020, 44, 1–11. [Google Scholar] [CrossRef]
  20. Karr, J.R. Assessing Biological Integrity in Running Waters: A Method and Its Rationale; Illinois Natural History Survey Special Publication No. 05; Illinois Natural History Survey: Champaign, IL, USA, 1986. [Google Scholar]
  21. Ochocka, A. ZIPLAS: Zooplankton Index for Polish Lakes’ Assessment: A new method to assess the ecological status of stratified lakes. Environ. Monit. Assess. 2021, 193, 664. [Google Scholar] [CrossRef]
  22. Blew, R.D. On the definition of ecosystem. Bull. Ecol. Soc. Am. 1996, 77, 171–173. Available online: https://www.jstor.org/stable/20168066 (accessed on 9 July 2023).
  23. Morse, J.C.; Bae, Y.J.; Munkhjargal, G.; Sangpradub, N.; Tanida, K.; Vshivkova, T.S.; Wang, B.; Yang, L.; Yule, C.M. Freshwater biomonitoring with macroinvertebrates in East Asia. Front. Ecol. Environ. 2007, 5, 33–42. [Google Scholar] [CrossRef]
  24. Allen, H.L. Primary productivity, chemo-organotrophy, and nutritional interactions of epiphytic algae and bacteria on macrophytes in the littoral of a lake. Ecol. Monogr. 1971, 41, 97–127. [Google Scholar] [CrossRef]
  25. Welti, N.; Striebel, M.; Ulseth, A.J.; Cross, W.F.; DeVilbiss, S.; Glibert, P.M.; Guo, L.; Hirst, A.G.; Hood, J.; Kominoski, J.S.; et al. Bridging food webs, ecosystem metabolism, and biogeochemistry using ecological stoichiometry theory. Front. Microbiol. 2017, 8, 1298. [Google Scholar] [CrossRef] [Green Version]
  26. Jeppesen, E.; Noges, P.; Davidson, T.A.; Haberman, J.; Noges, T.; Blank, K.; Lauridsen, T.L.; Søndergaard, M.; Sayer, C.; Laugaste, R.; et al. Zooplankton as indicators in lakes: A scientific-based plea for including zooplankton in the ecological quality assessment of lakes according to the European Water Framework Directive (WFD). Hydrobiologia 2011, 676, 279–297. [Google Scholar] [CrossRef]
  27. Mehner, T.; Keeling, C.; Emmrich, M.; Holmgren, K.; Argillier, C.; Volta, P.; Winfield, I.J.; Brucet, S. Effects of fish predation on density and size spectra of prey fish communities in lakes. Can. J. Fish. Aquat. Sci. 2016, 73, 506–518. [Google Scholar] [CrossRef] [Green Version]
  28. Park, K.S.; Shin, H.W. Studies on phyto-and-zooplankton composition and its relation to fish productivity in a west coast fish pond ecosystem. J. Environ. Biol. 2007, 28, 415. [Google Scholar]
  29. Bruce, L.C.; Hamilton, D.; Imberger, J.; Gal, G.; Gophen, M.; Zohary, T.; Hambright, K.D. A numerical simulation of the role of zooplankton in C, N and P cycling in Lake Kinneret, Israel. Ecol. Model. 2006, 193, 412–436. [Google Scholar] [CrossRef]
  30. Korponai, J.; Braun, M.; Forró, L.; Gyulai, I.; Kövér, C.; Nédli, J.; Urák, I.; Buczkó, K. Taxonomic, functional and phylogenetic diversity: How subfossil cladocerans mirror contemporary community for ecosystem functioning: A comparative study in two oxbows= Sesgos en la diversidad taxonómica, funcional y filogenética de las comunidades vivas y subfósiles de cladóceros. Limnetica 2019, 38, 431–456. [Google Scholar] [CrossRef]
  31. Wetzel, R.G.; Likens, G. Limnological Analyses; Springer Science & Business Media: Berlin/Heidelberg, Germany, 2000. [Google Scholar]
  32. May, L.; O’Hare, M. Changes in rotifer species composition and abundance along a trophic gradient in Loch Lomond, Scotland, UK. In Rotifera X: Rotifer Research: Trends, New Tools and Recent Advances, Proceedings of the Xth International Rotifer Symposium, held in Illmitz, Austria, 7–13 June 2003; Springer: Dordrecht, The Netherlands, 2005; pp. 397–404. [Google Scholar] [CrossRef]
  33. Duggan, I.C.; Green, J.D.; Shiel, R.J. Distribution of rotifers in North Island, New Zealand, and their potential use as bioindicators of lake trophic state. In Rotifera IX: Proceedings of the IXth International Rotifer Symposium, Khon Kaen, Thailand, 16–23 January 2000; Springer: Dordrecht, The Netherlands, 2001; pp. 155–164. [Google Scholar] [CrossRef]
  34. Ejsmont-Karabin, J. The usefulness of zooplankton as lake ecosystem indicators: Rotifer trophic state index. Pol. J. Ecol. 2012, 60, 339–350. [Google Scholar]
  35. Ichise, S.; Wakabayashi, T. Illustrated Handbook of Freshwater Plankton in Japan; Godo Shuppan: Tokyo, Japan, 2005; pp. 116–117, 125. [Google Scholar]
  36. Dodson, S.I.; Frey, D.G. Chapter 22 Cladocera and other Branchiopoda. In Ecology and Classification of North American Freshwater-Invertebrates; Thorp, J.H., Covich, A.P., Eds.; Academic Press: San Diego, CA, USA, 2001. [Google Scholar]
  37. Lampert, W.; Sommer, U. Limnoecology: The Ecology of Lakes and Streams; Oxford University Press: Oxford, UK, 2007. [Google Scholar]
  38. Chen, G.; Dalton, C.; Taylor, D. Cladocera as indicators of trophic state in Irish lakes. J. Paleolimnol. 2010, 44, 465–481. [Google Scholar] [CrossRef]
  39. Tumurtogoo, U.; Figler, A.; Korponai, J.; Sajtos, Z.; Grigorszky, I.; Berta, C.; Gyulai, I. Density and Diversity Differences of Contemporary and Subfossil Cladocera Assemblages: A Case Study in an Oxbow Lake. Water 2022, 14, 2149. [Google Scholar] [CrossRef]
  40. Korponai, J.L.; Kövér, C.; López-Blanco, C.; Gyulai, I.; Forró, L.; Katalinic, A.; Ketola, M.; Nevalainen, L.; Lioto, T.P.; Sarmaja-Korjonen, K.; et al. Effect of temperature on the size of sedimentary remains of littoral chydorids. Water 2020, 12, 1309. [Google Scholar] [CrossRef]
  41. Boxshall, G.A.; Defaye, D. Global diversity of copepods (Crustacea: Copepoda) in freshwater. Hydrobiologia 2008, 595, 195–207. [Google Scholar] [CrossRef]
  42. Perbiche-Neves, G.; Pomari, J.; Serafim-Júnior, M.; Nogueira, M.G. Cyclopoid copepods as indicators of trophic level in South American reservoirs: A new perspective at species level based on a wide spatial-temporal scale. Ecol. Indic. 2021, 127, 107744. [Google Scholar] [CrossRef]
  43. Gannon, J.E.; Stemberger, R.S. Zooplankton (especially crustaceans and rotifers) as indicators of water quality. Trans. Am. Microsc. Soc. 1978, 97, 16–35. [Google Scholar] [CrossRef]
  44. Pinto-Coelho, R.; Pinel-Alloul, B.; Méthot, G.; Havens, K.E. Crustacean zooplankton in lakes and reservoirs of temperate and tropical regions: Variation with trophic status. Can. J. Aquat. Sci. 2005, 62, 348–361. [Google Scholar] [CrossRef] [Green Version]
  45. Sendacz, S.; Caleffi, S.; Santos-Soares, J. Zooplankton biomass of reservoirs in different trophic conditions in the State of São Paulo, Brazil. Braz. J. Biol. 2006, 66, 337–350. [Google Scholar] [CrossRef] [PubMed] [Green Version]
  46. Van Egeren, S.J.; Dodson, S.I.; Torke, B.; Maxted, J.T. The relative significance of environmental and anthropogenic factors affecting zooplankton community structure in Southeast Wisconsin Till Plain lakes. Hydrobiologia 2011, 668, 137–146. [Google Scholar] [CrossRef]
  47. Kane, D.D.; Gordon, S.I.; Munawar, M.; Charlton, M.N.; Culver, D.A. The Planktonic Index of Biotic Integrity (P-IBI): An approach for assessing lake ecosystem health. Ecol. Indic. 2009, 9, 1234–1247. [Google Scholar] [CrossRef]
  48. Stamou, G.; Katsiapi, M.; Moustaka-Gouni, M.; Michaloudi, E. Grazing potential—A functional plankton food web metric for ecological water quality assessment in Mediterranean lakes. Water 2019, 11, 1274. [Google Scholar] [CrossRef] [Green Version]
  49. Stamou, G.; Mazaris, A.D.; Moustaka-Gouni, M.; Špoljar, M.; Ternjej, I.; Dražina, T.; Dorak, Z.; Michaloudi, E. Introducing a zooplanktonic index for assessing water quality of natural lakes in the Mediterranean region. Ecol. Inform. 2022, 69, 101616. [Google Scholar] [CrossRef]
  50. Ejsmont-Karabin, J.; Karabin, A. The suitability of zooplankton as lake ecosystem indicators: Crustacean trophic state index. Pol. J. Ecol. 2013, 61, 561–573. [Google Scholar]
  51. Dumont, H.J.; Van de Velde, I.; Dumont, S. The dry weight estimate of biomass in a selection of Cladocera, Copepoda and Rotifera from the plankton, periphyton and benthos of continental waters. Oecologia 1975, 19, 75–97. [Google Scholar] [CrossRef] [PubMed]
  52. Carpenter, S.R.; Kitchell, J.F.; Hodgson, J.R. Cascading trophic interactions and lake productivity. BioScience 1985, 35, 634–639. [Google Scholar] [CrossRef]
  53. Wickham, S.A. The direct and indirect impact of Daphnia and Cyclops on a freshwater microbial food web. J. Plankton Res. 1998, 20, 739–755. [Google Scholar] [CrossRef] [Green Version]
  54. Perga, M.E.; Kainz, M.; Matthews, B.; Mazumder, A. Carbon pathways to zooplankton: Insights from the combined use of stable isotope and fatty acid biomarkers. Freshw. Biol. 2006, 51, 2041–2051. [Google Scholar] [CrossRef]
  55. Khan, Q.; Khan, M. Effect of temperature on waterflea Daphnia magna (Crustacea: Cladocera). Nat. Preced. 2008, 1. [Google Scholar] [CrossRef]
  56. Korponai, J.; Magyari, E.K.; Buczkó, K.; Iepure, S.; Namiotko, T.; Czakó, D.; Kövér, C.; Braun, M. Cladocera response to Late Glacial to Early Holocene climate change in a South Carpathian mountain lake. Hydrobiologia 2011, 676, 223–235. [Google Scholar] [CrossRef]
  57. Ekvall, M.K.; Urrutia-Cordero, P.; Hansson, L.A. Linking cascading effects of fish predation and zooplankton grazing to reduced cyanobacterial biomass and toxin levels following biomanipulation. PLoS ONE 2014, 9, e112956. [Google Scholar] [CrossRef] [PubMed] [Green Version]
  58. Berta, C.; Tóthmérész, B.; Wojewódka, M.; Augustyniuk, O.; Korponai, J.; Bertalan-Balázs, B.; Nagy, A.S.; Grigorszky, I.; Gyulai, I. Community response of Cladocera to trophic stress by biomanipulation in a shallow oxbow lake. Water 2019, 11, 929. [Google Scholar] [CrossRef] [Green Version]
  59. Duggan, I.C.; Green, J.D.; Shiel, R.J. Distribution of rotifer assemblages in North Island, New Zealand, lakes: Relationships to environmental and historical factors. Freshw. Biol. 2002, 47, 195–206. [Google Scholar] [CrossRef]
  60. Jeppesen, E.; Peder Jensen, J.; SØndergaard, M.; Lauridsen, T.; Landkildehus, F. Trophic structure, species richness and biodiversity in Danish lakes: Changes along a phosphorus gradient. Freshw. Biol. 2000, 45, 201–218. [Google Scholar] [CrossRef]
  61. Tessier, A.J.; Horwitz, R.J. Influence of water chemistry on size structure of zooplankton assemblages. Can. J. Aquat. Sci. 1990, 47, 1937–1943. [Google Scholar] [CrossRef]
  62. Stemberger, R.S.; Lazorchak, J.M. Zooplankton assemblage responses to disturbance gradients. Can. J. Aquat. Sci. 1994, 51, 2435–2447. [Google Scholar] [CrossRef]
  63. Beaver, J.R.; Tausz, C.E.; Renicker, T.R.; Holdren, G.C.; Hosler, D.M.; Manis, E.E.; Scotese, K.C.; Teacher, C.E.; Vitanye, B.T.; Davidson, R.M. The late summer crustacean zooplankton in western U.S.A reservoirs reflects ecoregion, temperature and latitude. Freshw. Biol. 2014, 59, 1173–1186. [Google Scholar] [CrossRef]
  64. Du, X.; García-Berthou, E.; Wang, Q.; Liu, J.; Zhang, T.; Li, Z. Analyzing the importance of top-down and bottom-up controls in food webs of Chinese lakes through structural equation modeling. Aquat. Ecol. 2015, 49, 199–210. [Google Scholar] [CrossRef]
  65. Mäemets, A. Izmenenija zooplanktona. In Antropogennoe Vozdeistvije na Malye Ozera [Changes of Zooplankton.–Anthropogenic Impact to Small Lakes]; Nauka: Leningrad, Russia, 1980; pp. 54–64. [Google Scholar]
  66. Barbour, M.T.; Stribling, J.B.; Karr, J.R. Multimetric approach for establishing biocriteria. Biological assessment and criteria. In Tools for Water Resource Planning and Decision Making; CRC Press: Boca Raton, FL, USA, 1995; pp. 63–77. [Google Scholar]
  67. Hering, D.; Feld, C.K.; Moog, O.; Ofenböck, T. Cook book for the development of a Multimetric Index for biological condition of aquatic ecosystems: Experiences from the European AQEM and STAR projects and related initiatives. In The Ecological Status of European Rivers: Evaluation and Intercalibration of Assessment Methods; Springer: Dordrecht, Switzerland, 2006; pp. 311–324. [Google Scholar] [CrossRef]
  68. Chen, K.; Hughes, R.M.; Brito, J.G.; Leal, C.G.; Leitao, R.P.; de Oliveira-Junior, J.M.B.; de Oliveira, V.C.; Dias-Silva, K.; Ferraz, S.F.B.; Ferreira, J.; et al. A multi-assemblage, multi-metric biological condition index for eastern Amazonia streams. Ecol. Indic. 2017, 78, 48–61. [Google Scholar] [CrossRef]
  69. Kairesalo, T.; Tátrai, I.; Luokkanen, E. Impacts of waterweed (Elodea canadensis Michx) on fish-plankton interactions in the lake littoral. Int. Ver. Für Theor. Und Angew. Limnol. Verhandlungen 1998, 26, 1846–1851. [Google Scholar] [CrossRef]
  70. Mack, H.R.; Conroy, J.D.; Blocksom, K.A.; Stein, R.A.; Ludsin, S.A. A comparative analysis of zooplankton field collection and sample enumeration methods. Limnol. Oceanogr. Methods 2012, 10, 41–53. [Google Scholar] [CrossRef]
  71. Hillbricht-Ilkowska, A. Morphological variation of Keratella cochlearis (Gosse)(Rotatoria) in several Masurian lakes of different trophic level. Pol. Arch. Hydrobiol. 1972, 19, 253–264. [Google Scholar]
  72. Pejler, B.I.R.G.E.R. Taxonomic notes on some planktic Rotifers. Zool. Bidr. Från Upps. 1962, 35, 307–319. [Google Scholar]
  73. Andronikova, I.N. Zooplankton characteristics in monitoring of Lake Ladoga. Hydrobiologia 1996, 322, 173–179. [Google Scholar] [CrossRef]
  74. Caroni, R.; Irvine, K. The potential of zooplankton communities for ecological assessment of lakes: Redundant concept or political oversight? In Biology and Environment: Proceedings of the Royal Irish Academy; Royal Irish Academy: Dublin, Ireland, 2010; Volume 110, pp. 35–53. Available online: https://www.muse.jhu.edu/article/809710 (accessed on 9 July 2023).
  75. Haberman, J.; Haldna, M. Indices of zooplankton community as valuable tools in assessing the trophic state and water quality of eutrophic lakes: Long term study of Lake Vőrtsjärv. J. Limnol. 2014, 73, 263–273. [Google Scholar] [CrossRef] [Green Version]
  76. Oh, H.J.; Seo, D.H.; Choi, M.; Jeong, H.G.; Kim, H.W.; Oh, J.M.; Chang, K.H. Calculation and applicability of rotifers biomass (Polyarthra spp.) based on length-weight relationship and spatial distribution of body length. KJEE 2018, 51, 205–211. [Google Scholar] [CrossRef]
  77. Ku, D.; Chae, Y.J.; Choi, Y.; Ji, C.W.; Park, Y.S.; Kwak, I.S.; Kim, Y.J.; Chang, K.H.; Oh, H.J. Optimal Method for Biomass Estimation in a Cladoceran Species, Daphnia Magna (Straus, 1820): Evaluating Length–Weight Regression Equations and Deriving Estimation Equations Using Body Length, Width and Lateral Area. Sustainability 2022, 14, 9216. [Google Scholar] [CrossRef]
  78. Chen, C.T.; Bănaru, D.; Carlotti, F.; Faucheux, M.; Harmelin-Vivien, M. Seasonal variation in biochemical and energy content of size-fractionated zooplankton in the Bay of Marseille (North-Western Mediterranean Sea). J. Mar. Syst. 2019, 199, 103223. [Google Scholar] [CrossRef]
  79. Choi, K.H.; Lee, C.R.; Kang, H.K.; Kang, K.A. Characteristics and variation of size-fractionated zooplankton biomass in the Northern East China Sea. Ocean Polar Res. 2011, 33, 135–147. [Google Scholar] [CrossRef] [Green Version]
  80. Böttger-Schnack, R.; Schnack, D. On the effect of formaldehyde fixation on the dry weight of copepods. In Meeresforschung Reports on Marine Research. Berichte der Deutschen Wissenschaftlichen Kommission für Meeresforschung; Hempel: Kiel, Germany, 1986; Volume 31, pp. 141–152. Available online: https://www.vliz.be/en/imis?refid=142288 (accessed on 9 July 2023).
  81. Wiebe, P.H. Relationships between zooplankton displacement volume, wet weight, dry weight and carbon. Fish. Bull. 1975, 73, 777–786. [Google Scholar]
  82. Burns, C.W. Relation between filtering rate, temperature, and body size in four species of Daphnia. Limnol. Oceanogr. 1969, 14, 693–700. [Google Scholar] [CrossRef]
  83. Ruttner-Kolisko, A. Suggestions for biomass calculations of planktonic rotifers. Arch. Hydrobiol. Beih. 1997, 21, 71–76. [Google Scholar]
  84. SOP. LG403. Revision 07; Standard Operating Procedure for Zooplankton Analysis. Great Lakes National Program Office, U.S. Environmental Protection Agency: Chicago, IL, USA, 2016.
  85. Bottrell, H.H.; Duncan, A.; Gliwicz, Z.M.; Grygierek, E.; Herzig, A.; Hillbricht-Ilkowska, A.; Kurasawa, H.; Larsson, P.; Weglenska, T. A review of some problems in zooplankton production studies. Norw. J. Zool. 1976, 24, 419–456. [Google Scholar]
  86. Rosen, R.A. Seasonal Cycles, Distribution, and Biomass of Crustacean Zooplankton, and Feeding and Growth of Young American Shad (Alosa sapidissima) in the Holyoke Pool, Connecticut River; University of Massachusetts Amherst: Amherst, MA, USA, 1981. [Google Scholar]
  87. Pace, M.L.; Orcutt, J.D., Jr. The relative importance of protozoans, rotifers, and crustaceans in a freshwater zooplankton community 1. Limnol. Oceanogr. 1981, 26, 822–830. [Google Scholar] [CrossRef] [Green Version]
  88. Hawkins, B.E.; Evans, M.S. Seasonal cycles of zooplankton biomass in Southeastern Lake Michigan. J. Great Lakes Res. 1979, 5, 256–263. [Google Scholar] [CrossRef]
  89. Doohan, M. An energy budget for adult Brachionus plicatilis Muller (Rotatoria). Oecologia 1973, 13, 351–362. [Google Scholar] [CrossRef] [PubMed]
  90. Beaver, J.R.; Tausz, C.E.; Black, K.M.; Bolam, B.A. Cladoceran body size distributions along temperature and trophic gradients in the conterminous USA. J. Plankton Res. 2020, 42, 613–629. [Google Scholar] [CrossRef]
  91. Yebra, L.; Kobari, T.; Sastri, A.R.; Gusmão, F.; Hernández-León, S. Advances in biochemical indices of zooplankton production. Adv. Mar. Biol. 2017, 76, 157–240. [Google Scholar]
  92. Tao, Y.; Yu, J.; Liu, X.; Xue, B.; Wang, S. Factors affecting annual occurrence, bioaccumulation, and biomagnification of polycyclic aromatic hydrocarbons in plankton food webs of subtropical eutrophic lakes. Water Res. 2018, 132, 1–11. [Google Scholar] [CrossRef]
  93. Kwak, I.S.; Park, Y.S.; Chang, K.H. Application and Utilization of Environmental DNA Technology for Biodiversity in Water Ecosystems. KJEE 2021, 54, 151–155. [Google Scholar] [CrossRef]
  94. Yang, J.; Zhang, X. eDNA metabarcoding in zooplankton improves the ecological status assessment of aquatic ecosystems. Environ. Int. 2020, 134, 105230. [Google Scholar] [CrossRef] [PubMed]
  95. Kim, J.H.; Jo, H.; Chang, M.H.; Woo, S.H.; Cho, Y.; Yoon, J.D. Application of Environmental DNA for Monitoring of Freshwater Fish in Korea. KJEE 2020, 53, 63–72. [Google Scholar] [CrossRef]
  96. Logan, J.; Kirstin, E. Real-Time PCR: Current Technology and Applications; Caister Academic Press: Poole, UK, 2009; p. vii-284. [Google Scholar]
  97. Walsh, J.R.; Spear, M.J.; Shannon, T.P.; Krysan, P.J.; Vander Zanden, M.J. Using eDNA, sediment subfossils, and zooplankton nets to detect invasive spiny water flea (Bythotrephes longimanus). Biol. Invasions 2019, 21, 377–389. [Google Scholar] [CrossRef]
  98. Zhao, L.; Zhang, X.; Xu, M.; Mao, Y.; Huang, Y. DNA metabarcoding of zooplankton communities: Species diversity and seasonal variation revealed by 18S rRNA and COI. PeerJ 2021, 9, e11057. [Google Scholar] [CrossRef] [PubMed]
  99. Lopez, M.L.D.; Lin, Y.Y.; Sato, M.; Hsieh, C.H.; Shiah, F.K.; Machida, R.J. Using metatranscriptomics to estimate the diversity and composition of zooplankton communities. Mol. Ecol. Resour. 2022, 22, 638–652. [Google Scholar] [CrossRef]
  100. Monchamp, M.È.; Walsh, D.A.; Garner, R.E.; Kraemer, S.A.; Beisner, B.E.; Cristescu, M.E.; Gregory-Eaves, I. Comparative analysis of zooplankton diversity in freshwaters: What can we gain from metagenomic analysis? Environ. DNA 2022, 4, 1250–1264. [Google Scholar] [CrossRef]
  101. Hinlo, R.; Furlan, E.; Suitor, L.; Gleeson, D. Environmental DNA monitoring and management of invasive fish: Comparison of eDNA and fyke netting. Manag. Biol. Invasions 2017, 8, 89. [Google Scholar] [CrossRef] [Green Version]
  102. Wang, S.; Yan, Z.; Hänfling, B.; Zheng, X.; Wang, P.; Fan, J.; Li, J. Methodology of fish eDNA and its applications in ecology and environment. Sci. Total Environ. 2021, 755, 142622. [Google Scholar] [CrossRef]
  103. Xiong, W.; Huang, X.; Chen, Y.; Fu, R.; Du, X.; Chen, X.; Zhan, A. Zooplankton biodiversity monitoring in polluted freshwater ecosystems: A technical review. Environ. Sci. Ecotechnol. 2020, 1, 100008. [Google Scholar] [CrossRef]
  104. Oh, H.J.; Chae, Y.J.; Choi, Y.; Ku, D.; Heo, Y.J.; Kwak, I.S.; Jo, H.; Park, Y.S.; Chang, K.H.; Kim, H.W. Review and suggestions for applying DNA sequencing to zooplankton researches: From taxonomic approaches to biological interaction analysis. KJEE 2021, 54, 156–169. [Google Scholar] [CrossRef]
  105. Cordier, T.; Lanzén, A.; Apothéloz-Perret-Gentil, L.; Stoeck, T.; Pawlowski, J. Embracing Environmental Genomics and Machine Learning for Routine Biomonitoring. Trends Microbiol. 2019, 27, 387–397. [Google Scholar] [CrossRef] [PubMed]
  106. Qiu, X.; Lu, Q.; Jia, C.; Dai, Y.; Ouyang, S.; Wu, X. The Effects of Water Level Fluctuation on Zooplankton Communities in Shahu Lake Based on DNA Metabarcoding and Morphological Methods. Animals 2022, 12, 950. [Google Scholar] [CrossRef] [PubMed]
  107. Ji, C.W.; Oh, H.J.; Chang, K.H.; Park, Y.S.; Kwak, I.S. A Comparative Analyzing of Zooplankton Community Diversity in Surface Layer Water of Reservoir Via eDNA Metabarcoding and Microscopy. Divers 2022, 14, 797. [Google Scholar] [CrossRef]
  108. Harvey, J.B.; Johnson, S.B.; Fisher, J.L.; Peterson, W.T.; Vrijenhoek, R.C. Comparison of morphological and next generation DNA sequencing methods for assessing zooplankton assemblages. J. Exp. Mar. Biol. Ecol. 2017, 487, 113–126. [Google Scholar] [CrossRef]
Figure 1. Factors evaluating ecosystem health. Descriptions next to the ellipses are the ecosystem components that can be measured for each factor.
Sustainability 15 10950 g001
Disclaimer/Publisher’s Note: The statements, opinions and data contained in all publications are solely those of the individual author(s) and contributor(s) and not of MDPI and/or the editor(s). MDPI and/or the editor(s) disclaim responsibility for any injury to people or property resulting from any ideas, methods, instructions or products referred to in the content.

