


DSRA-DETR: An Improved DETR for Multiscale Traffic Sign Detection


Abstract
1. Introduction
2. Related Work
2.1. The R-CNN Series
2.2. The YOLO and SSD Series
2.3. The Image Registration Series
2.4. The DETR Series
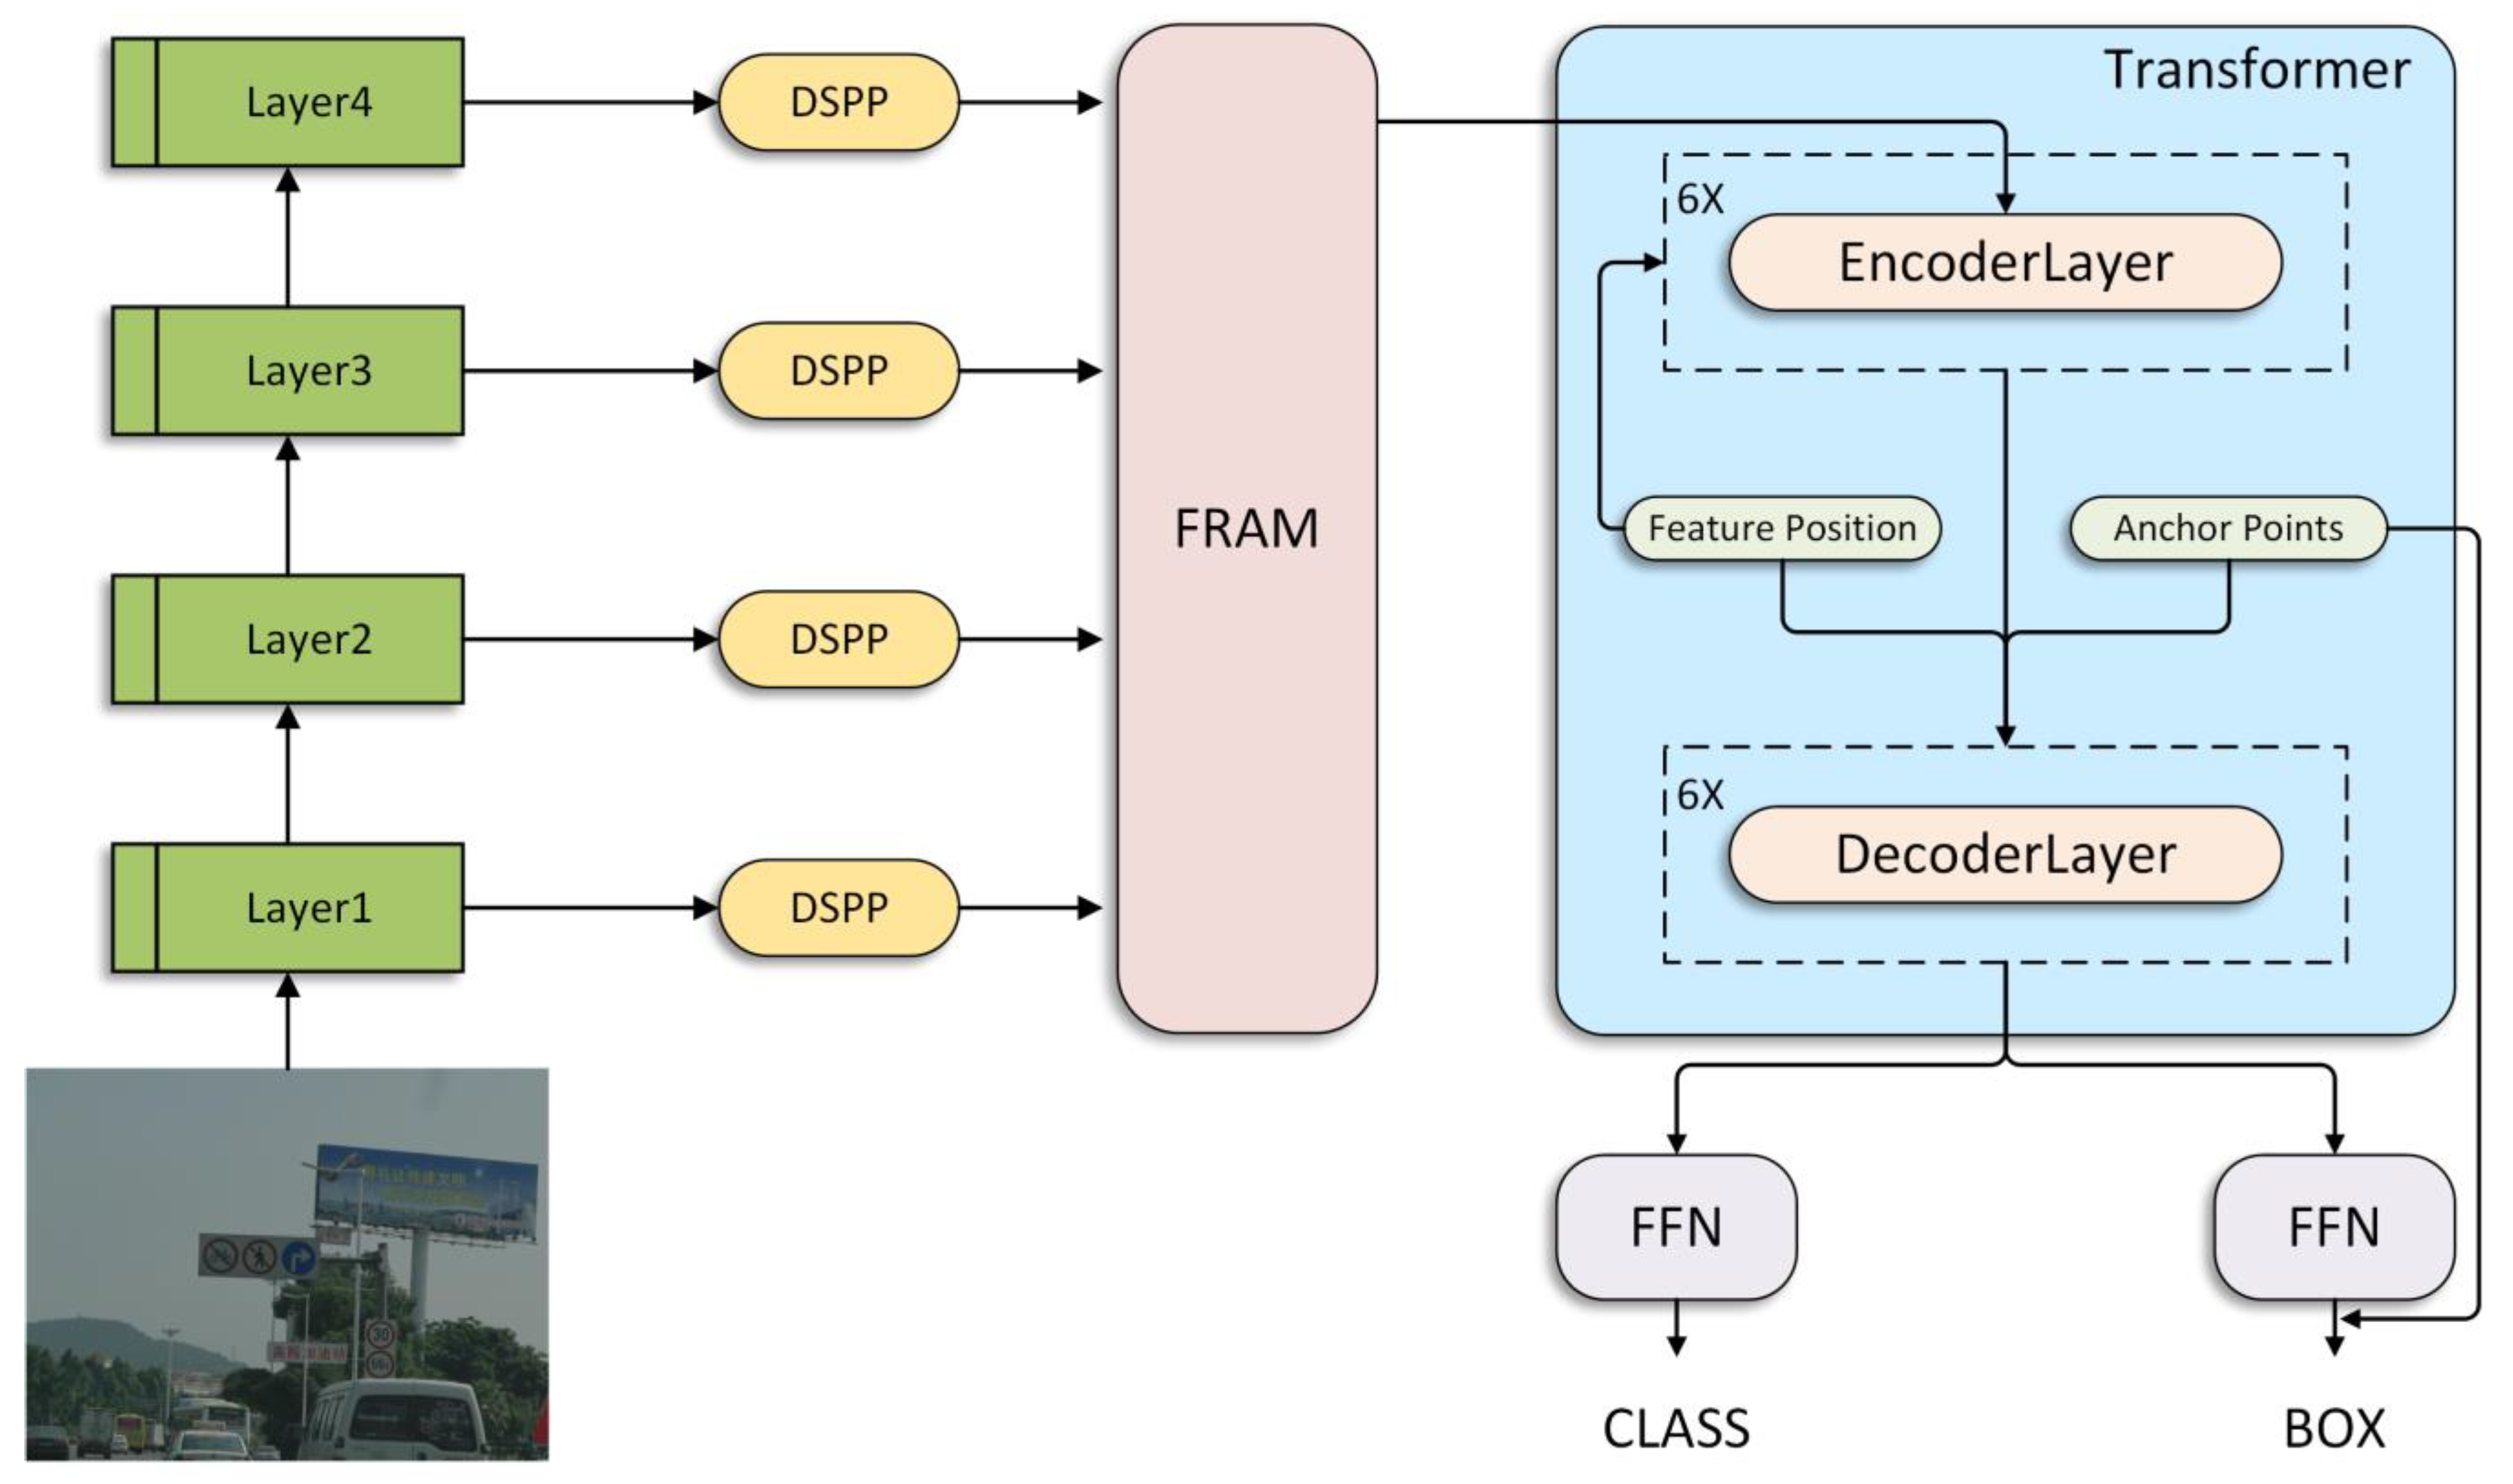
3. Method
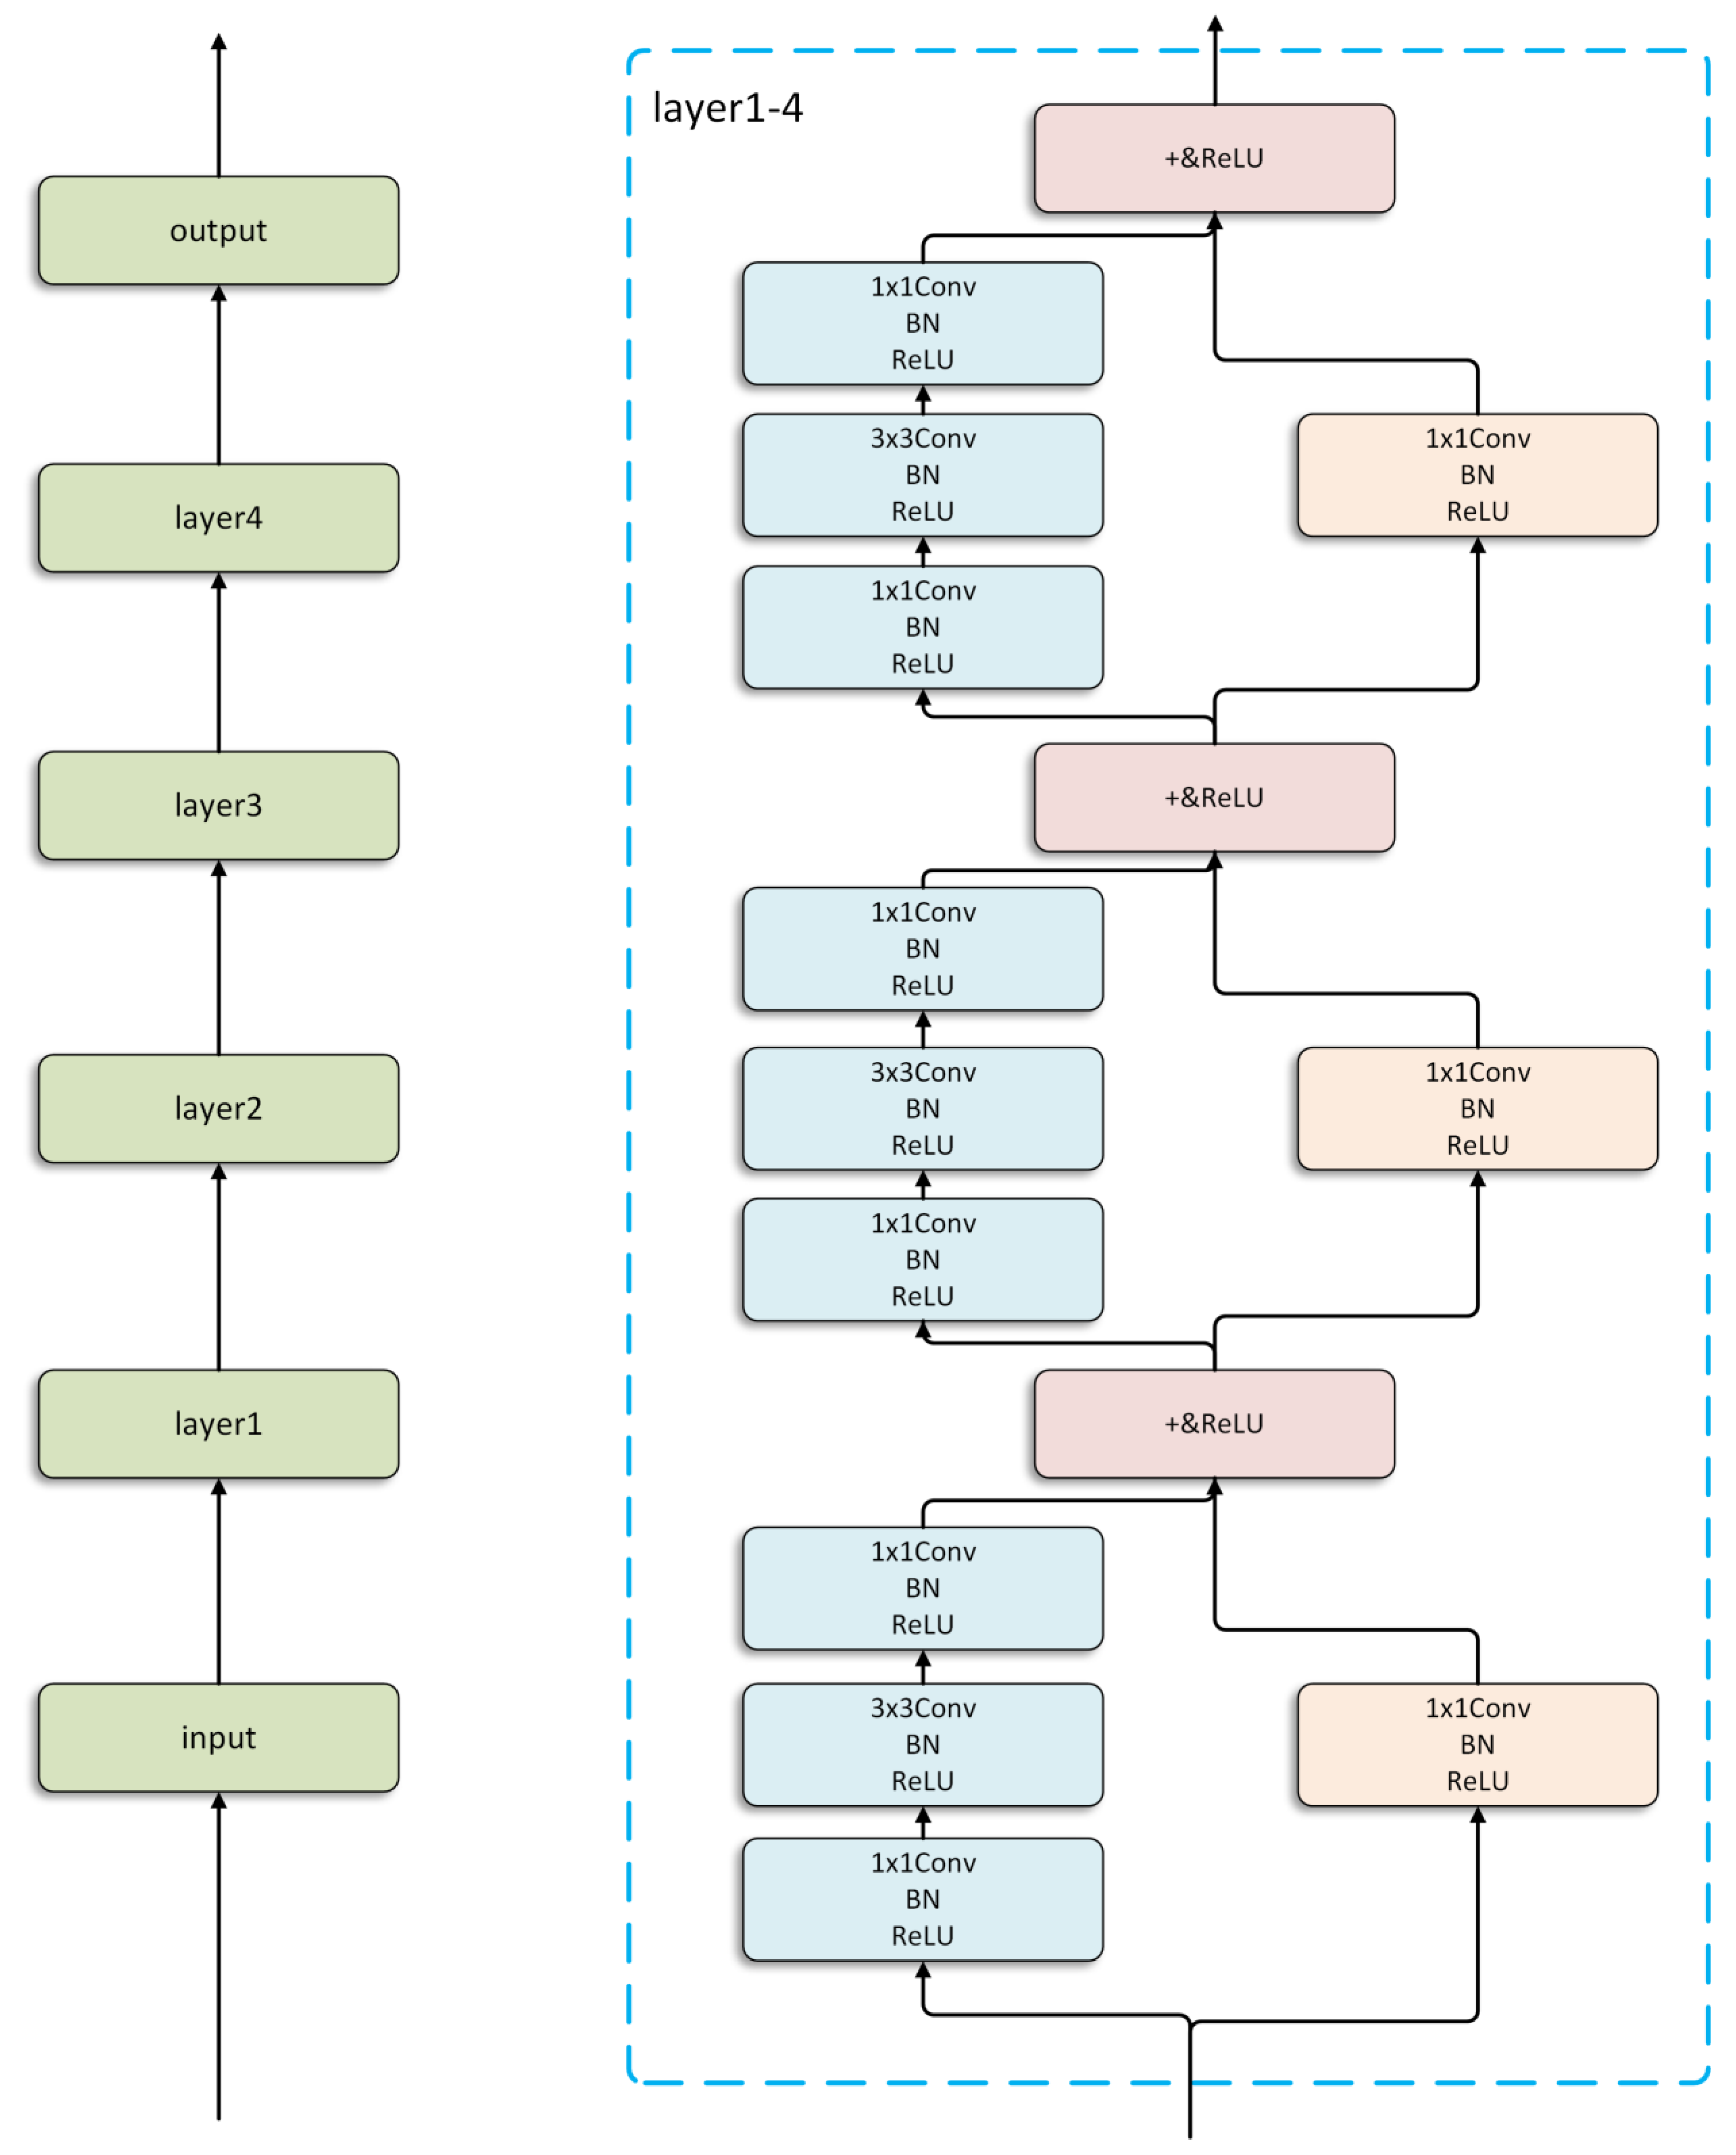
3.1. Backbone
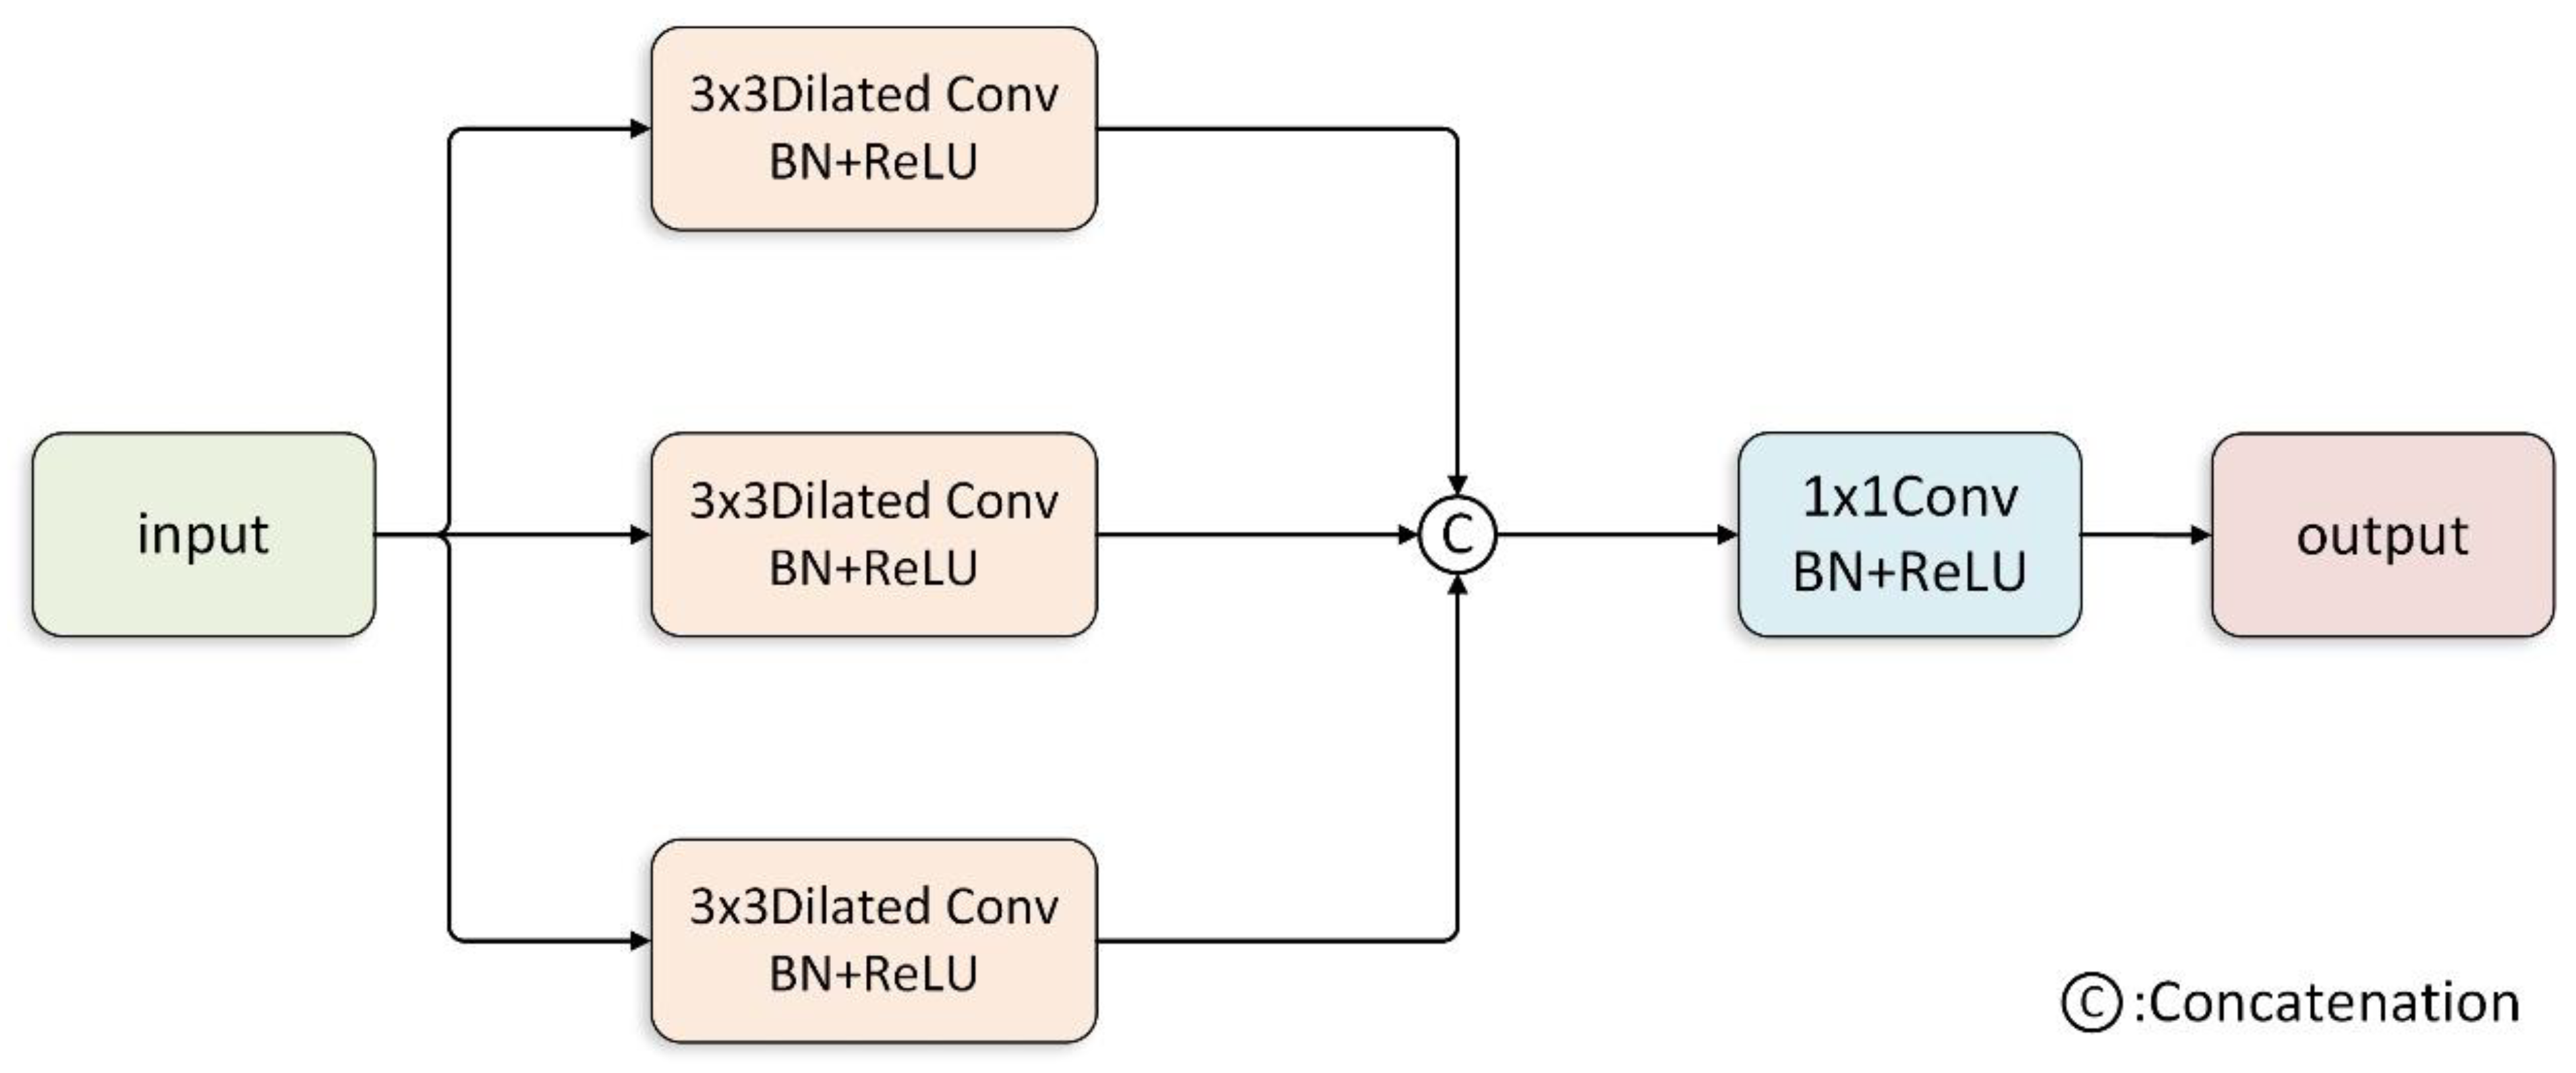
3.2. Dilated Spatial Pyramid Pooling Model
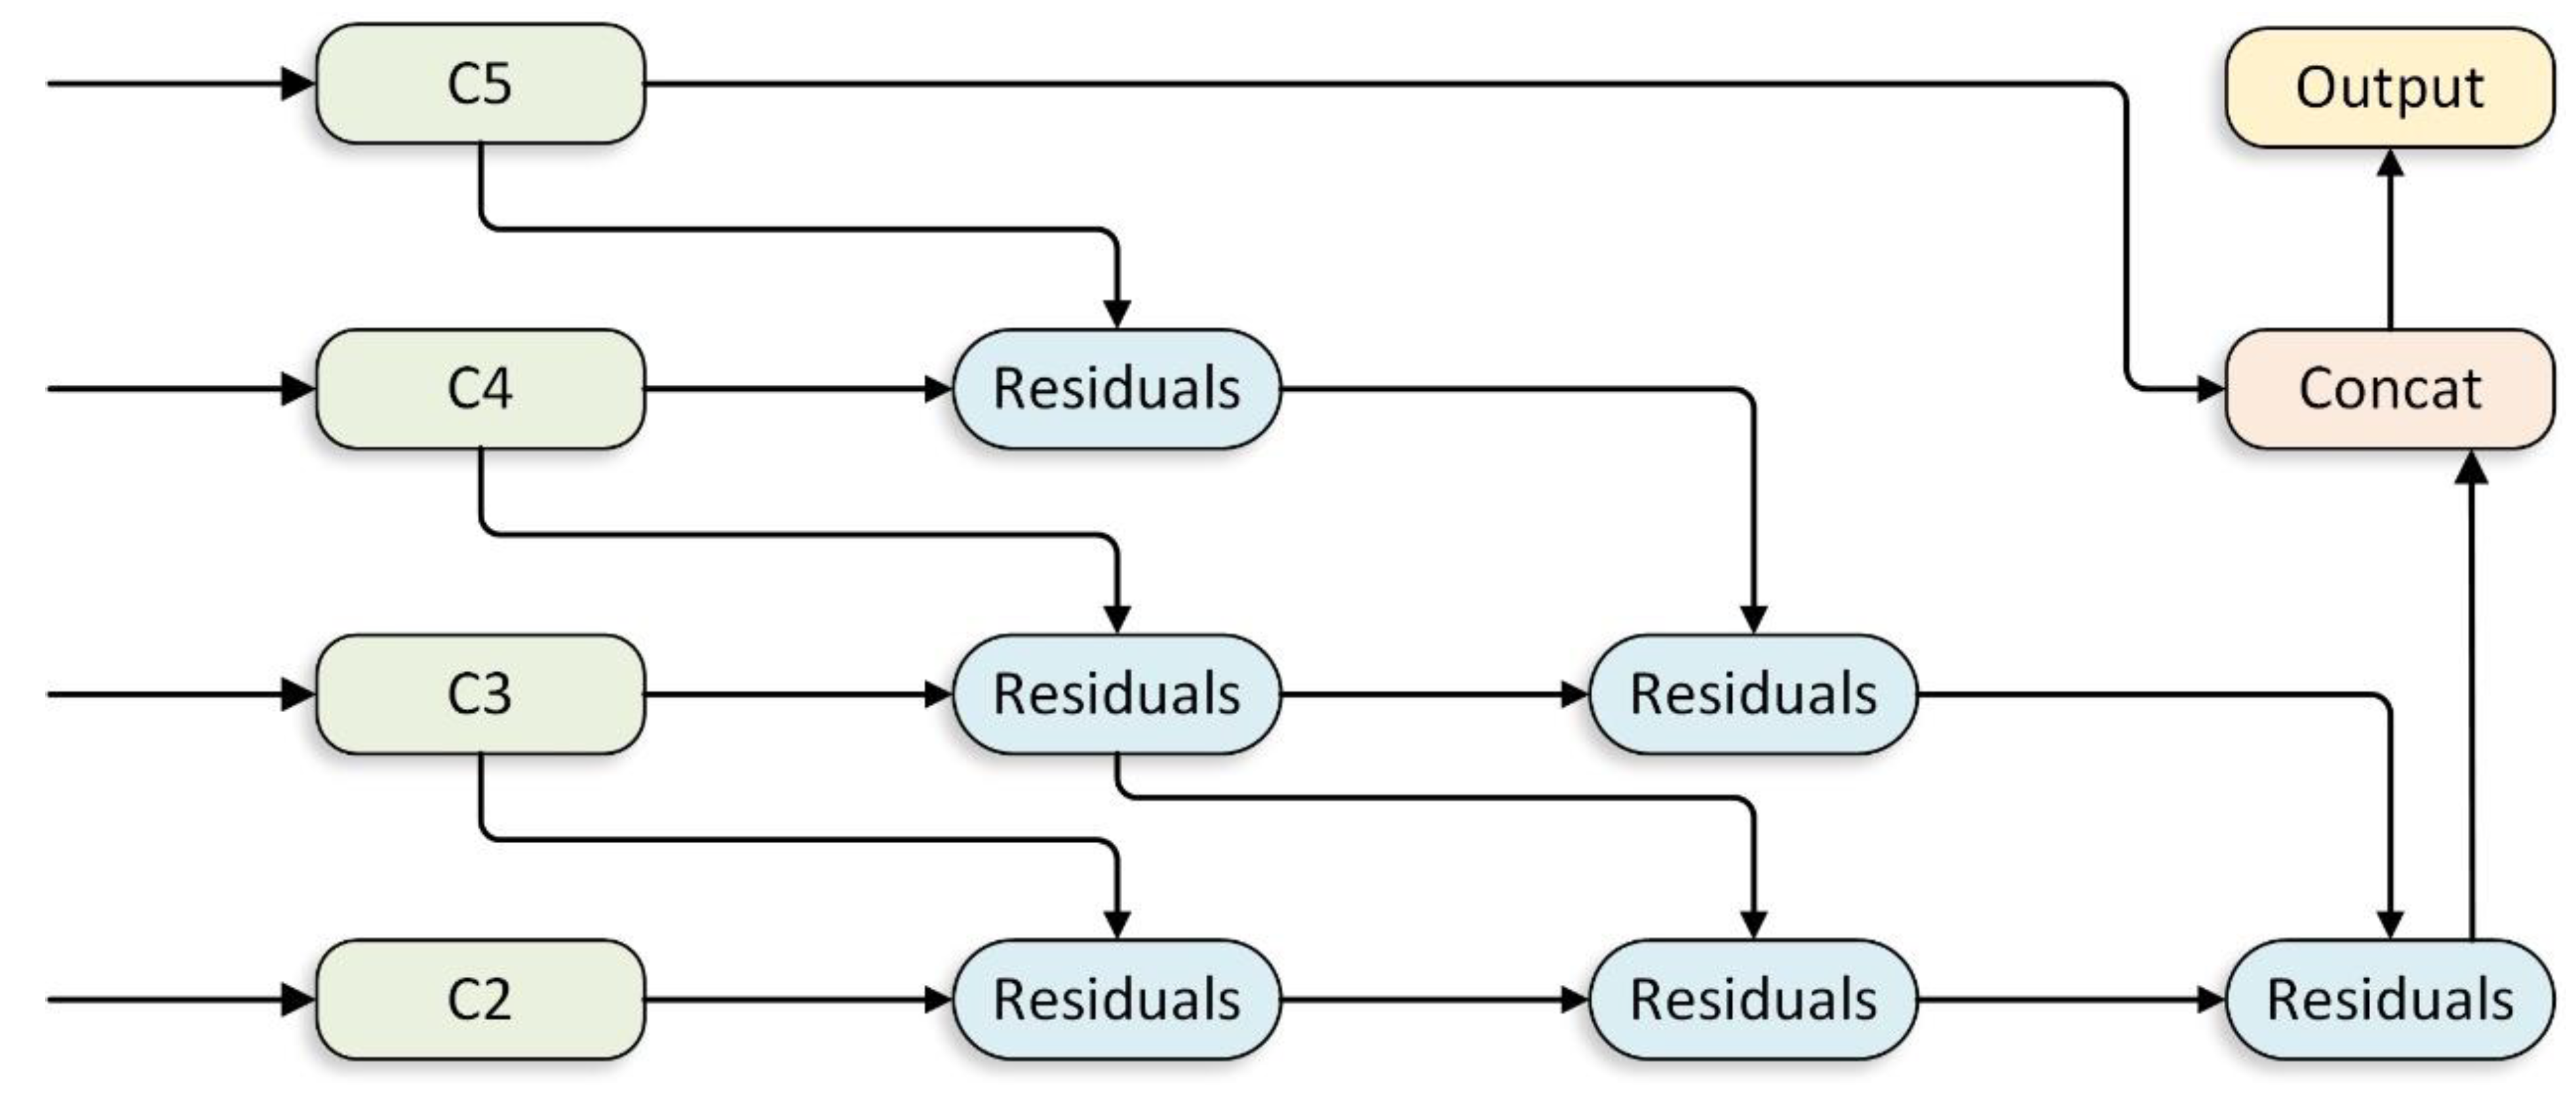
3.3. Feature Residual Aggregation Module
3.4. Losses
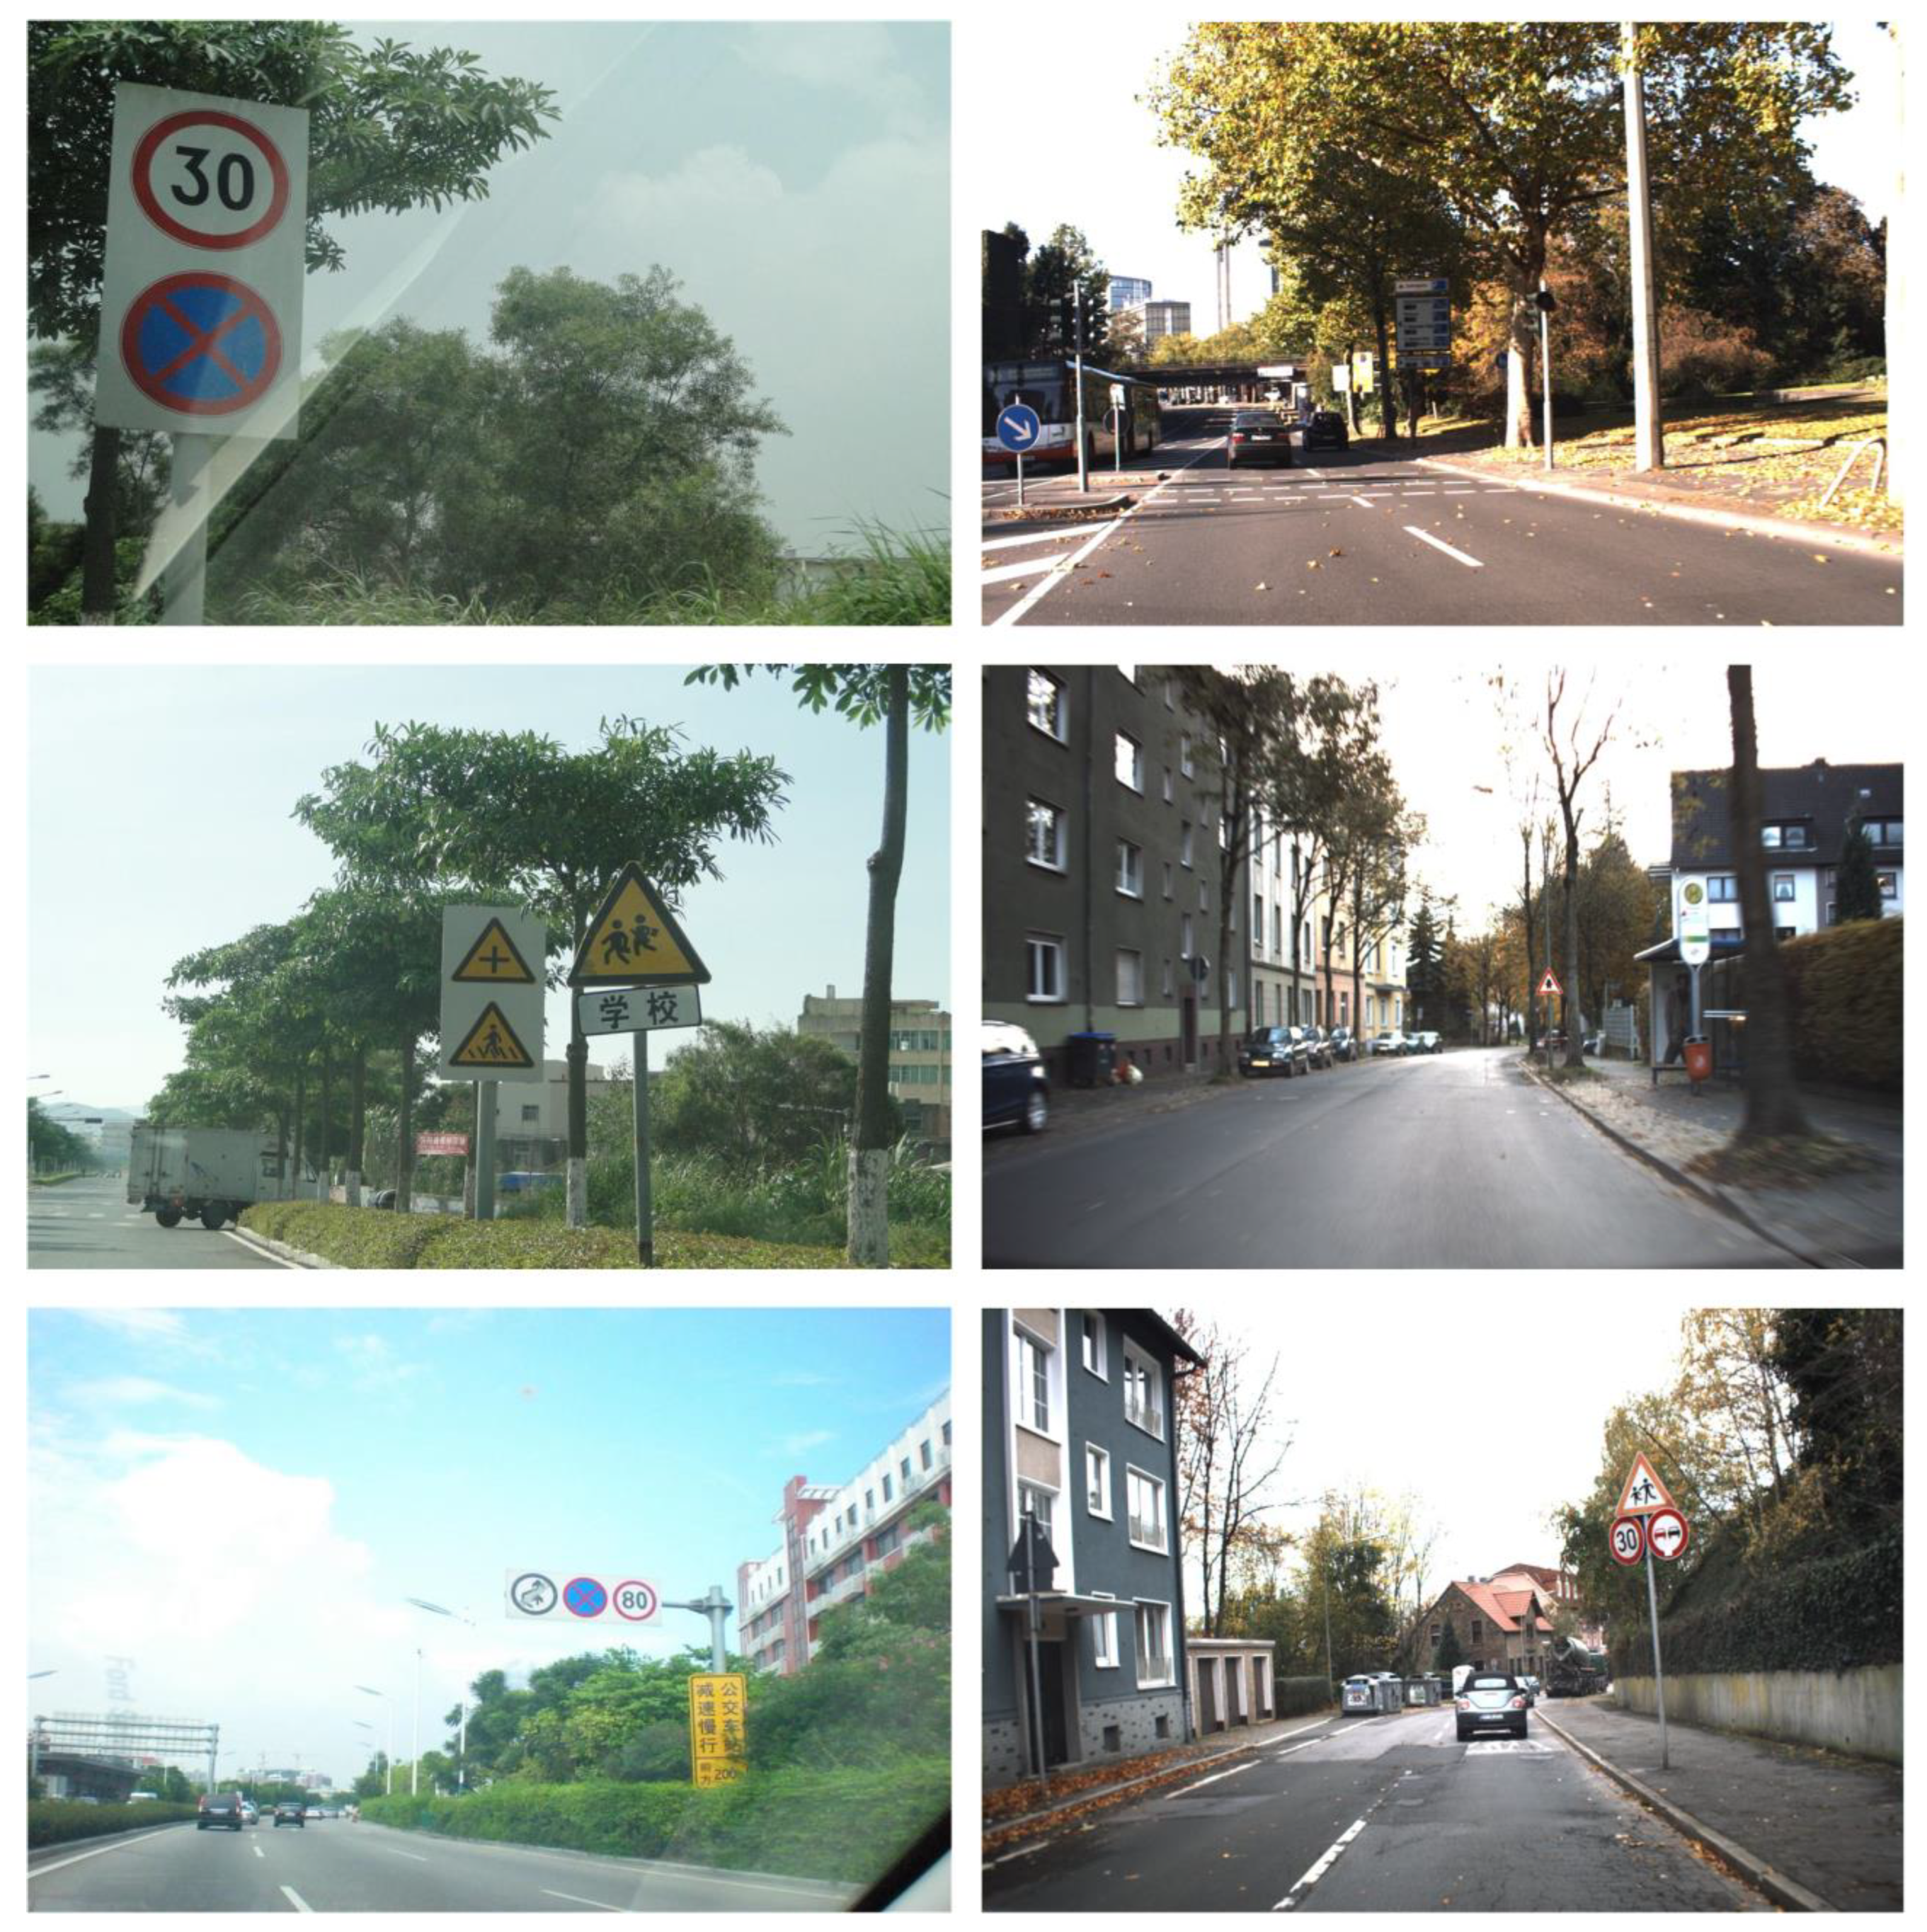
4. Dataset
4.1. Datasets
4.2. Evaluation Criteria
5. Experiments
5.1. Experimental Details
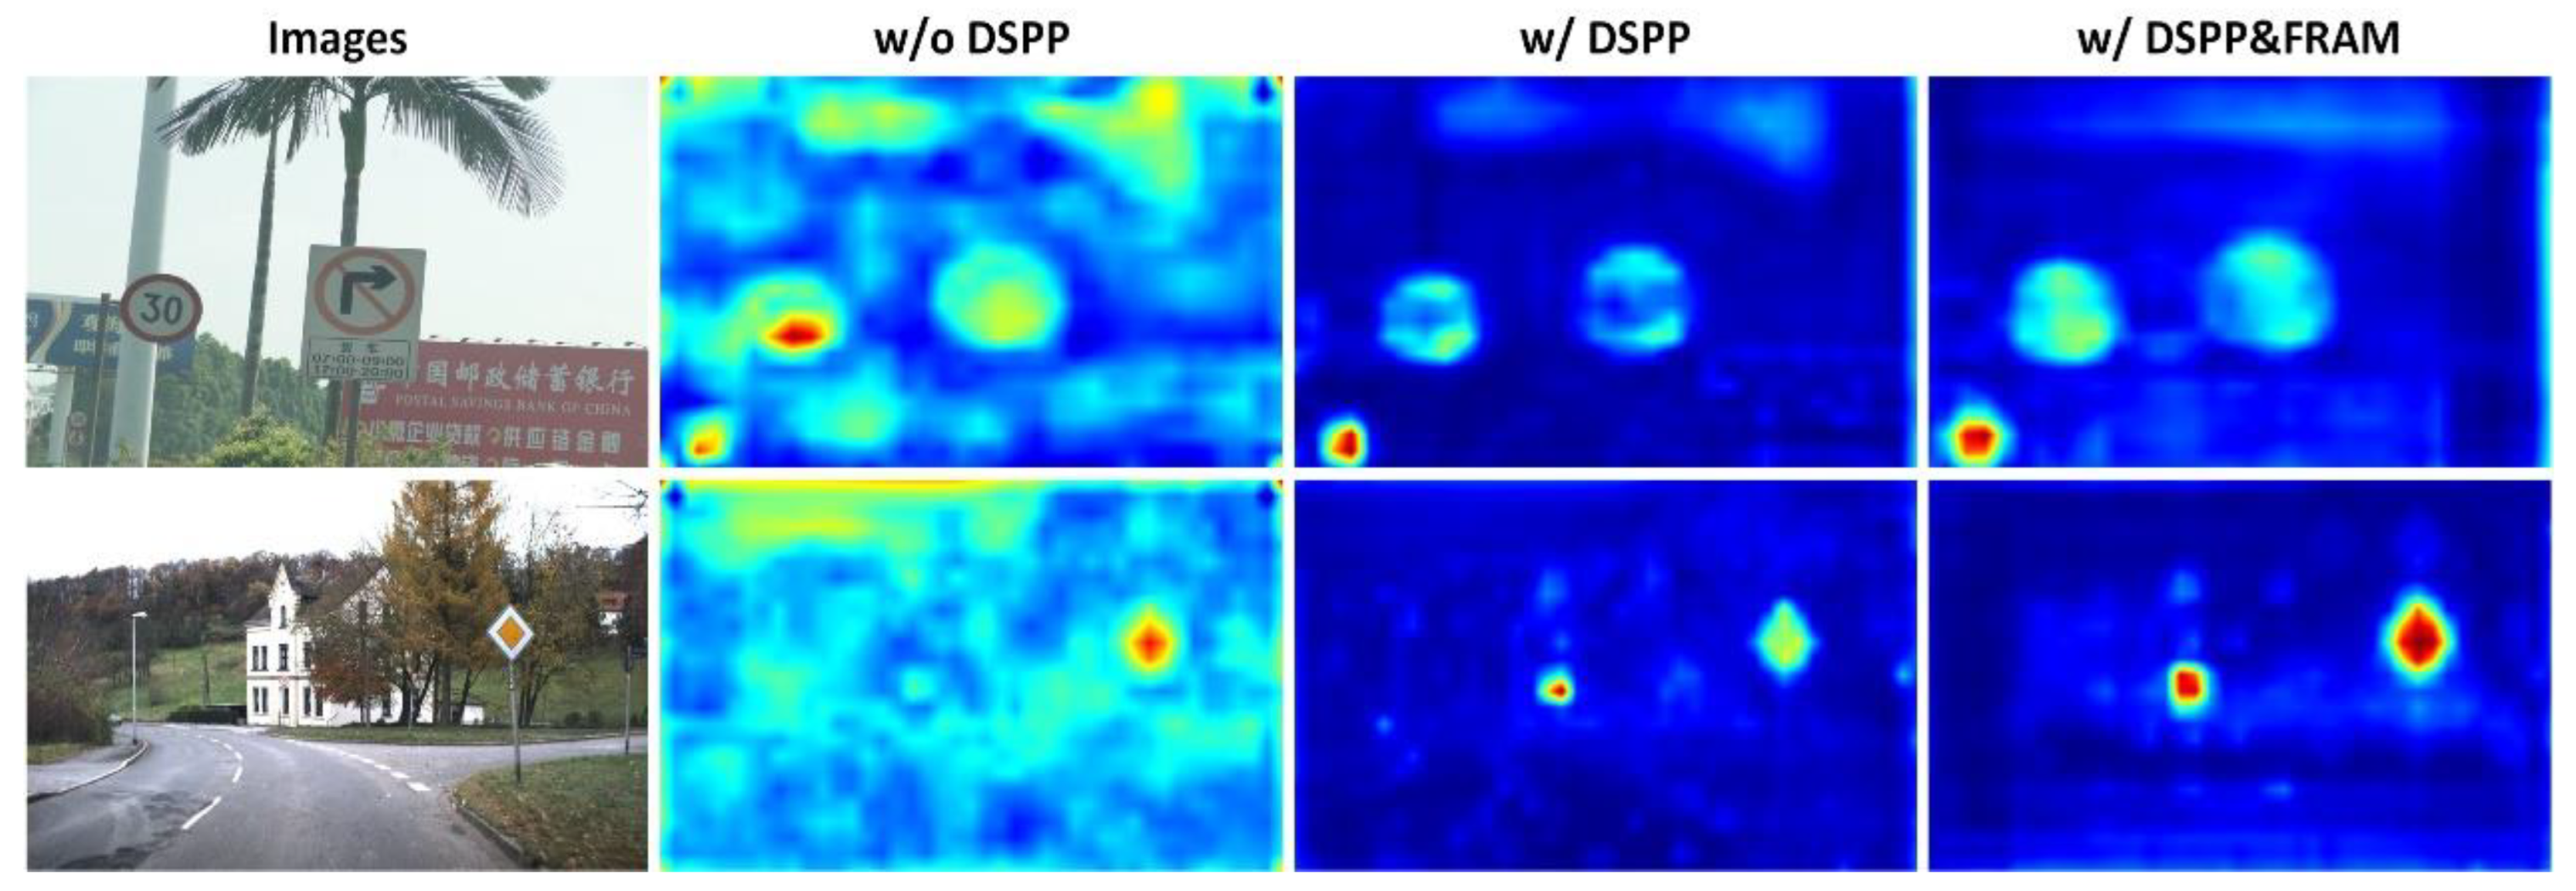
5.2. Ablation Study
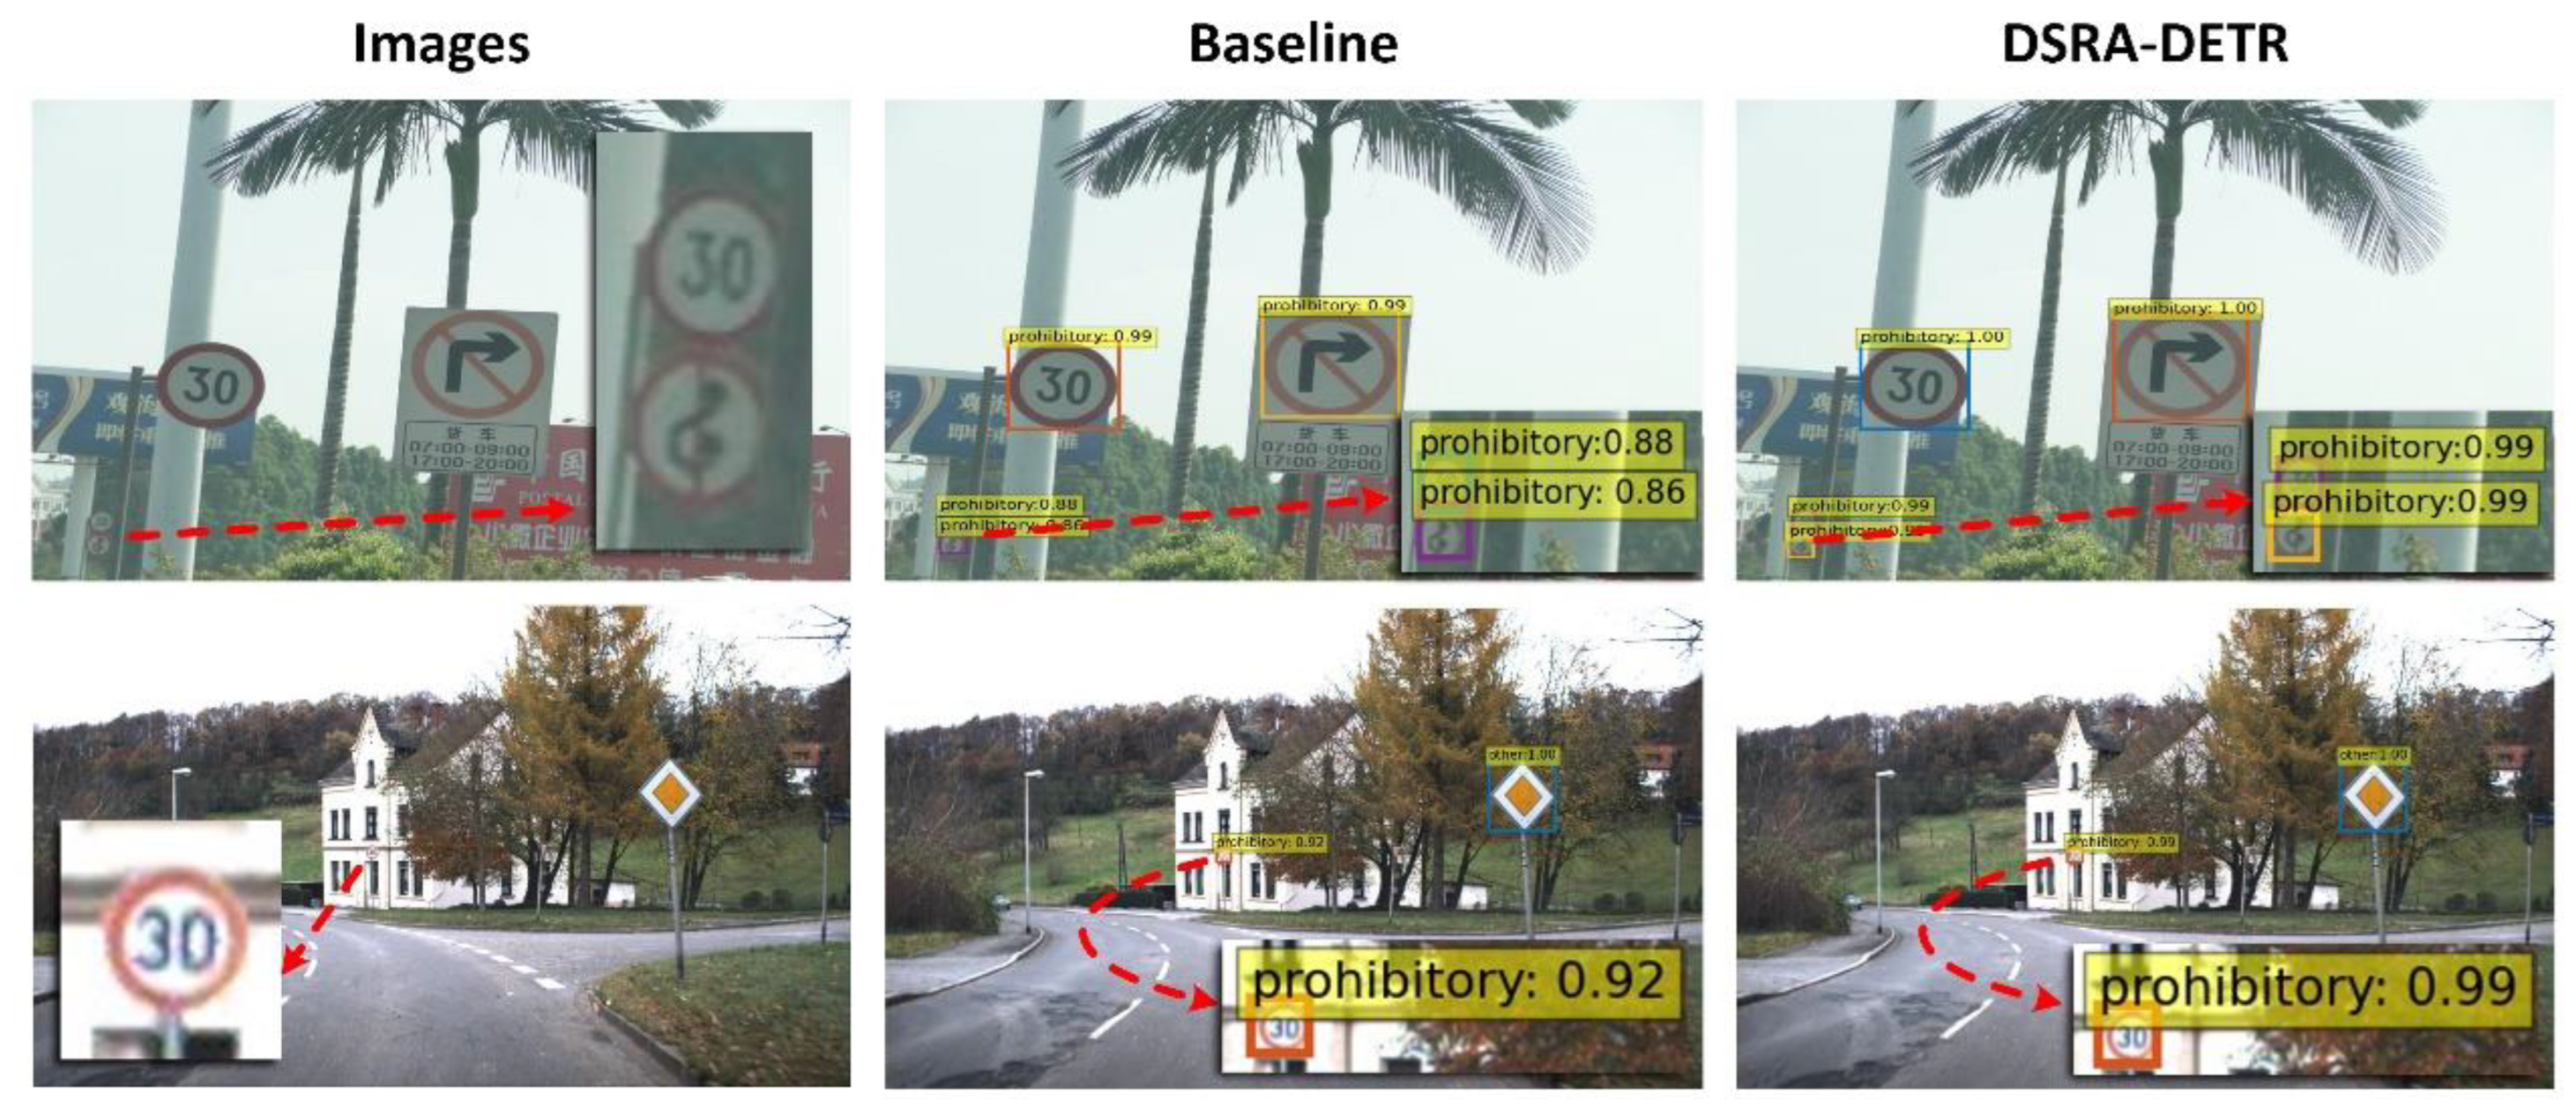
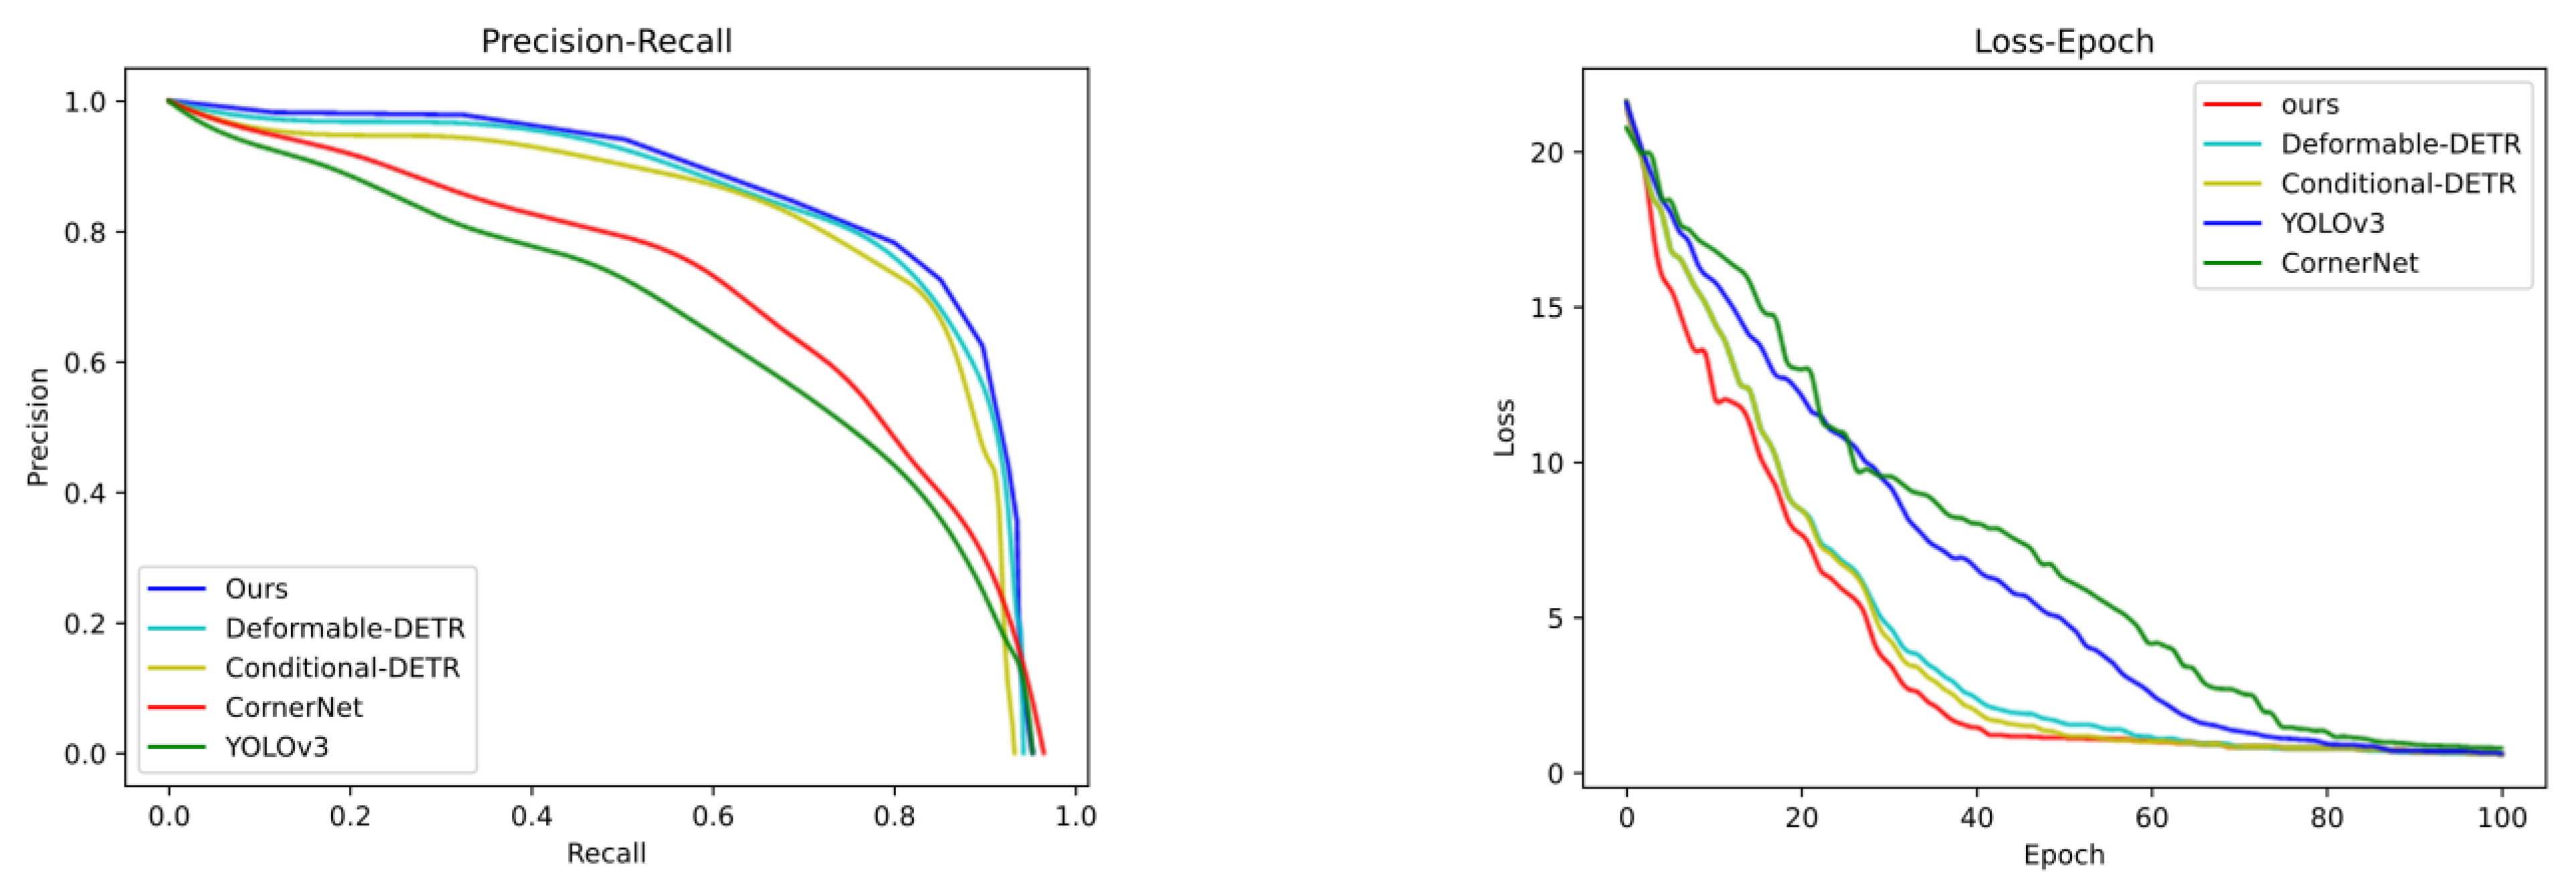
5.3. Comparison with Previous Methods
6. Conclusions and Discussion
Author Contributions
Funding
Institutional Review Board Statement
Informed Consent Statement
Data Availability Statement
Conflicts of Interest
References
- Anjum, M.; Shahab, S.J.S. Emergency Vehicle Driving Assistance System Using Recurrent Neural Network with Navigational Data Processing Method. Sustainability 2023, 15, 3069. [Google Scholar] [CrossRef]
- Girshick, R.; Donahue, J.; Darrell, T.; Malik, J. Rich feature hierarchies for accurate object detection and semantic segmentation. In Proceedings of the IEEE Conference on Computer Vision and Pattern Recognition, Columbus, OH, USA, 23–28 June 2014; pp. 580–587. [Google Scholar] [CrossRef]
- Redmon, J.; Divvala, S.; Girshick, R.; Farhadi, A. You only look once: Unified, real-time object detection. In Proceedings of the IEEE Conference on Computer Vision and Pattern Recognition, Las Vegas, NV, USA, 27–30 June 2016; pp. 779–788. [Google Scholar] [CrossRef]
- Liu, W.; Anguelov, D.; Erhan, D.; Szegedy, C.; Reed, S.; Fu, C.-Y.; Berg, A.C. Ssd: Single shot multibox detector. In Proceedings of the Computer Vision–ECCV 2016: 14th European Conference, Amsterdam, The Netherlands, 11–14 October 2016; pp. 21–37. [Google Scholar] [CrossRef]
- Dosovitskiy, A.; Beyer, L.; Kolesnikov, A.; Weissenborn, D.; Zhai, X.; Unterthiner, T.; Dehghani, M.; Minderer, M.; Heigold, G.; Gelly, S.J.A.P.A. An image is worth 16×16 words: Transformers for image recognition at scale. arXiv 2020, arXiv:2010.11929. [Google Scholar] [CrossRef]
- Meng, D.; Chen, X.; Fan, Z.; Zeng, G.; Li, H.; Yuan, Y.; Sun, L.; Wang, J. Conditional detr for fast training convergence. In Proceedings of the IEEE/CVF International Conference on Computer Vision, Montreal, QC, Canada, 10–17 October 2021; pp. 3651–3660. [Google Scholar] [CrossRef]
- Wang, Y.; Zhang, X.; Yang, T.; Sun, J. Anchor detr: Query design for transformer-based detector. Proc. AAAI Conf. Artif. Intell. 2022, 36, 2567–2575. [Google Scholar] [CrossRef]
- Houben, S.; Stallkamp, J.; Salmen, J.; Schlipsing, M.; Igel, C. Detection of traffic signs in real-world images: The German Traffic Sign Detection Benchmark. In Proceedings of the 2013 International Joint Conference on Neural Networks (IJCNN), Dallas, TX, USA, 4–9 August 2013; pp. 1–8. [Google Scholar] [CrossRef]
- Zhang, J.; Zou, X.; Kuang, L.-D.; Wang, J.; Sherratt, R.S.; Yu, X.J.H.-c.C.; Sciences, I. CCTSDB 2021: A more comprehensive traffic sign detection benchmark. Hum.-Centric Comput. 2022, 12, 23. [Google Scholar] [CrossRef]
- Redmon, J.; Farhadi, A. Yolov3: An Incremental Improvement. arXiv 2018, arXiv:1804.02767. [Google Scholar] [CrossRef]
- He, K.; Zhang, X.; Ren, S.; Sun, J. Spatial Pyramid Pooling in Deep Convolutional Networks for Visual Recognition. IEEE Trans. Pattern Anal. Mach. Intell. 2015, 37, 1904–1916. [Google Scholar] [CrossRef]
- Girshick, R. Fast R-CNN. In Proceedings of the IEEE International Conference on Computer Vision, Santiago, Chile, 7–13 December 2015; pp. 1440–1448. [Google Scholar] [CrossRef]
- Ren, S.; He, K.; Girshick, R.; Sun, J. Faster R-CNN: Towards real-time object detection with region proposal networks. Adv. Neural Inf. Proc. Syst. 2015, 28, 1137–1149. [Google Scholar] [CrossRef] [PubMed]
- He, K.; Zhang, X.; Ren, S.; Sun, J. Deep residual learning for image recognition. In Proceedings of the IEEE Conference on Computer Vision and Pattern Recognition, Las Vegas, NV, USA, 27–30 June 2016; pp. 770–778. [Google Scholar] [CrossRef]
- He, K.; Gkioxari, G.; Dollár, P.; Girshick, R. Mask R-CNN. In Proceedings of the IEEE International Conference on Computer Vision, Venice, Italy, 22–29 October 2017; pp. 2961–2969. [Google Scholar] [CrossRef]
- Tabernik, D.; Skočaj, D. Deep learning for large-scale traffic-sign detection and recognition. IEEE Trans. Intell. Transp. Syst. 2019, 21, 1427–1440. [Google Scholar] [CrossRef]
- Wang, F.; Li, Y.; Wei, Y.; Dong, H. Improved faster rcnn for traffic sign detection. In Proceedings of the 2020 IEEE 23rd International Conference on Intelligent Transportation Systems (ITSC), Rhodes, Greece, 20–23 September 2020; pp. 1–6. [Google Scholar] [CrossRef]
- Redmon, J.; Farhadi, A. YOLO9000: Better, faster, stronger. In Proceedings of the IEEE Conference on Computer Vision and Pattern Recognition, Honolulu, HI, USA, 21–26 July 2017; pp. 7263–7271. [Google Scholar] [CrossRef]
- Bochkovskiy, A.; Wang, C.-Y.; Liao, H. Yolov4: Optimal speed and accuracy of object detection. arXiv 2020, arXiv:2004.10934. [Google Scholar] [CrossRef]
- Chen, Q.; Wang, Y.; Yang, T.; Zhang, X.; Cheng, J.; Sun, J. You only look one-level feature. In Proceedings of the IEEE/CVF Conference on Computer Vision and Pattern Recognition, Nashville, TN, USA, 20–25 June 2021; pp. 13039–13048. [Google Scholar] [CrossRef]
- Fu, C.-Y.; Liu, W.; Ranga, A.; Tyagi, A.; Berg, A.C. Dssd: Deconvolutional single shot detector. arXiv 2017, arXiv:1701.06659. [Google Scholar] [CrossRef]
- Li, Z.; Zhou, F. FSSD: Feature fusion single shot multibox detector. arXiv 2017, arXiv:1712.00960. [Google Scholar] [CrossRef]
- Zhang, S.; Wen, L.; Bian, X.; Lei, Z.; Li, S.Z. Single-shot refinement neural network for object detection. In Proceedings of the IEEE Conference on Computer Vision and Pattern Recognition, Salt Lake City, UT, USA, 18–23 June 2018; pp. 4203–4212. [Google Scholar] [CrossRef]
- Lin, T.-Y.; Goyal, P.; Girshick, R.; He, K.; Dollár, P. Focal loss for dense object detection. In Proceedings of the IEEE International Conference on Computer Vision, Venice, Italy, 22–29 October 2017; pp. 2980–2988. [Google Scholar] [CrossRef]
- Law, H.; Deng, J. Cornernet: Detecting objects as paired keypoints. In Proceedings of the European Conference on Computer Vision (ECCV), Munich, Germany, 8–14 September 2018; pp. 734–750. [Google Scholar] [CrossRef]
- Duan, K.; Bai, S.; Xie, L.; Qi, H.; Huang, Q.; Tian, Q. Centernet: Keypoint triplets for object detection. In Proceedings of the IEEE/CVF International Conference on Computer Vision, Seoul, Republic of Korea, 27 October–2 November 2019; pp. 6569–6578. [Google Scholar] [CrossRef]
- Tian, Y.; Gelernter, J.; Wang, X.; Li, J.; Yu, Y. Traffic sign detection using a multi-scale recurrent attention network. IEEE Trans. Intell. Transp. Syst. 2019, 20, 4466–4475. [Google Scholar] [CrossRef]
- Wang, J.; Chen, Y.; Dong, Z.; Gao, M. Applications. Improved YOLOv5 network for real-time multi-scale traffic sign detection. Neural Comput. Appl. 2022, 35, 7853–7865. [Google Scholar] [CrossRef]
- Zou, H.; Zhan, H.; Zhang, L. Neural Network Based on Multi-Scale Saliency Fusion for Traffic Signs Detection. Sustainability 2022, 14, 16491. [Google Scholar] [CrossRef]
- Xiao, G.; Luo, H.; Zeng, K.; Wei, L.; Ma, J. Robust Feature Matching for Remote Sensing Image Registration via Guided Hyperplane Fitting. IEEE Trans. Geosci. Remote. Sens. 2022, 60, 5600714. [Google Scholar] [CrossRef]
- Xiao, G.; Ma, J.; Wang, S.; Chen, C. Deterministic Model Fitting by Local-Neighbor Preservation and Global-Residual Optimization. IEEE Trans. Image Process. 2020, 29, 8988–9001. [Google Scholar] [CrossRef]
- Malik, Z.; Siddiqi, I. Detection and recognition of traffic signs from road scene images. In Proceedings of the 2014 12th International Conference on Frontiers of Information Technology, Islamabad, Pakistan, 17–19 December 2014; pp. 330–335. [Google Scholar] [CrossRef]
- Tang, S.; Huang, L.-L. Traffic sign recognition using complementary features. In Proceedings of the 2013 2nd IAPR Asian Conference on Pattern Recognition, Naha, Japan, 5–8 November 2013; pp. 210–214. [Google Scholar] [CrossRef]
- Carion, N.; Massa, F.; Synnaeve, G.; Usunier, N.; Kirillov, A.; Zagoruyko, S. End-to-end object detection with transformers. In Proceedings of the Computer Vision–ECCV 2020: 16th European Conference, Glasgow, UK, 23–28 August 2020; pp. 213–229. [Google Scholar] [CrossRef]
- Vaswani, A.; Shazeer, N.; Parmar, N.; Uszkoreit, J.; Jones, L.; Gomez, A.N.; Kaiser, Ł.; Polosukhin, I. Attention is all you need. Adv. Neural Inf. Proc. Syst. 2017, 30, 5998–6008. [Google Scholar] [CrossRef]
- Lin, T.-Y.; Maire, M.; Belongie, S.; Hays, J.; Perona, P.; Ramanan, D.; Dollár, P.; Zitnick, C.L. Microsoft coco: Common objects in context. In Proceedings of the Computer Vision–ECCV 2014: 13th European Conference, Zurich, Switzerland, 6–12 September 2014; pp. 740–755. [Google Scholar] [CrossRef]
- Zhu, X.; Su, W.; Lu, L.; Li, B.; Wang, X.; Dai, J. Deformable detr: Deformable transformers for end-to-end object detection. arXiv 2020, arXiv:2010.04159. [Google Scholar] [CrossRef]
- Li, F.; Zeng, A.; Liu, S.; Zhang, H.; Li, H.; Zhang, L.; Ni, L.M. Lite DETR: An interleaved multi-scale encoder for efficient detr. arXiv 2023, arXiv:2303.07335. [Google Scholar] [CrossRef]
- Li, F.; Zhang, H.; Liu, S.; Guo, J.; Ni, L.M.; Zhang, L. Dn-detr: Accelerate detr training by introducing query denoising. In Proceedings of the IEEE/CVF Conference on Computer Vision and Pattern Recognition, New Orleans, LA, USA, 18–24 June 2022; pp. 13619–13627. [Google Scholar] [CrossRef]
- Zhang, H.; Li, F.; Liu, S.; Zhang, L.; Su, H.; Zhu, J.; Ni, L.M.; Shum, H.-Y. Dino: Detr with improved denoising anchor boxes for end-to-end object detection. arXiv 2022, arXiv:2203.03605. [Google Scholar] [CrossRef]
- Chen, L.-C.; Papandreou, G.; Kokkinos, I.; Murphy, K.; Yuille, A.L. Deeplab: Semantic image segmentation with deep convolutional nets, atrous convolution, and fully connected crfs. IEEE Trans. Pattern Anal. Mach. Intell. 2017, 40, 834–848. [Google Scholar] [CrossRef] [PubMed]


| Settings | GTSDB | CCTSDB | ||||
|---|---|---|---|---|---|---|
| AP | AP50 | AP75 | AP | AP50 | AP75 | |
| Baseline | 73.61 | 95.16 | 90.35 | 76.92 | 96.52 | 94.83 |
| Baseline + (C2.3.4.5) | 74.12 | 96.03 | 90.87 | 77.21 | 97.14 | 95.24 |
| Baseline + (C2.3.4.5) + DSPP | 74.98 | 96.53 | 91.12 | 77.54 | 97.25 | 95.95 |
| Baseline + (C2.3.4.5) + DSPP + FRAM | 76.13 | 98.12 | 92.03 | 78.24 | 98.33 | 97.23 |
| Settings | GTSDB | CCTSDB | ||||
|---|---|---|---|---|---|---|
| APs | APm | APl | APs | APm | APl | |
| Baseline | 55.82 | 75.93 | 85.94 | 60.23 | 82.53 | 93.23 |
| Baseline + (C2.3.4.5) | 55.93 | 76.24 | 86.01 | 61.24 | 82.76 | 93.55 |
| Baseline + (C2.3.4.5) + DSPP | 56.52 | 76.22 | 85.93 | 61.96 | 82.65 | 93.41 |
| Baseline + (C2.3.4.5) + DSPP + FRAM | 57.12 | 76.19 | 86.42 | 63.04 | 83.12 | 94.37 |
| Method | GTSDB | CCTSDB | ||||
|---|---|---|---|---|---|---|
| AP | AP50 | AP75 | AP | AP50 | AP75 | |
| Deformable DETR | 73.89 | 97.15 | 91.21 | 75.99 | 97.18 | 96.89 |
| CornerNet | 56.75 | 73.84 | 67.54 | 57.69 | 73.52 | 67.31 |
| YOLOv3 | 61.28 | 74.36 | 76.73 | 61.92 | 74.99 | 73.15 |
| Conditional DETR | 73.46 | 96.85 | 91.34 | 77.13 | 97.21 | 96.72 |
| DSRA-DETR (Ours) | 76.13 | 98.12 | 92.03 | 78.24 | 98.33 | 97.23 |
Disclaimer/Publisher’s Note: The statements, opinions and data contained in all publications are solely those of the individual author(s) and contributor(s) and not of MDPI and/or the editor(s). MDPI and/or the editor(s) disclaim responsibility for any injury to people or property resulting from any ideas, methods, instructions or products referred to in the content. |
© 2023 by the authors. Licensee MDPI, Basel, Switzerland. This article is an open access article distributed under the terms and conditions of the Creative Commons Attribution (CC BY) license (https://creativecommons.org/licenses/by/4.0/).
Share and Cite
Xia, J.; Li, M.; Liu, W.; Chen, X. DSRA-DETR: An Improved DETR for Multiscale Traffic Sign Detection. Sustainability 2023, 15, 10862. https://doi.org/10.3390/su151410862
Xia J, Li M, Liu W, Chen X. DSRA-DETR: An Improved DETR for Multiscale Traffic Sign Detection. Sustainability. 2023; 15(14):10862. https://doi.org/10.3390/su151410862
Chicago/Turabian StyleXia, Jiaao, Meijuan Li, Weikang Liu, and Xuebo Chen. 2023. "DSRA-DETR: An Improved DETR for Multiscale Traffic Sign Detection" Sustainability 15, no. 14: 10862. https://doi.org/10.3390/su151410862
APA StyleXia, J., Li, M., Liu, W., & Chen, X. (2023). DSRA-DETR: An Improved DETR for Multiscale Traffic Sign Detection. Sustainability, 15(14), 10862. https://doi.org/10.3390/su151410862