Article

Understanding Farmers’ Intentions to Adopt Pest and Disease Green Control Techniques: Comparison and Integration Based on Multiple Models

School of Business, Hunan Agricultural University, Changsha 410128, China
*
Author to whom correspondence should be addressed.
Sustainability 2023, 15(14), 10822; https://doi.org/10.3390/su151410822
Submission received: 11 May 2023 / Revised: 3 July 2023 / Accepted: 8 July 2023 / Published: 10 July 2023

Abstract

:
Green control techniques (GCT) are an important supporting technology to ensure sustainable agricultural development. To advance the adoption of GCT, it is crucial to understand the intention of farmers to adopt GCT and its related determinants. However, current research is mostly limited to using a single theoretical model to explore farmers’ intentions to adopt GCT, which is not conducive to revealing the determinants of farmers’ intentions to adopt GCT. To address this gap, this study integrates the Theory of Planned Behavior (TPB), the Technology Acceptance Model (TAM), the Innovation Diffusion Theory (IDT), and the Motivational Model (MM) based on research data from 362 rice farmers in Heshan District, Yiyang City, Hunan Province, and uses partial least squares structural equation modeling (PLS-SEM) to empirically test and compare the above models. The model comparison results prove that the TPB (R2 = 0.818, Q2 = 0.705), TAM (R2 = 0.649, Q2 = 0.559), IDT (R2 = 0.782, Q2 = 0.674), and MM (R2 = 0.678, Q2 = 0.584) models all have explanatory power and predictive validity in the context of green control techniques. However, the integrated model (R2 = 0.843, Q2 = 0.725) is found to be superior to these individual theoretical models because it has larger values of R2, Q2, and smaller values of Asymptotically Efficient, Asymptotically Consistent, and provides a multifaceted understanding for identifying the factors influencing adoption intentions. The results of the path analysis show that attitude, perceived behavioral control, perceived usefulness, subjective norm, and visibility significantly and positively influence adoption intentions in both the single and integrated models and are determinants of farmers’ intentions to adopt GCT.

1. Introduction

The vicious cycle of the excessive application of chemical pesticides and pest resistance has produced negative outcomes such as reduced biodiversity, water pollution, and harm to human health [1,2,3], hindering the sustainable development of agriculture. As a major pesticide production and use country, China has long been in a state of chemical pesticide over-application. According to the relevant data, in the past 10 years, China’s annual application of chemical pesticides reached a maximum of 1.877 million tons (the data come from the National Bureau of Statistics of China, https://data.stats.gov.cn/easyquery.htm?cn=C01&zb=A0D0C&sj=2022, accessed on 1 July 2023), and an average utilization rate of only 39.8%, far below the world advanced level of 50% to 60% [4]. To solve the problem of excessive dependence on chemical pesticides in crop pest control, China has implemented the development and application of green control techniques (GCT) since 2006. Green control techniques refer to sustainable plant protection methods that integrate ecological control, biological control, physical control, and other environmentally friendly measures by which to control crop pests and diseases. One such technique is the Chinese practice of Integrated Pest Management (IPM) [5]. As of 2021, China’s GCT application coverage rate was estimated at 46% (the data come from the China Agricultural Technology Extension Service Center Pest Control Office’s 2021 crop pest control profile and 2022 priorities’ theme report, http://www.jsppa.com.cn/news/zhibao/6060.html, accessed on 12 November 2022). However, the promotion of GCT is not smooth, and there are significant challenges in further diffusion [6,7,8,9]. Because of the importance of GCT for sustainable agricultural development, this issue has attracted scholarly interest. The influencing factors of farmers’ adoption of GCT is a research focus, which is the need to understand farmers’ behavior and the need for the agricultural sector to design GCT promotion policies.
In the recent literature, many studies have focused on the adoption of climate smart and green energy technologies for agricultural sustainability [10,11,12,13,14]. Similarly, most of the literature on farmers’ adoption of sustainable pest and disease control technology explained farmers’ behavior from the perspective of economic benefits. Some studies have suggested that the willingness of farmers to adopt sustainable pest and disease control technology depended on the financial performance of the technology compared to conventional chemical control methods [6,15,16,17], but other studies did not support this conclusion [18,19,20]. The adoption of sustainable pest and disease control technology, as a high-cost pro-environmental behavior [21], depends on the complex decision-making process, but the economic model seems to have a weakness that cannot fully explain the complexity of pro-environmental behavior decision-making [22]. Therefore, more and more scholars have suggested using behavioral science theory as a guide to truly understand farmers’ behavior in a clear framework [23]. Since the intention is a reliable antecedent for explaining and predicting behavior, some scholars have used the Theory of Planned Behavior (TPB) [24,25,26], the Technology Acceptance Model (TAM) [27,28,29], the Innovation Diffusion Theory (IDT) [27,28], or the Motivational Model (MM) [30] to study farmers’ adoption of sustainable pest and disease control technology, and the results show that these competitive theoretical models have certain explanatory power to elucidate farmers’ intentions. However, studies using the same theoretical model have contradictory conclusions. For example, Despotovic et al. [24] used TPB to construct the formation mechanism of the IPM adoption intentions of Serbian farmers and found that attitude was the most important factor driving farmers to form adoption intentions. Lou et al. [26] also used TPB to study the GCT adoption behavior of Chinese tea farmers but found that there was no correlation between attitude and adoption intentions. In addition, based on the view that the integrated theoretical model can better understand behavior than a single theory [31], some studies have constructed an integrated model to explore farmers’ intentions. For example, Sharifzadeh et al. [27] established a TAM-IDT integrated model and found that the integrated model explained 78% of the variance change in farmers’ intentions to adopt biological control technology. Rezaei et al. [28] embedded social influence, self-efficacy, and visibility and compatibility structures in IDT into TAM to explore farmers’ adoption of IPM, resulting in significantly improved explanatory power and robustness. However, few studies have integrated more than three theoretical models to understand farmers’ intentions. In summary, although the existing literature provides knowledge for understanding farmers’ intentions to adopt GCT, it does not compare and analyze the main competition models and lacks an integrated model based on multiple theories to identify the determinants of farmers’ intentions.
The purpose of this study was to evaluate and integrate multiple well-founded theories, namely TPB, TAM, IDT, and MM, to form a comprehensive picture of GCT adoption intentions. We not only examined the impact of a single theory and integrated model on farmers’ intentions to adopt GCT, but also used a multi-model comparison method to empirically test farmers’ intentions. This study mainly addressed two key questions: (1) In the context of GCT, which theoretical models effectively explain farmers’ intentions to adopt GCT? (2) What are the factors determining farmers’ intentions to adopt GCT in the integrated model? Compared with the existing literature, the contributions of this paper were as follows: (1) The effectiveness of TPB, TAM, IDT, and MM models in the context of GCT was compared by using PLS-SEM technology, which expanded the application of these four theories in the field of agricultural technology adoption. (2) The integrated model reflects a comprehensive picture of farmers’ intentions to adopt GCT, confirms that the integrated model has higher explanatory power, and reveals the determinants of farmers’ intentions. (3) Based on these results, researchers can focus on the established construct of the integrated model of farmers’ intentions to adopt GCT and explore the antecedents in specific situations.

2. Theoretical Background and Hypotheses

2.1. Theory of Planned Behavior

Among the many theoretical models of understanding behavior, the Theory of Planned Behavior proposed by Ajzen [32] is widely used [33], which is derived from the Theory of Reasoned Action [34]. The theory holds that intention is the antecedent condition of behavior, and intentions are driven by attitude, subjective norms, and perceived behavioral control. Previous studies have shown that TPB is powerful in explaining farmers’ conservation of soil [35], safe use of fertilizers [36], adoption of straw incorporation techniques [37], adoption of Best Management Practices [38], and conservation of water resources [39].
Attitude refers to the individual’s positive or negative evaluation of the results of their specific behavior [32]. Generally speaking, the stronger the attitude of the farmers, the stronger their intentions to implement the behavior. In this study, attitude is defined as farmers’ positive or negative evaluation of the consequences of adopting GCT. The results of most studies also support the view that attitude is an important predictor of adoption intentions [24,25,29,40,41]. For example, Despotovic et al. [24] showed that attitude is the most important driving factor affecting the intentions of Serbian farmers to adopt IPM. Rezaei et al. [25] studied the formation mechanism of Iranian farmers’ intentions to adopt IPM, and the results showed that attitude had a significant positive impact on intentions to adopt IPM. Accordingly, we assume:
H1. 
Attitude positively affects farmers’ intentions to adopt GCT.
A subjective norm refers to the perceived pressure from the surrounding social system when an individual makes a decision, reflecting how the individual’s intentions are influenced by the expectations of other groups [32]. This study defines a subjective norm as farmers’ perception of the pressure of surrounding social systems (such as family members, neighborhood friends, government departments, partners, etc.) on their adoption of GCT. Lou et al. [26] studied the adoption behavior of GCT by Chinese tea farmers and found that the subjective norm was the influencing factor of adoption intentions. Damalas [42] pointed out that the subjective norm is a factor affecting farmers’ safe pesticide application behavior. This article proposes the hypothesis:
H2. 
The subjective norm positively affects farmers’ intentions to adopt GCT.
Perceived behavioral control refers to the individual’s perception of the factors that promote or hinder the implementation of a particular behavior [32], reflecting the individual’s subjective perception of the ability to perform the behavior. This perception mainly depends on farmers’ cognition of their own time, energy, knowledge, skills, and funds [25,27]. Generally speaking, the more resources and opportunities an individual thinks he/she has to perform a behavior, the smaller the anticipatory barrier is, the stronger his/her perceived behavioral control is, and the stronger his/her intentions to perform the behavior are. In this study, perceived behavioral control refers to farmers’ subjective perception of the ability to adopt GCT. The study by Lou et al. [26] showed that perceived behavioral control had a positive impact on tea farmers’ intentions to adopt GCT. Bagheri et al. [43] studied the integrated crop management (ICM) adoption behavior of Iranian farmers and found that perceived behavioral control had a positive effect on both adoption intentions and behavior. Based on this information, this article proposes the hypothesis:
H3. 
Perceived behavioral control positively affects farmers’ intentions to adopt GCT.

2.2. Theory Technology Acceptance Model

In information technology adoption behavior, Davis [44] proposed two core concepts of perceived usefulness and perceived ease of use based on the Theory of Reasoned Action, the Theory of Planned Behavior, the Expectation Theory, and the Self-Efficacy Theory as the decisive factors affecting intentions and behavior. Among them, perceived usefulness directly affects intentions and is itself affected by perceived ease of use. Since its inception, TAM has been widely used in the study of individual technology adoption behavior [45].
Perceived usefulness is defined as the degree to which an individual perceives the use of a particular system to improve job performance [44]. Gefen and Straub [46] emphasized that perceived usefulness is an individual’s perception of technical efficiency and effectiveness, which is a task-oriented response. In this study, perceived usefulness is defined as the extent to which rice farmers perceive the usefulness of GCT. Abdollahzadeh et al. [47] pointed out that perceived usefulness is an important factor in promoting farmers’ adoption of biological control technology. A study by Michels et al. [48] on the adoption of plant protection drones by German farmers found that perceived usefulness was the most important driver of adoption intentions. On this basis, we propose:
H4. 
Perceived usefulness positively affects farmers’ intentions to adopt GCT.
Perceived ease of use is defined as an individual’s effortless perception of using a particular system [44]. This study defines perceived ease of use as farmers’ effortless perception of adopting GCT. Many studies have shown that perceived ease of use has a significant role in promoting perceived usefulness and adoption intentions [49,50]. For example, Gao et al. [51] studied the adoption behavior of GCT in Chinese family farms and found that perceived ease of use significantly positively impacted adoption intentions. The research of Michels et al. [48] proved that perceived ease of use has a significant positive impact on perceived usefulness and adoption intentions. Based on the above information, this article proposes the following hypotheses:
H5. 
Perceived ease of use positively affects farmers’ intentions to adopt GCT.
H6. 
Perceived ease of use positively affects perceived usefulness.

2.3. Innovation Diffusion Theory

Innovation Diffusion Theory was proposed by Rogers [52], posits that innovation is considered a new idea or object by individuals, and the process of its promotion in a particular channel or a particular social system is called diffusion. Furthermore, this theory proposes that the speed of innovation diffusion is affected by relative advantage, complexity, compatibility, trialability, and visibility. However, Moore and Benbasat [53] proposed that the essence of innovation diffusion is the accumulation of the individual adoption of innovation. They held that the key to the speed of diffusion is not the characteristics of the innovation itself, but depends on the individual’s perception of innovation characteristics.
Relative advantage refers to the degree to which individuals perceive an innovation to be an improvement on the previous technology [53]; complexity is the degree to which an innovation is considered difficult to use [53]. However, most scholars consider that relative advantage and perceived usefulness, complexity and perceived ease of use are conceptually equivalent; and that the core structure in TAM is essentially a subset of the IDT model [27,28]. Following this idea, this study uses perceived usefulness to replace relative advantage and perceived ease of use to replace complexity.
Compatibility refers to the degree to which users perceive that innovation matches their values, needs, and past experience [47]. Generally speaking, users are more likely to form a positive adoption intention for technologies with high compatibility [27,54,55]. This study defines compatibility as farmers’ perception of GCT as matching their values, pest and disease prevention needs, and previous prevention and control experience. Sharifzadeh et al. [27] found that compatibility can significantly increase farmers’ intentions to adopt biological control technology, and for each unit of increase in compatibility, the contribution to intention to adopt was 35%. On these bases, we propose the following hypothesis:
H7. 
Compatibility positively affects farmers’ intentions to adopt GCT.
Trialability refers to the degree to which users perceive that innovation can be tried and verified on a limited basis [53]. In general, technologies that can be easily tested by users will be accepted more quickly than those that are difficult to test [56]. This study defines trialability as farmers’ perception that GCT can be tested. The results of many studies also support the positive impact of trialability on adoption intentions [54,57,58]. For example, a survey conducted by Haji et al. [58] on Iranian sugar beet farmers found that trialability can significantly increase farmers’ intentions to adopt drip irrigation technology. Thus, this article expects:
H8. 
Trialability positively affects farmers’ intentions to adopt GCT.
Visibility refers to the degree to which users can observe the efficiency and effectiveness of innovation transformation [53]. This study defines visibility as farmers’ observable perception of the effect of adopting GCT. Venkatesh and Davis [59] emphasized that potential adopters cannot recognize the technology if the transformation results of a new technology cannot be directly well observed and users have difficulty attributing the innovation results, even if the technology is efficient. Many studies have also shown that visibility is an important factor affecting adoption intentions [54,60,61]. For example, Peshin [60] studied the factors that drive Indian farmers’ adoption of IPM and found that visibility is an important factor in predicting farmers’ adoption behavior. This study expects that when farmers more easily observe the adoption effect of GCT, farmers are more likely to form a positive intention:
H9. 
Visibility positively affects farmers’ intentions to adopt GCT.

2.4. Motivational Model

Motivation refers to a psychological tendency to stimulate and maintain an individual’s orientation to a specific goal, which is the dynamic source of human behavior [62]. Research on behavioral motivation has always been an enduring topic in psychology, such as the Expectancy-Value Theory, the Self-determination Theory, the Attribution Theory, the Goal Theory, and other motivation theories; all have discussed motivation from different perspectives. Although there have been many motivation theories, these theories generally agreed that motivation can be divided into intrinsic motivation and extrinsic motivation from the source of formation, and both drive the formation of intentions [62]. Among them, extrinsic motivation is caused by results other than behavior, such as improving job performance, obtaining rewards, or avoiding punishment, which is driven by the reinforcement value brought by behavioral results [63]. Davis et al. [64] proposed that perceived usefulness explains the external utility value of adoption behavior well and was a key driver of intentions; this study followed this idea and replaced perceived usefulness with external motivation.
Intrinsic motivation is triggered by the characteristics of the behavior itself, which mainly meet the individual’s endogenous mental needs [65]. Ryan and Deci [63] proposed that such endogenous mental needs mainly include autonomy needs, ability needs, and belonging needs, and that the stronger an individual perceives that a behavior satisfies these three needs, the stronger the individual’s intrinsic motivation is for that behavior. In this study, intrinsic motivation is defined as farmers’ perceptions of adopting GCT to satisfy their endogenous mental needs. Abdollahzadeh et al. [66] showed that one of the important motivations for farmers to adopt biological control technology was to satisfy the belonging needs. Garini et al. [30] found that intrinsic motivation is an influencing factor for Italian farmers to reduce the use of chemical herbicides. In addition, studies by Greiner and Gregg [67] and Jambo et al. [68] have also shown that intrinsic motivation is an effective driving force for farmers to adopt sustainable agriculture. Thus, we assume:
H10. 
Intrinsic motivation positively affects farmers’ intentions to adopt GCT.

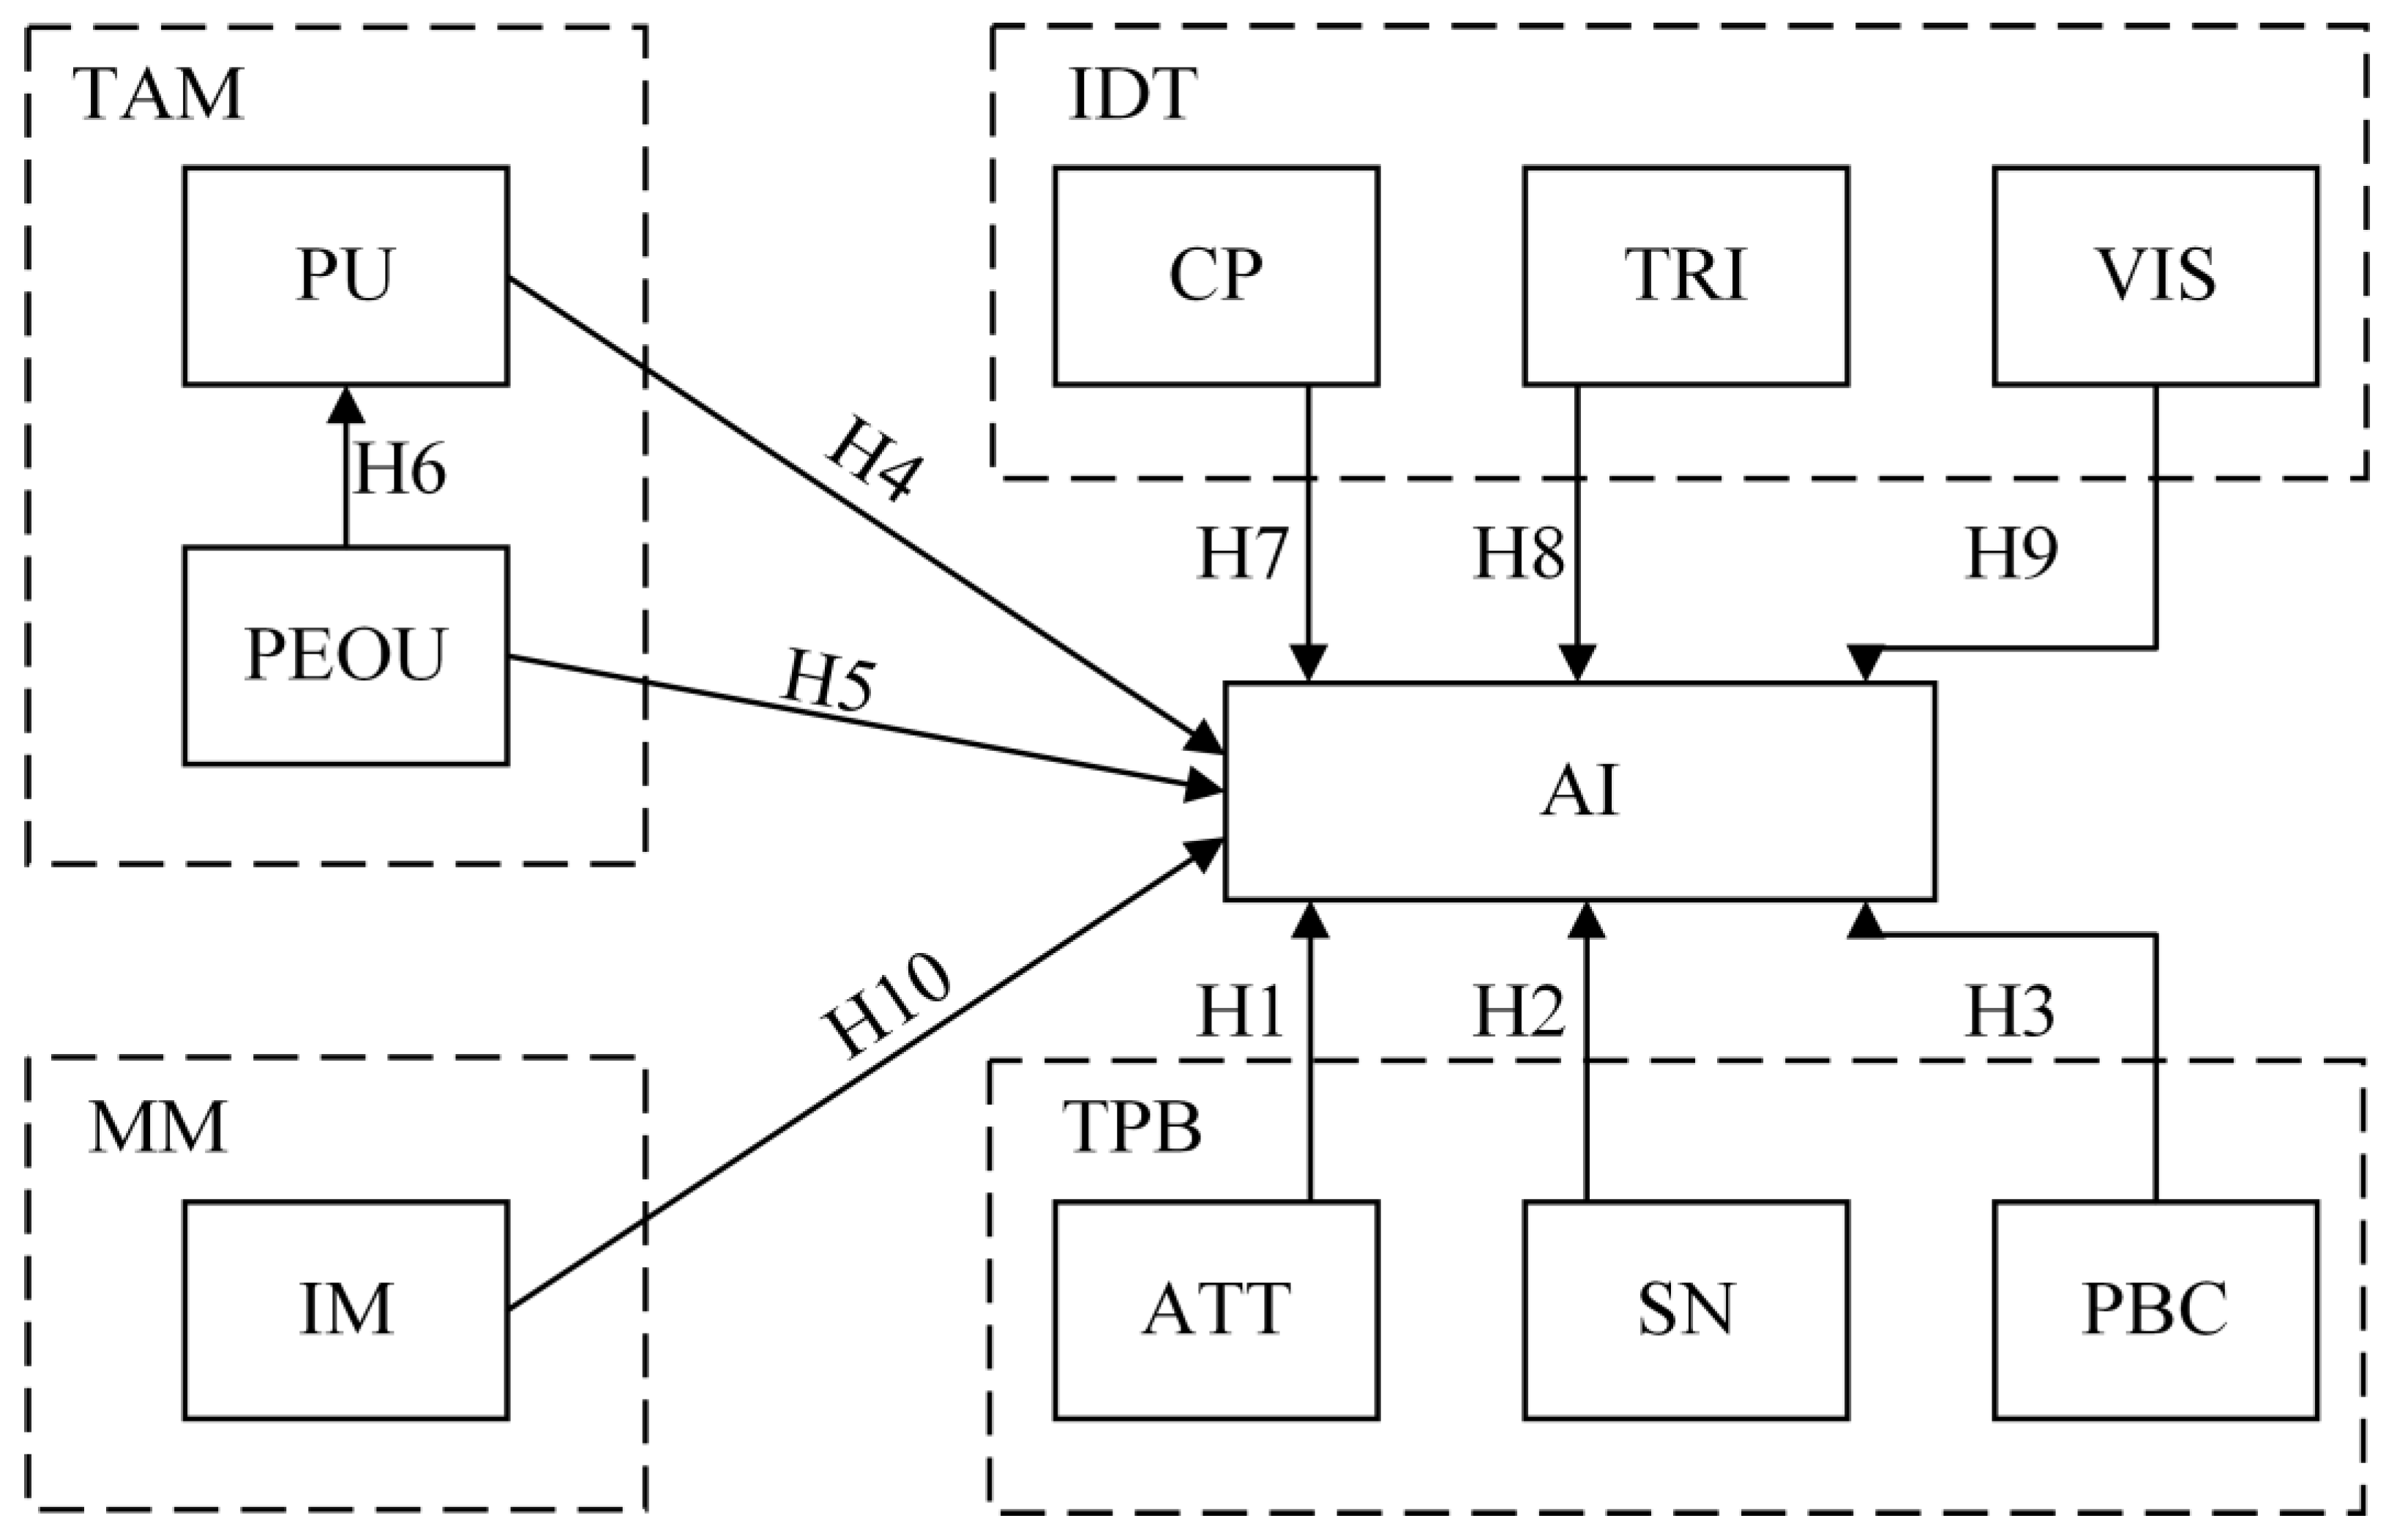
2.5. The Integrated Model

Based on the analysis above, we summarized all of the research hypotheses and proposed the integrated model for farmers’ intentions analysis by integrating TPB, TAM, IDT, and MM models (Figure 1).

3. Research Methods

3.1. Questionnaire Design

This study used a questionnaire survey to collect data. The questionnaire was divided into two parts. The first part was based on TPB, TAM, IDT, and MM, and used thirty-five indicators to measure the ten constructs of attitude, subjective norms, perceived behavioral control, perceived usefulness, perceived ease of use, compatibility, visibility, trialability, and adoption intentions. The second part was the social demographic characteristics of the sample farmers. In order to ensure the reliability and validity of the scale, the indicators were based on the mature scale of the existing literature, combined with the GCT scenario, and based on the pre-survey. All of the indicators in the first part were measured using a 7-point Likert scale; the specific measurement indicators and their sources are shown in Table 1.

3.2. Data Collection

The data used in this paper came from our household survey of rice farmers in Heshan District, Yiyang City, Hunan Province, China, from May to July 2022. The Heshan District of Yiyang City is located in the Dongting Lake area, the main rice-producing area in Hunan. The Heshan District government has vigorously built an integrated assembly and application demonstration project for GCT of rice pests and diseases in recent years. This was the first batch of demonstration counties for GCT in China. The survey area covered all townships under the jurisdiction of the Heshan District, with a total of 12 townships. The research method used stratified random sampling, with 1~3 villages randomly selected from each township and 8~15 farmers randomly selected from each village for household interviews. A total of 386 questionnaires were distributed; 362 valid questionnaires were obtained after excluding invalid questionnaires with missing key information and inconsistent content, so the effective recovery rate was 94%.

3.3. Data Analysis

This study used the partial least squares structural equation model (PLS-SEM) to test the model and hypotheses. This method is an iterative estimation method combining principal component analysis, canonical correlation analysis, and multiple regression. It is mainly composed of a measurement model and a structural model. The measurement model was used to analyze the relationship between measurement indicators and constructs, and the structural model was used to analyze the relationship between exogenous constructs and endogenous constructs. Compared with the covariance-based structural equation model (CB-SEM), PLS-SEM has the following advantages: (1) it is more suitable for a small sample and non-normal distribution data; (2) it is more suitable for complex structural models; in general, the average number of variables for CB-SEM was 4.70, for PLS-SEM it was 7.94 [70], and for this study it was 10; (3) it is more suitable for exploratory research. Considering the model complexity, sample size, and exploratory data, PLS-SEM was more suitable for this study than CB-SEM.
Descriptive statistics were calculated using SPSS 27.0 statistical software. SmartPLS Version 3 (PLS-SEM) was used to evaluate and compare each theoretical model and estimate the ensemble model. Using PLS-SEM, the evaluation model was divided into two phases, first evaluating the measurement model and then evaluating the structural model.

4. Results

4.1. Sample Characteristics

The socio-demographic characteristics of the respondents are shown in Table 2. (1) In terms of age distribution, farmers aged 51–60 and above accounted for 65.4% of the sample, while those aged 30 and below accounted for only 1.9%, which reflected the serious aging of rice farmers in the current rural society. (2) In terms of education level, secondary accounted for 39.5% and primary school and below accounted for 29.8%, indicating that the majority of farmers were not highly educated. (3) In terms of the number of years of rice cultivation, 55.0% of the farmers had been cultivating rice for more than 15 years, indicating that most farmers had more experience in cultivation. (4) In terms of family annual net income, 31.5% of the farmers had a family annual net income of 10,000 CNY or less, and 28.5% had a family annual net income of 10–50,000 CNY, indicating that most of the farmers had a low family annual net income. (5) In terms of gender, 65.2% of the farmers (household heads) interviewed were male and 34.8% were female, which indicated that men still occupied the main decision-making power in current rural agricultural production. (6) In terms of the rice cultivation area, 66.0% of the farmers’ rice cultivation area was 50 Mu or less, indicating that small-scale rice production still occupied the main position at present. (7) In addition, 28.7% of the farmers visited had village cadres in their family members. (8) In terms of the organizational model, 29.8% of the farmers interviewed had joined cooperatives, and 10.9% had joined rice production bases of agricultural enterprises. (9) In terms of the number of family workers, the average was 2.71. During the research, it was also found that the current phenomenon of rural labor outflow was more serious, and the families that grew rice were mainly elderly couples.

4.2. Measurement Model

The measurement model assessment mainly included reliability and validity analysis. As shown in Table 3, the factor loading values of all indicators were greater than 0.7 (range: 0.759~0.966), higher than the acceptable threshold of 0.7, and p < 0.001, indicating that the measurement indicators had good reliability [71]. Moreover, the reliability of the measurement indicators was robust because the Cronbach’s alpha (CA) and Composite Reliability (CR) of all constructs were greater than 0.8, exceeding the recommended threshold of 0.7 [72]. The average variance extracted (AVE) of each construct ranged from 0.736 to 0.893, which was greater than the threshold of 0.5 [72], indicating good convergent validity. According to the Fornell-Larcker standard [73], the square roots of AVEs of all constructs were larger than the correlation coefficients between constructs, indicating that the constructs were unique and different in terms of measurement content (Table 4). Adopting the Fornell-Larcker criterion may have overestimated the discriminant validity of constructs. Henseler et al. [74] proposed a more rigorous Heterotrait-Monotrait Ratio (HTMT) criterion. As shown in Table 5, the HTMT values of each construct were less than 0.9, indicating that the discriminant validity was good.

4.3. Structural Model
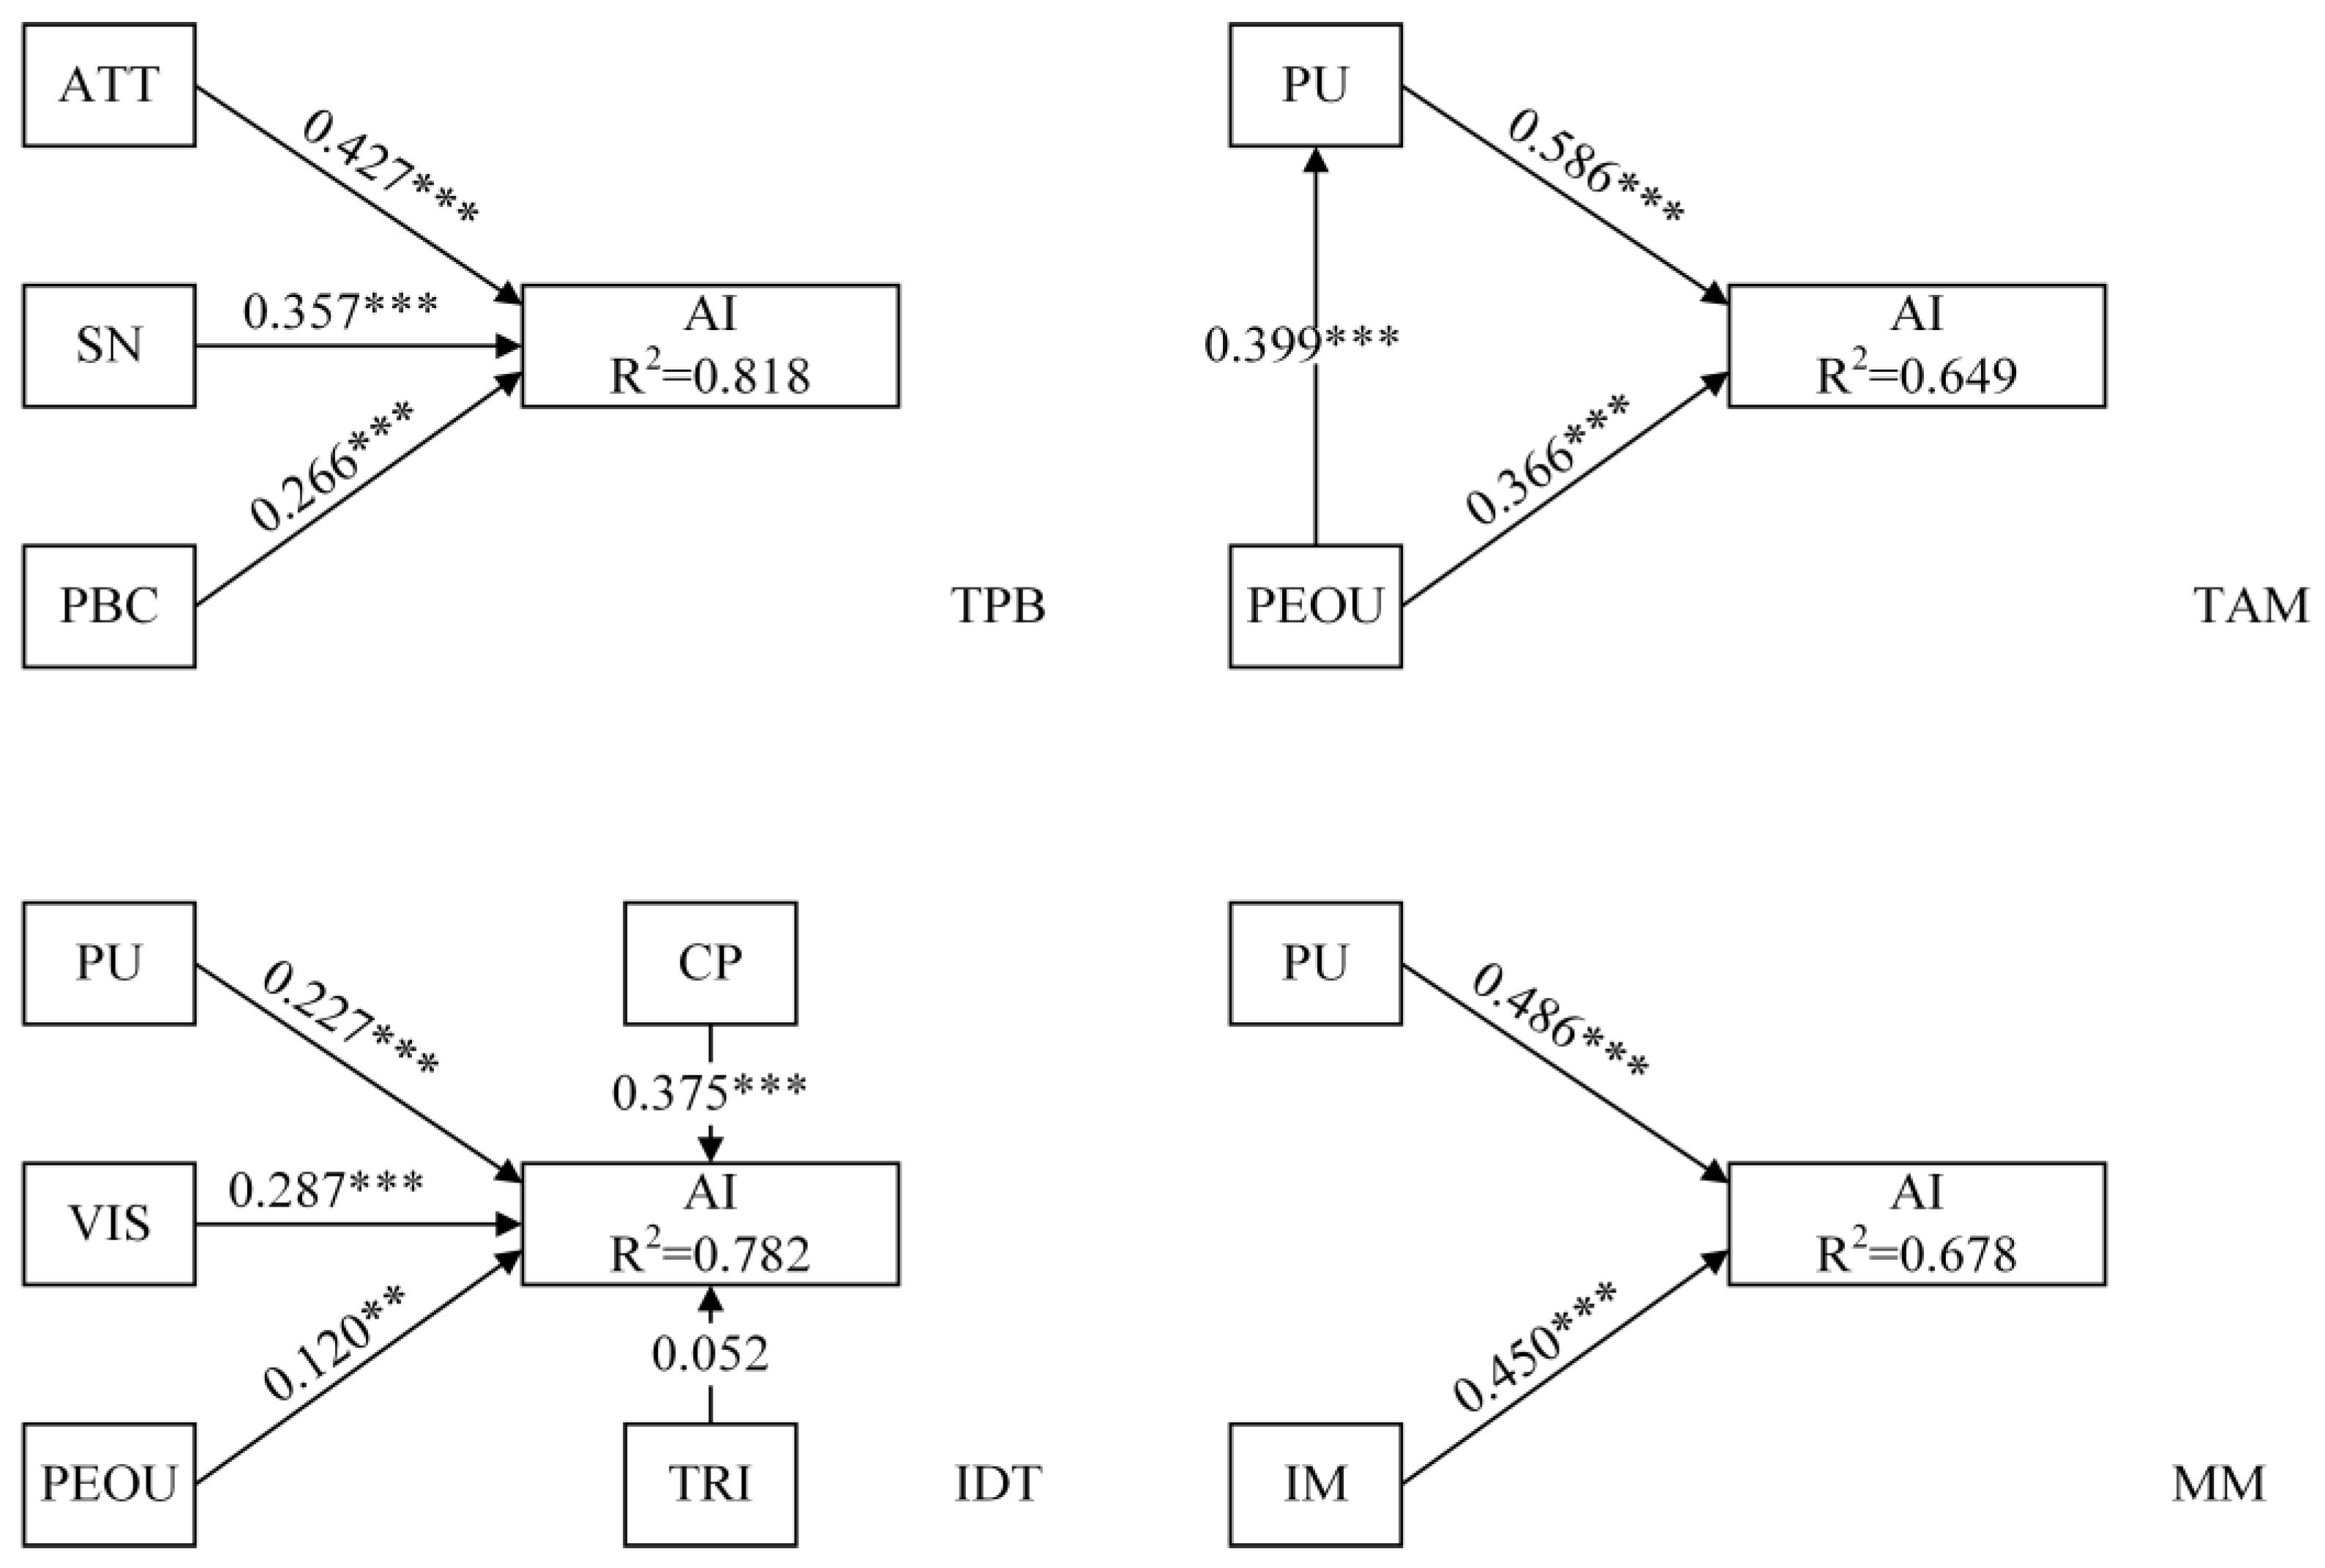
4.3.1. Single Model

The assessment results of the TPB, TAM, IDT, and MM models are shown in Figure 2. These four models explained 81.8%, 64.9%, 78.2%, and 67.8% of the variance changes in intentions, respectively, and all showed a good explanatory power for farmers’ intentions to adopt GCT. Except for the trialability in IDT, the path coefficients of all models were statistically significant. Specifically, in TPB, attitude (β = 0.427, p < 0.001), subjective norm (β = 0.357, p < 0.001), and perceived behavioral control (β = 0.266, p < 0.001) had positive effects on adoption intentions. In TAM, both perceived usefulness (β = 0.586, p < 0.001) and perceived ease of use (β = 0.366, p < 0.001) positively affected intentions, and the positive effect of perceived ease of use on perceived usefulness was also verified (β = 0.399, p < 0.001). In IDT, perceived usefulness (β = 0.227, p < 0.001), perceived ease of use (β = 0.120, p < 0.01), compatibility (β = 0.375, p < 0.001), and visibility (β = 0.287, p < 0.001) also positively affected intentions. However, the positive impact of trialability (β = 0.052, p = 0.067) on adoption intentions did not pass the significance test. In MM, perceived usefulness (β = 0.486, p < 0.001) and intrinsic motivation (β = 0.450, p < 0.001) positively affected intentions.

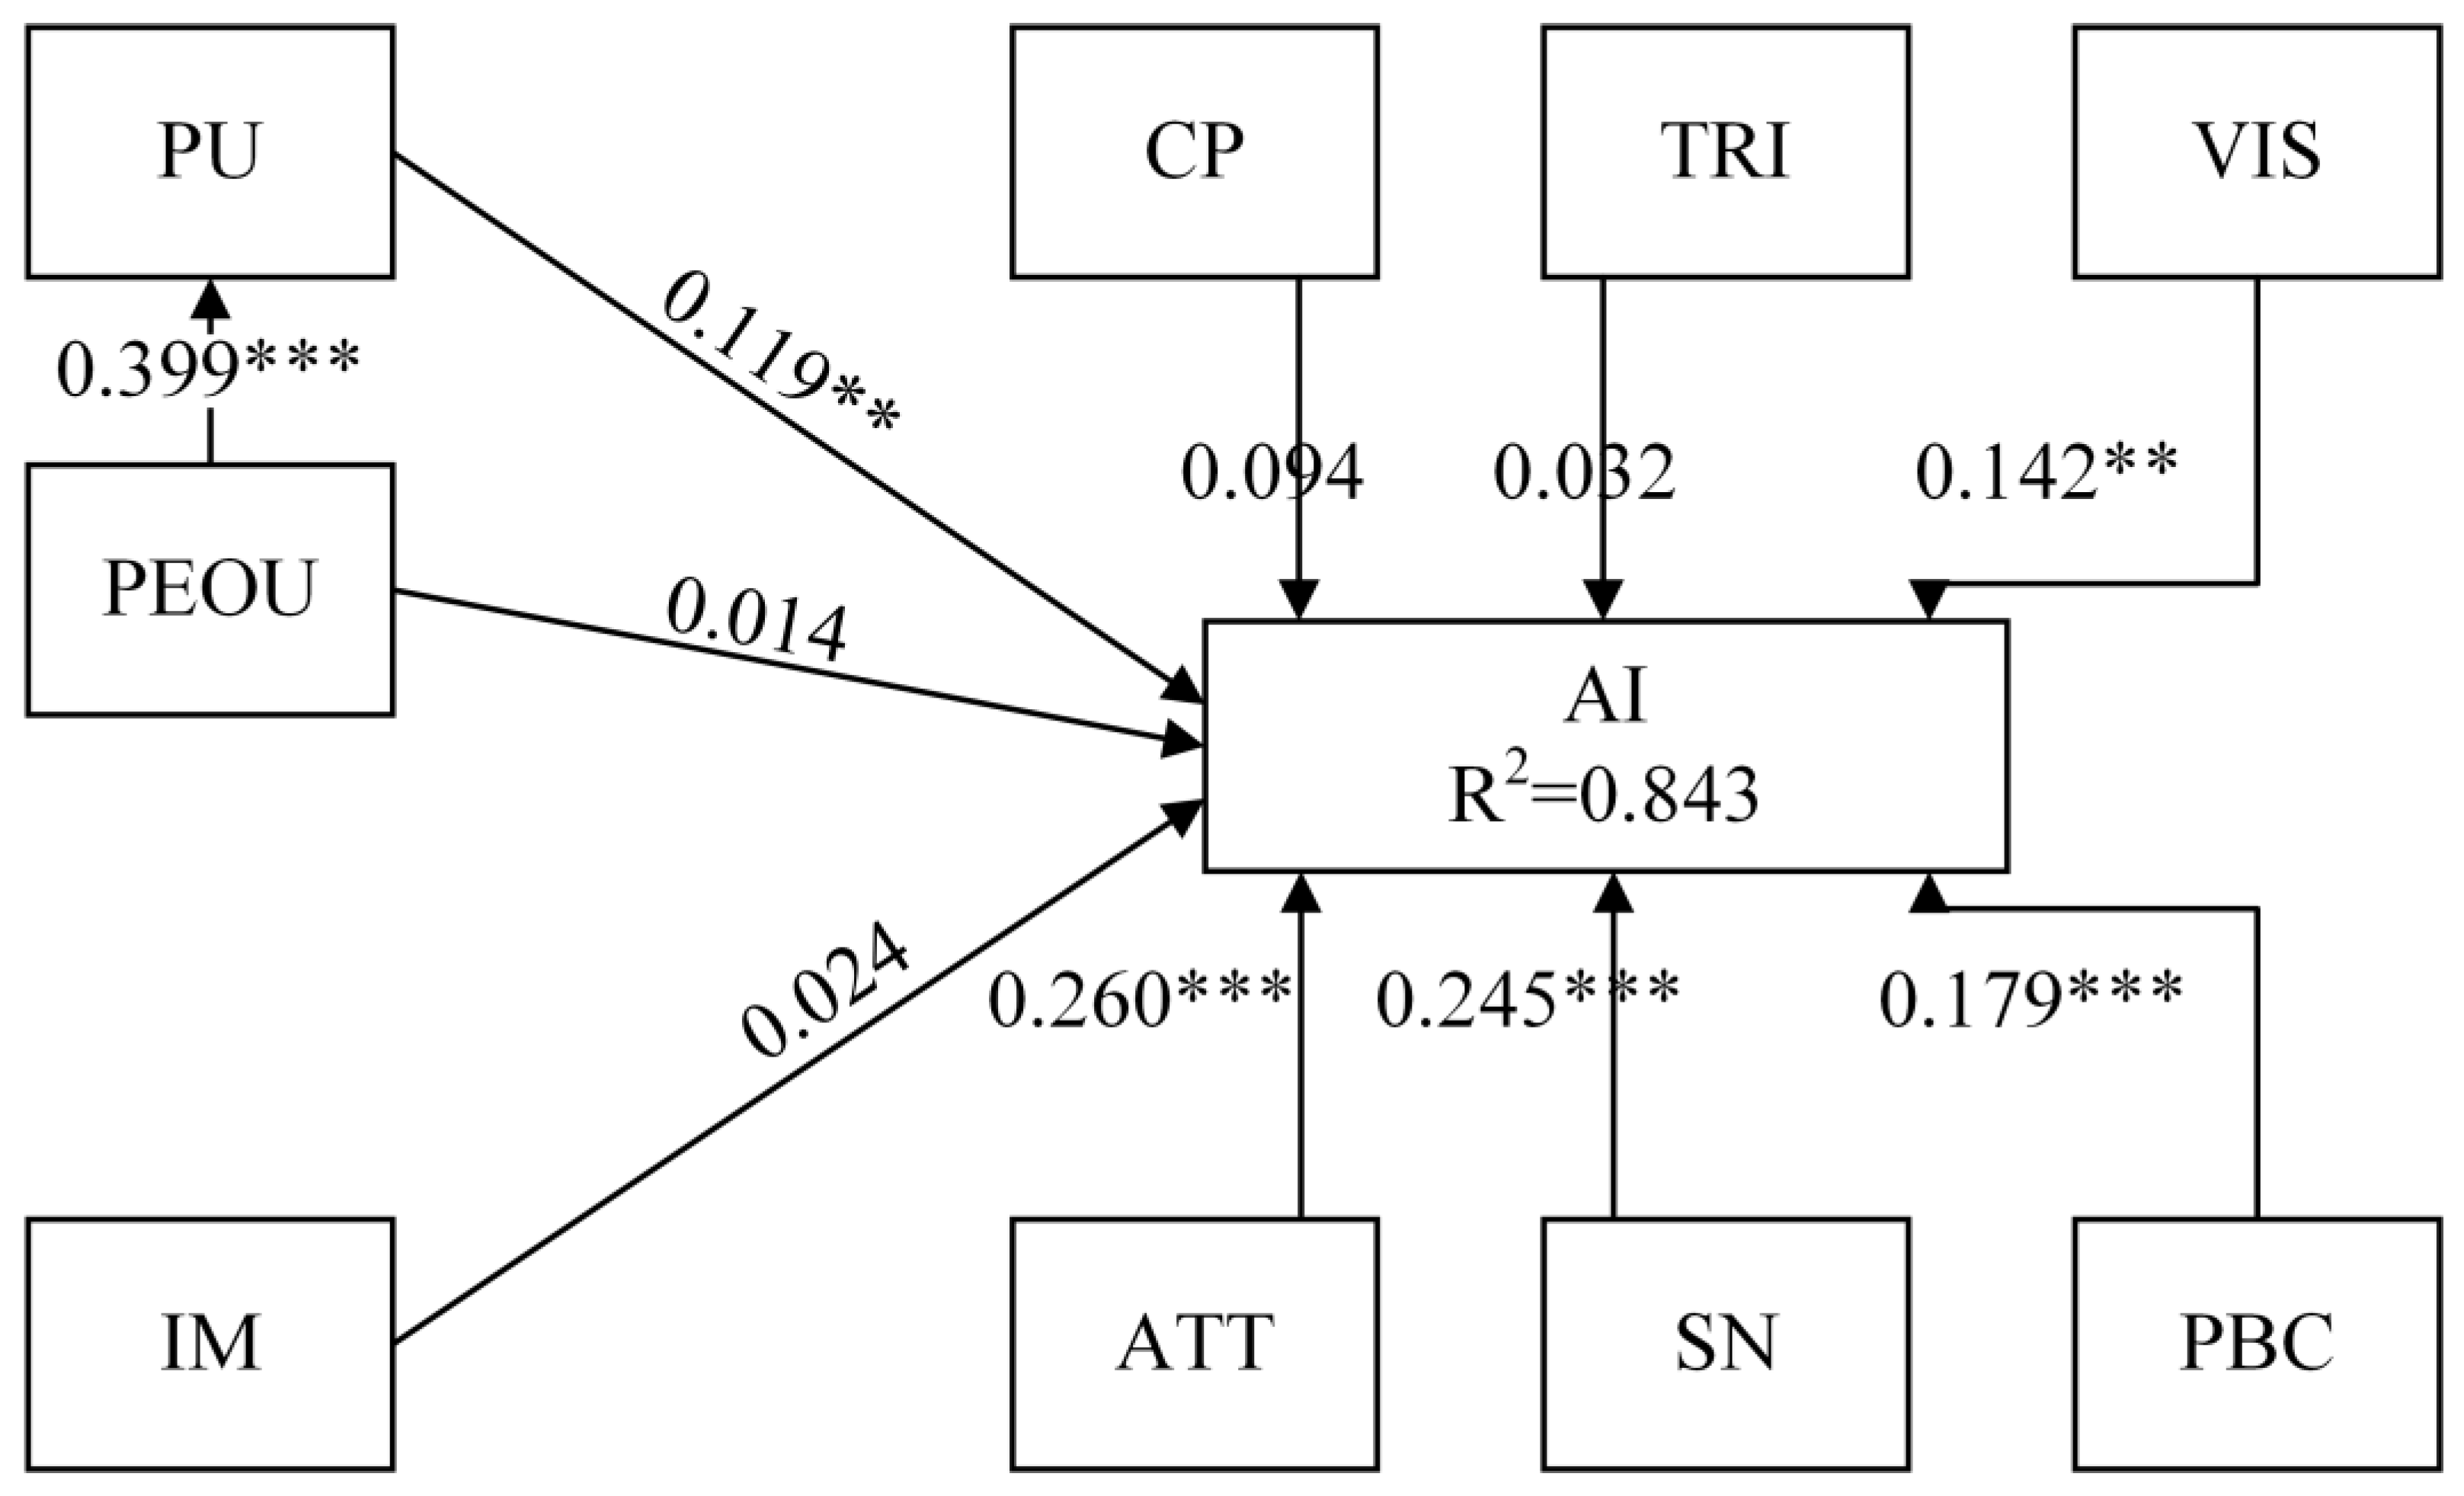
4.3.2. Integrated Model

The integrated model explained 84.3% of the variance in adoption intentions (Figure 3). Attitude (β = 0.260, p < 0.001), subjective norm (β = 0.245, p < 0.001), perceived behavioral control (β = 0.179, p < 0.001), perceived usefulness (β = 0.119, p < 0.01), and visibility (β = 0.142, p < 0.01) positively affected adoption intentions, supporting H1, H2, H3, H4, and H9. The influence of intrinsic motivation (β = 0.024, p = 0.474), compatibility (β = 0.094, p = 0.056), trialability (β = 0.032, p = 0.162), and perceived ease of use (β = 0.014, p = 0.716) on adoption intentions did not pass the significance test and did not support H5, H7, and H8. The positive effect of perceived ease of use on perceived usefulness (β = 0.399, p < 0.001) was supported by hypothesis H6.

4.4. Model Comparison

To avoid paying too much attention to the model’s R2 and ignoring the problem of model overfitting [75], that is, the model’s overfitting of the information in the sample data results in a poor fit of the model results to other samples, this study further compared the Q2 values for each model. Q2 is regarded as the prediction ability of the model outside the sample. Generally speaking, when Q2 ≥ 0.5, it shows that the prediction correlation of the model is strong; 0.25 ≤ Q2 < 0.5, the model has a moderate predictive correlation; 0 < Q2 < 0.25, the predictive correlation of the model is small [71]. In addition, Sharma et al. [76] argued that when comparing a set of competing models, the Model Selection Criteria can balance the simplicity and complexity of the model at the same time, which is more accurate than R2 and Q2, so this study reported the model selection criteria for each theoretical model. Model selection criteria mainly compared Asymptotically Efficient and Asymptotically Consistent between models. Asymptotically Efficient measures the relative distance between alternative models and real models, generally including AIC, AICc, and AICu; Asymptotically Consistent provides an estimate of the posterior probability of a model being true, generally including BIC, HQ, and HQc. When comparing a set of competitive models, it is generally accepted that the smaller the value of these criteria, the closer the model is to the real model. Table 6 summarizes the model comparison results of TPB, TAM, IDT, MM, and the integrated model. From Table 6, it can be seen that R2, Q2, and model selection criteria all show that the integrated model was significantly better than TPB, TAM, IDT, and MM.

5. Discussion

In the previous section, this study validated the effectiveness of each single and integrated model in GCT scenarios using PLS-SEM and compared the single and integrated models in various aspects. This provided strong evidence to reveal whether the integrated model was superior to the single model. Furthermore, by comparing the differences in the significance test results of the influencing factors between the single model and the integrated model, the key influencing factors of intentions to adopt GCT were further revealed.
Based on the comparison of R2, Q2, and model selection criteria, the integrated model was better than a single model in understanding farmers’ intentions in the context of GCT. In terms of explanatory power, TPB (R2 = 0.818) and IDT (R2 = 0.782) showed strong explanatory power, MM (R2 = 0.678) and TAM (R2 = 0.649) showed moderate explanatory power, and the integrated model (R2 = 0.843) was superior to any single model. In terms of predictive power, the integrated model (Q2 = 0.725), TPB (Q2 = 0.705), IDT (Q2 = 0.674), MM (Q2 = 0.584), and TAM (Q2 = 0.559) all had high predictive correlation. Comparing the Asymptotically Efficient and Asymptotically Consistent of each models, it was also found that the integrated model performed best in this group of competitive models. It is worth noting that in the context of GCT, the comparison of the three standards revealed the following order: integrated model > TPB > IDT > MM > TAM. Sharifzadeh et al. [27] and Rezaei et al. [28] also held this view; that is, compared with a single competitive theory, the integrated model provided a more comprehensive insights for explaining or predicting behavioral intentions.
According to the test results of the single model and integrated model, attitude, subjective norm, perceived behavioral control, perceived usefulness, and visibility all have positive effects on adoption intentions, but the positive influence of trialability on adoption intentions did not pass the significance test both. Attitude has the greatest impact on farmers’ intentions to adopt GCT, which is consistent with the research of Asante et al. [77] and Despotovic et al. [24], indicating that the higher the farmers’ recognition of the consequences of the adoption of GCT, the stronger their intentions to adopt. Subjective norm is the second major factor affecting adoption intentions, which is consistent with the research of Damalas [42] and Savari et al. [78]. Since the current adoption of GCT is still a government-led activity, the government provides skills training and subsidies to farmers through joint cooperatives or agricultural enterprises. Therefore, when farmers decide whether to adopt it, they will take into account the views of government departments and partners in addition to the suggestions of family and neighboring friends. Perceived behavioral control has a positive impact on farmers’ adoption intentions, and studies by Rezaei ea al. [25], Lou et al. [26], and Savari et al. [78] support this conclusion. Farmers’ perceived behavioral control over the adoption of GCT mainly depends on their perception of resources, such as knowledge and skills, time and energy, and technical payment capabilities [25], which means that when farmers lack the perception of these resources, they will likely reduce their intentions to adopt GCT. Visibility is another determinant of farmers’ intentions to adopt GCT, which means the importance of the demonstration base or demonstration farm construction [28]. Perceived usefulness also positively affects farmers’ adoption intentions, consistent with the research of Sharifzadeh et al. [27], Michels et al. [48], and Gong et al. [79]. This suggests that when farmers have a stronger perception of the advantages of GCT in improving soil, the control effect, human health, and reputation, their adoption intentions are increased. For trialability, it may be that farmers with a stronger intention to adopt at present generally directly benefit from demonstration projects, and the government directly establishes demonstration bases on their farmland, resulting in less experimental experience, so the positive effect of trialability on intention is not exerted.
Although compatibility, intrinsic motivation, and perceived ease of use in a single model positively affected intention, the impact of these factors on intentions in the integrated model was not statistically significant. This is inconsistent with other studies in which compatibility [27,54,55,80], intrinsic motivation [67,68,81], and perceived ease of use [48,51,82] were important factors affecting adoption intentions. The possible reason is that small-scale retail farmers are currently the majority in the sample area, and the production motivation of such farmers is mainly to meet subsistence needs and to obtain more money, and their demand for mental needs is not high when their material needs are not satisfied. This also supports the research of Bopp et al. [83], that farmers with low levels of intrinsic motivation are more sensitive to external incentives, so compatibility and intrinsic motivation are not determinants in the GCT scenario. For perceived ease of use, the current results were consistent with the research of Bagheri, Bondori et al. [29]. This shows that in the early stage of technology diffusion, perceived ease of use may be a direct factor affecting adoption intentions, but with the disappearance of farmers’ unfamiliarity with GCT, the positive impact of the perceived ease of use on the adoption intentions is gradually weakened. At this time, the driving force of farmers’ adoption of technology is mainly the recognition of the effect of technology [84]. On the other hand, the differences between the results of single and integrated models also suggest that certain independent variables, while passing significance tests in single models, may dissipate their effects on the dependent variable in integrated models due to competition from more independent variables. It is implied that integrated models have an advantage over single models in identifying key influencing factors.

6. Conclusions and Implications

To resolve the contradiction between intensive agriculture represented by the excessive use of chemical pesticides and environmental protection, and to realize the sustainable development of agriculture, countries around the world are encouraging farmers to adopt sustainable plant protection measures. Based on the sample data of 362 rice farmers in the Heshan District, this study used PLS-SEM to compare and integrate TPB, TAM, IDT, and MM. It was found that these four competitive theories had good explanatory power for farmers’ intentions to adopt GCT and provided a unique perspective on the identification of influencing factors of intentions to adopt. The integrated model integrated the views of TPB, TAM, IDT, and MM models, provided multi-faceted insights for understanding farmers’ intentions to adopt GCT, improved the understanding of farmers’ behavior, and identified attitudes, perceived behavioral control, perceived usefulness, subjective norms, and visibility were the determinants of farmers’ intentions to adopt GCT.
This article has some implications for the agricultural sector to design GCT promotion policies. First of all, attitude is crucial for farmers to adopt GCT. As GCT has environmental and social benefits, local governments could directly provide ecological compensation to adopters. On the other hand, the government can provide certification subsidies for farmers to participate in green or organic rice certification, and provide a guarantee for the price premium of rice produced by adopting green prevention and control technology, which helps farmers to form a positive attitude towards the adoption of GCT. Secondly, the local agricultural sector can strengthen the construction of GCT demonstration bases and demonstration farmers, and enhance the publicity of the prevention and control effect of GCT, so as to enhance the visibility and perceived usefulness of GCT to farmers, and achieve the purpose of improving farmers’ intentions to adopt it. Third, the local agricultural sector can encourage farmers to establish cooperative organizations or establish cooperative partnerships with enterprises, using cooperative relationships to promote the subjective norm of farmers, thereby enhancing their intentions to adopt GCT. At the same time, they can carry out multi-channel GCT training for farmers. For example, in collaboration with grassroots agricultural extension stations, farmers’ professional cooperatives, and agricultural enterprises, farmers can be trained in GCT by issuing technical guidance manuals, on-site technical guidance, and seminars to solve technical problems and improve farmers’ perceived behavioral control.
Although TPB, TAM, IDT, MM, and integrated models provide some insights into the research on farmers’ intentions to adopt GCT, this research still has limitations. First, since the data of this study were collected from rice farmers in Heshan District, the spillover of conclusions may be limited; further research can broaden the research area and sample farmers. At the same time, the data of this study are cross-sectional data, and future research can focus on the consistency of intention and behavior as well as the persistence and withdrawal of behavior. Third, integrating the four competitive theories may not be enough to fully explain farmers’ intentions to adopt GCT, future research can also embed other competitive theories according to specific backgrounds and objectives to establish an integrated model that more fully explains farmers’ intentions.

Author Contributions

Conceptualization, J.G. and P.X.; methodology, J.G.; software, J.G.; validation, J.G. and P.X.; formal analysis, J.G.; investigation, J.G.; resources, J.G. and P.X.; data curation, J.G. and P.X.; writing—original draft preparation, J.G.; writing—review and editing, J.G. and P.X.; visualization, J.G.; supervision, P.X.; project administration, P.X.; funding acquisition, P.X. All authors have read and agreed to the published version of the manuscript.

Funding

This study was supported by the Hunan Provincial Social Science Fund of China (21YBA084) and the Hunan Provincial Natural Science Foundation of China (2021JJ30369).

Institutional Review Board Statement

Ethical review and approval were waived for this study, due to this study did not involve human clinical trials or animal experiments and all participation was voluntary. This research was approved by the college institution and was completed under the supervision of the college throughout. All subjects gave written informed consent in accordance with the Declaration of Helsinki. Respondents were assured of confidentiality and anonymity.

Informed Consent Statement

Informed consent was obtained from all subjects involved in the study.

Data Availability Statement

The data in this study can be obtained by contacting the corresponding author.

Conflicts of Interest

The authors declare no conflict of interest.

References

  1. Atreya, K. Pesticide use knowledge and practices: A gender differences in Nepal. Environ. Res. 2007, 104, 305–311. [Google Scholar] [CrossRef] [PubMed]
  2. Stehle, S.; Schulz, R. Agricultural insecticides threaten surface waters at the global scale. Proc. Natl. Acad. Sci. USA 2015, 112, 5750–5755. [Google Scholar] [CrossRef] [PubMed]
  3. Tang, F.H.M.; Lenzen, M.; McBratney, A.; Maggi, F. Risk of pesticide pollution at the global scale. Nat. Geosci. 2021, 14, 206–210. [Google Scholar] [CrossRef]
  4. Pan, D.; He, M.; Kong, F. Risk attitude, risk perception, and farmers’ pesticide application behavior in China: A moderation and mediation model. J. Clean. Prod. 2020, 276, 124241. [Google Scholar] [CrossRef]
  5. Gao, Y.; Niu, Z.; Yang, H.; Yu, L. Impact of green control techniques on family farms’ welfare. Ecol. Econ. 2019, 161, 91–99. [Google Scholar] [CrossRef]
  6. Ma, W.; Abdulai, A. IPM adoption, cooperative membership and farm economic performance. China Agric. Econ. Rev. 2019, 11, 218–236. [Google Scholar] [CrossRef]
  7. Li, H.; Liu, Y.; Zhao, X.; Zhang, L.; Yuan, K. Estimating effects of cooperative membership on farmers’ safe production behaviors: Evidence from the rice sector in China. Environ. Sci. Pollut. Res. 2021, 28, 25400–25418. [Google Scholar] [CrossRef]
  8. Yu, L.; Chen, C.; Niu, Z.; Gao, Y.; Yang, H.; Xue, Z. Risk aversion, cooperative membership and the adoption of green control techniques: Evidence from China. J. Clean. Prod. 2021, 279, 123288. [Google Scholar] [CrossRef]
  9. Qiao, D.; Luo, L.; Zhou, C.; Fu, X. The influence of social learning on Chinese farmers’ adoption of green pest control: Mediation by environmental literacy and moderation by market conditions. Environ. Dev. Sustain. 2022, 1–26. [Google Scholar] [CrossRef]
  10. Elahi, E.; Khalid, Z.; Tauni, M.Z.; Zhang, H.; Lirong, X. Extreme weather events risk to crop-production and the adaptation of innovative management strategies to mitigate the risk: A retrospective survey of rural Punjab, Pakistan. Technovation 2022, 117, 102255. [Google Scholar] [CrossRef]
  11. Elahi, E.; Khalid, Z.; Zhang, Z. Understanding farmers’ intention and willingness to install renewable energy technology: A solution to reduce the environmental emissions of agriculture. Appl. Energy 2022, 309, 118459. [Google Scholar] [CrossRef]
  12. Elahi, E.; Khalid, Z. Estimating smart energy inputs packages using hybrid optimisation technique to mitigate environmental emissions of commercial fish farms. Appl. Energy 2022, 326, 119602. [Google Scholar] [CrossRef]
  13. Abbas, A.; Waseem, M.; Ahmad, R.; Khan, K.A.; Zhao, C.; Zhu, J. Sensitivity analysis of greenhouse gas emissions at farm level: Case study of grain and cash crops. Environ. Sci. Pollut. Res. 2022, 29, 82559–82573. [Google Scholar] [CrossRef] [PubMed]
  14. Abbas, A.; Zhao, C.; Ullah, W.; Ahmad, R.; Waseem, M.; Zhu, J. Towards Sustainable Farm Production System: A Case Study of Corn Farming. Sustainability 2021, 13, 9243. [Google Scholar] [CrossRef]
  15. Alwang, J.; Norton, G.; LaRochelle, C. Obstacles to Widespread Diffusion of IPM in Developing Countries: Lessons from the Field. J. Integr. Pest Manag. 2019, 10, 1–8. [Google Scholar] [CrossRef]
  16. Tong, R.; Wang, Y.; Zhu, Y.; Wang, Y. Does the certification of agriculture products promote the adoption of integrated pest management among apple growers in China? Environ. Sci. Pollut. Res. 2022, 29, 29808–29817. [Google Scholar] [CrossRef]
  17. Feder, G.; Just, R.E.; Zilberman, D. Adoption of Agricultural Innovations in Developing Countries: A Survey. Econ. Dev. Cult. Chang. 1985, 33, 255–298. [Google Scholar] [CrossRef] [Green Version]
  18. Mzoughi, N. Farmers adoption of integrated crop protection and organic farming: Do moral and social concerns matter? Ecol. Econ. 2011, 70, 1536–1545. [Google Scholar] [CrossRef]
  19. Lamine, C. Transition pathways towards a robust ecologization of agriculture and the need for system redesign. Cases from organic farming and IPM. J. Rural. Stud. 2011, 27, 209–219. [Google Scholar] [CrossRef]
  20. Kvakkestad, V.; Steiro, A.L.; Vatn, A. Pesticide Policies and Farm Behavior: The Introduction of Regulations for Integrated Pest Management. Agriculture 2021, 11, 828. [Google Scholar] [CrossRef]
  21. Moore, H.E.; Boldero, J.; Moore, H.E.; Boldero, J. Designing Interventions that Last: A Classification of Environmental Behaviors in Relation to the Activities, Costs, and Effort Involved for Adoption and Maintenance. Front. Psychol. 2017, 8, 1874. [Google Scholar] [CrossRef] [PubMed] [Green Version]
  22. Lynne, G.D.; Shonkwiler, J.S.; Rola, L.R. Attitudes and Farmer Conservation Behavior. Am. J. Agric. Econ. 1988, 70, 12–19. [Google Scholar] [CrossRef]
  23. Delaroche, M. Adoption of conservation practices: What have we learned from two decades of social-psychological approaches? Curr. Opin. Environ. Sustain. 2020, 45, 25–35. [Google Scholar] [CrossRef]
  24. Despotović, J.; Rodić, V.; Caracciolo, F. Factors affecting farmers’ adoption of integrated pest management in Serbia: An application of the theory of planned behavior. J. Clean. Prod. 2019, 228, 1196–1205. [Google Scholar] [CrossRef]
  25. Rezaei, R.; Safa, L.; Damalas, C.A.; Ganjkhanloo, M.M. Drivers of farmers’ intention to use integrated pest management: Integrating theory of planned behavior and norm activation model. J. Environ. Manag. 2019, 236, 328–339. [Google Scholar] [CrossRef]
  26. Lou, S.; Zhang, B.; Zhang, D. Foresight from the hometown of green tea in China: Tea farmers’ adoption of pro-green control technology for tea plant pests. J. Clean. Prod. 2021, 320, 128817. [Google Scholar] [CrossRef]
  27. Sharifzadeh, M.S.; Damalas, C.A.; Abdollahzadeh, G.; Ahmadi-Gorgi, H. Predicting adoption of biological control among Iranian rice farmers: An application of the extended technology acceptance model (TAM2). Crop. Prot. 2017, 96, 88–96. [Google Scholar] [CrossRef]
  28. Rezaei, R.; Safa, L.; Ganjkhanloo, M.M. Understanding farmers’ ecological conservation behavior regarding the use of integrated pest management- an application of the technology acceptance model. Glob. Ecol. Conserv. 2020, 22, e00941. [Google Scholar] [CrossRef]
  29. Bagheri, A.; Bondori, A.; Allahyari, M.S.; Surujlal, J. Use of biologic inputs among cereal farmers: Application of technology acceptance model. Environ. Dev. Sustain. 2020, 23, 5165–5181. [Google Scholar] [CrossRef]
  30. Garini, C.; Vanwindekens, F.; Scholberg, J.; Wezel, A.; Groot, J. Drivers of adoption of agroecological practices for winegrowers and influence from policies in the province of Trento, Italy. Land Use Policy 2017, 68, 200–211. [Google Scholar] [CrossRef]
  31. Venkatesh, V.; Morris, M.G.; Davis, G.B.; Davis, F.D. User Acceptance of Information Technology: Toward a Unified View. MIS Q. 2003, 27, 425–478. [Google Scholar] [CrossRef] [Green Version]
  32. Ajzen, I. The Theory of Planned Behavior. Organ. Behav. Hum. Decis. Process. 1991, 50, 179–211. [Google Scholar] [CrossRef]
  33. La Barbera, F.; Ajzen, I. Understanding support for European integration across generations: A study guided by the theory of planned behavior. Eur. J. Psychol. 2020, 16, 437–457. [Google Scholar] [CrossRef]
  34. Fishbein, M.A.; Ajzen, I. Belief, Attitude, Intention and Behaviour: An Introduction to Theory and Research; Addison-Wesley: Boston, MA, USA, 1975. [Google Scholar]
  35. Wauters, E.; Bielders, C.; Poesen, J.; Govers, G.; Mathijs, E. Adoption of soil conservation practices in Belgium: An examination of the theory of planned behaviour in the agri-environmental domain. Land Use Policy 2010, 27, 86–94. [Google Scholar] [CrossRef]
  36. Savari, M.; Gharechaee, H. Application of the extended theory of planned behavior to predict Iranian farmers’ intention for safe use of chemical fertilizers. J. Clean. Prod. 2020, 263, 121512. [Google Scholar] [CrossRef]
  37. Ren, Z.; Zhong, K. Driving mechanism of subjective cognition on farmers’ adoption behavior of straw returning technology: Evidence from rice and wheat producing provinces in China. Front. Psychol. 2022, 13, 922889. [Google Scholar] [CrossRef]
  38. Hyland, J.J.; Heanue, K.; McKillop, J.; Micha, E. Factors underlying farmers’ intentions to adopt best practices: The case of paddock based grazing systems. Agric. Syst. 2018, 162, 97–106. [Google Scholar] [CrossRef]
  39. Yazdanpanah, M.; Hayati, D.; Hochrainer-Stigler, S.; Zamani, G.H. Understanding farmers’ intention and behavior regarding water conservation in the Middle-East and North Africa: A case study in Iran. J. Environ. Manag. 2014, 135, 63–72. [Google Scholar] [CrossRef]
  40. Chepchirchir, F.; Muriithi, B.W.; Langat, J.; Mohamed, S.A.; Ndlela, S.; Khamis, F.M. Knowledge, Attitude, and Practices on Tomato Leaf Miner, Tuta absoluta on Tomato and Potential Demand for Integrated Pest Management among Smallholder Farmers in Kenya and Uganda. Agriculture 2021, 11, 1242. [Google Scholar] [CrossRef]
  41. Ataei, P.; Gholamrezai, S.; Movahedi, R.; Aliabadi, V. An analysis of farmers’ intention to use green pesticides: The application of the extended theory of planned behavior and health belief model. J. Rural. Stud. 2020, 81, 374–384. [Google Scholar] [CrossRef]
  42. Damalas, C.A. Farmers’ intention to reduce pesticide use: The role of perceived risk of loss in the model of the planned behavior theory. Environ. Sci. Pollut. Res. 2021, 28, 35278–35285. [Google Scholar] [CrossRef] [PubMed]
  43. Bagheri, A.; Bondori, A.; Damalas, C.A. Modeling cereal farmers’ intended and actual adoption of integrated crop management (ICM) practices. J. Rural. Stud. 2019, 70, 58–65. [Google Scholar] [CrossRef]
  44. Davis, F.D. Perceived Usefulness, Perceived Ease of Use, and User Acceptance of Information Technology. MIS Q. 1989, 13, 319–340. [Google Scholar] [CrossRef] [Green Version]
  45. Turner, M.; Kitchenham, B.; Brereton, P.; Charters, S.; Budgen, D. Does the technology acceptance model predict actual use? A systematic literature review. Inf. Softw. Technol. 2010, 52, 463–479. [Google Scholar] [CrossRef]
  46. Gefen, D.; Straub, D. The Relative Importance of Perceived Ease of Use in IS Adoption: A Study of E-Commerce Adoption. J. Assoc. Inf. Syst. 2000, 14, 1–30. [Google Scholar] [CrossRef] [Green Version]
  47. Abdollahzadeh, G.; Damalas, C.A.; Sharifzadeh, M.S. Understanding adoption, non-adoption, and discontinuance of biological control in rice fields of northern Iran. Crop. Prot. 2017, 93, 60–68. [Google Scholar] [CrossRef]
  48. Michels, M.; von Hobe, C.-F.; von Ahlefeld, P.J.W.; Musshoff, O. The adoption of drones in German agriculture: A structural equation model. Precis. Agric. 2021, 22, 1728–1748. [Google Scholar] [CrossRef]
  49. Far, S.T.; Rezaei-Moghaddam, K. Determinants of Iranian agricultural consultants’ intentions toward precision agriculture: Integrating innovativeness to the technology acceptance model. J. Saudi Soc. Agric. Sci. 2017, 16, 280–286. [Google Scholar] [CrossRef] [Green Version]
  50. Caffaro, F.; Cremasco, M.M.; Roccato, M.; Cavallo, E. Drivers of farmers’ intention to adopt technological innovations in Italy: The role of information sources, perceived usefulness, and perceived ease of use. J. Rural. Stud. 2020, 76, 264–271. [Google Scholar] [CrossRef]
  51. Gao, Y.; Zhang, X.; Lu, J.; Wu, L.; Yin, S. Adoption behavior of green control techniques by family farms in China: Evidence from 676 family farms in Huang-huai-hai Plain. Crop. Prot. 2017, 99, 76–84. [Google Scholar] [CrossRef]
  52. Rogers, E. Diffusion of Innovations, 3rd ed.; Simon and Schuster: New York, NY, USA, 1983. [Google Scholar]
  53. Moore, G.C.; Benbasat, I. Development of an Instrument to Measure the Perceptions of Adopting an Information Technology Innovation. Inf. Syst. Res. 1991, 2, 192–222. [Google Scholar] [CrossRef] [Green Version]
  54. Adnan, N.; Nordin, S.M.; Bahruddin, M.A.; Tareq, A.H. A state-of-the-art review on facilitating sustainable agriculture through green fertilizer technology adoption: Assessing farmers behavior. Trends Food Sci. Technol. 2019, 86, 439–452. [Google Scholar] [CrossRef]
  55. Makarapong, D.; Tantayanon, S.; Gowanit, C.; Inchaisri, C. Intention to adopt and diffuse innovative ultraviolet light C system to control the growth of microorganisms in raw milk among Thais Dairy Farmers. Anim. Sci. J. 2020, 91, e13375. [Google Scholar] [CrossRef] [PubMed]
  56. Mutahar, A.; Norzaidi, M.; Ramayah, T.; Isaac, O.; Alrajawy, I. Integration of Innovation Diffusion Theory (IDT) and Technology Acceptance Model (TAM) to Understand Mobile Banking Acceptance in Yemen: The Moderating Effect of Income. Int. J. Soft Comput. 2017, 12, 164–177. [Google Scholar] [CrossRef]
  57. Rezaei-Moghaddam, K.; Salehi, S. Agricultural specialists’ intention toward precision agriculture technologies: Integrating innovation characteristics to technology acceptance model. Afr. J. Agric. Res. 2010, 5, 1191–1199. [Google Scholar] [CrossRef]
  58. Haji, L.; Valizadeh, N.; Rezaei-Moghaddam, K.; Hayati, D. Analyzing Iranian Farmers’ Behavioral Intention towards Acceptance of Drip Irrigation Using Extended Technology Acceptance Model. J. Agric. Sci. Technol. 2020, 22, 1177–1190. [Google Scholar]
  59. Venkatesh, V.; Davis, F.D. A Theoretical Extension of the Technology Acceptance Model: Four Longitudinal Field Studies. Manag. Sci. 2000, 46, 186–204. [Google Scholar] [CrossRef] [Green Version]
  60. Peshin, R. Farmers’ adoptability of integrated pest management of cotton revealed by a new methodology. Agron. Sustain. Dev. 2013, 33, 563–572. [Google Scholar] [CrossRef] [Green Version]
  61. Amaro, S.; Duarte, P. An integrative model of consumers’ intentions to purchase travel online. Tour. Manag. 2015, 46, 64–79. [Google Scholar] [CrossRef]
  62. Deci, E.L. Effects of externally mediated rewards on intrinsic motivation. J. Pers. Soc. Psychol. 1971, 18, 105–115. [Google Scholar] [CrossRef]
  63. Ryan, R.M.; Deci, E.L. Self-determination theory and the facilitation of intrinsic motivation, social development, and well-being. Am. Psychol. 2000, 55, 68–78. [Google Scholar] [CrossRef] [PubMed]
  64. Davis, F.D.; Bagozzi, R.P.; Warshaw, P.R. Extrinsic and Intrinsic Motivation to Use Computers in the Workplace1. J. Appl. Soc. Psychol. 1992, 22, 1111–1132. [Google Scholar] [CrossRef]
  65. Remedios, R.; Ritchie, K.; Lieberman, D.A. I used to like it but now I don’t: The effect of the transfer test in Northern Ireland on pupils’ intrinsic motivation. Br. J. Educ. Psychol. 2005, 75, 435–452. [Google Scholar] [CrossRef]
  66. Abdollahzadeh, G.; Sharifzadeh, M.S.; Damalas, C.A. Motivations for adopting biological control among Iranian rice farmers. Crop. Prot. 2016, 80, 42–50. [Google Scholar] [CrossRef]
  67. Greiner, R.; Gregg, D. Farmers’ intrinsic motivations, barriers to the adoption of conservation practices and effectiveness of policy instruments: Empirical evidence from northern Australia. Land Use Policy 2011, 28, 257–265. [Google Scholar] [CrossRef]
  68. Jambo, I.J.; Groot, J.C.; Descheemaeker, K.; Bekunda, M.; Tittonell, P. Motivations for the use of sustainable intensification practices among smallholder farmers in Tanzania and Malawi. NJAS-Wagening. J. Life Sci. 2019, 89, 100306. [Google Scholar] [CrossRef]
  69. Abadi, B. The determinants of cucumber farmers’ pesticide use behavior in central Iran: Implications for the pesticide use management. J. Clean. Prod. 2018, 205, 1069–1081. [Google Scholar] [CrossRef]
  70. Hair, J.F.; Sarstedt, M.; Ringle, C.M.; Mena, J.A. An assessment of the use of partial least squares structural equation modeling in marketing research. J. Acad. Mark. Sci. 2012, 40, 414–433. [Google Scholar] [CrossRef]
  71. Hair, J.F.; Risher, J.J.; Sarstedt, M.; Ringle, C.M. When to use and how to report the results of PLS-SEM. Eur. Bus. Rev. 2019, 31, 2–24. [Google Scholar] [CrossRef]
  72. Bagozzi, R.P.; Yi, Y. On the evaluation of structural equation models. J. Acad. Mark. Sci. 1988, 16, 74–94. [Google Scholar] [CrossRef]
  73. Fornell, C.; Larcker, D.F. Evaluating structural equation models with unobservable variables and measurement error. J. Mark. Res. 1981, 18, 39–50. [Google Scholar] [CrossRef]
  74. Henseler, J.; Ringle, C.M.; Sarstedt, M. A new criterion for assessing discriminant validity in variance-based structural equation modeling. J. Acad. Mark. Sci. 2015, 43, 115–135. [Google Scholar] [CrossRef] [Green Version]
  75. Chin, W.; Cheah, J.-H.; Liu, Y.; Ting, H.; Lim, X.-J.; Cham, T.H. Demystifying the role of causal-predictive modeling using partial least squares structural equation modeling in information systems research. Ind. Manag. Data Syst. 2020, 120, 2161–2209. [Google Scholar] [CrossRef]
  76. Sharma, P.; Sarstedt, M.; Shmueli, G.; Kim, K.H.; Thiele, K.O. PLS-Based Model Selection: The Role of Alternative Explanations in Information Systems Research. J. Assoc. Inf. Syst. 2019, 20, 346–397. [Google Scholar] [CrossRef]
  77. Asante, I.K.; Inkoom, E.W.; Ocran, J.K.; Kyeremateng, E.; Sabari, G.; Odamtten, F.T. Intention of smallholder maize farmers to adopt integrated pest management practices for fall armyworm control in the Upper East region of Ghana. Int. J. Pest Manag. 2023, 1–18. [Google Scholar] [CrossRef]
  78. Savari, M.; Damaneh, H.E.; Cotton, M. Integrating the norm activation model and theory of planned behaviour to investigate farmer pro-environmental behavioural intention. Sci. Rep. 2023, 13, 5584. [Google Scholar] [CrossRef]
  79. Gong, S.; Wang, B.; Yu, Z. Whether the Use of the Internet Can Assist Farmers in Selecting Biopesticides or Not: A Study Based on Evidence from the Largest Rice-Producing Province in China. Sustainability 2022, 14, 16354. [Google Scholar] [CrossRef]
  80. Jin, Y.; Lin, Q.; Mao, S. Tanzanian Farmers’ Intention to Adopt Improved Maize Technology: Analyzing Influencing Factors Using SEM and fsQCA Methods. Agriculture 2022, 12, 1991. [Google Scholar] [CrossRef]
  81. Gao, Y.; Khan, A.A.; Khan, S.U.; Ali, M.A.S.; Huai, J. Investigating the rationale for low-carbon production techniques in agriculture for climate change mitigation and fostering sustainable development via achieving lowcarbon targets. Environ. Sci. Pollut. Res. 2023, 1–19. [Google Scholar] [CrossRef]
  82. Dong, H.; Wang, H.; Han, J. Understanding Ecological Agricultural Technology Adoption in China Using an Integrated Technology Acceptance Model—Theory of Planned Behavior Model. Front. Environ. Sci. 2022, 10, 927668. [Google Scholar] [CrossRef]
  83. Bopp, C.; Engler, A.; Poortvliet, P.M.; Jara-Rojas, R. The role of farmers’ intrinsic motivation in the effectiveness of policy incentives to promote sustainable agricultural practices. J. Environ. Manag. 2019, 244, 320–327. [Google Scholar] [CrossRef] [PubMed]
  84. Adrian, A.M.; Norwood, S.H.; Mask, P.L. Producers’ perceptions and attitudes toward precision agriculture technologies. Comput. Electron. Agric. 2005, 48, 256–271. [Google Scholar] [CrossRef]
Figure 1. Theoretical model. Notes: ATT = Attitude; SN = Subjective norm; PBC = Perceived behavioral control; PU = Perceived usefulness; PEOU = Perceived ease of use; CP = Compatibility; TRI = Trialability; VIS = Visibility; IM = Intrinsic Motivation; AI = Adoption intentions.
Sustainability 15 10822 g001
Figure 2. Path coefficient results of TPB, TAM, IDT, and MM. Notes: ** means p < 0.01, *** means p < 0.001; R2 ≥ 0.75 indicates higher explanatory power, 0.5 ≤ R2 < 0.75 indicates moderate explanatory power, and 0.25 ≤ R2 < 0.5 indicates weaker explanatory power.
Sustainability 15 10822 g002
Figure 3. Path coefficient results of the integrated mode. Notes: ** means p < 0.01, *** means p < 0.001; R2 ≥ 0.75 indicates higher explanatory power, 0.5 ≤ R2 < 0.75 indicates moderate explanatory power, and 0.25 ≤ R2 < 0.5 indicates weaker explanatory power.
Sustainability 15 10822 g003
Table 1. Construct and its indicators.
ConstructMeasurement IndicatorsSources
ATTAdopting GCT can result in economic benefits (ATT1).Abadi [69]
Adopting GCT can reduce environmental pollution (ATT2).
Adopting GCT can promote the sustainable development of agriculture (ATT3).
SNMy family wants to adopt GCT (SN1).Lou et al. [26]
Neighbors and friends want my home to adopt GCT (SN2).
The local government wants my home to adopt GCT (SN3).
Partners want my home to adopt GCT (SN4).
PBCMy home has the knowledge and skills to properly handle problems of GCT (PBC1).Rezaei et al. [25]
My home can afford the cost of adopting GCT (PBC2).
My home has enough time and energy to adopt GCT (PBC3).
PUGCT is better than the direct use of chemical pesticides (PU1).Rezaei et al. [28]
Adopting GCT can improve my family’s health (PU2).
Adopting GCT can improve my home’s soil quality (PU3).
Adopting GCT can get a good reputation in the local community (PU4).
PEOUFor my home, GCT is easy to obtain (PEOU1).Sharifzadeh et al. [27]
For my home, GCT is easy to learn (PEOU2).
For my home, GCT is easy to operate (PEOU3).
CPGCT is suitable for my home’s farmland (CP1).Rezaei et al. [28]
Adopting GCT in line with my home experience and knowledge level (CP2).
Adopting GCT does not conflict with my home’s previous pest control practices (CP3).
GCT is the pest and disease control technology my family wants (CP4).
TRIBefore deciding whether to adopt GCT, my home has the opportunity to try it out (TRI1).Moore and Benbasat [53]
Before deciding whether to adopt GCT, my home can correctly try it (TRI2).
If I am not satisfied after trying GCT, there is no loss to my family if I give up using GCT in the middle (TRI3).
Useful experience can be accumulated by trying GCT (TRI4).
VISThrough the demonstration base, my home can intuitively find the benefits of adopting GCT (VIS1).Sharifzadeh et al. [27]
Through media, my home can learn that GCT is a scientific chemical pesticide alternative technology (VIS2).
Farmers around my home introduce GCT control effect is good (VIS3).
IMAdopting GCT will be fun for me and my home (IM1).Ataei et al. [41]
Adopting GCT will give me and my home a sense of achievement (IM2).
Adopting GCT can expand my home’s social circle and meet more like-minded friends (IM3).
My home is interested in GCT (IM4).
AIMy home intends to adopt GCT (AI1).Lou et al. [26]
My home will recommend GCT to relatives and friends (AI2).
My home will continue to pay attention to GCT (AI3).
Table 2. Social Demographic Characteristics of Farmers.
VariableCategoryPercent %/MeanVariableCategoryPercent %/Mean
Age≤30 years1.9%EducationPrimary school and below29.8%
31~40 years10.9%Secondary39.5%
41~50 years22.1%High school26.5%
51~60 years40.3%Junior college3.3%
≥61 years25.1%College and above0.8%
Years of rice cultivation<3 years0.6%Family annual net income<1 ten thousand CNY31.5%
3~5 years3.6%1~5 ten thousand CNY28.5%
6~10 years26.8%5~10 ten thousand CNY15.7%
11~15 years14.1%10~15 ten thousand CNY4.1%
>15 years55.0%>15 ten thousand CNY20.2%
GenderMale65.2%Rice planting area ≤50 Mu66.0%
Female34.8%>50 Mu34.0%
Have family members served as village cadresYes28.7%Join a cooperativeYes29.8%
No71.3%No70.2%
Joined the rice production base of agricultural enterprisesYes10.8%Number of family workers2.7(mean)
No89.2%
Notes: Mu is the Chinese version of acre, 1 Mu = 666.7 square meters.
Table 3. The reliability of the construct.
ConstructIndicatorsFactor LoadingCACRAVEpMean ± SD
ATTATT10.8860.9050.9400.8400.0003.196 ± 2.310
ATT20.9380.0004.171 ± 1.832
ATT30.9240.0004.315 ± 1.894
SNSN10.9360.9300.9510.8280.0003.577 ± 1.904
SN20.8930.0003.572 ± 1.517
SN30.8680.0004.246 ± 1.796
SN40.9400.0003.395 ± 2.222
PBCPBC10.9460.9380.9610.8900.0003.329 ± 2.210
PBC20.9560.0003.323 ± 2.328
PBC30.9280.0003.718 ± 2.193
PUPU10.9140.9130.9400.7970.0003.539 ± 2.189
PU20.9450.0004.130 ± 1.980
PU30.9400.0004.058 ± 1.888
PU40.7590.0003.727 ± 1.951
PEOUPEOU10.9120.9380.9600.8890.0004.287 ± 2.060
PEOU20.9660.0004.820 ± 1.791
PEOU30.9500.0004.942 ± 1.867
CPCP10.9070.9330.9530.8340.0003.680 ± 1.869
CP20.9440.0003.503 ± 1.778
CP30.8950.0004.130 ± 1.792
CP40.9060.0003.724 ± 1.924
TRITRI10.8330.8800.9180.7360.0002.624 ± 1.860
TRI20.8990.0003.080 ± 1.671
TRI30.8710.0003.478 ± 1.850
TRI40.8270.0004.030 ± 1.778
VISVIS10.9450.9400.9620.8930.0004.169 ± 1.970
VIS20.9480.0004.122 ± 2.060
VIS30.9430.0003.552 ± 2.034
IMIM10.9380.9470.9620.8630.0002.646 ± 1.577
IM20.9460.0002.608 ± 1.652
IM30.9090.0002.959 ± 1.747
IM40.9220.0003.011 ± 1.908
AIAI10.9510.9280.9540.8740.0003.497 ± 2.319
AI20.9540.0003.478 ± 1.927
AI30.8990.0003.873 ± 1.943
Table 4. AVE and correlation coefficient between variables.
AIATTCPIMPBCPEOUPUSNTRIVIS
AI0.935
ATT0.7930.916
CP0.8060.7530.913
IM0.7160.6010.7730.929
PBC0.7440.5670.6680.6370.944
PEOU0.6000.4270.5770.5310.7090.943
PU0.7310.7330.6470.5470.5080.3990.893
SN0.7890.6000.750.7110.6590.5890.5870.910
TRI0.3760.2660.3920.3850.5190.5010.2010.2850.858
VIS0.7760.6830.6760.6330.6380.5120.7090.6680.2510.945
Notes: The diagonal of the matrix is the square root of AVE, and the correlation coefficient is below the diagonal.
Table 5. Heterotrait-Monotrait Ratio.
AIATTCPIMPBCPEOUPUSNTRI
ATT0.849
CP0.8620.807
IM0.760.6330.821
PBC0.7950.5920.7140.676
PEOU0.6390.4440.6170.5630.754
PU0.7870.7890.6980.5890.5450.432
SN0.8370.6280.7990.7540.70.6280.628
TRI0.4110.2760.4280.4170.5680.5530.2170.315
VIS0.8270.7280.7210.6690.6790.5440.760.7070.274
Table 6. Comparison of TPB, TAM, IDT, MM, and the integrated model.
ModelTPBTAMIDTMMIntegrated Model
R20.8180.6490.7820.6780.843
Q20.7050.5590.6740.5840.725
Asymptotically EfficientAIC−610.422−373.811−540.982−405.782−651.925
AICu−606.400−370.798−534.932−402.769−641.785
AICc−246.253−9.699−176.666−41.67−287.171
Asymptotically ConsistentBIC−594.855−362.136−517.632−394.107−613.009
HQ−604.234−369.169−531.7−401.141−636.455
HQc−603.995−369.02−531.219−400.992−635.239
Disclaimer/Publisher’s Note: The statements, opinions and data contained in all publications are solely those of the individual author(s) and contributor(s) and not of MDPI and/or the editor(s). MDPI and/or the editor(s) disclaim responsibility for any injury to people or property resulting from any ideas, methods, instructions or products referred to in the content.

