Review

Development of Large-Scale Tight Gas Sandstone Reservoirs and Recommendations for Stable Production—The Example of the Sulige Gas Field in the Ordos Basin

1
PetroChina Research Institute of Petroleum Exploration & Development, Beijing 100083, China
2
Exploration and Development Research Institute, PetroChina Changqing Oilfield Company, Xi’an 710018, China
*
Author to whom correspondence should be addressed.
Sustainability 2023, 15(13), 9933; https://doi.org/10.3390/su15139933
Submission received: 3 May 2023 / Revised: 11 June 2023 / Accepted: 13 June 2023 / Published: 21 June 2023

Abstract

:
The natural gas reserves and gas recovery rate of tight gas sandstone reservoirs in the Sulige gas field in the Ordos Basin play a crucial role in China’s natural gas industry. This study aims to enhance the stable production time of the gas field by summarizing the geological characteristics of the tight gas sandstone reservoirs in the Sulige gas field, discussing the challenges in the development of the gas field, and providing recommendations for the development of the reservoirs. The results show that the matrix reservoir properties, effective sand body size, and gas-bearing properties of tight sandstone gas reservoirs in the Sulige gas field exhibit strong heterogeneity characteristics, and the western and northern parts of the basin edge are gas-water mixed storage areas. There are obvious differences in gas well production, cumulative production, production decline rate, and single well dynamic control reserves in different regions. The recovery of gas reservoirs is primarily influenced by reservoir quality and development well pattern. Increasing the well density increases from 1.5/km2 to 4/km2 in the gas field enrichment area, can raise the corresponding recovery rate from 26.0% to about 50% under the existing economic and technical conditions. Therefore, ensuring a stable production of the tight gas sandstone reservoirs in this gas field is challenging. To achieve a long-term stable production of the gas field, it is necessary to promote the refined reservoir description technology and improve the production through various measures such as replenishing fractures in wells with depleted fractures, sidetracking horizontal wells, and re-fracturing, thereby improving the reserve utilization degree. Moreover, implementing the negative pressure gas recovery technology as soon as possible can restore the production capacity of near-depletion wells.

1. Introduction

With the acceleration of the transformation of clean and low-carbon energy, China’s natural gas consumption has rapidly increased, making it increasingly challenging to ensure the safety of the natural gas supply. To address this issue, it is urgent to increase the development of domestic natural gas resources and improve production and supply capacity [1]. Strengthening the development and utilization of unconventional natural gas resources is a strategic choice to enhance China’s natural gas supply security. Tight sandstone gas is one of the largest types of unconventional natural gas in China [2]. It has huge resource potential and considerable scale reserves, mainly distributed in Ordos, Sichuan, Songliao, and other basins. The tight sandstone gas resources in the Sulige area of the Ordos Basin (Figure 1) account for 83% of the total natural gas resources in the Ordos Basin [3,4]. However, the Sulige gas field faces significant challenges due to strong reservoir heterogeneity, poor physical properties, large irreducible water saturation, large gas seepage resistance, fast gas well energy depletion, small effective sweep range, and low reserves utilization. The Sulige gas field was discovered in 1996 and put into development in 2005. It is now the largest natural gas field in China in terms of reserves and production. The gas field is located in the northern Ordos Basin, with an exploration area of 5 × 10⁴ km2. The gas field can be divided into three regions: the central region, the eastern region, and the western region. Each region exhibits unique geological characteristics and development status. However, after 20 years of exploration and development, the Sulige gas field faces adverse conditions such as poor reservoir quality, cumulative gas production, and a recovery rate of single wells decreasing year by year. To achieve sustained and stable production, it is urgent to deepen the efficient development theory and innovative development mode of complex tight sandstone gas reservoirs. While the middle and eastern areas of the gas field have achieved economies of scale development, the distribution of remaining reserves is not well understood. The western area presents unique challenges due to the complex relationship between gas and water in the reservoir, leading to common water production and wellbore effusion in the gas wells and a rapid decline of pressure and gas production in the production process. The single well productivity and dynamic reserves are far lower than the average level of the gas field. Therefore, this paper systematically summarizes the geological and gas reservoir engineering knowledge obtained in the development process of tight sandstone gas in the Sulige gas field, identifies the difficult problems faced by the continuous and stable production of the gas field, and proposes development suggestions for the tight sandstone gas reservoir in the gas field.

2. Geological Characteristics

2.1. Tectonic Characteristics

The Ordos Basin can be divided into six first-order tectonic units: Yimeng uplift, Weibei uplift, Jinxi flexural fold belt, Yishan slope, Tianhuan depression, and western margin thrust belt. The main body of the Sulige gas field is located northwest of the Yishan slope. The whole gas field is a monocline inclined to the southwest, and the dip angle is less than 1°. Multiple NE-trending nasal uplifts are developed on the monocline, with a width of 5–8 km, a length of 10–35 km, and a fluctuation range of 10–25 m. The low nose uplift structure has no control effect on natural gas accumulation, and the distribution of natural gas is mainly controlled by sand bodies and physical properties. The He-8 and Shan-1 members are mainly braided river sediments, and the sand bodies have good continuity. Coarse lithofacies are developed in the central bank and the bottom of the channel, and the effective sandstone accounts for about 30% of the thickness of the sandstone, showing a sand-in-sand structure [5]. The effective sandstones are lenticular, with poor continuity, and are distributed in all vertical layers, without a dominant layer. Only the lower He-8 member has slightly better tectonic characteristics.

2.2. Matrix Reservoir Characteristics

The sandstone in the He-8 member is similar to that in the Shan-1 member in terms of composition, which mainly consists of lithic quartz sandstone and quartz sandstone, with a small amount of lithic sandstone [6,7]. The sandstone has a large grain size, which is between 0.2–1 mm. The rock types are mainly coarse sandstone, medium-coarse sandstone, a small amount of gravel-bearing coarse sandstone, and medium-fine sandstone. The reservoirs have the characteristics of low porosity and low permeability.
Gas fields have a wide range, and there are great differences in rock composition, composition maturity, and diagenesis between different gas regions, resulting in varying petrophysical properties of the reservoirs. The central and eastern regions have higher permeability. From the perspective of the median porosity, the eastern region has the largest porosity (7.9%), followed by the middle region and the western region. From the perspective of the median permeability, the reservoirs in the middle region have the largest permeability (0.26 mD) where the proportion of samples with ≥0.5 mD is the highest at 30.85% (Table 1) [8].

2.3. Scale Characteristics of Effective Sand Bodies

The effective sand body of the reservoir is small and scattered, and the multi-layer superposition is distributed throughout the whole area. The drilling rate of the layered effective sand body is about 40%, and the combined layer is close to 100%. The middle area of the gas field is the most developed, followed by the east area, and the west area is obviously worse. Through the dynamic and static angles of the dense well pattern data in the whole area, the effective sand body scale of the Sulige gas field is analyzed and demonstrated using field outcrop observation and measurement, fine geological anatomy, unstable well test boundary interpretation, and production dynamic discharge radius analysis. Field outcrop observation is to select reservoir sedimentary outcrops, carry out two-dimensional or three-dimensional measurements and a description of sand bodies, establish an outcrop geological knowledge base, and predict the scale of effective sand bodies in gas fields. For example, the Williams Fork Formation in the South Piceance Basin develops lenticular dense sand bodies. The distribution model of a single sand body of a meandering river point bar is established by using outcrop data, which provides a basis for well-spacing optimization [9]. The fine core description is an important means of effective single sand body thickness analysis. Based on the calibration of the rock–electric relationship, combined with logging data, the effective single sand body thickness of non-coring wells is dissected. Dynamic drainage radius analysis is to analyze the range of deflation by studying pressure and yield data during development (Figure 2). By selecting gas wells with a production time of more than 50 days and basically reaching a quasi-steady state, using pressure and production data, on the basis of comprehensive consideration of artificial fractures, reservoir physical properties and other parameters, the important indexes such as gas well pressure relief range, produced reserves and final cumulative production of gas wells are fitted and determined, and the distribution frequency of gas well pressure relief range is statistically analyzed. The commonly used methods are Blasingame and flow material balance. Unstable well test boundary interpretation (Figure 3) is a kind of seepage mechanics as the foundation, using a high precision pressure gauge and other test instruments to carry out oil and gas well production performance and shut-in recovery data test and research, determine the oil and gas reservoir physical parameters, wellbore and engineering fracturing parameters, and determine the oil and gas well pressure relief boundary distance and geometry of the most scientific and effective method. By optimizing the reservoir model, wellbore and engineering parameter model, and control boundary model, the pressure, pressure derivative double logarithmic curve, pressure semi-logarithmic curve, and pressure change history of oil and gas well test pressure data are comprehensively analyzed and fitted. The types of oil and gas reservoirs and different flow stages, including wellbore storage, near-well artificial fractures, far-well matrix, and boundary control, are distinguished and identified, and the characteristic parameters of each flow stage are obtained. According to the four methods, the width of the effective sand body in the gas field is 452~650 m, and the length is 678~1000 m [10]. In general, from north to south, the thickness of the sand body gradually becomes thinner, the scale of sand body development gradually becomes smaller, and the reservoir heterogeneity gradually becomes worse.

2.4. Characteristics of Gas–Water Relationship

The upper Paleozoic reservoirs in the Sulige gas field contain gas in multiple layers. Influenced by multiple factors such as hydrocarbon generation intensity and regional structure, the gaseous properties of reservoirs in different layers and regions are quite different. The western region near the edge of the Ordos Basin and the northern part of the eastern region have mixed gas–water, with gas saturation of 46.4% and 44.9%, respectively. The effect of hydrocarbon generation intensity and reservoir heterogeneity on the distribution of gas and water in this area was analyzed based on comprehensive static geological characteristics and dynamic response of production, as demonstrated in Figure 4. The results show that the gas–water distribution is mainly controlled by fracture, reservoir physical properties, and micro-amplitude structure. The better the reservoir’s physical properties, the better the gas content; the reservoirs in the middle and high parts of the micro-amplitude structure generally have good gas-bearing properties in the lower parts. The nose structure is developed in the Sulige gas field, and the nose uplift becomes the priority target for well deployment. For the superimposed development area of multiple sets of gas-bearing strata in the longitudinal direction, if there is a stable mudstone interlayer between the gas-bearing strata, it is shown as ‘lower gas and upper water’. The gas-bearing property of the lower strata is obviously better than that of the upper strata. Logging interpretation results show that the lower strata are mostly gas reservoirs, and the upper strata are mostly gas–water reservoirs and gas–water reservoirs. If there is no stable mudstone interlayer between each layer or there is a tensile fracture around it, it is shown as ‘upper gas and lower water’, and the gas content of the lower layer is worse than that of the upper layer (Figure 4).

3. Characteristics and Challenges of Gas Field Development

3.1. Gas Recovery Indices

The reservoirs in the Sulige gas field have poor petrophysical properties, strong heterogeneity, high irreducible water saturation, large gas seepage resistance, rapid gas well energy depletion, small effective scope, and low reserve utilization degree [11,12,13]. Due to the characteristics of the reservoir, the pressure and yield of gas wells decrease rapidly initially and then become stable in the later stage. As shown in Figure 5, after 1–2 years of production, the gas well has maintained a low-pressure production state of 6 Mpa.
The characteristics of gas production in each region of the Sulige gas field are significantly different (Figure 6). The effective sand bodies in the central region have large thicknesses, large quantities, and large scope, which provide a favorable material basis for pressure retention and gas supply. The gas wells have high yields, and the yield per unit pressure drop is large. In the first three years, the average daily production of a single well was 11,000 m3, and the average cumulative production of a single well was 18.1329 million m3.
In the eastern region, the effective sand bodies have small thicknesses and quantities, and limited scope. Gas wells generally have the characteristics of pressure drop in the early stage, low production in the later stage, and low gas recovery per unit pressure drop. In the first three years, the average daily yield of a single well was 9600 m3, and the average cumulative production of a single well was 11.5122 million m3.
In the western region, due to the large water saturation in the effective reservoir and the mixed distribution of gas and water layers (Figure 7), both gas and water were produced after the reservoir was hydraulically fractured, and there was basically no water-free gas production period. The gas production rate declined rapidly, and the water–gas ratio increased, resulting in low cumulative production. In the first three years, the average daily yield of a single well was only 8000 m3, and the average cumulative production was 10.227 million m3. The proportion of low-yield and low-efficiency wells was over 60%, and even as high as 80% in the Su 120 area, where the average water–gas ratio reached 1.4 m3/104 m3.

3.2. Single Well Production Decline Rate

As shown in Figure 8, the gas wells in the gas field show depleting decline characteristics. The production decline rates of vertical wells in the first 3 years were 25.9%, 23%, and 20.6%, which gradually decreased to 10% in the later stage. The average annual decline rate for an 11-year production period was 17.1%. The decline rates of horizontal wells in the first three years were 34.51%, 28.08%, and 23.45%, which gradually decreased to about 14% in the later stage. Due to the differences in reservoir quality, the decline rates in different regions are greatly different. Due to water production in the western region and tight reservoirs in the eastern region, their decline rates were both higher than that in the central region.

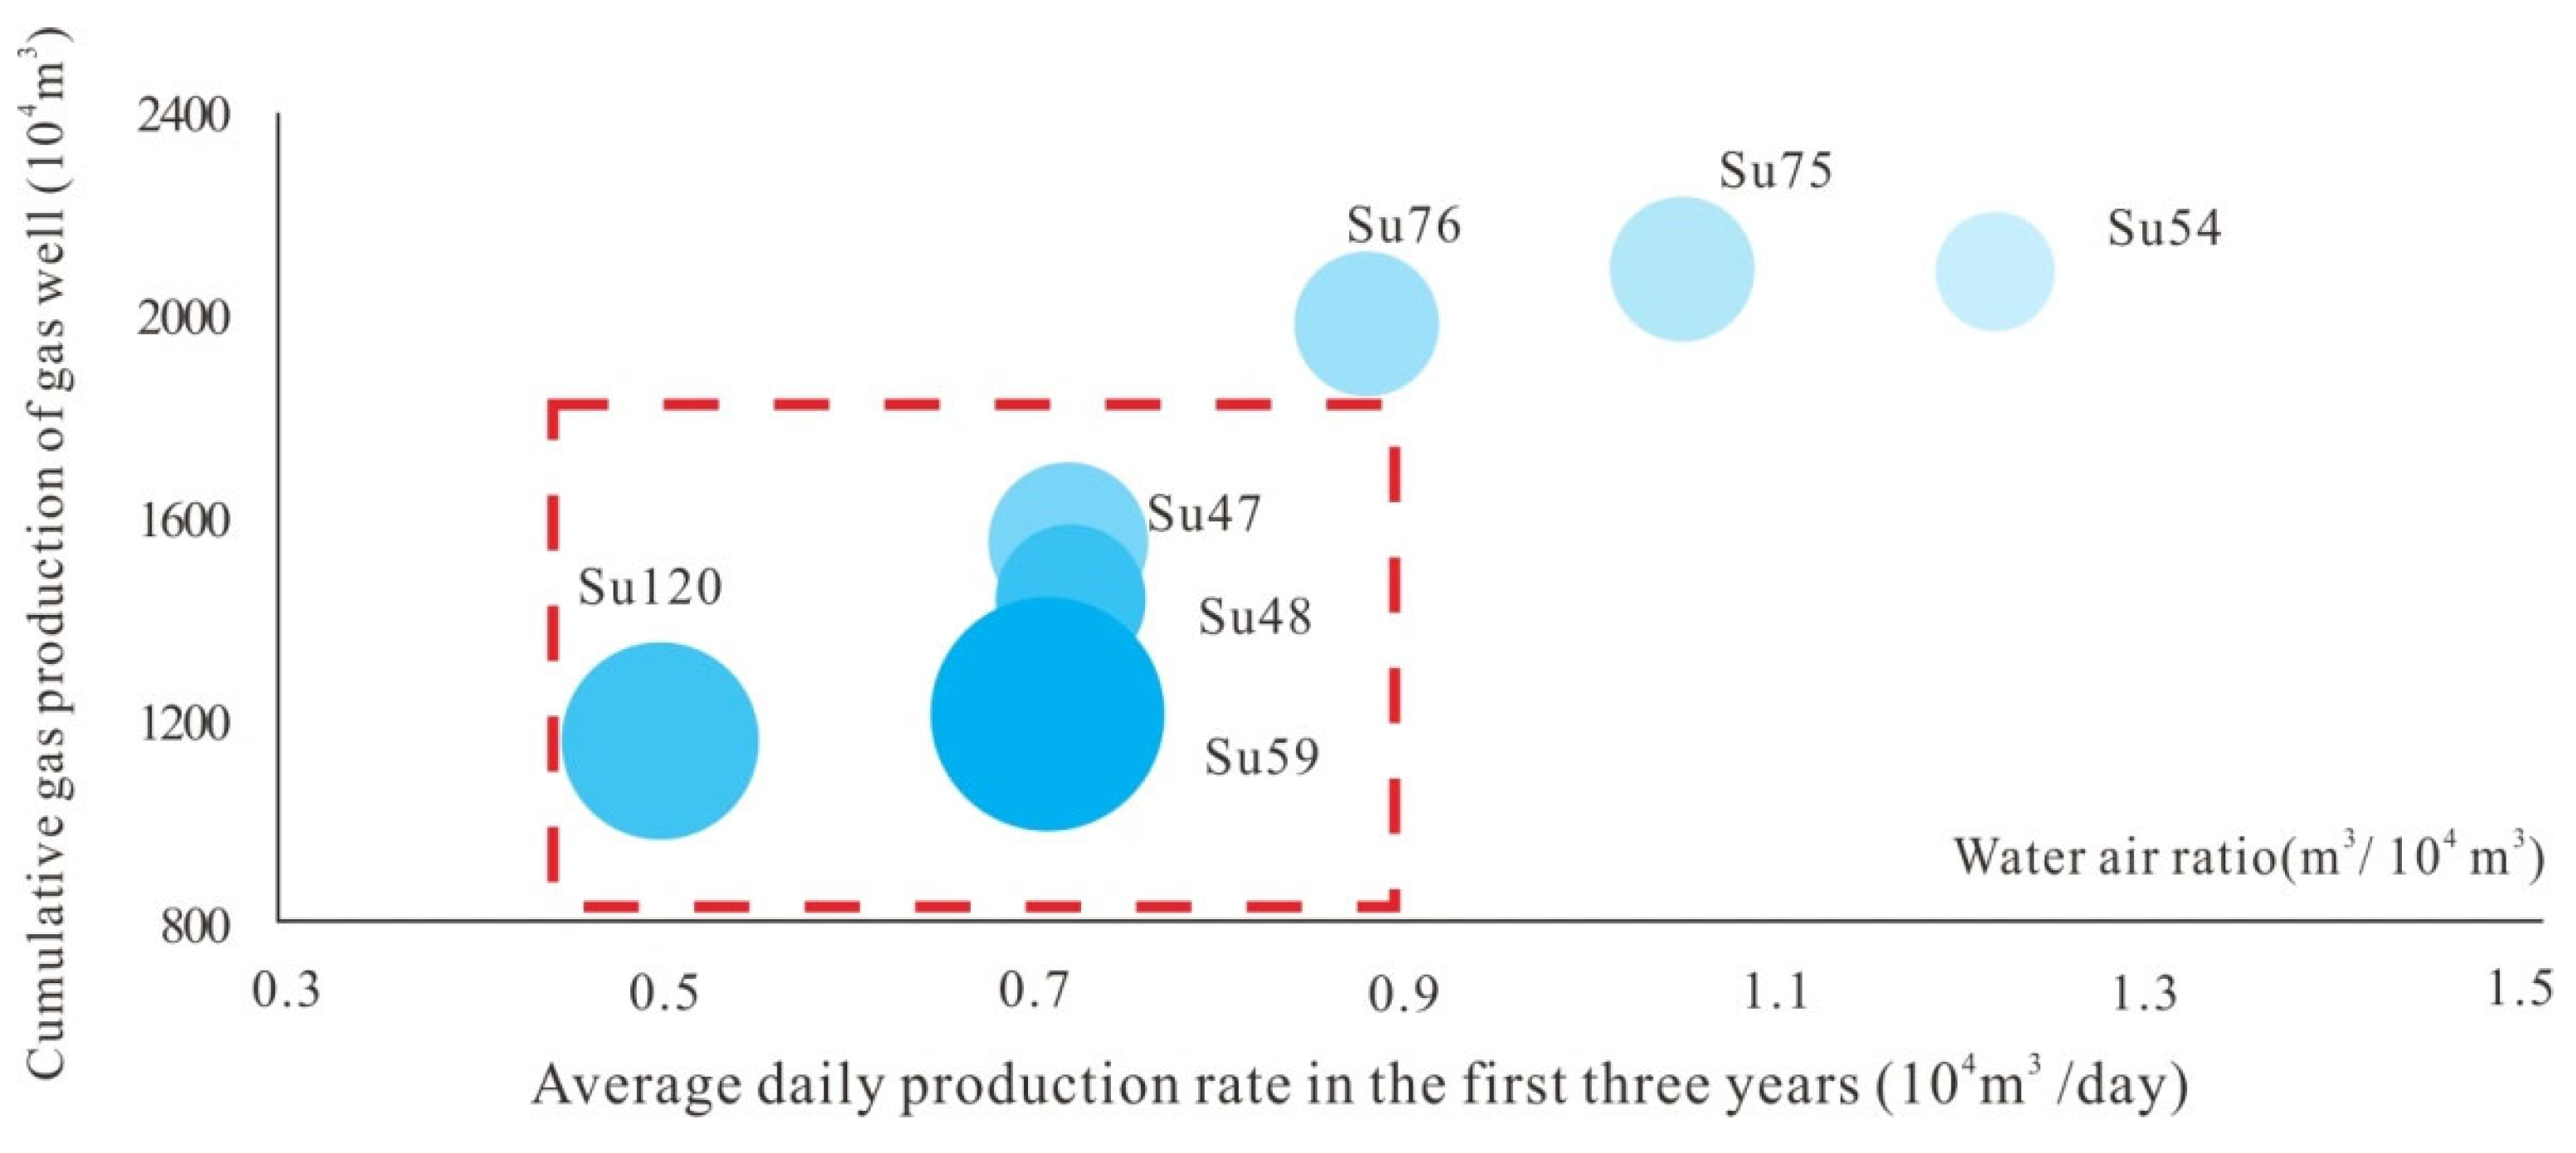
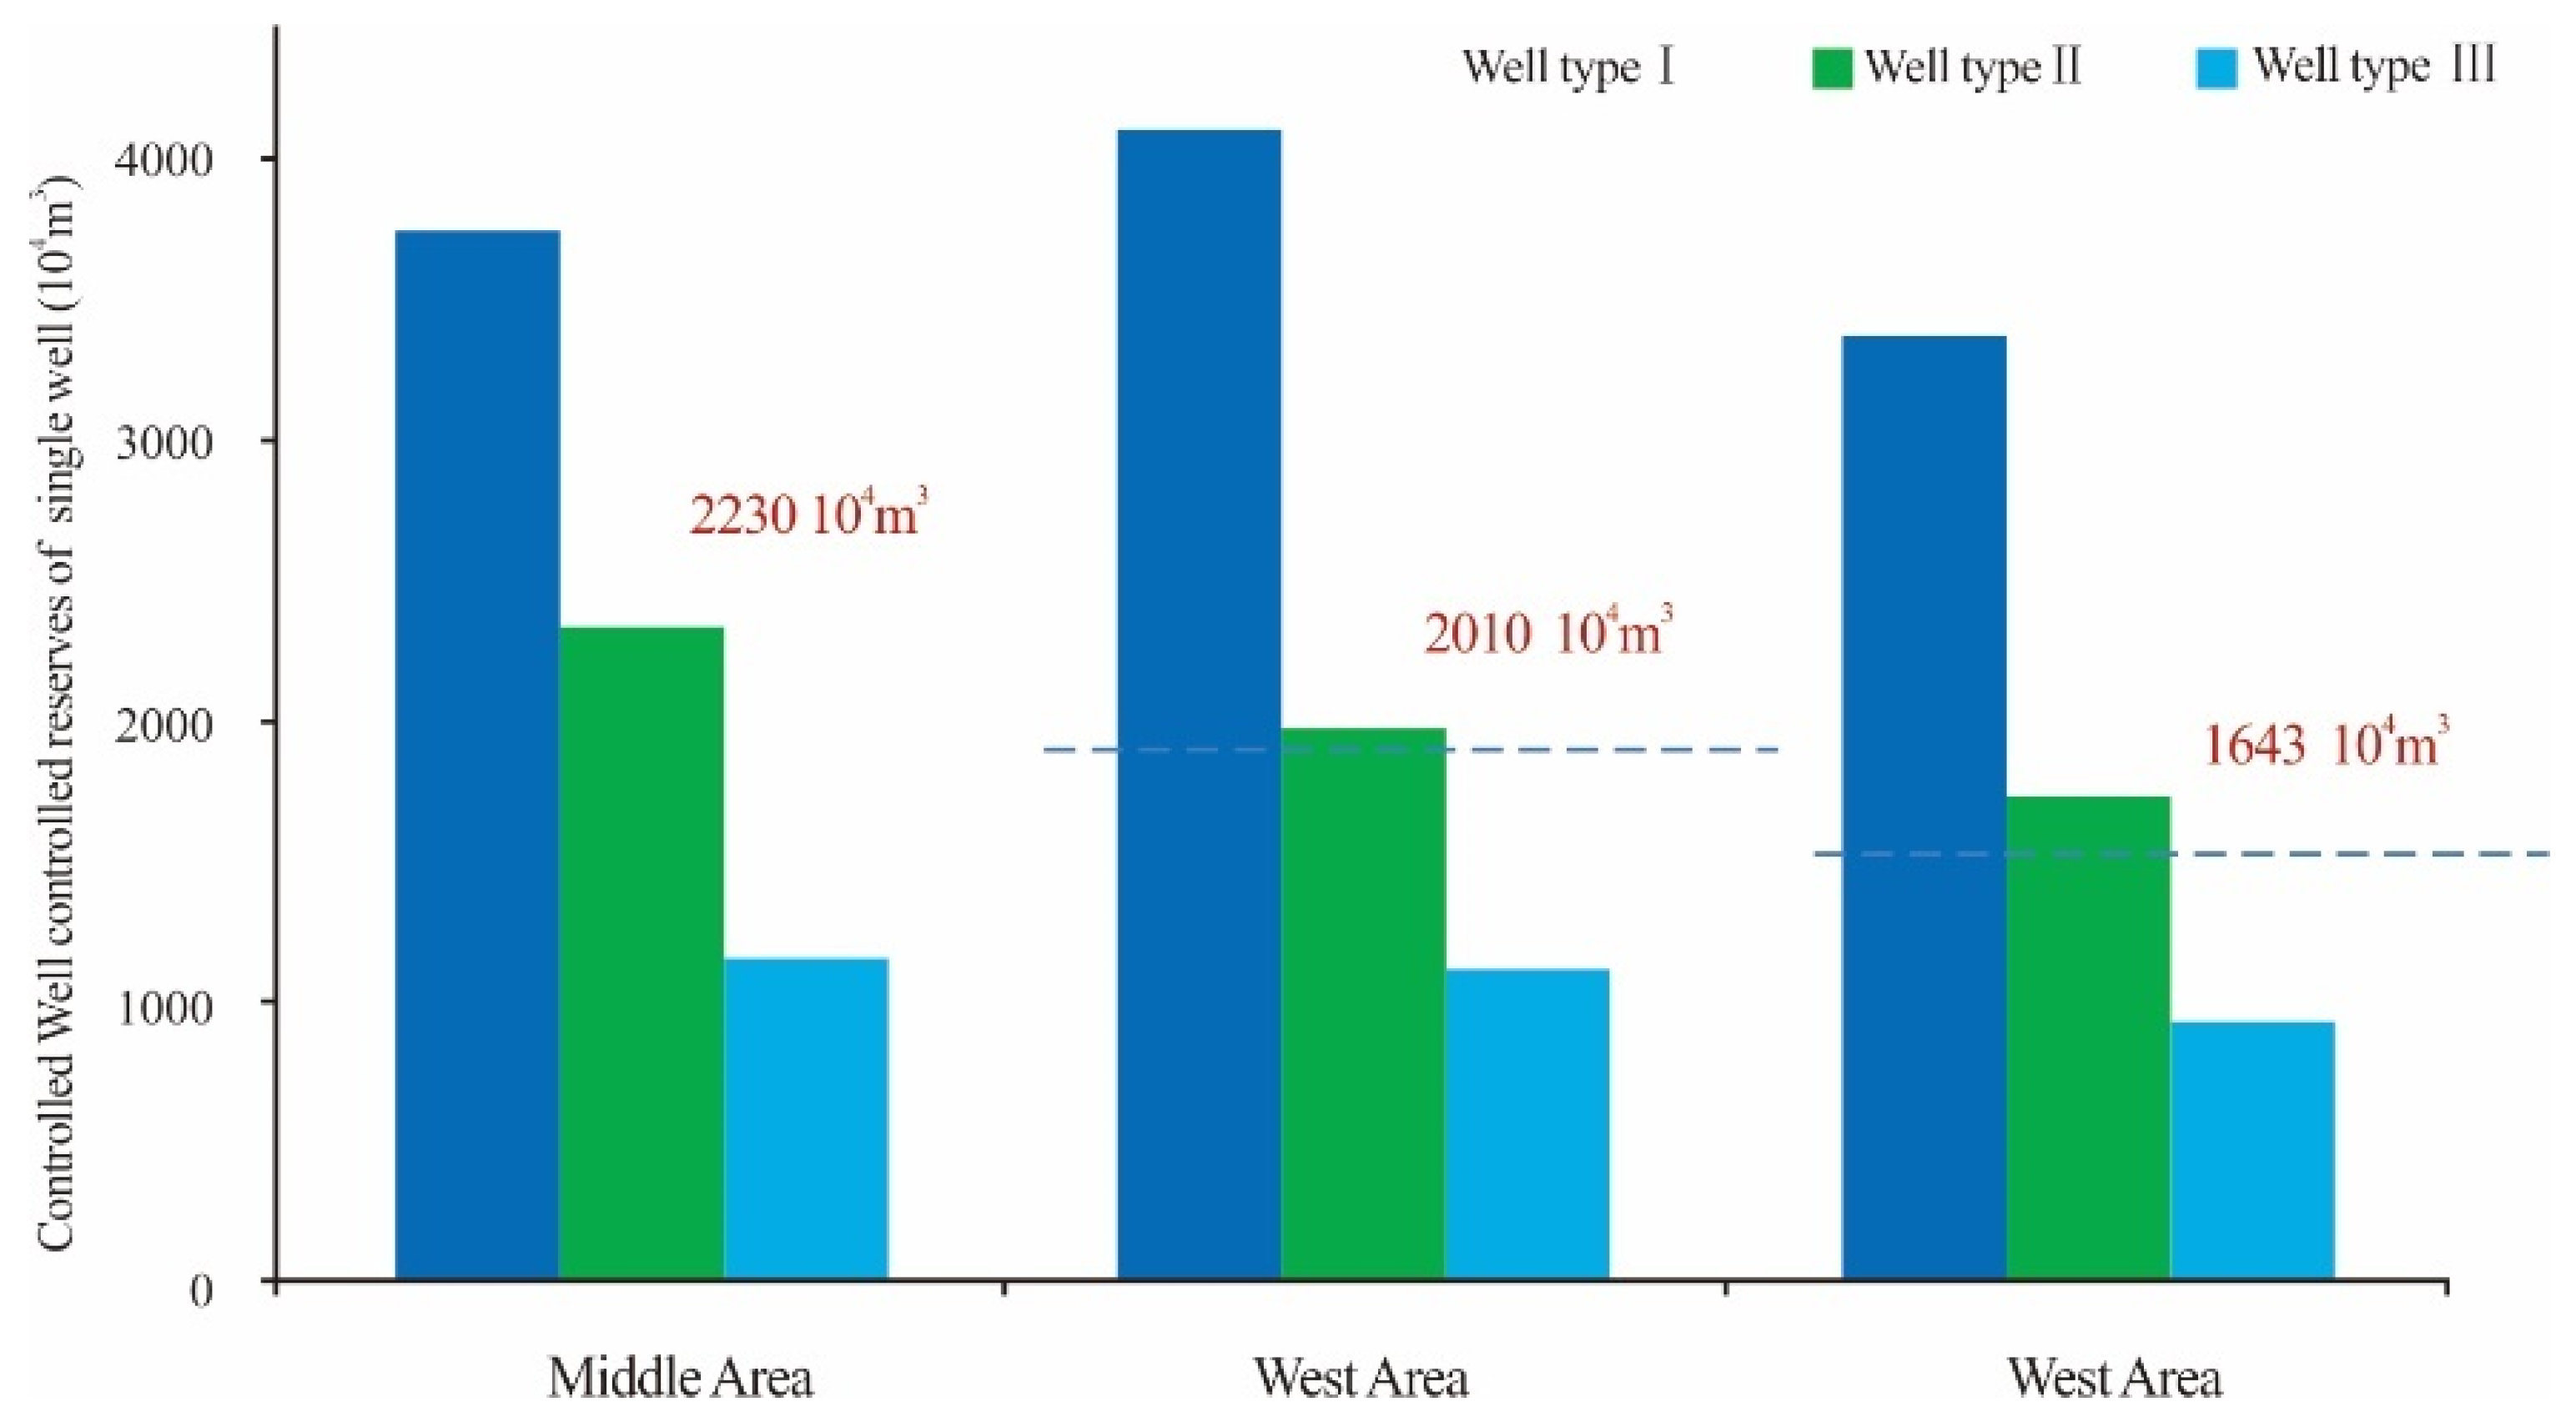
3.3. Dynamically Controlled Reserves of Single Wells

Currently, the prediction of controlled dynamic reserves in the Sulige gas field is generally carried out using the rate transient analysis method [14]. In this method, the geological characteristics of the reservoir and the dynamic well data are mainly used to analyze the controlled reserves and reserve utilization degree of the gas well. It should be noted that the method requires the gas well seepage to be in a quasi-steady state as controlled by the boundary. In this study, the dynamic data of more than 2500 wells that have been produced for at least three years in different regions of the Sulige gas field were selected for analysis. After obtaining the geological characteristics of the reservoir, a mathematical model was established based on relevant parameters such as seepage boundary, skin factor, and artificial fracture half-length, which were used to fit historical production data (e.g., production rate and bottom-hole pressure), such that the results of the numerical model were consistent with the actual production data, thereby determining the controlled dynamic reserves of the gas wells (Figure 9). Gas wells in tight gas reservoirs are usually put into production after hydraulic fracturing. Current evaluation methods taking into account fracturing include four typical methods, namely, the Blasingame method, normalized pressure integral method (NPI), Agarwal–Gardner method (AG), and rate transient analysis (RTA), as well as analytical models established through the consideration of pressure history. At present, these four evaluation methods have been embedded into the mature commercial software HIS Harmony 2018, which can be used to obtain the bottomhole flow pressure of the gas well through the wellhead pressure and daily gas production of the gas well, and combining the attribute parameters of the reservoir and fluid (such as permeability, gas saturation, gas compressibility factor and other attribute parameters obtained in laboratory and field). The dynamic controlled reserves of gas wells can be obtained by matching the bottomhole flowing pressure of gas wells.
Through numerical model calculation and curve fitting, it was finally determined that the single well controlled dynamic reserves of the gas field are 22.3 million m3 in the central region, 20.1 million m3 in the eastern region, and 16.43 million m3 in the western region (Figure 10).

4. Gas Reservoir Development Status and Challenges for Sustainable and Stable Production

4.1. High-Quality Reservoirs

The high-energy superimposed channel in the central region of the Sulige gas field has been almost excavated, and the target of development has shifted to the low-energy superimposed channel and the channel–bay transition region. From 2006 to 2010, the number of completed wells that were drilled through high-energy superimposed channels accounted for 32.3%. This number has decreased by 13.5% to only 18.8% from 2016 to 2020. In comparison, the number of completed wells that penetrated the low-energy superimposed channels increased by 9.2%, and the number penetrating the channel–bay transition region increased by 5.2%. In the central region, 85% of the remaining reserves are located in the low-energy superimposed channels and the channel–bay transition region.
In the peripheral areas such as the northern part of the eastern region and the western region, the geological conditions of the reservoirs also deteriorated year by year, which mainly manifested in the decrease in the thickness of dominant reservoirs and the decrease in gas saturation. According to the statistics of reservoirs penetrated by completed wells, the proportion of wells penetrating Type I reservoirs decreased year by year, while the number of wells that penetrated Type II reservoirs did not change; yet, the gas saturation of such reservoirs still declined significantly.

4.2. Comparison of Recovery Indices between New and Old Wells

Taking the gas wells in the central region of the Sulige gas field that were in production for at least three years as an example, the cumulative production of the gas wells was predicted by the production decline curve and the rate transient analysis method. The gas production in the first three years of the gas wells that were put into production between 2006 and 2010 was more than 1000 × 104 m3 (average: 1200 × 104 m3), and the predicted final cumulative production was over 2200 × 104 m3 (average: 2600 × 104 m3). For the wells that started production between 2011 and 2016, the cumulative production in the first 3 years was on average 1010 × 104 m3, and the predicted final cumulative production was between 1600 × 104 and 2100 × 104 m3, with an average of 1820 × 104 m3. In summary, the cumulative production in the first three years and the predicted final cumulative production of gas wells put into production prior to 2011 were relatively high compared to those put into production after 2011.
The main reason for the decline in the cumulative production of gas wells is the deterioration of reservoir geological conditions. Before 2010, the reserve abundance in the area was 1.65 × 10⁸ m3/km2, and after 2011, it dropped to 1.33 × 10⁸ m3/km2. A secondary reason is inter-well interference. For example, in the horizontal wells, the skeleton wells (the vertical wells deployed before the horizontal wells are used to determine the petrophysical properties and gaseous properties of the reservoir) are only 350–400 m away from the target point of the horizontal well; that is, there is obvious interference between the wells. Compared with non-skeleton wells, the final cumulative production of skeleton wells was 18–35% lower. After increasing the well density in the block from 2 wells/km2 to 4 wells/km2, the final cumulative production of the later-drilled infill wells decreased by 10–23% compared to that of the initial wells. Therefore, it is foreseeable that as the development continues, the final cumulative production of subsequent wells will continue to decline.

4.3. The Gas–Water Relationship in the Reserve Replacement Area

The western region of the Sulige gas field is a key reserve replacement area for subsequent stable production. The region is close to the gas reservoir boundary and is located in the gas–water transition zone. The low hydrocarbon generation intensity results in an incomplete displacement of the original formation water in the process of natural gas migration and accumulation. In most of the reservoirs, gas, and water coexist in the same layer, and the gas layers are relatively poorly developed and limited in distribution. The degree of natural gas saturation and enrichment is low, resulting in large water saturation in the effective reservoir. Some gas layers have low resistivity, and during production, there is often gas–water co-production and wellbore fluid accumulation, which is very different from the common gas layers that have high resistivity and no water production. Through the intersection analysis of resistivity–acoustic wave and resistivity–density, it was found that the resistivity of the effective reservoir is between 10 and 100 Ωm, the time difference between acoustic waves is between 210–250 μs/m, and the density is 2.4–2.6 g/cm3. Thus, it is difficult to distinguish the gas layer, the gas–water layer, and the gaseous layer.
Due to the large water saturation in the effective reservoir and the mixed distribution of gas and water layers, gas wells usually produce both gas and water after the reservoir is fractured. There is basically no water-free gas recovery period. Gas production declines rapidly, and the water–gas ratio increases accordingly, resulting in low cumulative production. The average water-to-gas ratio in the western area of the Sulige gas field is 0.68 m3/104 m3. In the three developed wells, i.e., Su 47, Su 48, and Su 120, the gas production is severely affected by water production, and the proportion of low-yield and low-efficiency wells is higher than 60% and even reached 80% in the Su 120 well block. The average daily gas production per well of 11 of the 15 stations in the three well blocks is less than 1 × 10⁴ m3, and the average water–gas ratio is 1.4 m3/104 m3.

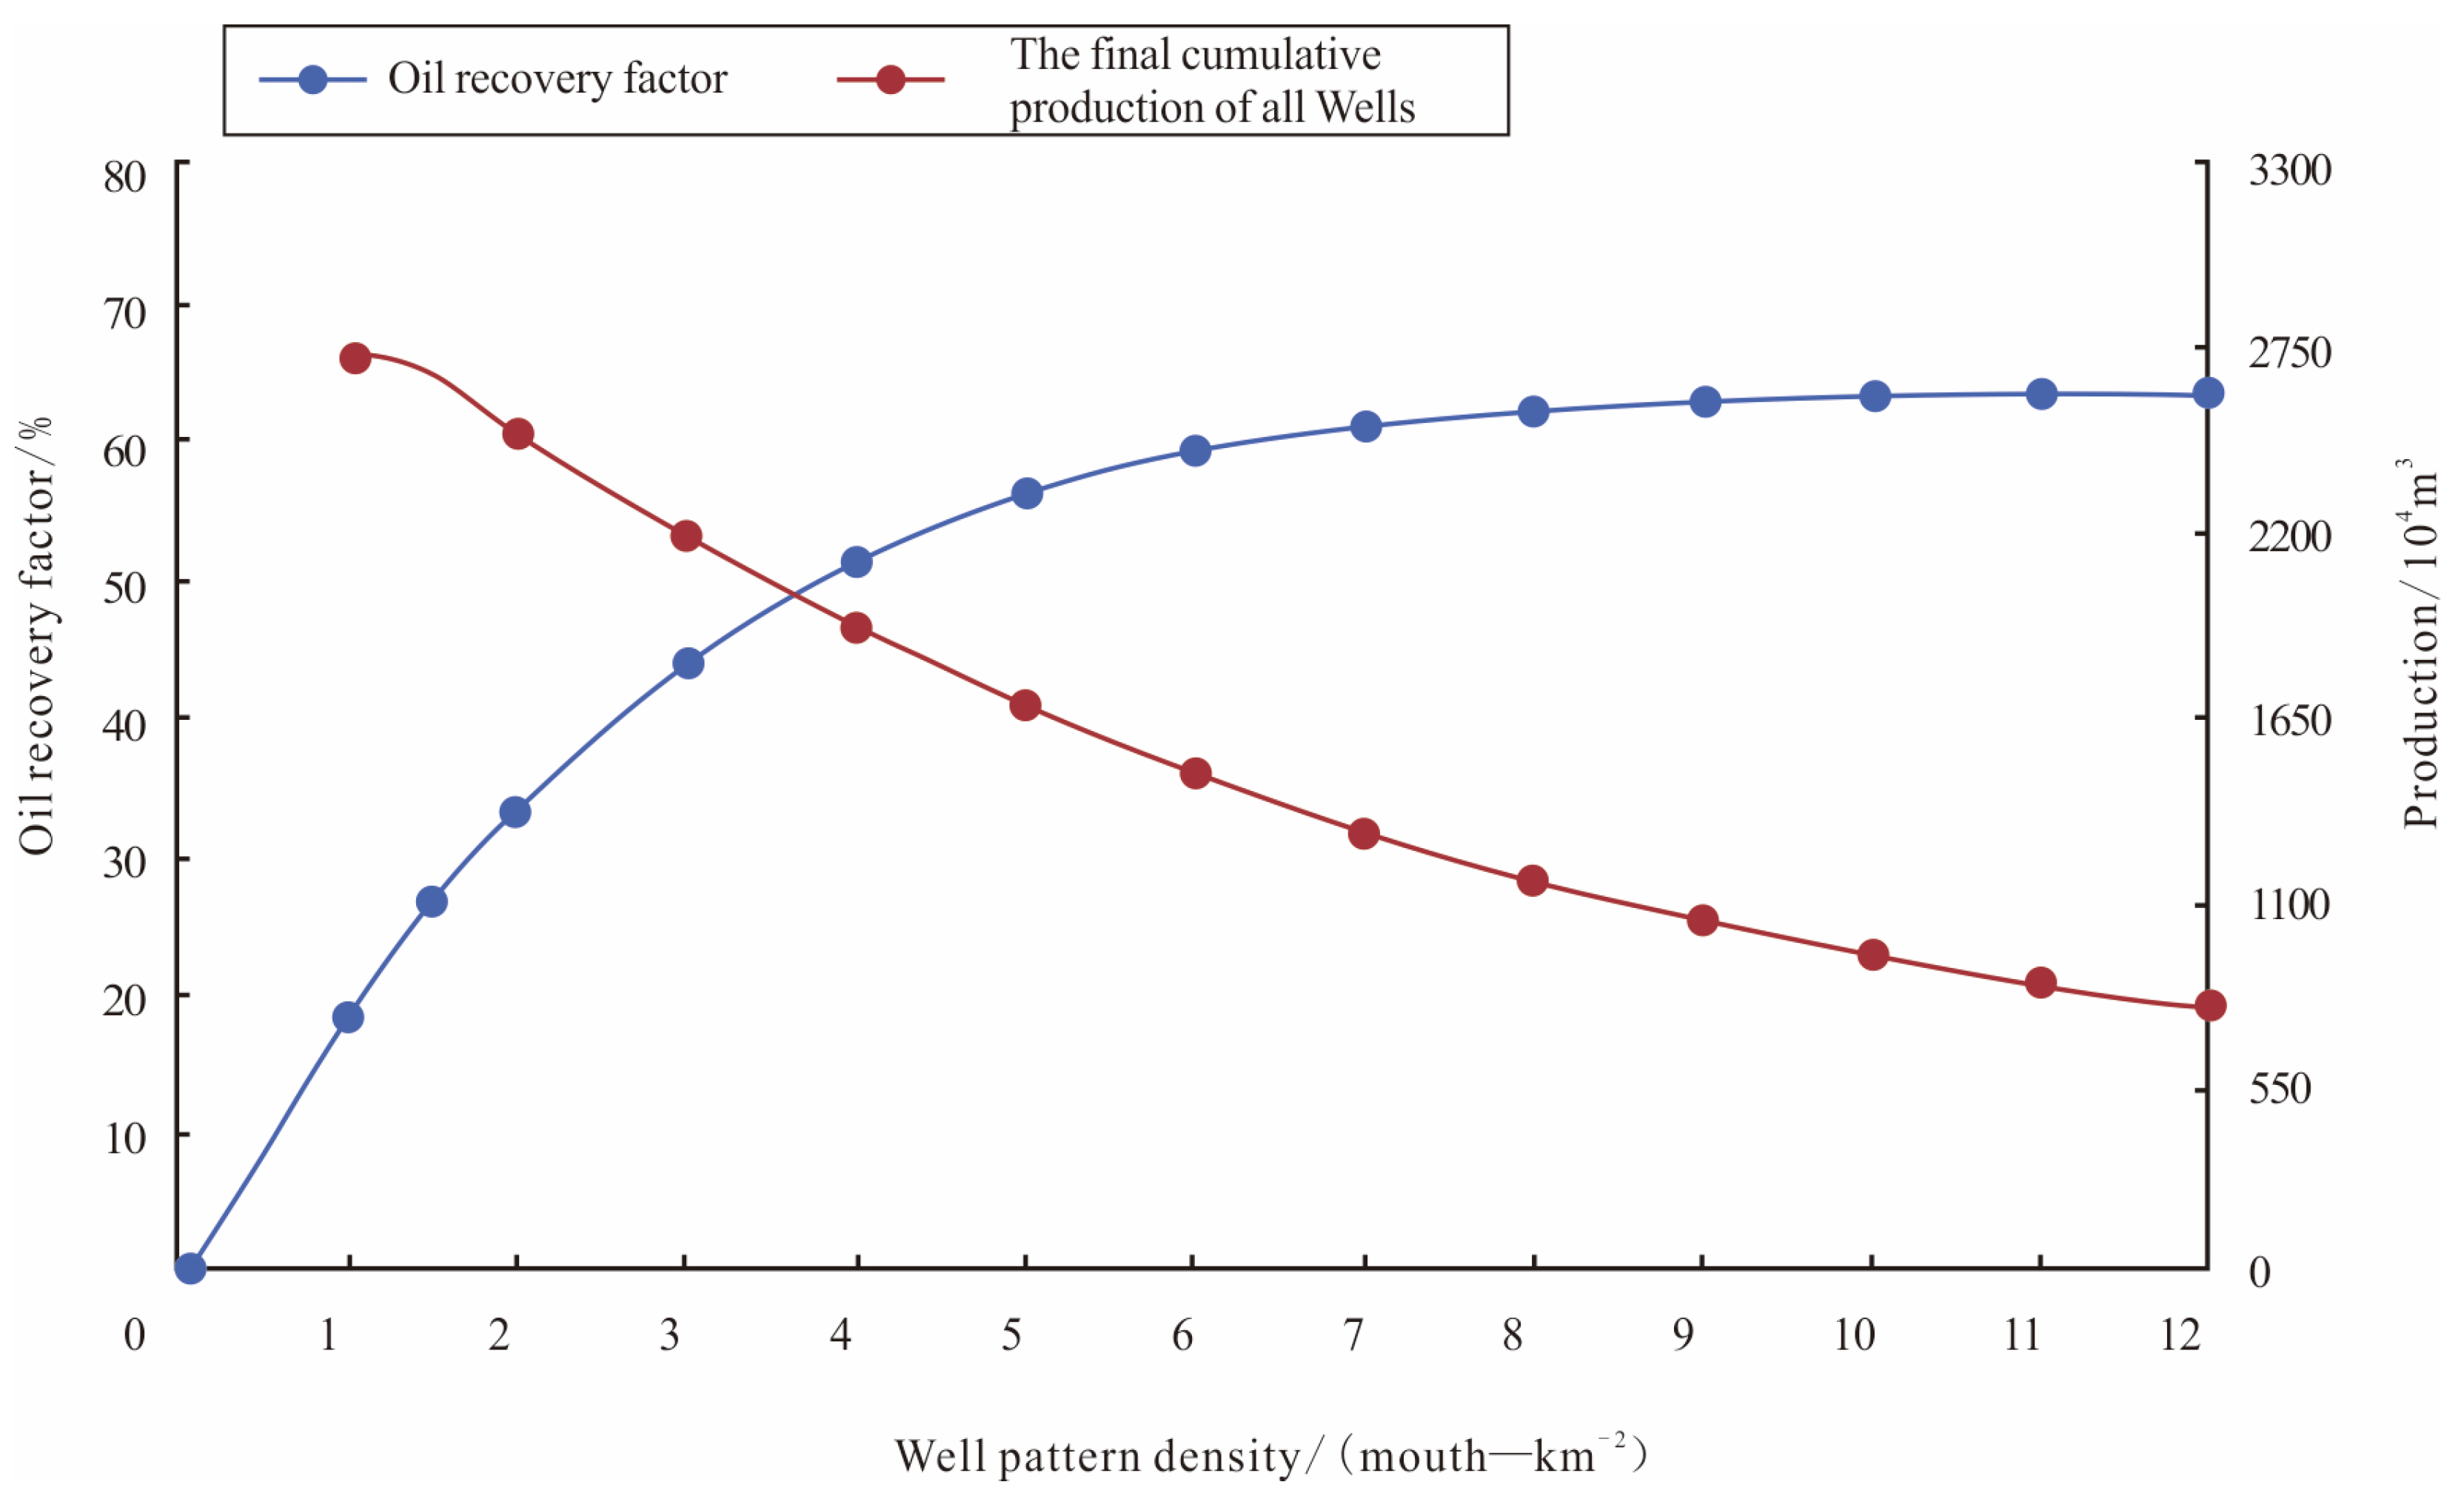
4.4. Dense Well Pattern Is an Effective Way to Improve the Recovery of Tight Sandstone Gas Reservoirs

The Sulige gas field has implemented a pilot test area of a dense well pattern in the middle area, and the geological conditions of the test area are relatively good [15,16]. The average porosity of the reservoir is 10%, the average permeability is 0.55 mD, the average effective reservoir thickness is 7.0 m, and the average gas saturation is 64.8%. Through geological anatomy and inter-well interference test, the variation law of interference probability and cumulative gas production of a single well is statistically analyzed. The relationship between well pattern density and interference probability, recovery rate, and yield rate in the middle area of the Sulige gas field is established by taking into account economic evaluation. The well spacing/row spacing of the vertical well pattern is optimized from 600 m/1200 m to 500 m/650 m, and the well pattern density is increased from 1.5 wells/km2 to 4 wells/km2. This optimization leads to a corresponding increase in recovery rate from 26.0% to 50% (Figure 11), which provides a basis for the deployment of a large well group and multi-well type combinations. From the perspective of implementation effect, the well spacing/row spacing is 500 m/650 m in the test area, and the predicted recovery rate has achieved the expected effect; however, the one-time overall deployment has significantly reduced the proportion of high-yield gas wells, which needs to be taken into account for future deployment.

5. Recommendations for Achieving Stable Production

5.1. Dynamic–Static Refined Reservoir Description Technology

Because of the well pattern and the heterogeneity of the reservoir, the Sulige gas field has seriously fragmented reserves. To achieve long-term stable production, it is critical to obtain the spatial distribution characteristics of the remaining reserves. Accurate evaluation of the remaining reserves requires research from the following three aspects [17,18,19,20].
According to the effective single sand body scale width range of 452~650 m, length range of 678~1000 m, set up 600 m × 800 m main development well pattern. Carry out fine division and comparison of sublayers; the sublayer division should reach the single sand body level. Existing drilling and logging data, especially horizontal well logging while drilling data should be fully utilized to finely characterize the sublayers.
Based on the effective sand bodies of the sublayers, understand the changes in reservoir porosity and gas saturation, and recalculate the reserves of each sublayer.
Establish the evaluation standard for the drainage radius. Fully utilize the static and dynamic data of single-layer wells and the gas production profile of multi-layer wells, establish the relationship between the static parameters and the drainage radius, and then determine the degree of reserve utilization according to the reconstruction scale.
Preliminary development practice shows that vertical/directional wells are conducive to the effective production of vertical multi-layer reserves, while horizontal wells are conducive to the effective production of single-layer reserves. Based on the refined reservoir description, taking the well block as a unit, the vertical/directional well targets, horizontal well trajectory, and length could be optimized to achieve reserve control, maximize the yield and recovery factor of well blocks, and improve the development of tight gas sandstone reservoirs.

5.2. Low-Cost Reserve Utilization Technology

In the Sulige gas field, different measures have been implemented to utilize remaining reserves, such as replenishing fractures in wells with depleted fractures, sidetracking horizontal wells, and re-fracturing, which have yielded promising results. In 2020, the average open flow capacity of the treated wells reached 35 × 104 m3/d, and the scale of the first two measures has also been expanding. Replenishing fractures in wells with depleted fractures is mainly aimed at unproduced high-quality reservoirs, and sidetracking in old wells is mainly aimed at areas with relatively concentrated remaining reserves and large spacing to improve the well pattern. However, these measures [21,22] alone are not enough to fully utilize the remaining reserves. We believe that more technologies are needed, at least from the following two aspects: (1) For areas where the remaining recoverable reserves between wells are small (<1000 × 104 m3) and the well density cannot be increased at the current stage, sidetracking can be used. The single well cost of sidetracking directional wells should be within 2/3 of the cost of new vertical/directional wells, thereby reducing the economical limit of gas production of sidetracking wells to 800 × 104 m3. (2) An amount of 15% of gas wells in the central region of the Sulige gas field have a high reserve abundance (>1.2 × 10⁸ m3/km2), but a low permeability (≤0.3 mD) or a large water saturation (45–55%). The reservoir in the near-well area is affected by fracturing fluid contamination or water block, resulting in a low final cumulative production (less than 1000 × 104 m3). It is thus necessary to carry out a re-fracturing test. By using harmless fracturing fluid, not only are the original pressure fractures filled, but diverted fracturing is achieved, thereby realizing the reuse of old wells.

5.3. Reasonable Production Schedule Optimization

The gas wells in the western region of the Sulige gas field typically produce water and gas, and the reservoir aquifer has a significant impact on the gas seepage capacity. The gas expands and squeezes the water. Under the influence of pressure gradient, the gas seepage capacity decreases and the water seepage capacity increases [17,23,24,25]. Hence, it is necessary to comprehensively consider the liquid-carrying capacity and the degree of pressure control of gas wells and to adopt a reasonable production schedule to achieve stable production. Ref. [26] proposed the dynamic production optimization method, which comprehensively considers the principle of material balance, gas well deliverability, wellbore temperature, and pressure distribution, and continuous liquid carrying theory. The gas distribution was kept slightly higher than the critical liquid-carrying flow rate at the wellhead at the initial stage of production, thereby fully utilizing the liquid-carrying potential of gas wells, reducing drainage gas recovery, reducing production costs, and improving the ultimate recovery rate. When the method was applied to water-producing gas wells, the continuous liquid-carrying gas production wells accounted for about 90% of all wells on average, and the drainage gas recovery wells were only about 10%. Thus, the method not only ensures the recovery rate but also improves the development efficiency of gas wells.

5.4. The Negative Pressure Gas Recovery Technology

By reducing the oil pressure at the wellhead of the gas well, the final cumulative production of the gas well can be increased [27,28,29,30,31,32]. More than 60% of the gas wells in the Sulige gas field have an average daily gas production below 0.5 × 10⁴ m3, and the production of about 10% of the gas wells is below 0.1 × 10⁴ m3. The oil pressure at the wellhead of these low-yield gas wells is mainly between 1.5 and 2.5 MPa. By using the negative pressure technique, the gas recovery rate of the reservoir can be effectively improved, and at the same time, it reduces the capital investment of drainage gas recovery measures.

6. Conclusions

In this study, we summarized the geological characteristics of tight gas sandstone reservoirs in the Sulige gas field in the Ordos Basin, as well as the recovery indices, and analyzed the challenges for the development of the gas field. Further, we proposed recommendations for the development of tight gas sandstone reservoirs in the gas field, which provide support for achieving stable production of the gas field. The conclusions of this study are as follows:
(1)
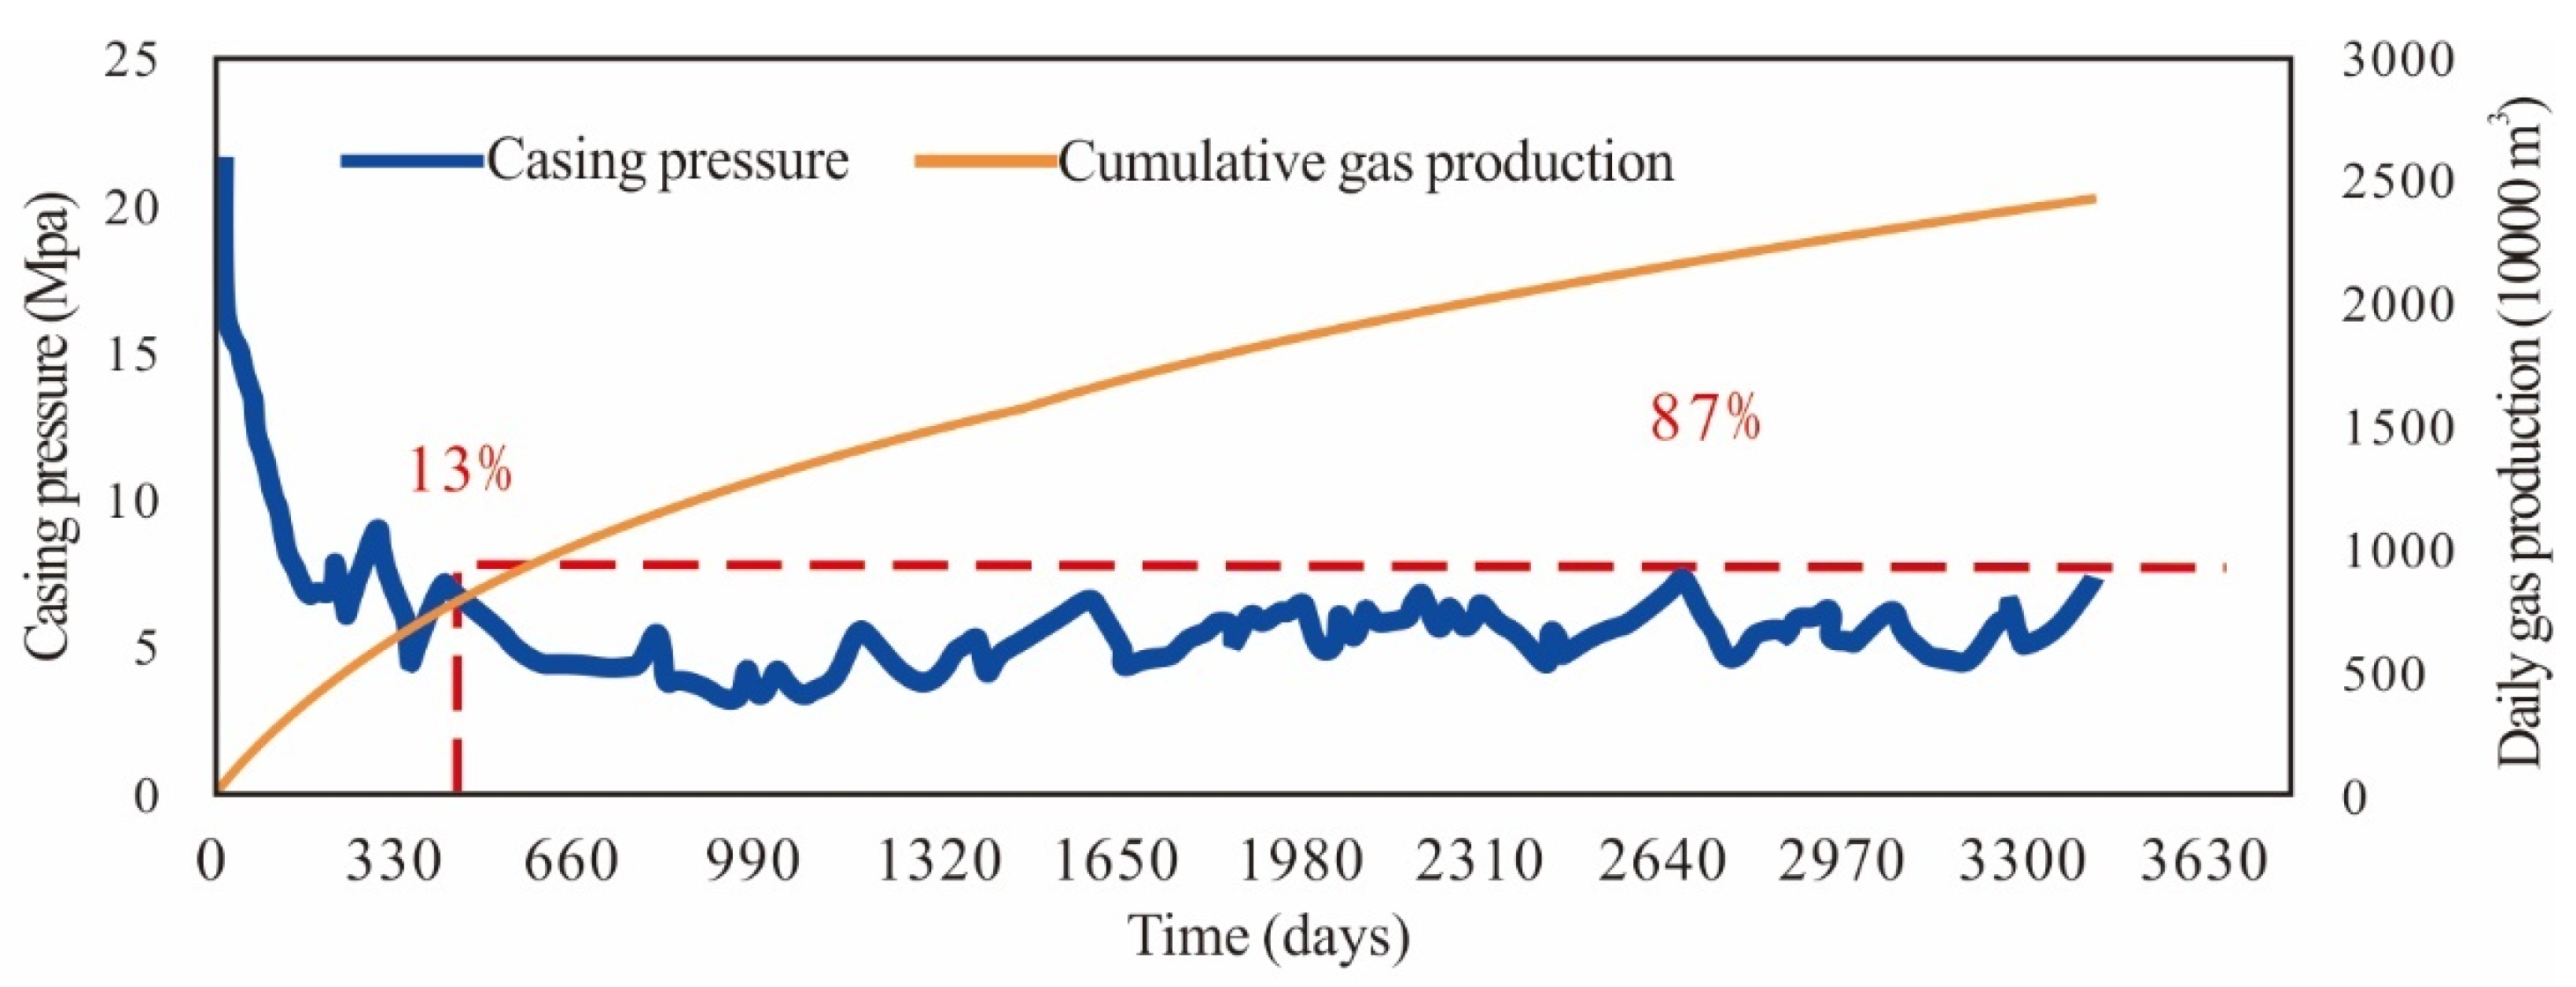
The dominant He-8 member of the Sulige gas field is a braided river sedimentary system, with complex sand body superimpositions in the channels. The effective sand body and petrophysical and gaseous properties of reservoirs have strong non-homogeneity. In some localized areas, the gas–water relationship is complex. There are significant differences in the gas yield, cumulative production, and decline rate between different regions. The gas wells do not have a clear stable production period, and the production declines rapidly in the initial stage.
(2)
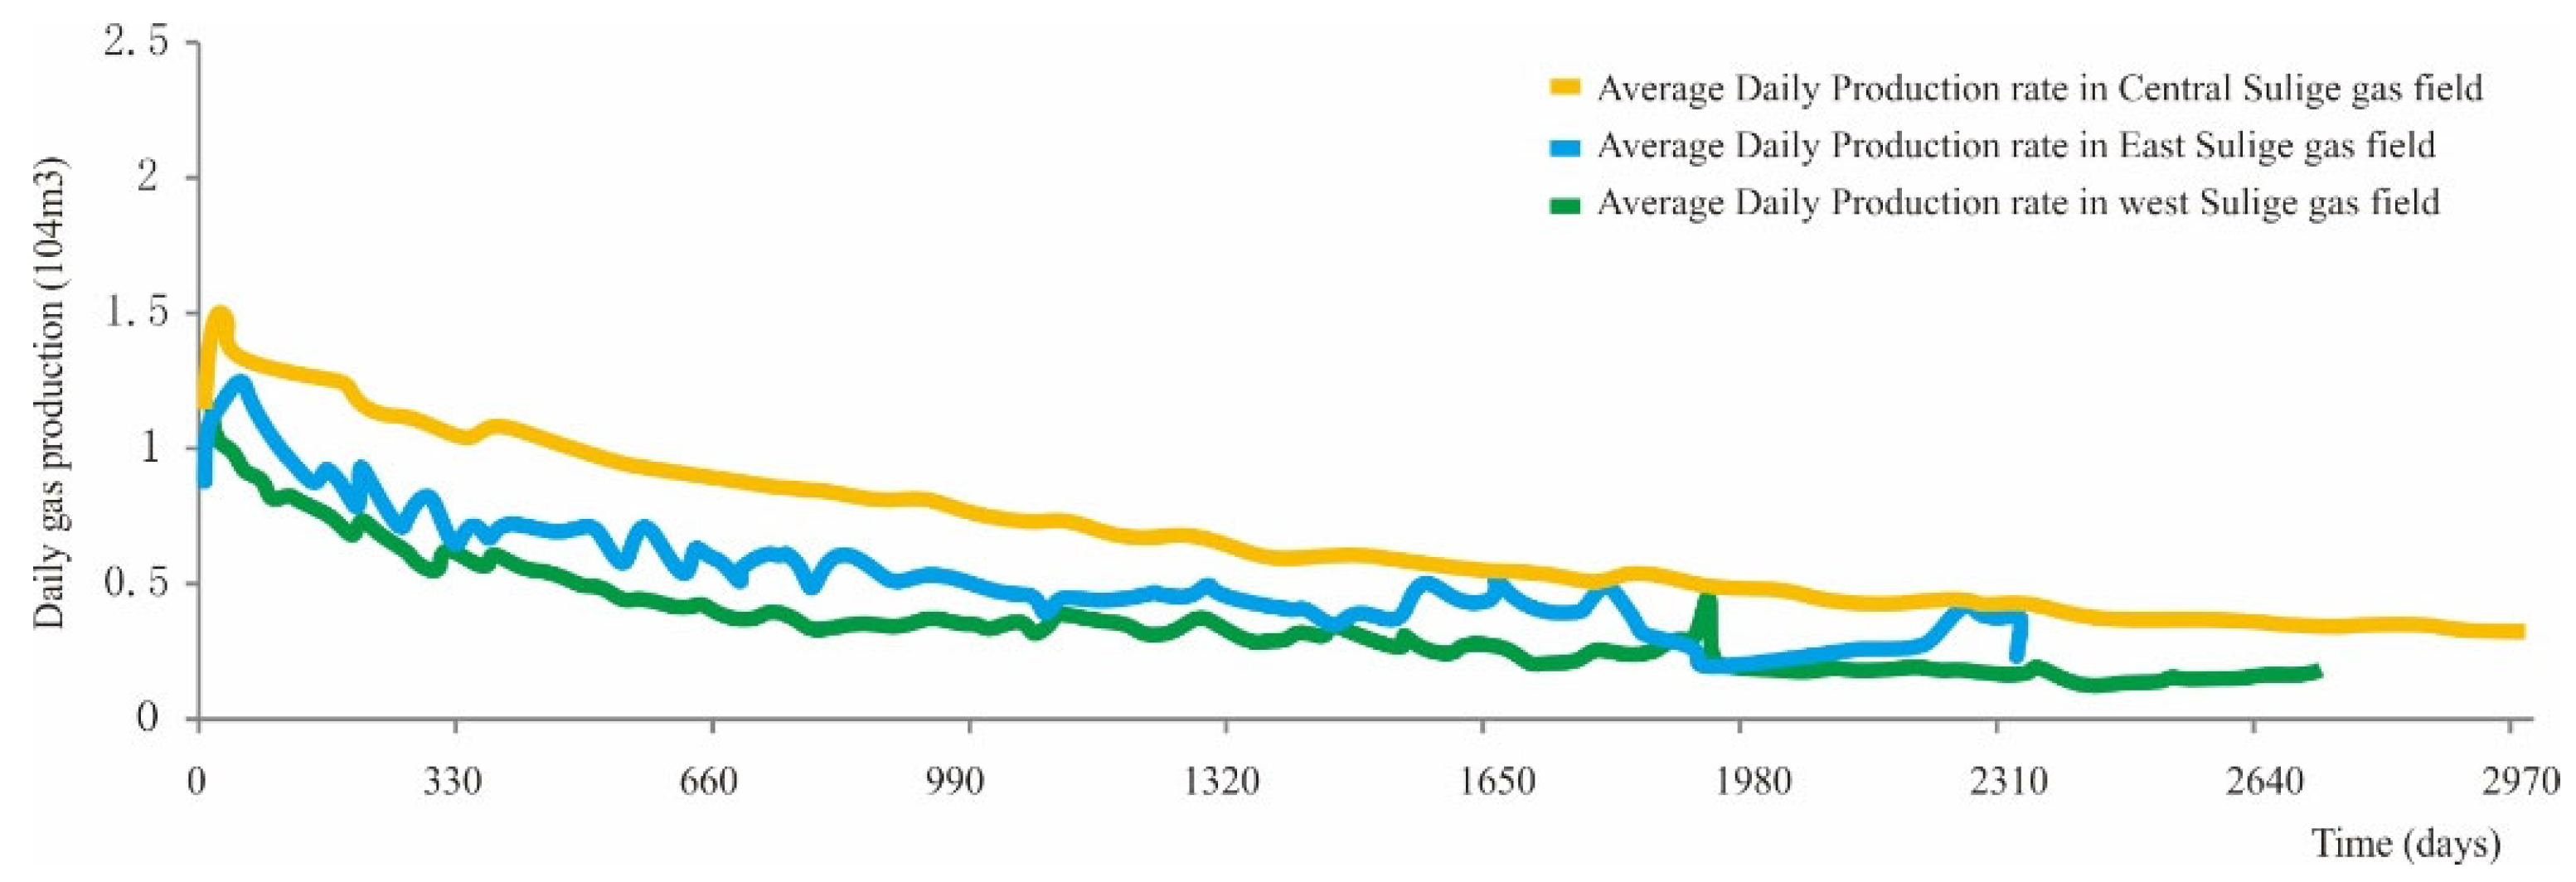
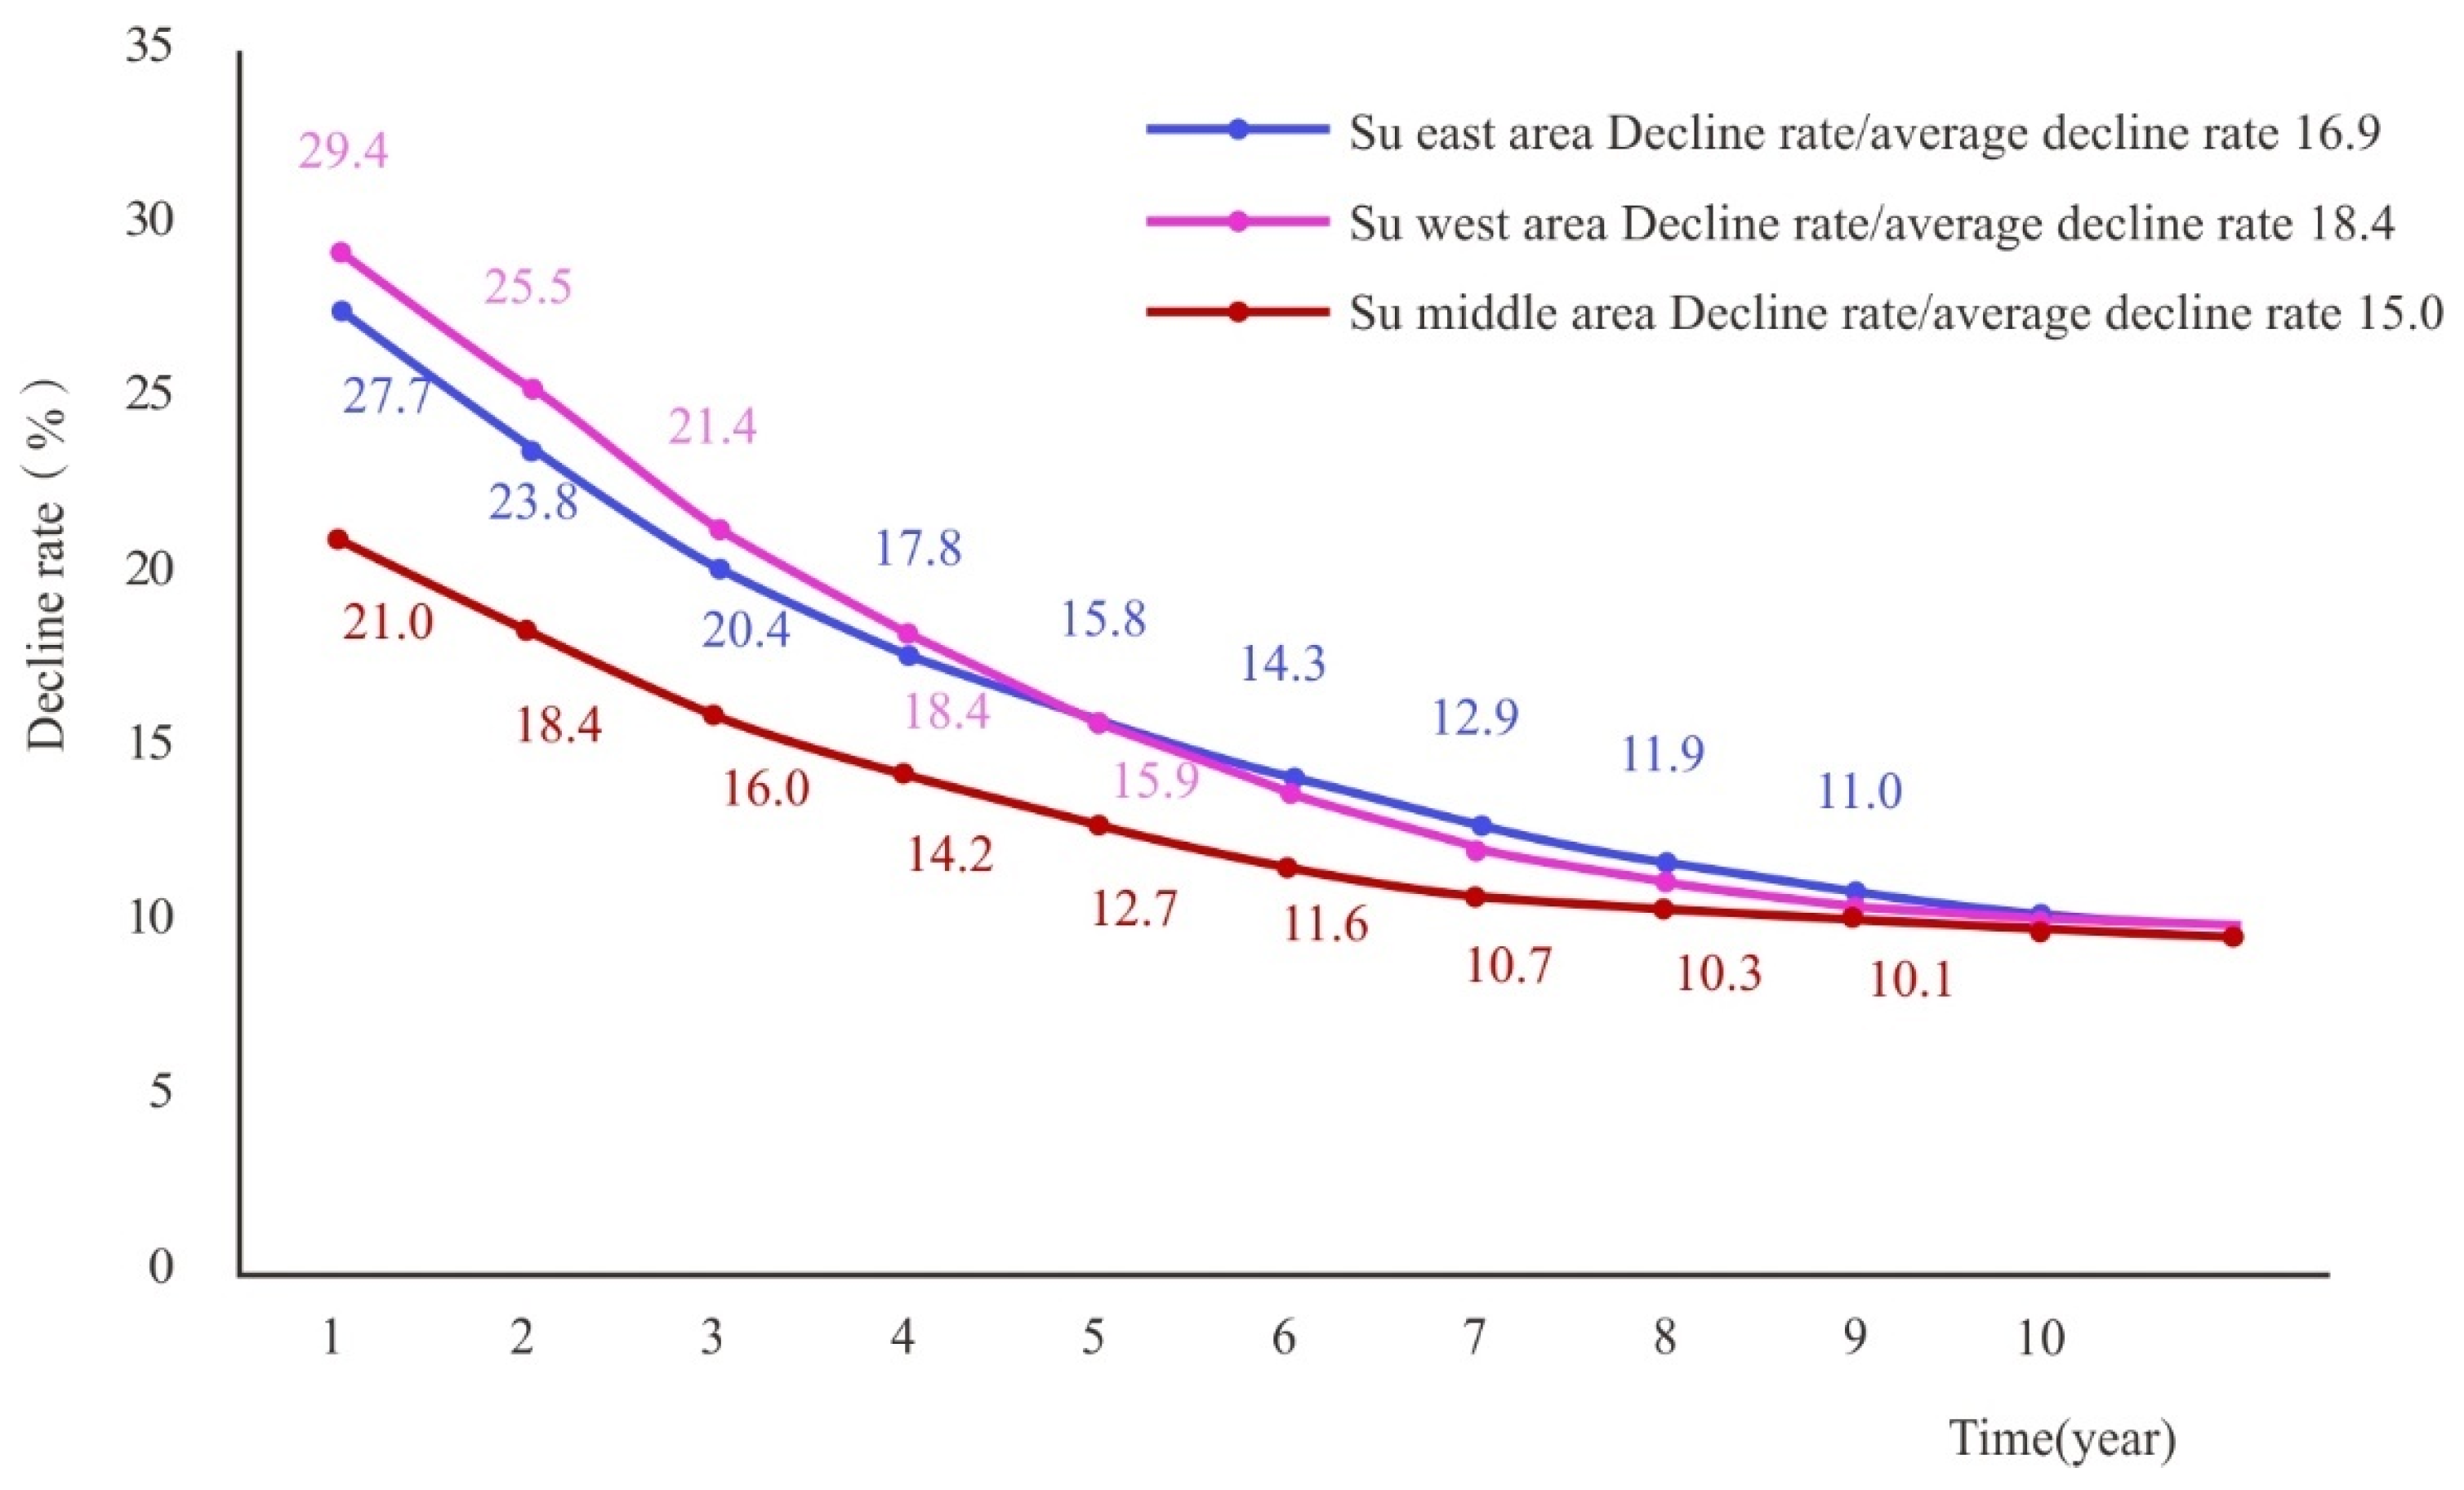
The average daily production of the production wells in the central, eastern, and western areas of the Sulige gas field in the first 3 years was 11,000 square/day, 96,000 square/day, and 8000 square/day, respectively. The cumulative gas production was 1813.29 million square, 1151.22 million square, and 102.27 million square, respectively. The average decline rates were 15%, 16.9%, and 18.4%, respectively. The comparison of actual production results shows that there are obvious differences in gas well production, cumulative gas production, and decline rate in different regions. There is no obvious stable production period in gas wells, and the initial production decreases rapidly.
(3)
Currently, the high-quality reservoirs in the developed regions have a high degree of reserve utilization, and there is a clear trend of worsening and fragmentation of reserves. Moreover, due to the influence of low-quality reserves and inter-well interference, the gas recovery indices of wells put into production in recent years are significantly lower compared with that in the early production stage of the gas field, and the decline rate is higher. In the non-development regions, the quality of reserves is low, and the gas–water relationship is complex, with severe low-yield and fluid accumulation phenomena. It is challenging to improve the recovery factor and achieve effective reserve utilization.
(4)
In order to achieve long-term stable production of the Sulige gas field, it is necessary to promote the dynamic–static integrated refined reservoir description technology and improve the degree of reserve utilization via various measures such as replenishing fractures in wells with depleted fractures, sidetracking horizontal wells, and re-fracturing. In addition, negative pressure technology can also be applied as soon as possible to restore the production capacity of near-depletion wells.

Author Contributions

Conceptualization, M.C.; methodology Z.G.; investigation, C.W.; resources, M.H.; writing—original draft preparation, W.X.; writing review and editing, M.C.; supervision, M.C.; project administration, M.C.; funding acquisition, Z.G. All authors have read and agreed to the published version of the manuscript.

Funding

This research was funded by China Petroleum and Natural Gas Co., Ltd. ‘14th Five-Year’ Science and Technology Spcial ‘Research on key technology of complex natural gasfield development’ grant number [2021DJ1704].

Institutional Review Board Statement

Not applicable.

Informed Consent Statement

Not applicable.

Data Availability Statement

The data presented in this study are available on request from the corresponding author. The data are not publicly available due to our company’s confidentiality requirements.

Conflicts of Interest

The authors declare no conflict of interest.

References

  1. Li, Q.; Zhao, D.; Yin, J.; Zhou, X.; Li, Y.; Chi, P.; Han, Y.; Ansari, U.; Cheng, Y. Sediment Instability Caused by Gas Production from Hydrate-bearing Sediment in Northern South China Sea by Horizontal Wellbore: Evolution and Mechanism. Nat. Resour. Res. 2023, 1–26. [Google Scholar] [CrossRef]
  2. Zhang, C.P.; Liu, S.; Ma, Z.Y.; Ranjith, P.G. Combined micro-proppant and supercritical carbon dioxide (SC-CO2) fracturing in shale gas reservoirs: A review. Fuel 2021, 305, 121431. [Google Scholar] [CrossRef]
  3. Sun, L.; Zou, C.; Jia, A.; Wei, Y.; Zhu, R.; Wu, S.; Guo, Z. Development char-acteristics and orientation of tight oil and gas in China. Min. Alogy Petrol. 2019, 46, 1015–1026. [Google Scholar]
  4. Zhang, B.; Wang, X.; Zhang, C. Rec-ognition of tight sandstone reservoir characteristics and devel-opment potential of the 2nd member of Xujiahe gas reservoir in Zhongba Gas Field. Reserv. Eval. Dev. 2019, 9, 10–15. [Google Scholar]
  5. Ji, G.; Jia, A.; Meng, D.; Guo, Z.; Wang, G.; Cheng, L.; Zhao, X. Technical countermeasures of effective development and gas recovery enhancement for large tight Gas Field: A case study of Sulige gas field, Ordos Basin, NW China. Pet. Explor. Dev. 2019, 46, 629–641. [Google Scholar]
  6. Zou, X. Study on Channel Sand Body Identification of Sulige Gas Field in Ordos Basin. Master’s Thesis, Northwest University, Xi’an, China, 2006. [Google Scholar]
  7. Li, X.; Zhang, M.; Xie, W. Controlling factors for lithologic gas reservoir and regularity of gas distribution in the upper Paleozoic of Ordos Basin. Acta Pet. Sin. 2009, 30, 168–175. (In Chinese) [Google Scholar]
  8. Guo, Z.; Jia, A.; Ji, G.; Ning, B.; Wang, G.; Meng, D. Reserve classification and well pattern infilling method of tight sandstone gasfield: A case study of Sulige gasfield. Acta Pet. Sin. 2017, 38, 1299–1309. [Google Scholar]
  9. Wang, J.; Ren, Z.; Shan, J.; Zhu, Y.J. He 8 and Shan 1 members depositional system research in east of Sulige gas field. Geol. Sci. Technol. Inf. 2011, 30, 41–48. [Google Scholar]
  10. Meng, D.; Jia, A.; Zhi, G.; Guo, Z.; Jin, S.; Wang, G.; Ji, G.; Cheng, L. Effective sand scale and gas well development index evaluation:A case study of Taiyuan formation in Shenmugas field, Ordos basin, NW China. J. China Univ. Min. Technol. 2019, 47, 1047–1054. [Google Scholar]
  11. Meng, D.; Jia, A.; Ji, G.; He, D. Water and gas distribution and its controlling factors for large scale tight sand gas fields: A case study of western Sulige gas field, Ordos Basin, NW China. Pet. Explor. Dev. 2016, 43, 607–614. [Google Scholar] [CrossRef]
  12. He, D.B.; Ji, G.; Jiang, Q.; Cheng, L.; Meng, D.; Wang, G.; Guo, Z.; Cheng, M.H.; Han, J.C. Differential development technological measures for high-water-cut tight sandstone gas reservoirs in western area of Sulige Gas Field. Nat. Gas Ind. 2022, 42, 73–82. [Google Scholar]
  13. Guo, Q.; Chen, K.; Li, Z. Reasonable calculation method of dynamic reserves for low permeability reservoirs. Spec. Oil Gas Reserv. 2016, 23, 113–115. [Google Scholar]
  14. Wang, J.; Jia, A.; Wei, Y.; Jia, C.; Qi, Y.; Yuan, H.; Jin, Y. Optimization workflow for stimulation-well spacing design in a multiwell pad. Pet. Explor. Dev. 2019, 46, 1039–1050. [Google Scholar] [CrossRef]
  15. Li, Y.; Xu, W.; Xiao, F.; Liu, L.; Liu, S.; Zhang, W. Development well pattern optimization based on dynamic characteristics: A case study from the Sulige tight sandstone gas field with great heterogeneity. Nat. Gas Ind. 2014, 34, 56–61. [Google Scholar]
  16. Lu, T.; Liu, Y.; Wu, L.; Wang, X. Challenges to and countermeasures for the production stabilization of tight sandstone gas reservoirs of the Sulige Gasfield, Ordos Basin. Nat. Gas Ind. 2015, 35, 43–52. [Google Scholar] [CrossRef] [Green Version]
  17. Yu, S.; Tian, J. Study and application of drainage gas recovery technology in Sulige gas field. Drill. Prod. Technol. 2012, 35, 40–43. [Google Scholar]
  18. He, W.; Wu, S.; Tang, Y.; Lin, S.Q.; Zhang, B.H. The architecture analysis of the underground point bar: Taking Gudao oilfield as an example. J. Mineral. Petrol. 2005, 25, 81–86. [Google Scholar]
  19. Qiu, Y.; Jia, A. Development of geological reservoir modeling in past decade. Acta Pet. Sin. 2000, 21, 101–104. [Google Scholar]
  20. Jia, A. Research achievements on reservoir geological modeling of China in the past two decades. Acta Pet. Sin. 2011, 32, 181–188. [Google Scholar]
  21. Jia, A.; Wang, G.; Meng, D.; Guo, Z.; Ji, G.; Cheng, L. Well pattern infilling strategy to enhance oil recovery of giant low-permeability tight gasfield: A case study of Sulige gasfield, Ordos Basin. Acta Pet. Sin. 2018, 39, 802–813. [Google Scholar]
  22. Cheng, M.; Meng, D.; Wang, L.; Jiang, Q.; Wang, G.; Zhao, M. Evaluation of horizontal well differential development effect in tight Sand stone gas reservoir: A case study of Sulige gas field, Ordos Basin. J. China Univ. Min. Technol. 2023, 52, 354–363. [Google Scholar]
  23. Li, Q.; Gao, S.; Yang, Z.; Feng, Q.; Ye, L. Influence of the threshold pressure gradient on tight sandstone gas reservoir recovery. Nat. Gas Geosci. 2014, 25, 1444–1449. [Google Scholar]
  24. Zhou, K.M.; Li, N.; Zhang, Q.X.; Tang, X.G. Experimental research on gas-water two phase flow and confined gas formation mechanism. Nat. Gas Ind. 2002, 22, 122–125. [Google Scholar]
  25. Zhang, C.; Jin, D.; Li, S.; Zhang, J. Progress and measurement of drainage gas recovery technology in Sulige gas field. Nat. Gas Explor. Dev. 2016, 39, 48–52. [Google Scholar]
  26. Yang, Z.; Kong, L.; Du, M.; Zhao, C. Economic evaluation on tight sandstone gas development projects in China and recommendation on fiscal and taxation support policies. Nat. Gas Ind. 2016, 36, 98–109. [Google Scholar] [CrossRef]
  27. Li, Y.; Li, K.; Wang, Z.; Wang, H.; Ding, J.; Weili, H. Study on dynamic production optimization for water produced gas wells in Daniudi low permeability gas reservoirs. Oil Drill. Prod. Technol. 2013, 35, 71–74. [Google Scholar]
  28. Mao, M.; Li, Y.; Wang, H.; Li, J.; Zhao, Z. Prediction of gas well abandonment production in the Sulige gas field. Nat. Gas Ind. 2010, 30, 64–66. [Google Scholar]
  29. Cheng, M.; Xue, W.; Zhao, M.; Wang, G.; Ning, B.; Ji, G.; Cheng, L.; Tian, Y. Production Data Analysis and Practical Applications in the Sulige Tight Gas Reservoir, Ordos Basin, China. Geofluid 2021, 2021, 10. [Google Scholar] [CrossRef]
  30. Wang, J.; Zhang, C.; Li, J. Tight sandstone gas reservoirs in the Sulige Gas Field: Development understandings and stable-production proposals. Nat. Gas Ind. 2021, 41, 100–104. [Google Scholar]
  31. Asghar, Z.; Shatanawi, W.; Shah, R.A.; Gondal, M.A. Impact of viscoelastic ooze slime on complex wavy gliders near a solid boundary. Chin. J. Phys. 2023, 81, 26–36. [Google Scholar] [CrossRef]
  32. Asghar, Z.; Shah, R.A.; Pasha, A.A.; Rahman, M.M.; Khan, M.W.S. Controlling kinetics of self-propelled rod-like swimmers near multi sinusoidal substrate. Comput. Biol. Med. 2022, 151, 106250. [Google Scholar] [CrossRef] [PubMed]
Figure 1. Topographic map of Sulige gas field.
Sustainability 15 09933 g001
Figure 2. Evaluation of gas drainage area.
Sustainability 15 09933 g002
Figure 3. Evaluation of interference well testing.
Sustainability 15 09933 g003
Figure 4. Well connection profile of gas reservoir in west Sulige gas field.
Sustainability 15 09933 g004
Figure 5. Proportion of gas recovery under low pressure (6 Mpa) in 28 early production wells of Sulige gas field.
Sustainability 15 09933 g005
Figure 6. Comparison chart of daily average gas production curve of three blocks in Sulige gas field.
Sustainability 15 09933 g006
Figure 7. Relationship between cumulative gas production and water gas ratio of a single well in Sulige west area.
Sustainability 15 09933 g007
Figure 8. Curve of decline rate of each block in Sulige gas field.
Sustainability 15 09933 g008
Figure 9. Production instability analysis method of the S well in the central area of Sulige gas field.
Sustainability 15 09933 g009
Figure 10. Well-controlled reserves of single well in each block of Sulige gas field.
Sustainability 15 09933 g010
Figure 11. Stage diagram of recovery rate changing with well pattern density.
Sustainability 15 09933 g011
Table 1. Reservoir petrophysical properties in different regions of the Sulige gas field.
RegionPermeability (mD)Permeability DistributionPorosityPorosity Distribution
MeanMedian<0.1 mD0.1–0.5 mD0.5–1 mD>1 mDMeanMedian<5%5–10%>10%
Central1.510.2625.60%43.56%21.05%9.80%7.4%7.3%24.6%55.9%19.5%
Eastern0.740.2126.67%52.87%10.36%10.10%8.2%7.9%21.3%48.9%29.7%
Western1.580.1733.84%45.50%10.63%10.08%7.3%7.1%24.0%58.0%17.9%
Disclaimer/Publisher’s Note: The statements, opinions and data contained in all publications are solely those of the individual author(s) and contributor(s) and not of MDPI and/or the editor(s). MDPI and/or the editor(s) disclaim responsibility for any injury to people or property resulting from any ideas, methods, instructions or products referred to in the content.

