Article

Investigating the Energy-Saving Effectiveness of Envelope Retrofits and Photovoltaic Systems: A Case Study of a Hotel in Urumqi

School of Architecture and Engineering, Xinjiang University, Urumqi 830049, China
*
Author to whom correspondence should be addressed.
Sustainability 2023, 15(13), 9926; https://doi.org/10.3390/su15139926
Submission received: 9 May 2023 / Revised: 10 June 2023 / Accepted: 16 June 2023 / Published: 21 June 2023
(This article belongs to the Section Green Building)

Abstract

:
Many of China’s older buildings, built in the 1970s and 1980s, faces several indoor temperature and heating energy consumption problems. Based on an investigation and analysis of an old hotel in Urumqi, this paper proposes a renovation plan to improve the indoor temperature and reduce the heating energy consumption, thereby introduce a sustainable development strategy for the winter. The effects of different renovation plans on the hotel were simulated using DesignBuilder and PVsyst software. The results show that improving the insulation performance of the building envelope, including reforming the roof, exterior wall, doors, and windows and adjusting the window-to-wall ratio, is the primary way to improve indoor temperature and reduce heating energy consumption in winter. If economic conditions allow, we can also install photovoltaic systems on the roof to save a significant amount of energy. This paper puts forth specific reconstruction plans for old buildings in cold regions as well as some possible reconstruction paths for other structures according to the local economic development level to provide a reference for future related studies.

1. Introduction

As the largest developing country globally, China is both a major producer and consumer of energy resources [1]. Although China has begun its economic retrofit, with the development of its economy and society, the demand for energy in the whole country continues to grow. Adjusting the energy structure to improve the current power situation is the only way to resolve the energy problem and achieve sustainable development [2]. In recent years, all industries in China have been vigorously carrying out measures for energy conservation and emission reduction. Since the construction industry is the pillar of the Chinese economy, the energy consumption generated by it cannot be ignored [3]. According to the statistical information in the 2021 China Building Energy Consumption and Carbon Emission Research Report released by the China Building Energy Conservation Association, the total energy consumed in the whole process of building in China is 2.233 billion TCE (ton of standard coal equivalent), accounting for 45.96% of China’s total energy consumption, which is indeed a rather large proportion [4].
China has a substantial building stock of 50 billion m2, and most are energy-intensive buildings [5,6]. Many old buildings with historical significance were built in the 1970s and 1980s. Due to the lack of energy-saving awareness and related specifications in the design and construction at that time, and part of the enclosure structure aging and falling off due to lack of repair, the overall insulation capacity of these buildings has gradually been lost. In addition, the sealing capacity of doors and windows are also weak. As a result, old buildings have a high heating load and low indoor temperature in winter [7,8]. In recent years, with the development of society and the economy, people require a constantly improving quality of life [9]. If these old buildings are not reconstructed in an energy-saving manner, they will affect the experience of indoor residents and consume a large amounts of heating energy.
Most scholars’ research on energy-saving retrofits of existing buildings focuses on optimizing schemes. Huang established a model to calculate the thickness of the insulation layer of the exterior wall and formulated an optimization model for measuring the thermal performance parameters of the envelope by comprehensively considering factors, such as orientation, window-to-wall ratio, and window type to carry out energy-saving retrofits of the envelopes of existing residential buildings [10]. Qi took rural housing in Hangzhou as an example and proposed a new regional similarity analysis method for improving the shape coefficient of rural housing at the municipal level, providing a reference for architectural designers to implement energy-saving designs at the regional scale [11]. Focusing on reducing residential energy consumption in cold areas, Wang sought to achieve low energy consumption for residential buildings in cold regions via macro policies and specific energy-saving technology designs [12]. Abdullahi et al. conducted an evaluation study on the process and technology selection of building low-energy retrofits. Taking a building at the Coventry University as an example, they introduced the energy-saving retrofit technologies and analyzed their advantages and disadvantages [13]. Ammar et al. proposed a modeling method for swappable roof insulation systems and systematically analyzed the system’s insulation benefits in residential buildings in the United States [14]. Wang et al. took the energy-saving retrofit measures of 15 existing hotels in Jiangsu Province as examples. They found that heating, ventilation and air conditioning, monitoring, lighting, domestic hot water, and building envelope systems were the five energy-saving retrofit technical measures with the highest proportion of application [15]. Some scholars use computer simulation technology to study the energy-saving retrofit strategies of existing buildings. Wang established an analysis model based on the relationship between the shape of multi-story residential buildings and the effectiveness of energy-saving measures and performed a comprehensive analysis of the impact of different shape models on energy saving using the TH-BECS2008 software [16]. Xiong took the Anju Town energy conservation project in Chongqing as an example, analyzed its energy-saving effect using DesignBuilder software, and proposed energy-saving methods for traditional residential buildings [17]. Chen used Ecotect to simulate the energy consumption of residential buildings with passive sunrooms and found that the heating energy consumption of buildings with sunrooms was lower than that of buildings without sunrooms [18]. Linn et al. simulated and measured the effectiveness of energy-saving retrofits of 11 existing multi-family residential buildings in Sweden and concluded that energy-saving retrofits could reduce the energy consumption and CO2 emissions of the buildings [19]. Ehab used the EnergyPlus simulation engine for automated batch simulation and studied and analyzed a single-family house in France to obtain the cost and energy efficiency of different retrofit measures [20]. Wang et al. established a residential heating energy consumption estimation model to estimate residential heating energy consumption in China’s hot-summer and cold-winter climate zones [21]. Wilhelm et al. simulated the influence of the thermal bridge effect in building envelopes on energy consumption using DesignBuilder, and the results showed that an appropriate external wall insulation strategy could reduce energy consumption by 30% [22]. Liu et al. used typical high-rise public rental housing buildings in subtropical Hong Kong as a case study to consider future climatic uncertainties under representative concentration pathway scenarios and in different general circulation models to estimate their effect on multi-objective building retrofit decisions, considering trade-offs among different objectives (namely life-cycle economics, life-cycle carbon emissions, and operational energy-use impacts) [23]. Lin created a UBEM for the mixed modern and historic buildings at a campus in China. The calibrated set of UBEMs, the modeled results of which met the 20% error range, were then used to evaluate the uncertainties concerning the energy savings of four building energy retrofit (BER) measures [24]. To sum up, research on the energy-saving retrofitting of existing buildings mainly concerns the optimization of the thermal performance of external walls, adjustments to the shapes of buildings, the energy-saving retrofitting of exterior doors and windows, and roof insulation designs. However, these existing studies primarily focus on buildings in hot-summer and cold-winter regions or cold regions in China, and there are only a few studies on old buildings in severely cold regions with shallow and dry winter temperatures. Additionally, most studies only focus on one aspect of retrofitting, and relatively few studies have focused on the comprehensive utilization of different retrofit technologies and their ultimate effects. In addition, the existing studies rarely consider the application and effect of renewable energy in renovating buildings in cold regions.
The buildings built in different periods and regions vary greatly in thermal performance, indoor environment, and energy consumption due to the differences in building shape and construction practices. Therefore, it is necessary to target energy-saving retrofit and sustainable strategies for severe cold regions. It has become imperative for China’s construction industry to discuss the energy-saving retrofit and sustainable strategy of old buildings in severe cold regions and study how building energy consumption could be reduced whilst increasing indoor temperature in winter.
This paper takes an old hotel in Urumqi, Xinjiang, China, as the research object, conducts a field investigation and attempts to understand the current situation of the hotel by fully considering the local climate characteristics and natural resources, and proposes reasonable retrofit schemes and sustainable strategies. Additionally, it uses computer technology to simulate the effect of each retrofit scheme and conducts in-depth analyses of the simulation results. Based on the simulation results and the local economic conditions, this paper summarizes the concrete transformation plan. Finally, this paper provides some theoretical and technical references for conducting retrofit studies in other severe cold regions.

2. Methods

The research area is a hotel located in Urumqi, which is a severe cold region (severe cold region refers to the region where the monthly average temperature is less than −10 °C or the days where the daily average temperature less than 5 °C exceed 145 days. It is one of the five climate regions in China [25]). The hotel, located in the southern suburb of Urumqi, was built in early 1985 [26]. The building is a two-story building with an area of 5519.4 m2. It has 78 guest rooms and 156 beds, as shown in Figure 1 and Figure 2.

2.1. Direction of Energy-Saving Retrofit

Through field measurements, we find that the physical properties of the hotel are poor, and the indoor temperature in winter is generally low, thereby indicating the need to improve the indoor comfort and energy saving of old buildings in severe cold regions.
We find that poor insulation performance of the building envelope, poor air tightness of doors and windows, and unreasonable setting of the window–wall ratio are the main reasons for high energy consumption and low indoor temperature in winter. Therefore, the insulation performance of the building envelope should be enhanced to improve the indoor temperature and reduce heating energy consumption in such buildings in winter [27]. The retrofit measures include transforming the old building’s roof, exterior wall, doors, and windows to improve the insulation performance and airtightness of the building envelope. However, since some old buildings have a preservative quality, caution should be exercised to avoid damaging the existing facades during the retrofit. Figure 3 shows the process of retrofitting an old building.

2.2. The Current Structure of the Hotel

The current situation of the hotel is shown in Figure 4. Part of the outer wall skin has fallen off. This study used the multi-channel heat flow meter to measure the actual heat transfer coefficients of the walls and windows during four days from 16 to 20 March 2021, which made the simulation results closer to the actual situation, as shown in Figure 5. The measuring devices and specifications are shown in Table 1.
According to the field investigation, since the hotel was built in the 1980s, there is no insulation layer on the outer wall; there is only a 370 mm thick solid clay brick wall. According to field measurements and calculations, the heat transfer coefficient of the exterior wall is about 1.478 W/m2∙K, which is far higher than the limit of 0.3 W/m2∙K stipulated in China’s national design standard (energy efficiency design standards for residential buildings in cold and cold areas, XJJ 001-2021 [28]). The hotel roof does not have an insulation layer, and it only applies a layer of slag as insulation material to enhance the insulation effect of the roof. Nevertheless, due to the early construction and lack of maintenance, the slag on the roof has almost lost its insulation performance. According to field measurements and calculations, the heat transfer coefficient of the roof is about 1.33 W/m2∙K, much higher than the specified limit of 0.2 W/m2∙K. The hotel features single glass double windows with steel frames and heat transfer coefficients of 2.734 W/m2∙K, which is much higher than the specified limit of 1.5 W/m2∙K [29]. The limit of the heat transfer coefficient of the building envelope in the severe cold region is shown in Table 2. The structure of the building envelope is shown in Table 3. A more significant heat transfer coefficient leads to heat loss of the building envelope, thereby substantially influencing the indoor temperature and energy consumption. Moreover, the building’s east, west, and north window area is large, which does not meet the current limit of the window–wall ratio. The window–wall ratio of the buildings facing each direction in the severe cold region is shown in Table 4.
Urumqi belongs to the severe cold region. The buildings in this region can obtain a relatively comfortable indoor temperature by natural ventilation in summer and almost do not need to use more air conditioning energy. In winter, the local outdoor temperature is shallow, and the insulation performance and airtightness of the envelope of the old buildings are poor [30]. As a result, the indoor temperature of the buildings is shallow, and the heating season in Urumqi lasts for six months, which is bound to consume a large amount of heating energy. Therefore, it is necessary to improve the indoor temperature and comfort of the old local buildings in winter through retrofit.
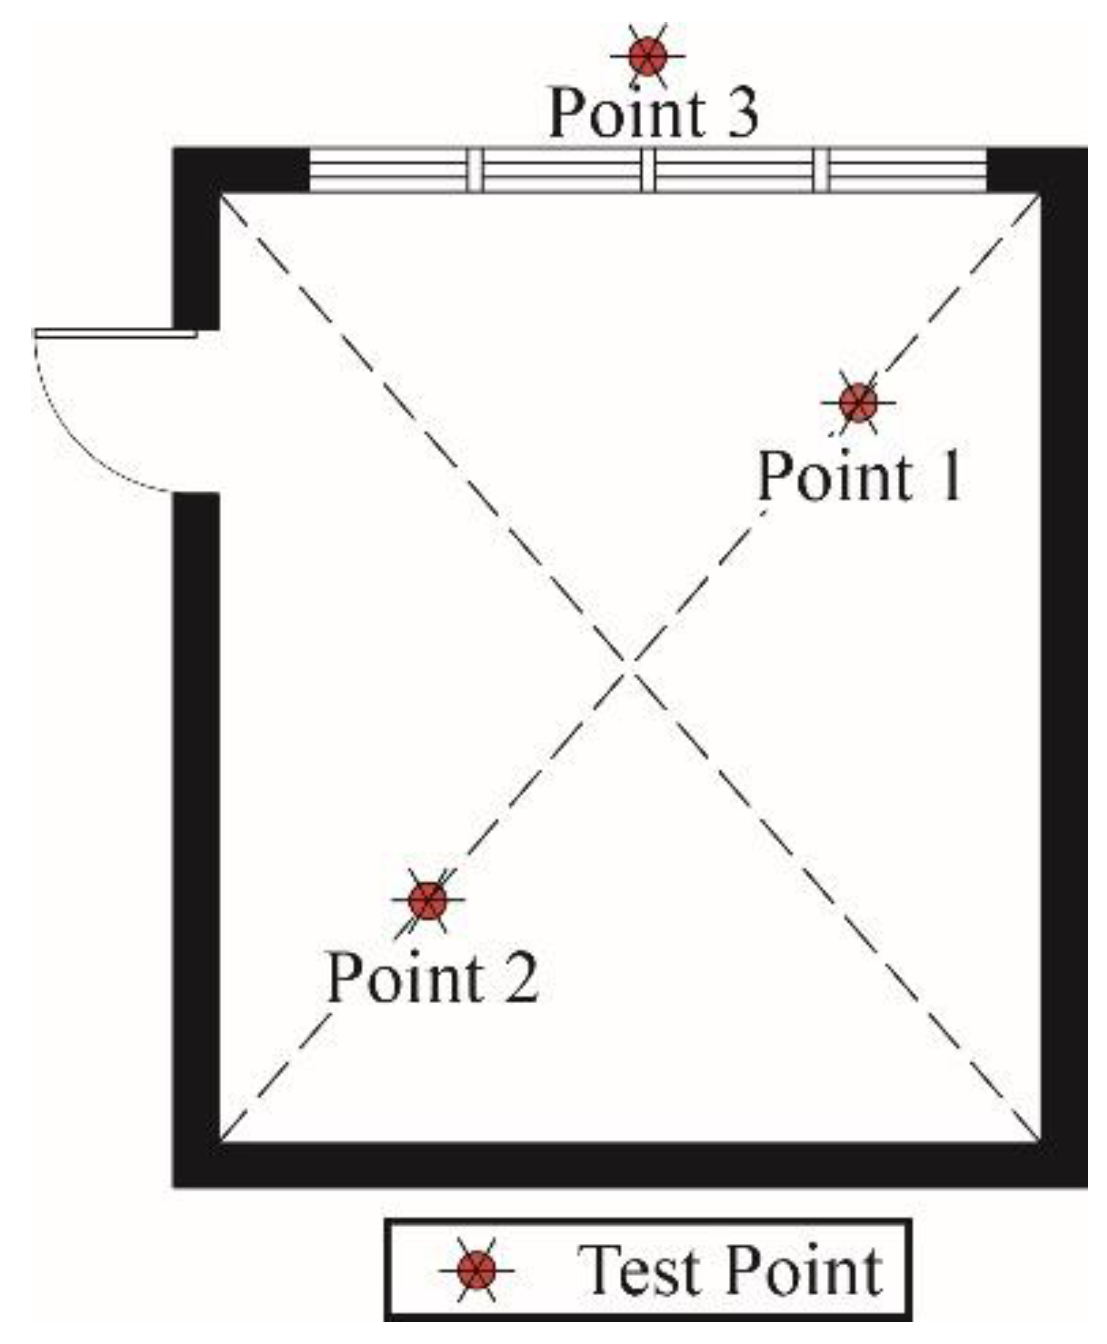
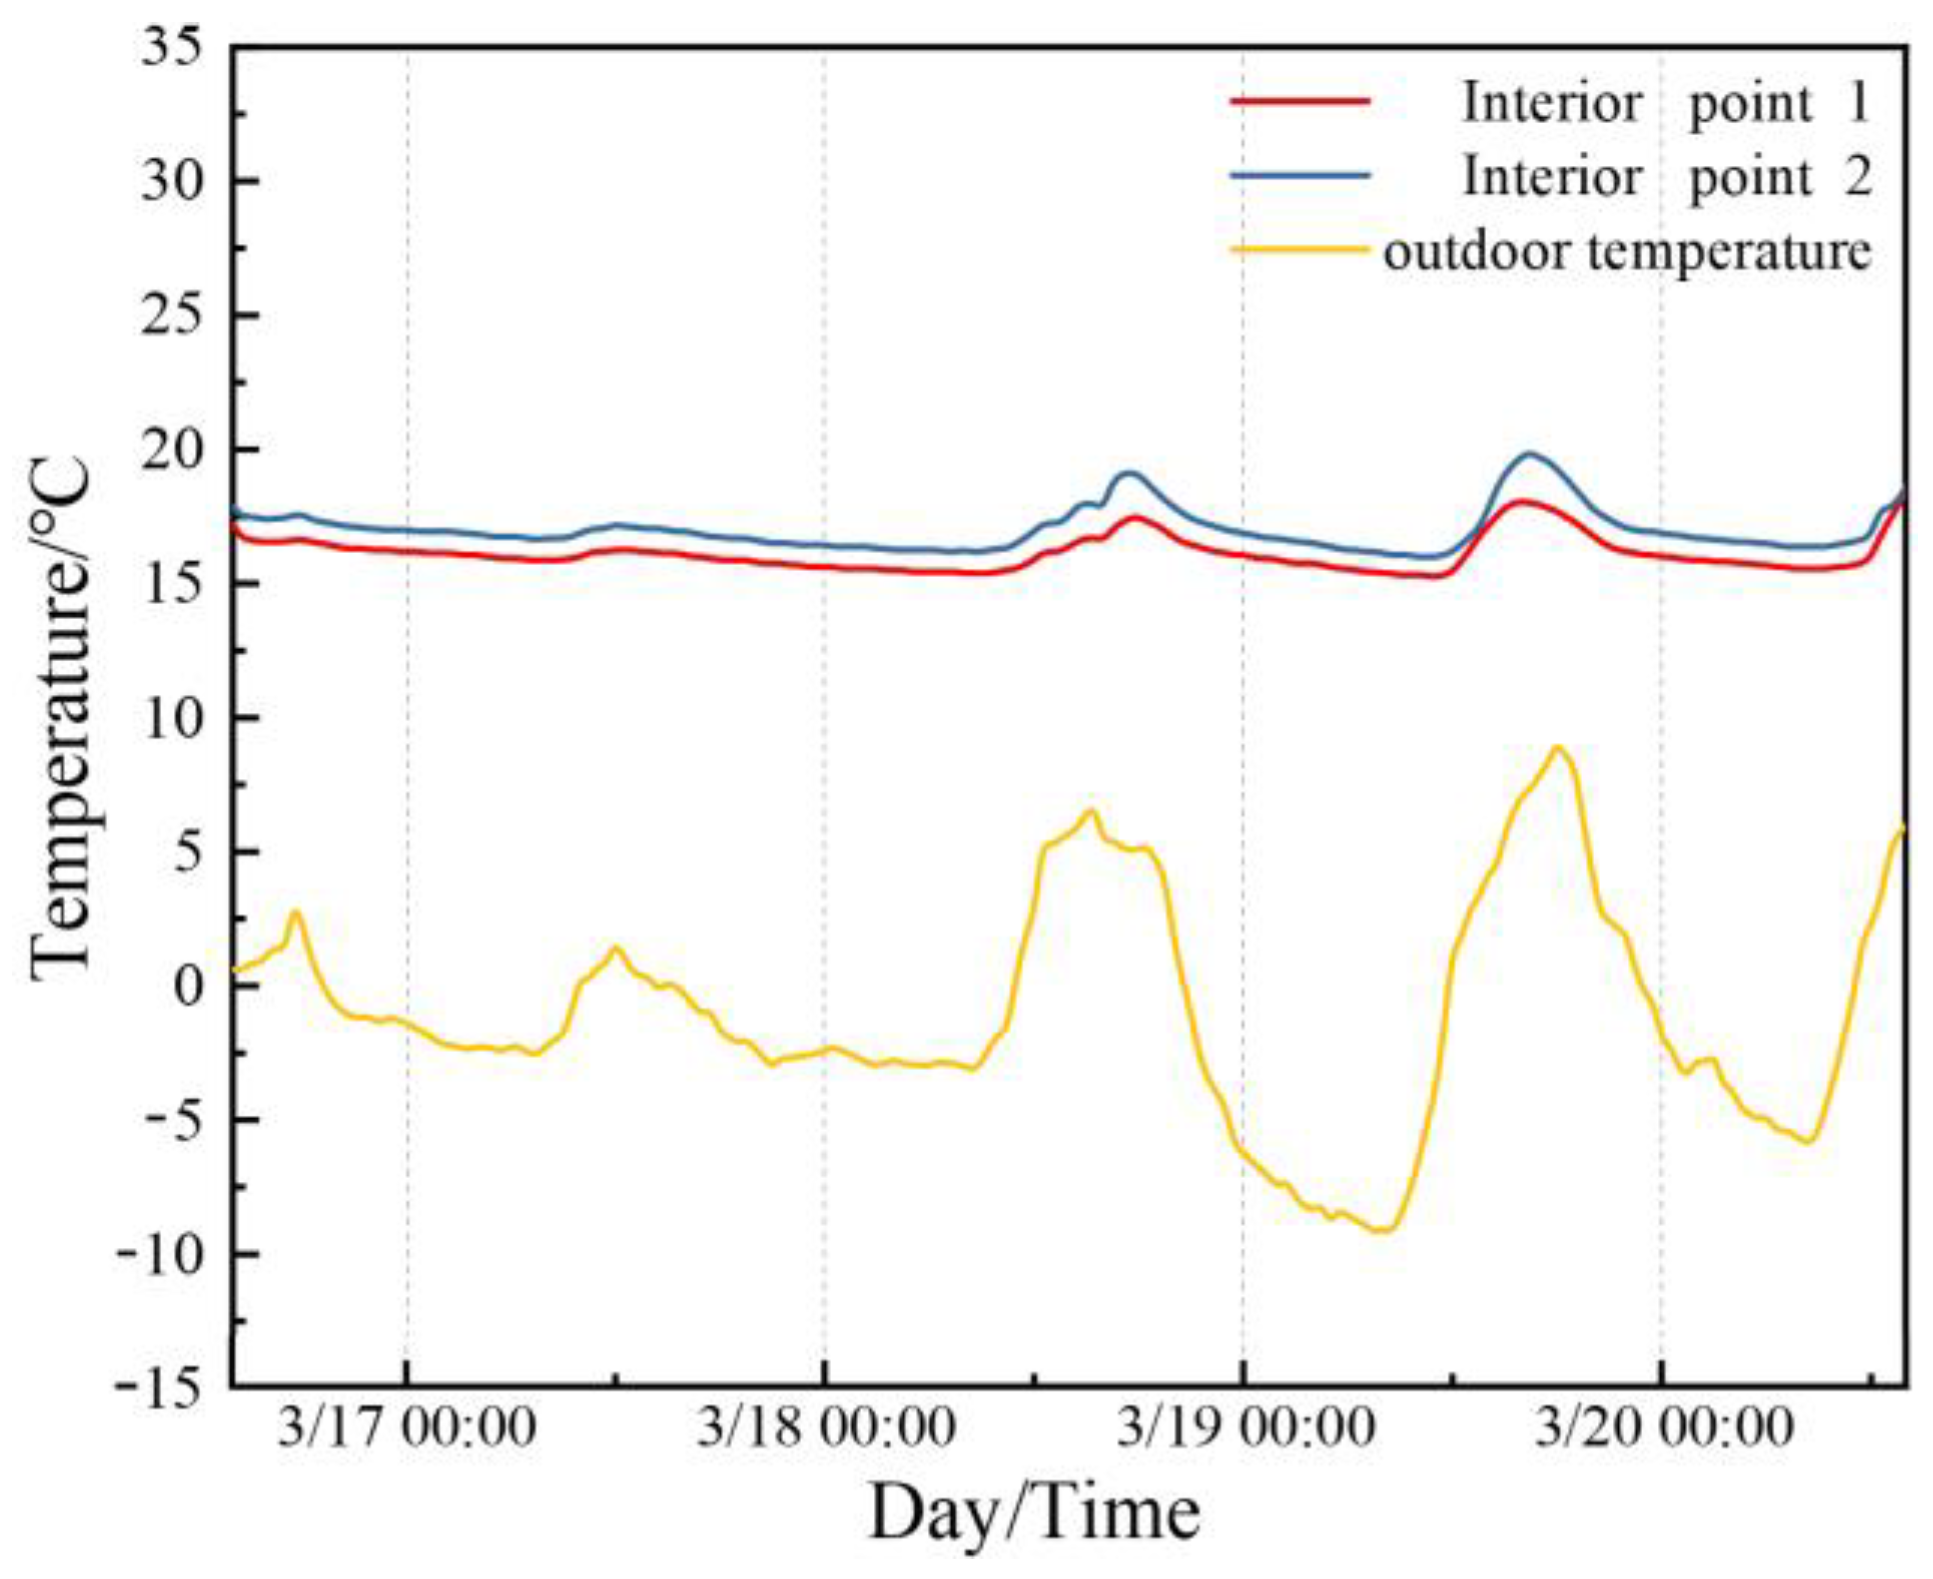
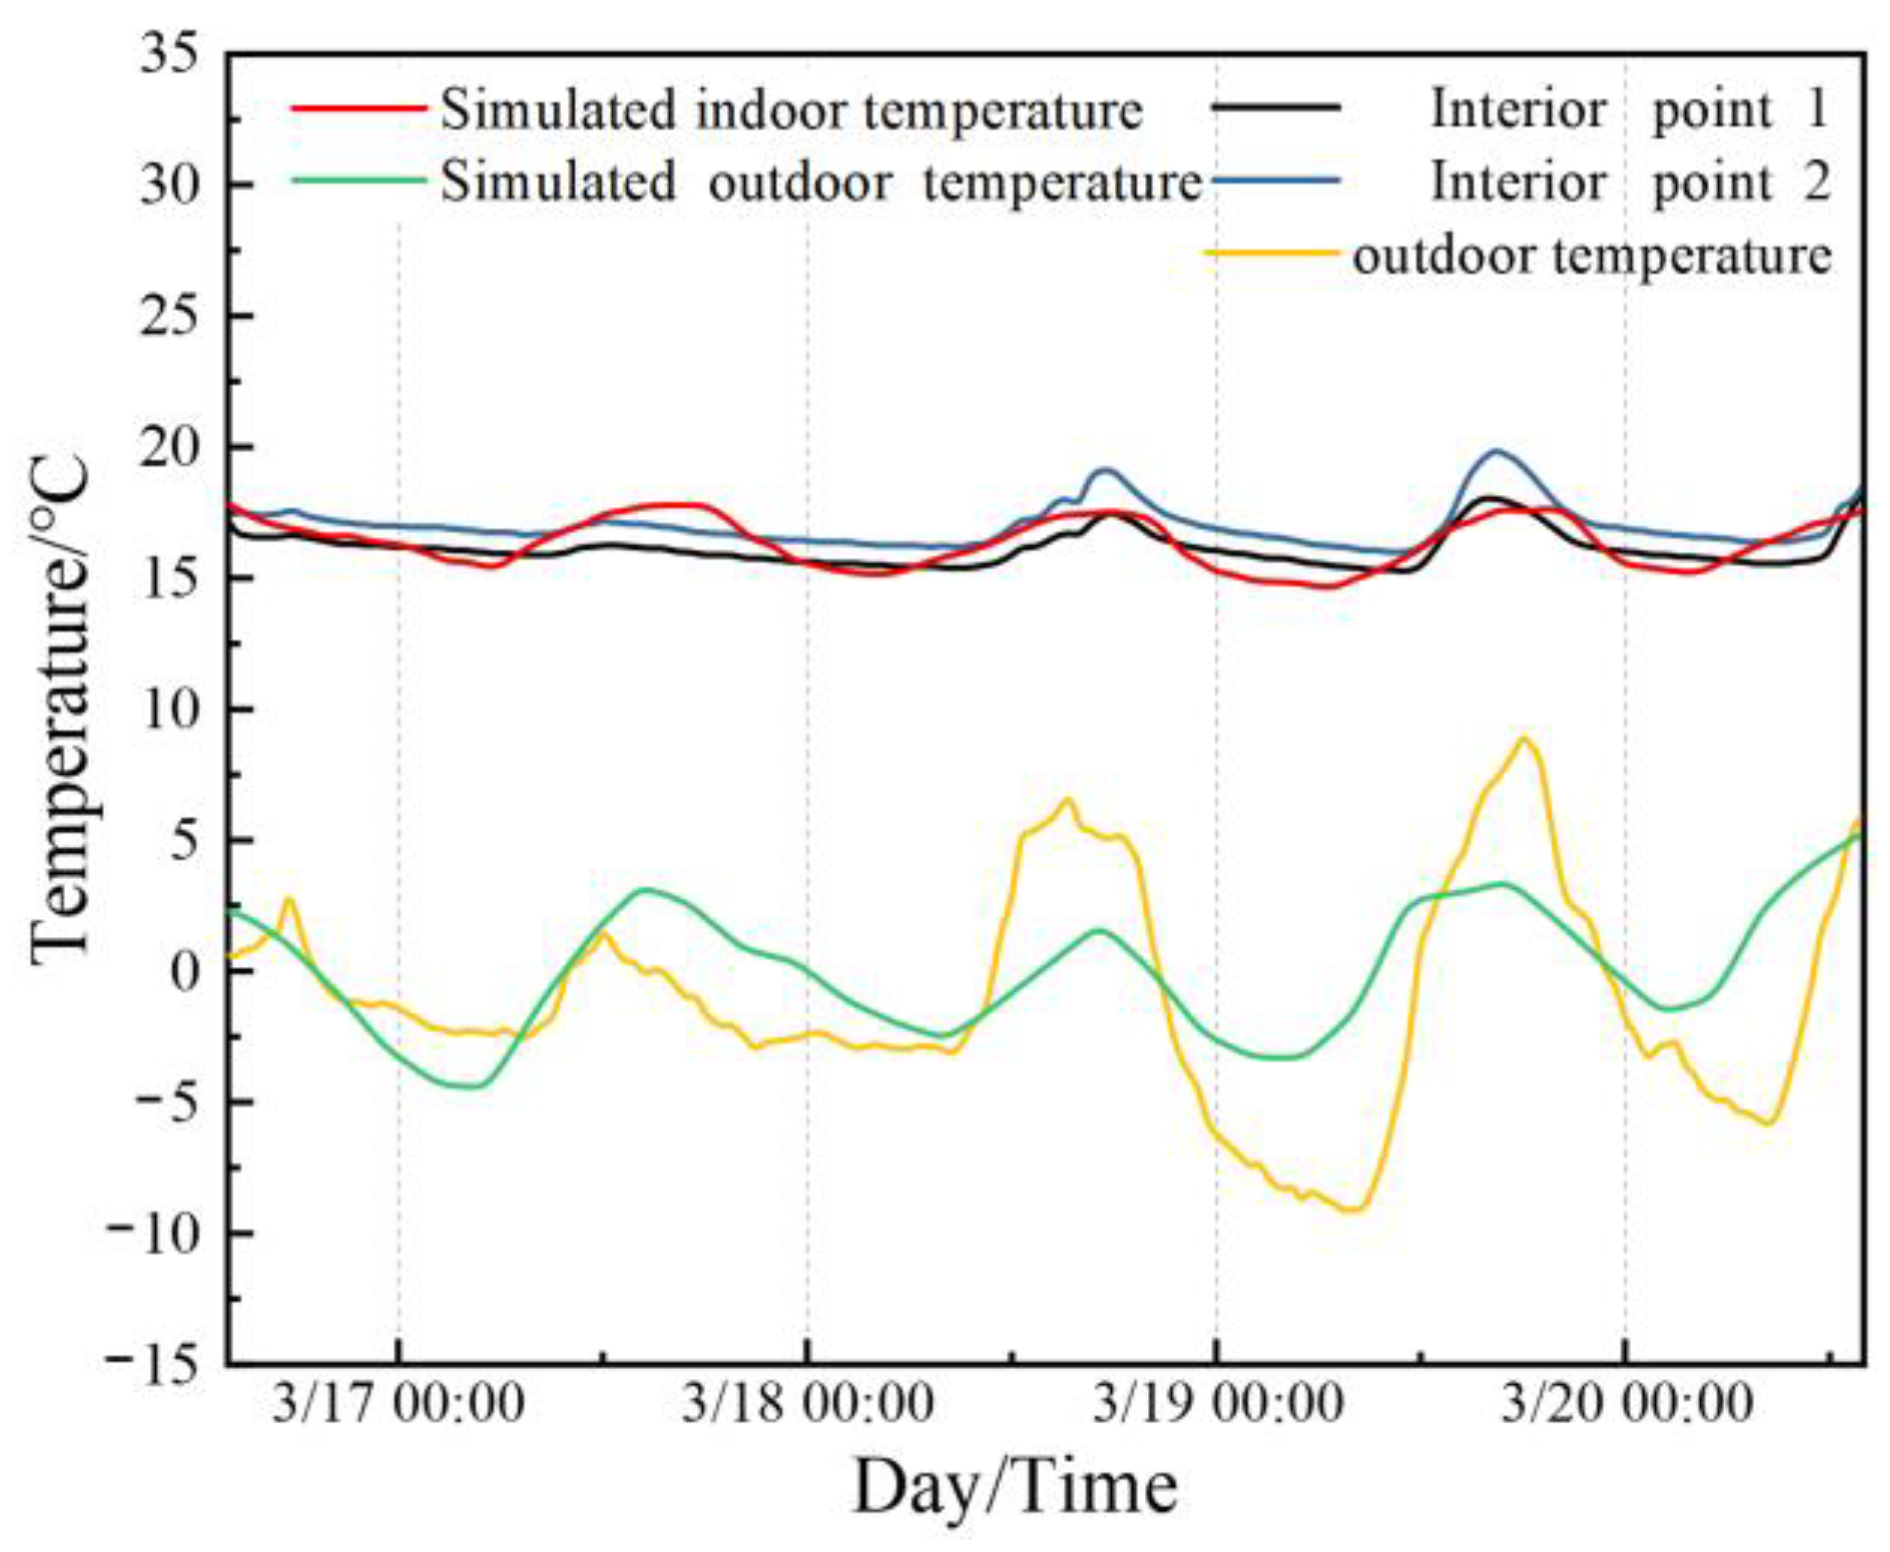
To better understand the indoor temperature of the hotel in winter, we used the temperature and humidity recorder to test the temperature changes inside and outside the reception room on the hotel’s second floor for four days, from March 16 to 20. To ensure the reliability of data recording, we set up two recorders to record data simultaneously. The indoor measuring point is arranged diagonally in the room, 1.2 m above the ground, as shown in Figure 6. The outdoor measuring point is set in a calm and ventilated place outside the window on the north side. The height of the measuring point is 6.6 m from the ground and 0.5 m from the external wall [31]. To avoid the influence of solar radiation on the test results, we wrapped a layer of aluminum foil around the temperature recorder. The test lasted for four consecutive days, from March 16 to 20. The temperature data are recorded every 30 min and the temperature curve was drawn according to the test results, as shown in Figure 7.
We can find from the analysis curve that the lowest outdoor temperature during the test was about −9.19 °C, which occurred at about 7:30 a.m. on the 19th of March when the indoor temperature was about 16.16 °C. About 4 h later, the indoor temperature drops to its lowest, 16.04 °C. During the test, the highest outdoor temperature was 8.5 °C, which occurred at around 6:30 p.m. on the 19th of March, when the indoor temperature was about 18.94 °C. However, the indoor temperature peaked at 19.69 °C at 5 p.m., and the temperature began to drop even though the outdoor temperature rose. The reason for this is the ineffectiveness of the heating system at this time the day. Overall, the average indoor temperature is about 16.13 °C, indicating that the hotel’s indoor temperature is still generally low in the case of heating in winter.

2.3. Retrofit and Simulation Methods for Old Buildings

In order to explore the most suitable renovation measures for heating buildings in cold regions, we simulated the effects of various renovation measures. Considering the difficulty and economy of the transformation, renovating the building envelope structure only included roof transformation, external wall transformation, door and window transformation, window and wall ratio adjustment, and the roof photovoltaic power generation system. In this study, we selected a typical old hotel in Urumqi as the simulation object and used the indoor temperature of a reception room and the annual heating energy consumption of the building as the simulation indicators, and used the well-known DesignBuilder computer simulation software for simulation. DesignBuilder is a comprehensive user interface simulation software designed for EnergyPlus, a dynamic simulation program for building energy consumption [32]. The version of DesignBuilder used in our study is 6.1.0.006. Firstly, we simulated the indoor temperature and energy consumption before retrofitting as the control group and compared the simulated data with the measured data to verify the model’s effectiveness. Secondly, following the principle of control variables, the indoor temperature, and heating energy consumption of the building after roof retrofit, exterior wall retrofit, door and window retrofit, and window–wall ratio adjustment were simulated as the experimental group. Finally, the effects of several measures applied simultaneously are simulated. After the simulation, the results of the control group and experimental groups were compared and analyzed to select the best reconstruction measures. Photovoltaic system software, PVsyst, which can also design and simulate the photovoltaic system and evaluate its performance to consider the utilization effect of clean energy was used as well [33]. The version of PVsyst is 7.2.

2.3.1. Simulation Parameter Setting

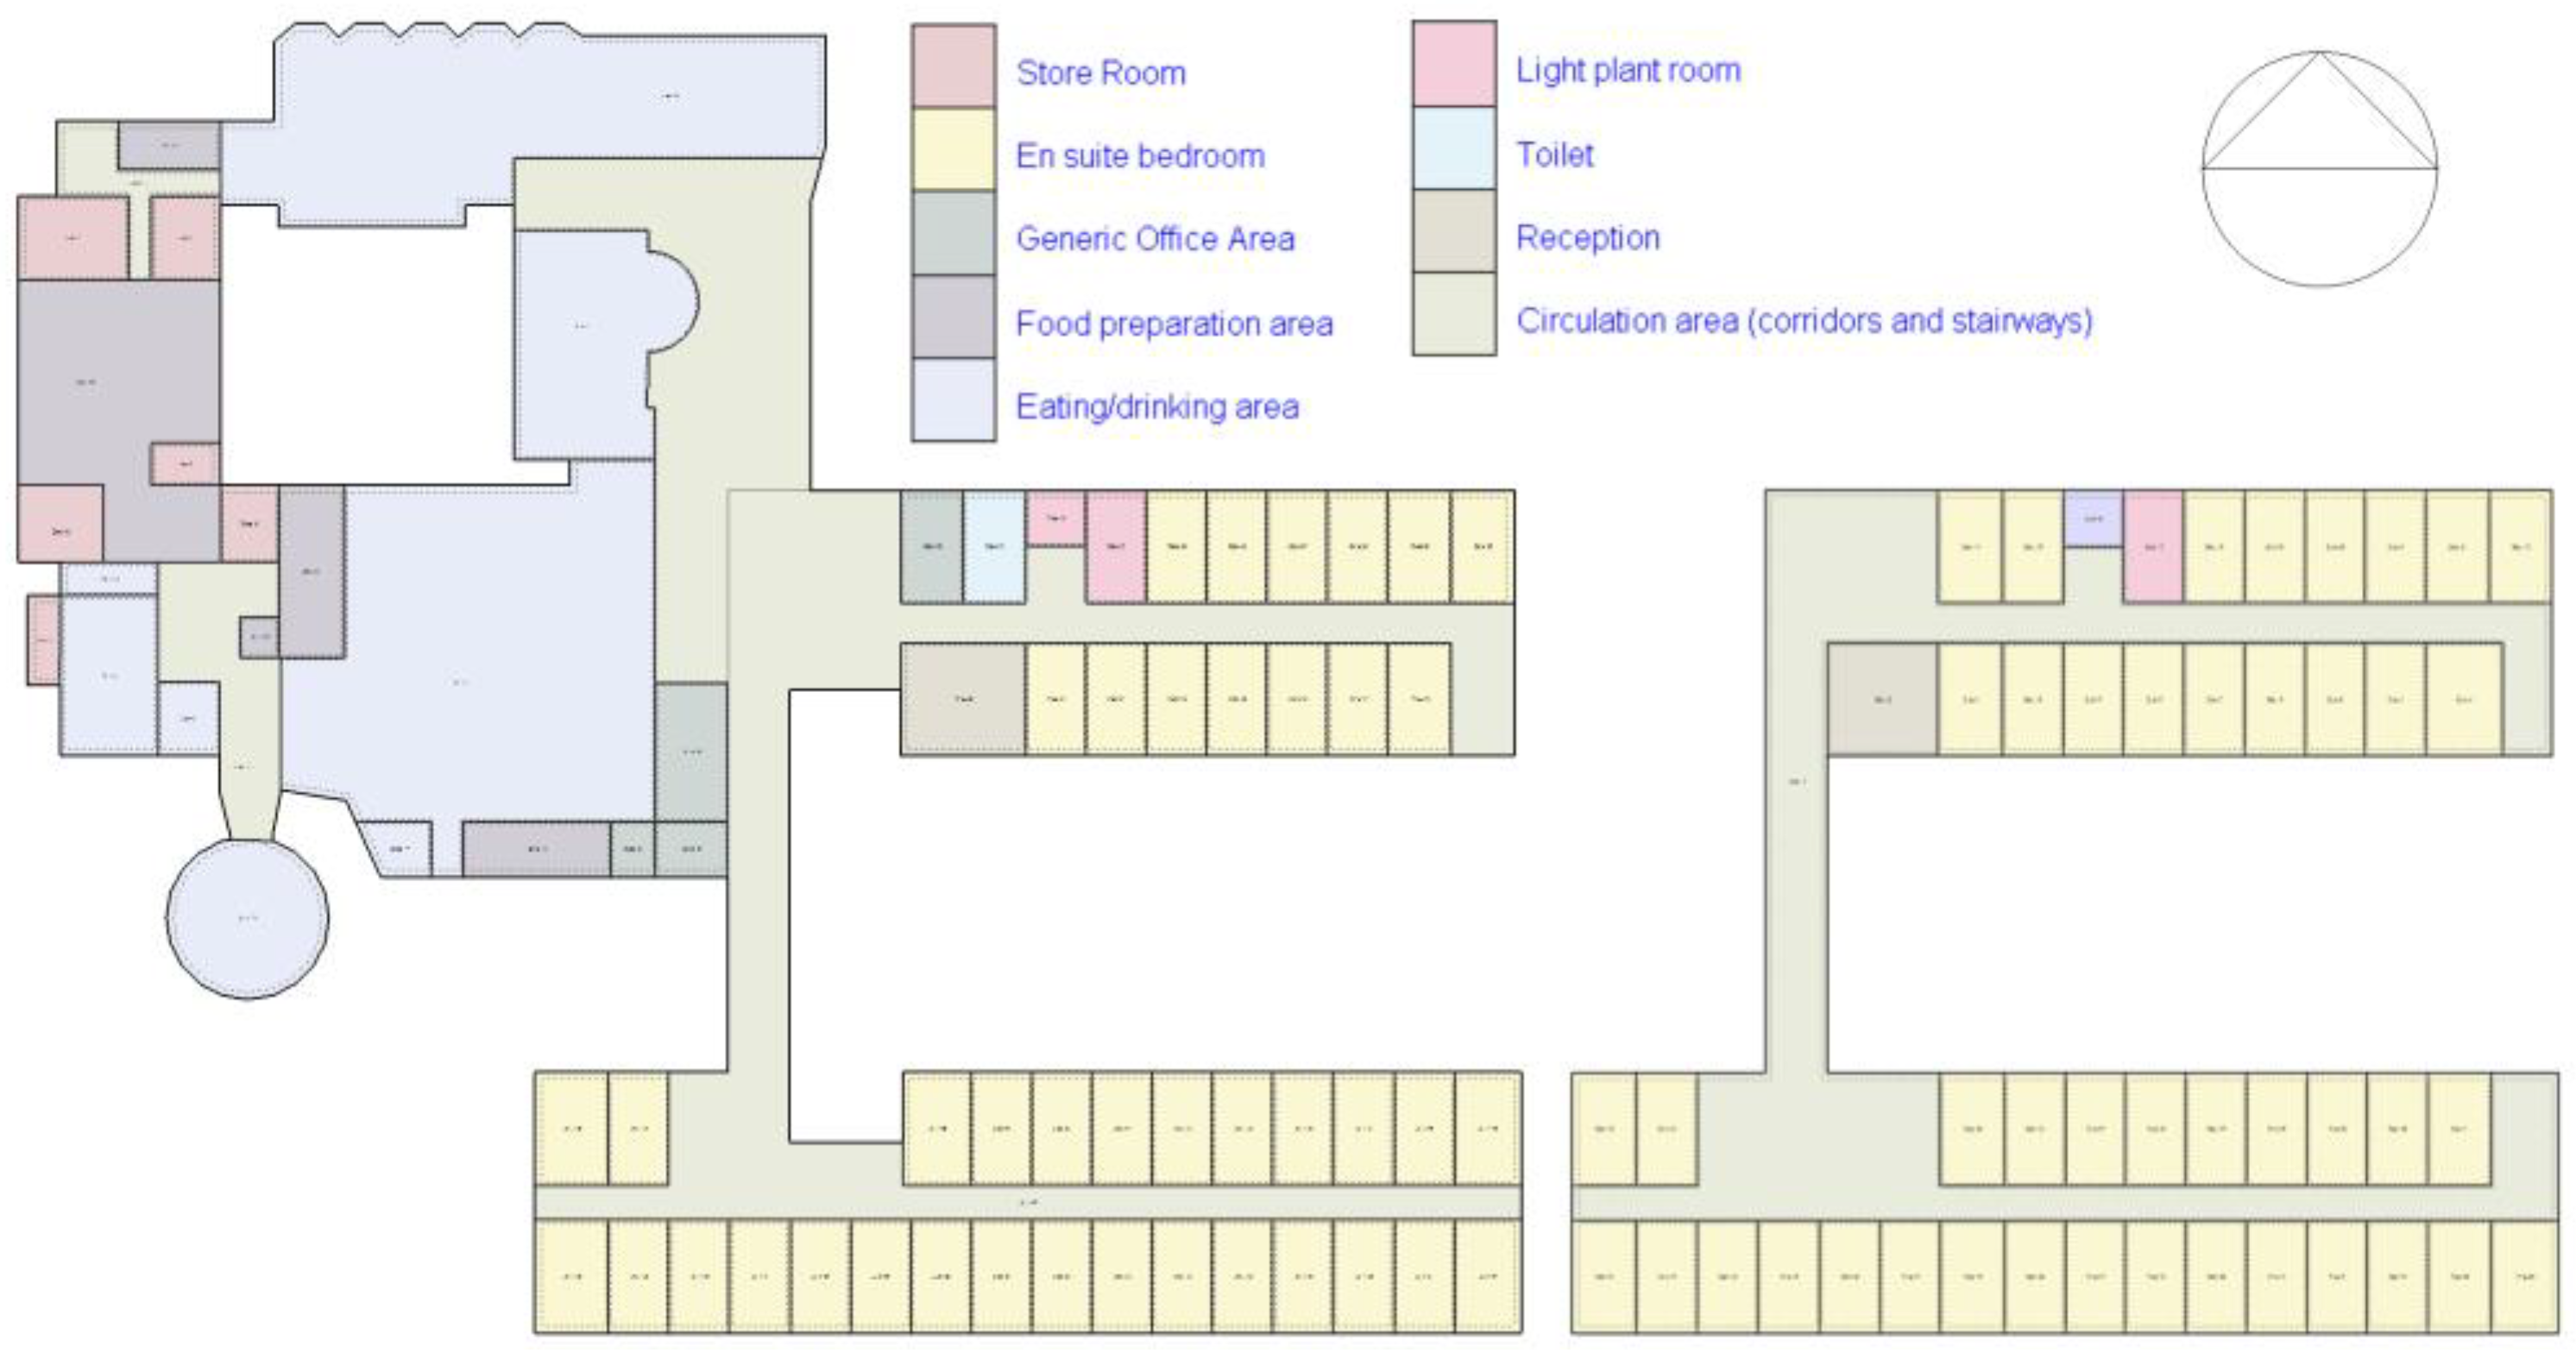
The hotel is a double-story building with a building area of 5519.3 m2. The first floor is 5.4 m high, and the second is 3.6 m high. The hotel is divided into the northwest’s first-floor catering area and the southeast’s second-floor guest room area. The analysis model is built using the DesignBuilder (The version number is 6.1.0.006) software based on the above basic information, as shown in Figure 8. Each room and area in the hotel was divided according to the actual function, as shown in Figure 9.
We calculated the relevant parameters according to the measured data and national design standards regarding model parameter setting
  • Meteorological parameters. This study used the typical meteorological data of Urumqi as stated in the China Standard Weather Data (CSWD) provided by the DesignBuilder software [34].
  • Envelope structure parameters. Parameters for roof, wall, windows, and doors are set.
  • HVAC design parameters. The building uses central heating with an energy efficiency ratio of 0.85. According to the national design standard of China, the indoor ventilation volume was 0.5 times/h, and the indoor heating temperature was 20 °C [35].
After setting the parameters, DesignBuilder was used first to simulate the indoor temperature of the reception room on the second floor of the building. The simulation dates were consistent with the actual temperature measurement for four consecutive days, from 16 to 20 March 2021. Then, the simulation data are compared with the measured data to verify the effectiveness of the simulation software and the parameters. Secondly, we simulate and calculate the hotel’s indoor thermal environment and annual cumulative heating energy consumption [36].
This paper uses the Chinese standard GB/T 50824 [37] to determine 18 °C as the critical value in winter and 26 °C as the critical value of thermal comfort in summer. According to the simulation results, the formula for calculating the annual thermal discomfort hours is as follows:
T D T = ( i = 1 n M S i + i = 1 n M W i ) / n
M S i indicates the number of uncomfortable hours of the i room in summer. M W i represents the number of uncomfortable hours of the i room in winter. Moreover, n is the number of rooms.

2.3.2. Retrofit Method and Simulation after the Retrofit

We used the DesignBuilder software to simulate the indoor temperature, heating energy consumption, and hours of discomfort during the heating season after retrofitting the roof, exterior wall, doors, and windows and adjusting the window–wall ratio. The heat transfer coefficient of each part of the reconstructed building and the window–wall ratio of each orientation should conform to the limits specified by the state.
The specific retrofit methods are as follows:
  • Retrofit of the roof: A new waterproof layer, 150 mm thick extruded polystyrene board, and a new covering layer are successively laid on the roof. After calculation, the heat transfer coefficient of the reconstructed roof is about 0.174 W/m2∙K, which meets the limit of the standard. Other parameters are the same as before.
  • Retrofit of the exterior wall: The outer wall tiles were removed, 110 mm EPS boards, cement mortar and a new covering layer were added, and then the external wall tiles were laid to restore the exterior wall appearance. The calculated heat transfer coefficient of the reconstructed exterior wall is about 0.29 W/m2∙K, which meets the limit of the standard. Other parameters are the same as before.
  • Retrofit of doors and windows: The exterior window was changed to a double glass plastic steel casement window with a heat transfer coefficient of 1.493 W/m2∙K. The outer door is changed to a plastic steel door. Other parameters are the same as before.
  • Adjusting the window–wall ratio of each orientation: The window–wall ratio of the south is 0.36, so it does not need to be adjusted. The window–wall ratio of east to west was adjusted to 0.3 and the window–wall ratio of north was adjusted to 0.25. Other parameters are the same as before.
  • After a separate simulation of all components, we simultaneously reform all the above schemes for the building. Other parameters are the same as before. In the simulations, it is assumed that the internal loads were not considered and that the windows and doors were closed.
After setting all the parameters, we simulate the above five modification schemes. Standard weather data were used in the simulation since only the outdoor temperature was recorded in the actual data. After the retrofit, we can obtain the indoor temperature, uncomfortable hours in the heating period, and the building heating energy consumption. We compare the effect of the retrofit measures with the data before the retrofit. Finally, combined with the current conditions of the hotel, we can use PV system software, PVsyst, to design and arrange the roof PV system and simulate the power generation efficiency and effect of the whole system.

3. Results

3.1. Reconstruction of the Enclosure Structure

3.1.1. Simulation Results and Model Validation before Modification

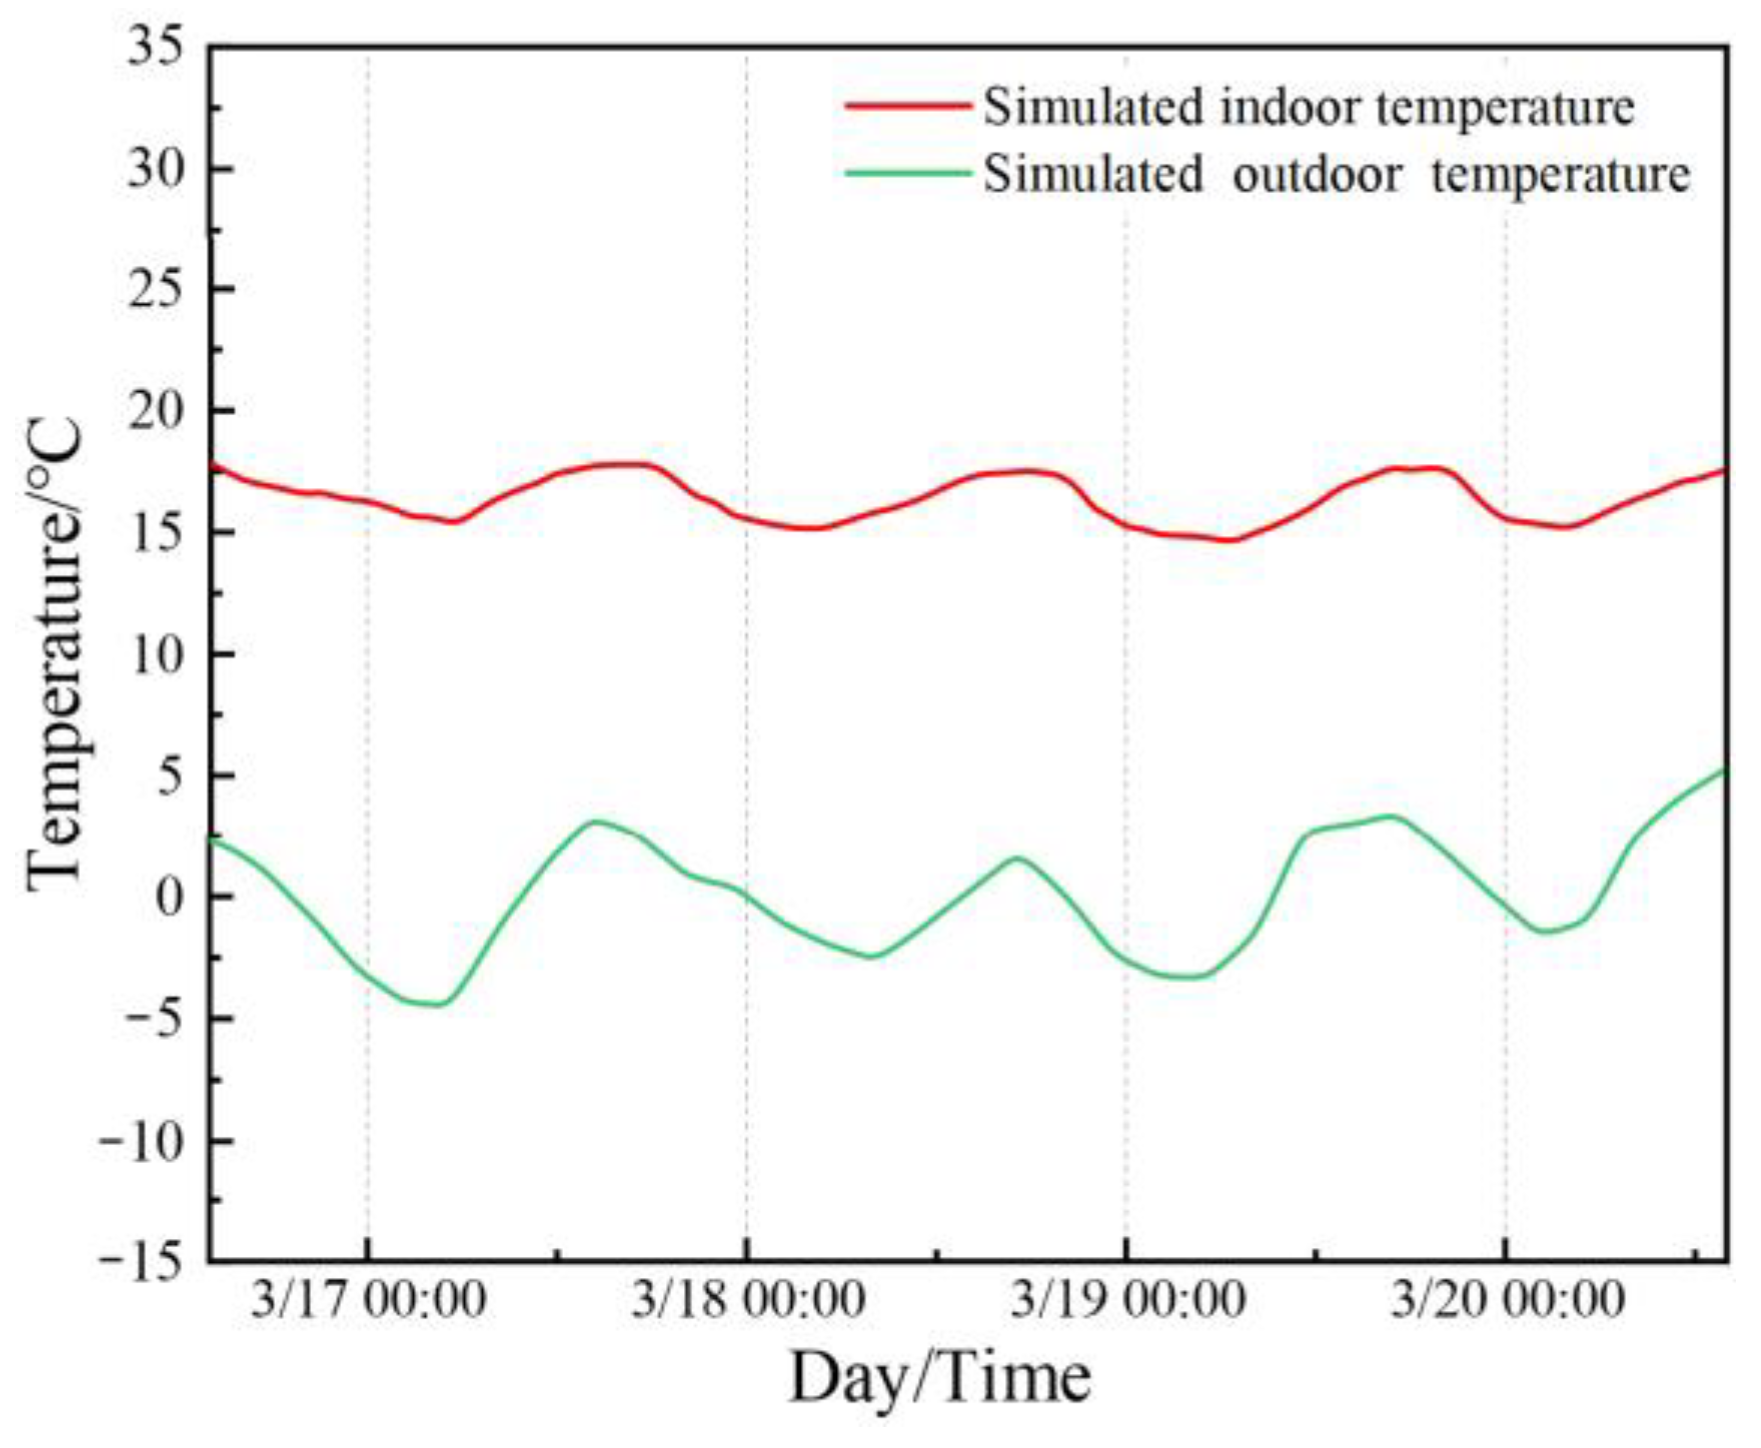
Figure 10 shows the simulated temperature of the reception room on the second floor for four consecutive days from March 16 to 20 before reconstruction. As seen in the figure, the outdoor temperature reached the lowest point at 6 a.m. on March 16, about −4.4 °C. At this time, the indoor temperature of the reception room is about 16.2 °C and it drops to the lowest of 15.4 °C one hour later. The simulation results show that the indoor temperature of the building is humble before the retrofit, which cannot meet the regular heating demand.
As shown in Figure 11, by comparing the measured data with the simulated results, we can find that the measured indoor temperature fluctuated wildly on 18 and 19 March due to the significant change in outdoor temperature because of weather change, and the measured temperature in other periods was consistent with the temperature fluctuation trend simulated by the software. The actual operation of the heating system cannot guarantee the expected results. The error caused by the aforementioned factors is unavoidable in practical measurement as many factors affecting indoor temperature cannot be considered in the simulation. Therefore, it is reasonable and reliable to conduct subsequent simulation analysis on the software parameters and the model.
The simulation results show that the building’s annual cumulative heating energy consumption per unit area is 213.9 kW∙h/m2. The yearly cumulative heating energy consumption is 1,180,694.4 kW∙h before the retrofit. The annual heating energy consumption of the hotel converted into standard coal is about 145.03 t [38]; the coal used for central heating boilers in China is bituminous. The heat exchange ratio between bituminous coal and standard coal is 1:0.92~1.27, and the conversion of 1 t of standard coal into bituminous coal is about 0.78~1.08 t. The market price of bituminous coal in China is CNY 1700 per ton, so the hotel’s annual heating bill is as high as CNY 246,000.

3.1.2. Simulation Results after the Retrofit

  • Retrofit of the roof: Figure 12 compares the indoor simulated temperature before and after the roof retrofit of the hotel. From the comparison, we can find that the average indoor temperature in the heating period increased by 0.9 °C after the retrofit, and the room temperature in summer was lower than before the retrofit. The indoor temperature throughout the year is more stabilized, and the uncomfortable hours in the heating period were reduced by 537.9 h, as shown in Table 5. After the retrofit, the building’s cumulative annual heating energy consumption is 835,014.29 kW∙h, and thus the annual heating energy consumption can be saved by 345,680 kW∙h, with an energy-saving rate of 29.3%.
2.
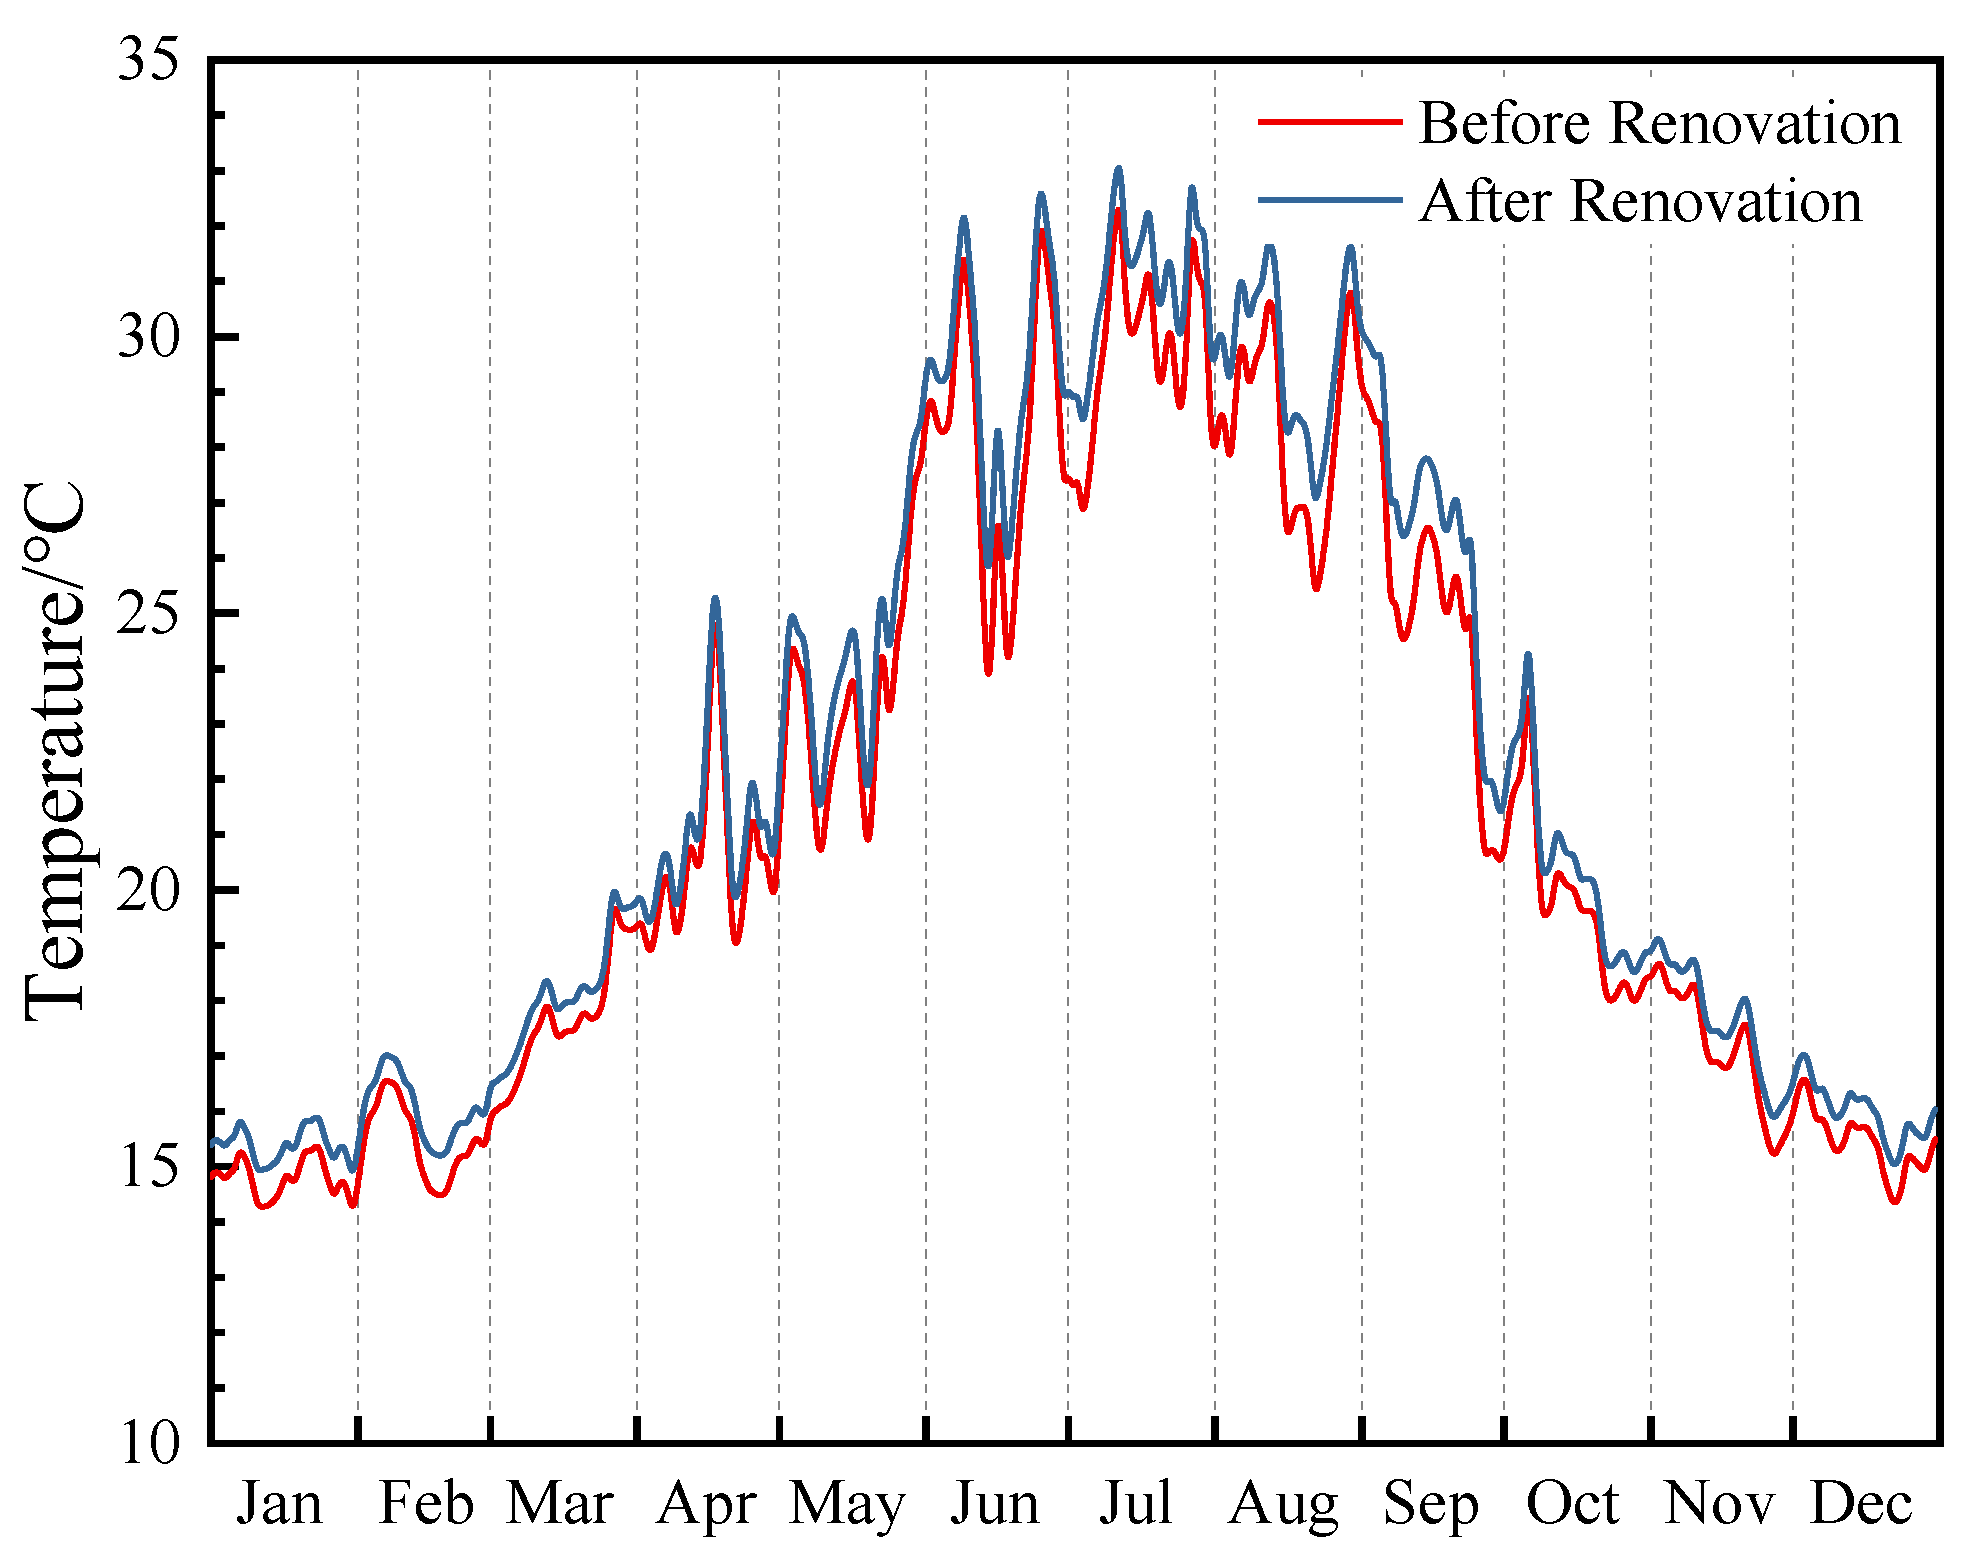
Retrofit of the exterior wall: Figure 13 compares the indoor simulated temperature before and after the exterior wall retrofit of the hotel. We can find that the average indoor temperature in the heating period increased by 0.6 °C after retrofit, and the summer temperature is slightly higher than before the reconstruction. The uncomfortable hours in the heating period were reduced by 469.4 h, as shown in Table 6. After the retrofit, the building’s cumulative annual heating energy consumption is 918,189.64 kW∙h, and thus the annual heating energy consumption can be saved by 262,504.7 kW∙h, with an energy-saving rate of 22.2%.
3.
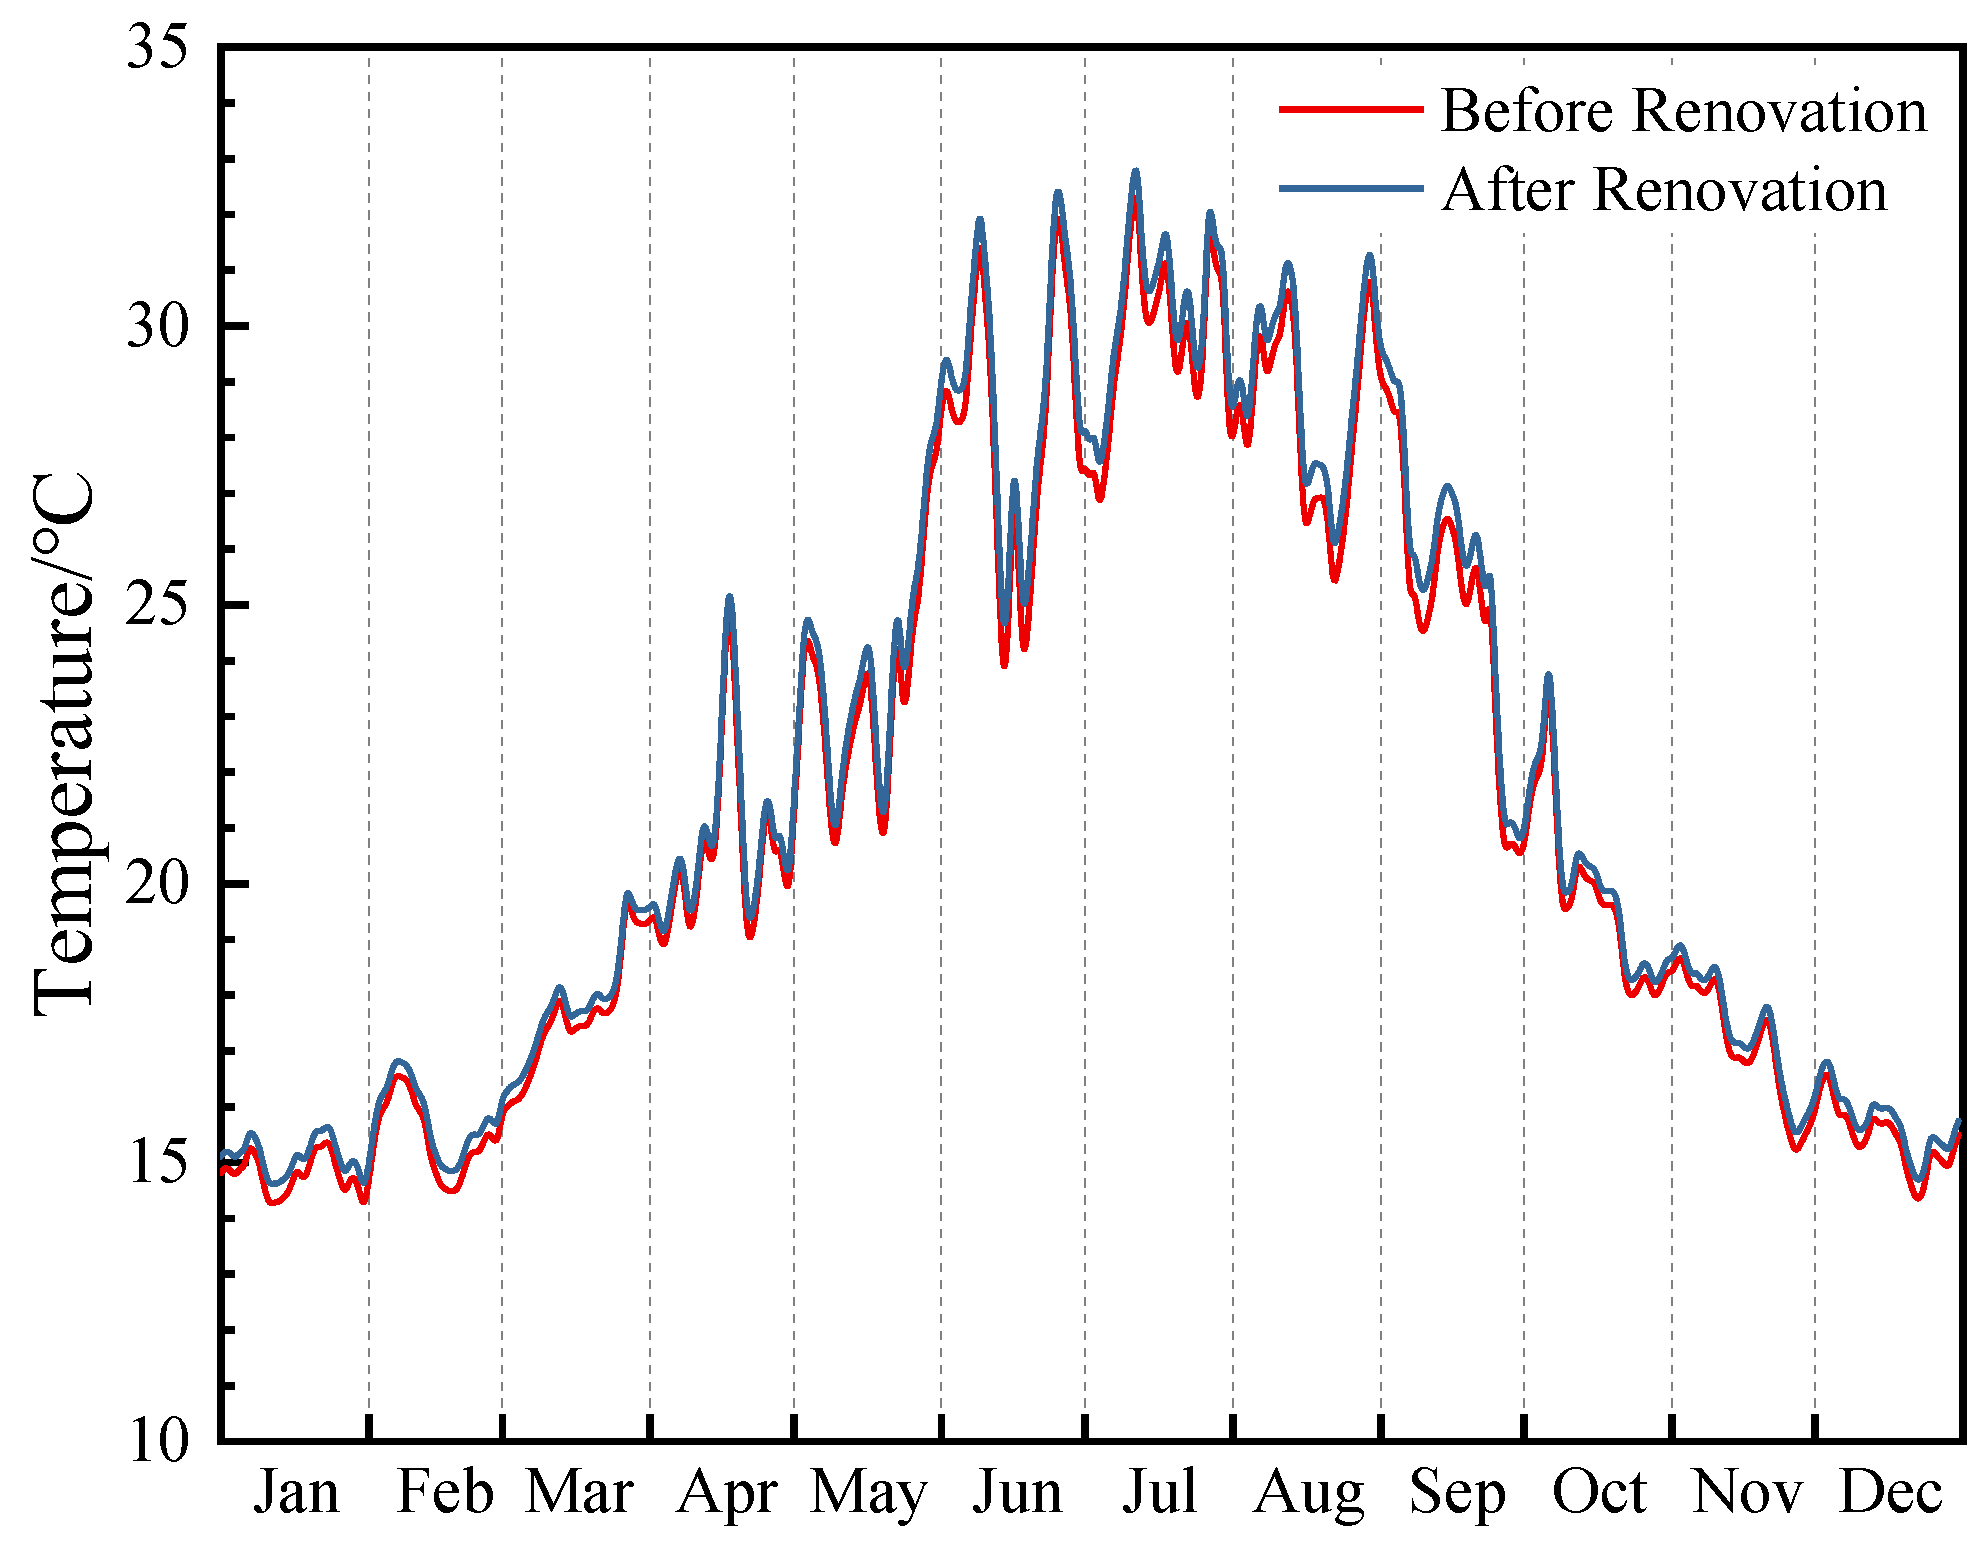
Retrofit of the doors and windows: Figure 14 compares the indoor simulated temperature before and after retrofit of the doors and windows of the hotel. We can find that the average indoor temperature in the heating period increased by 0.3 °C after the retrofit. The uncomfortable hours in the heating period were reduced by 318 h, as shown in Table 7. After the retrofit, the cumulative annual heating energy consumption of the building is 1,046,386.2 kW∙h, and thus the annual heating energy consumption can be saved by 134,308 kW∙h, with an energy-saving rate of 11.4%.
4.
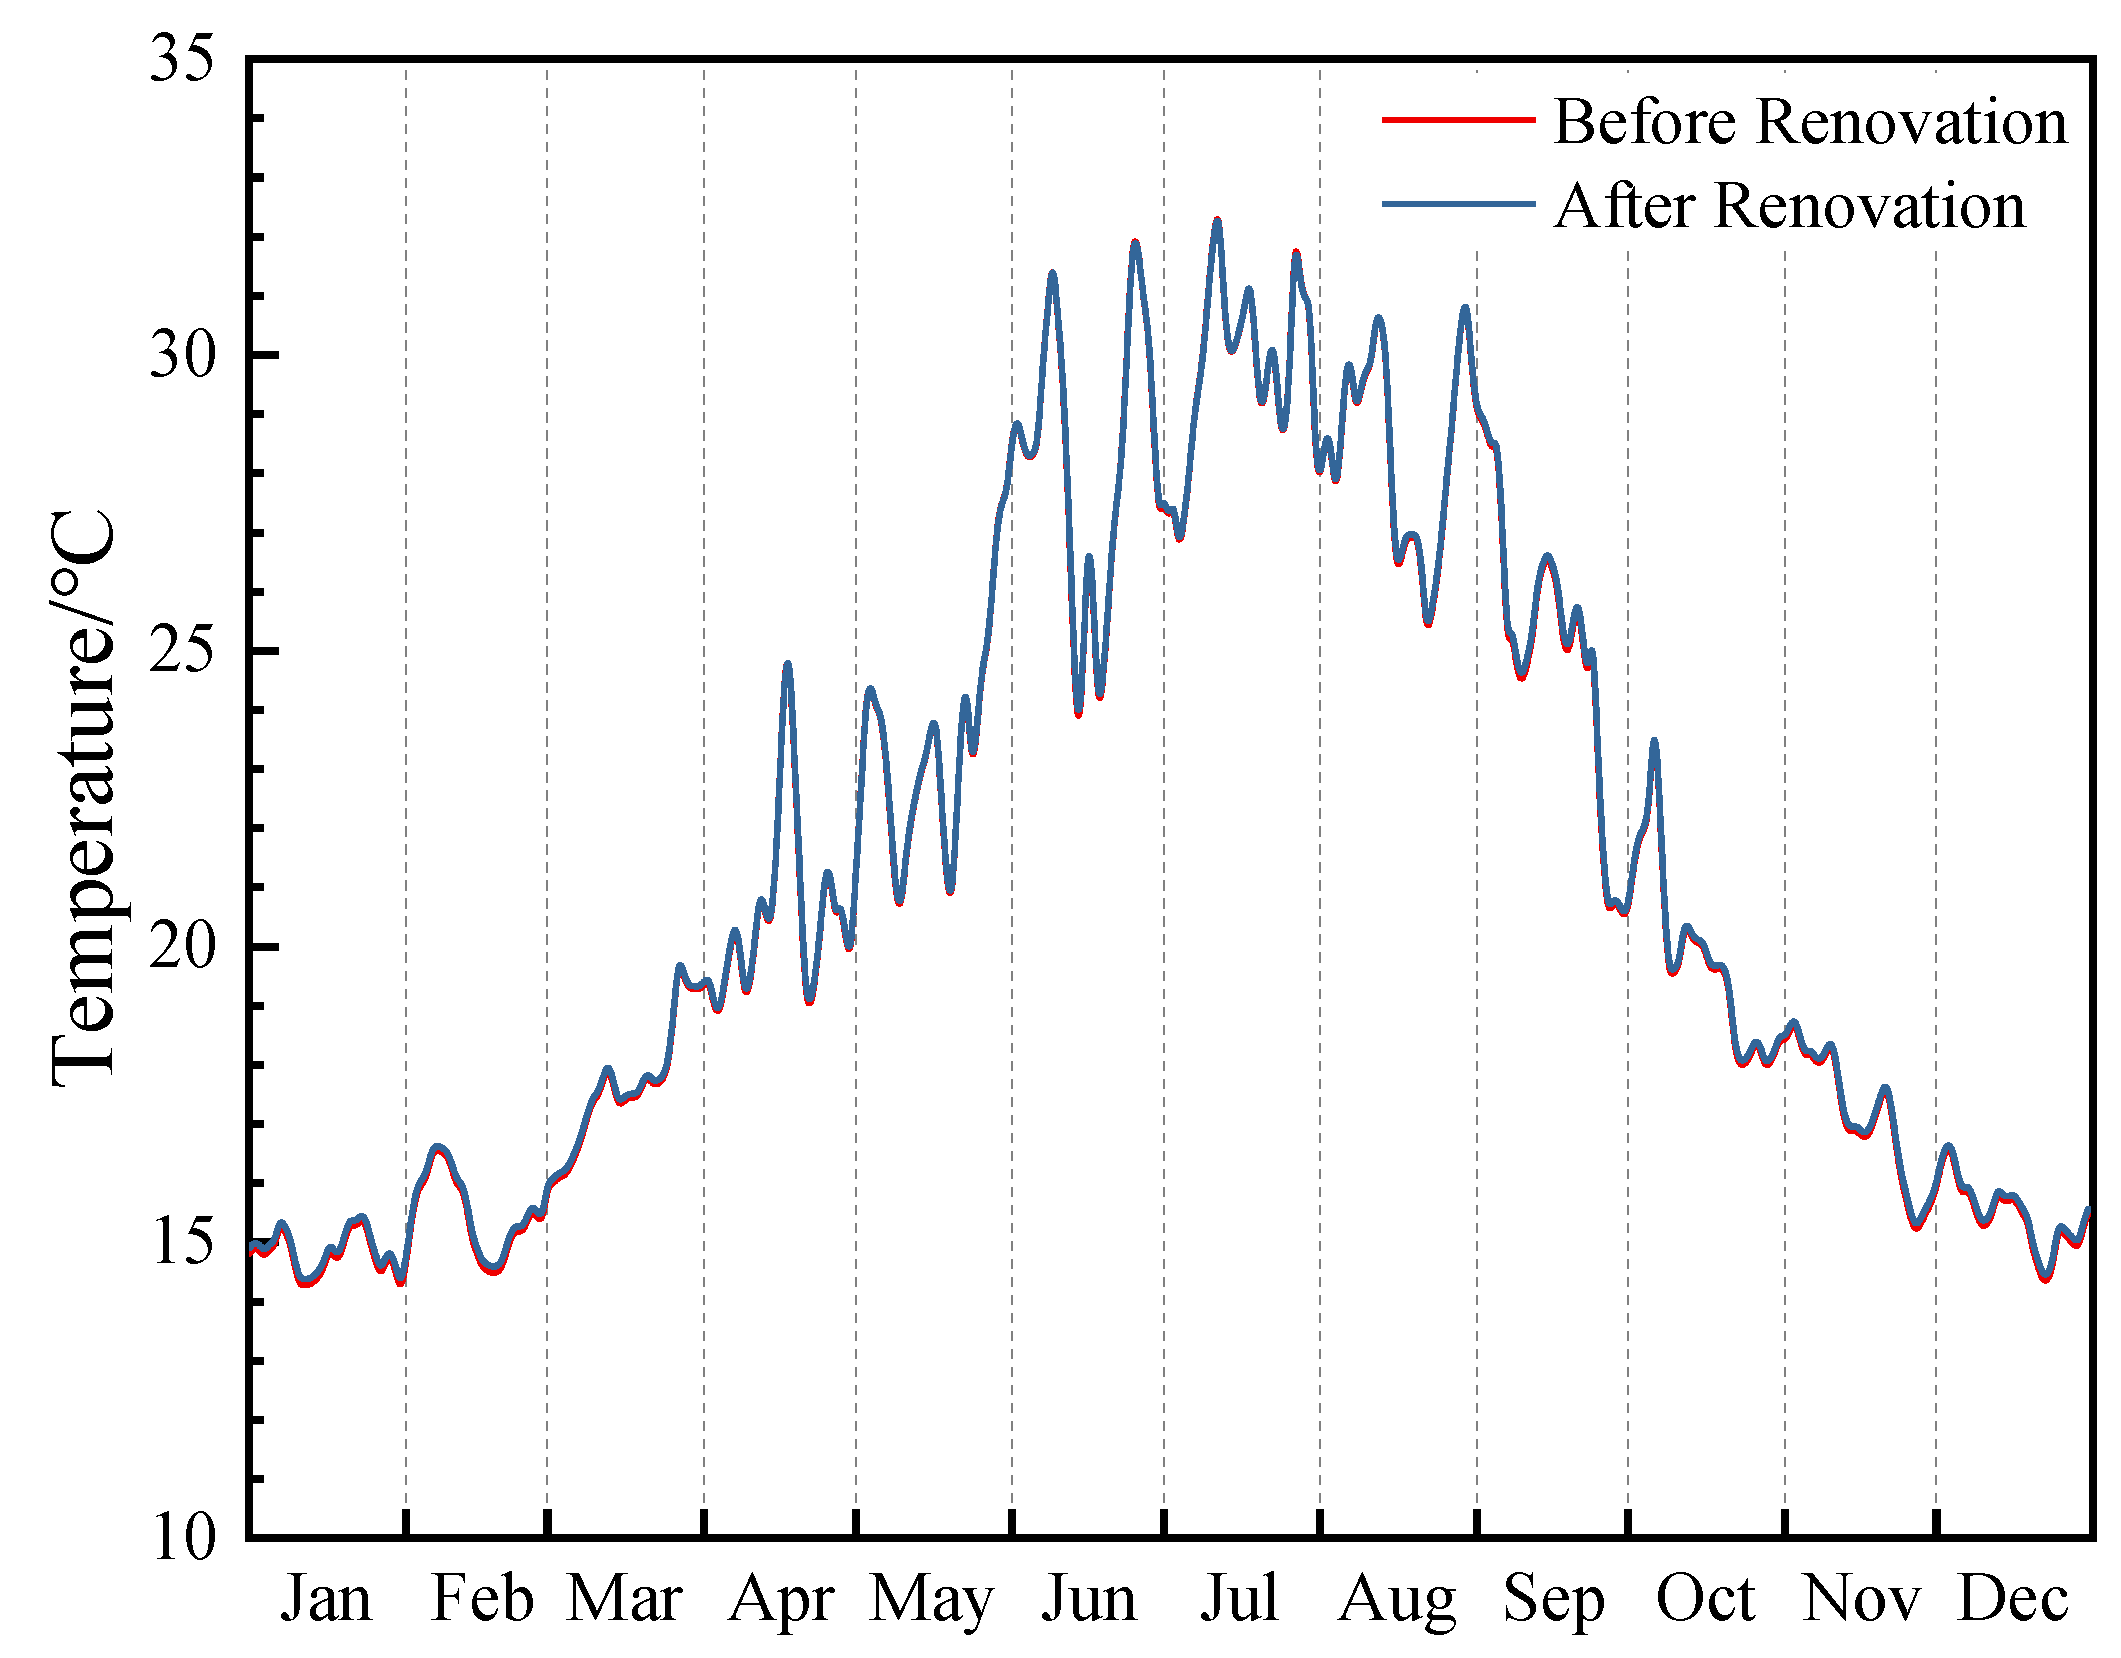
Adjustment of window–wall ratio in all directions: Figure 15 compares the indoor simulated temperature before and after adjusting the window–wall ratio of the hotel. From the comparison, we can find that the average indoor temperature in the heating period increased by 0.1 °C after retrofit, as shown in Table 8. There is almost no significant change, hence, the adjustment of the window–wall ratio has little influence on the indoor temperature. After the retrofit, the building’s cumulative annual heating energy consumption is 1,145,574.6 kW∙h, and thus the annual heating energy consumption can be saved by 207.5 kW∙h, with an energy-saving rate of 2.9%.
5.
The overall retrofit: Figure 16 shows the comparison of the indoor simulated temperature before and after the overall retrofit of the hotel. We can find that the average indoor temperature in the heating period increased by 2.3 °C after the retrofit, and the indoor temperature in winter reached a relatively comfortable state of 18 °C. However, the indoor temperature in summer is generally higher than that before the retrofit, with the highest temperature reaching 32.7 °C. The reason for this is that after retrofit, the heat transfer coefficient of the enclosure structure increases, and the indoor air tightness after transforming the doors and windows is enhanced. The indoor heat in summer cannot spread to the outdoors. Urumqi’s summer climate is relatively dry, so the temperature is still acceptable. Overall, the uncomfortable hours in the heating period are reduced by 900.3 h, as shown in Table 9. After the retrofit, the building’s cumulative annual heating energy consumption is 432,680.6 kW∙h, and thus the annual heating energy consumption can be saved by 748,014.4 kW∙h, with an energy-saving rate of 63.4%.

3.2. Utilization of Renewable Energy

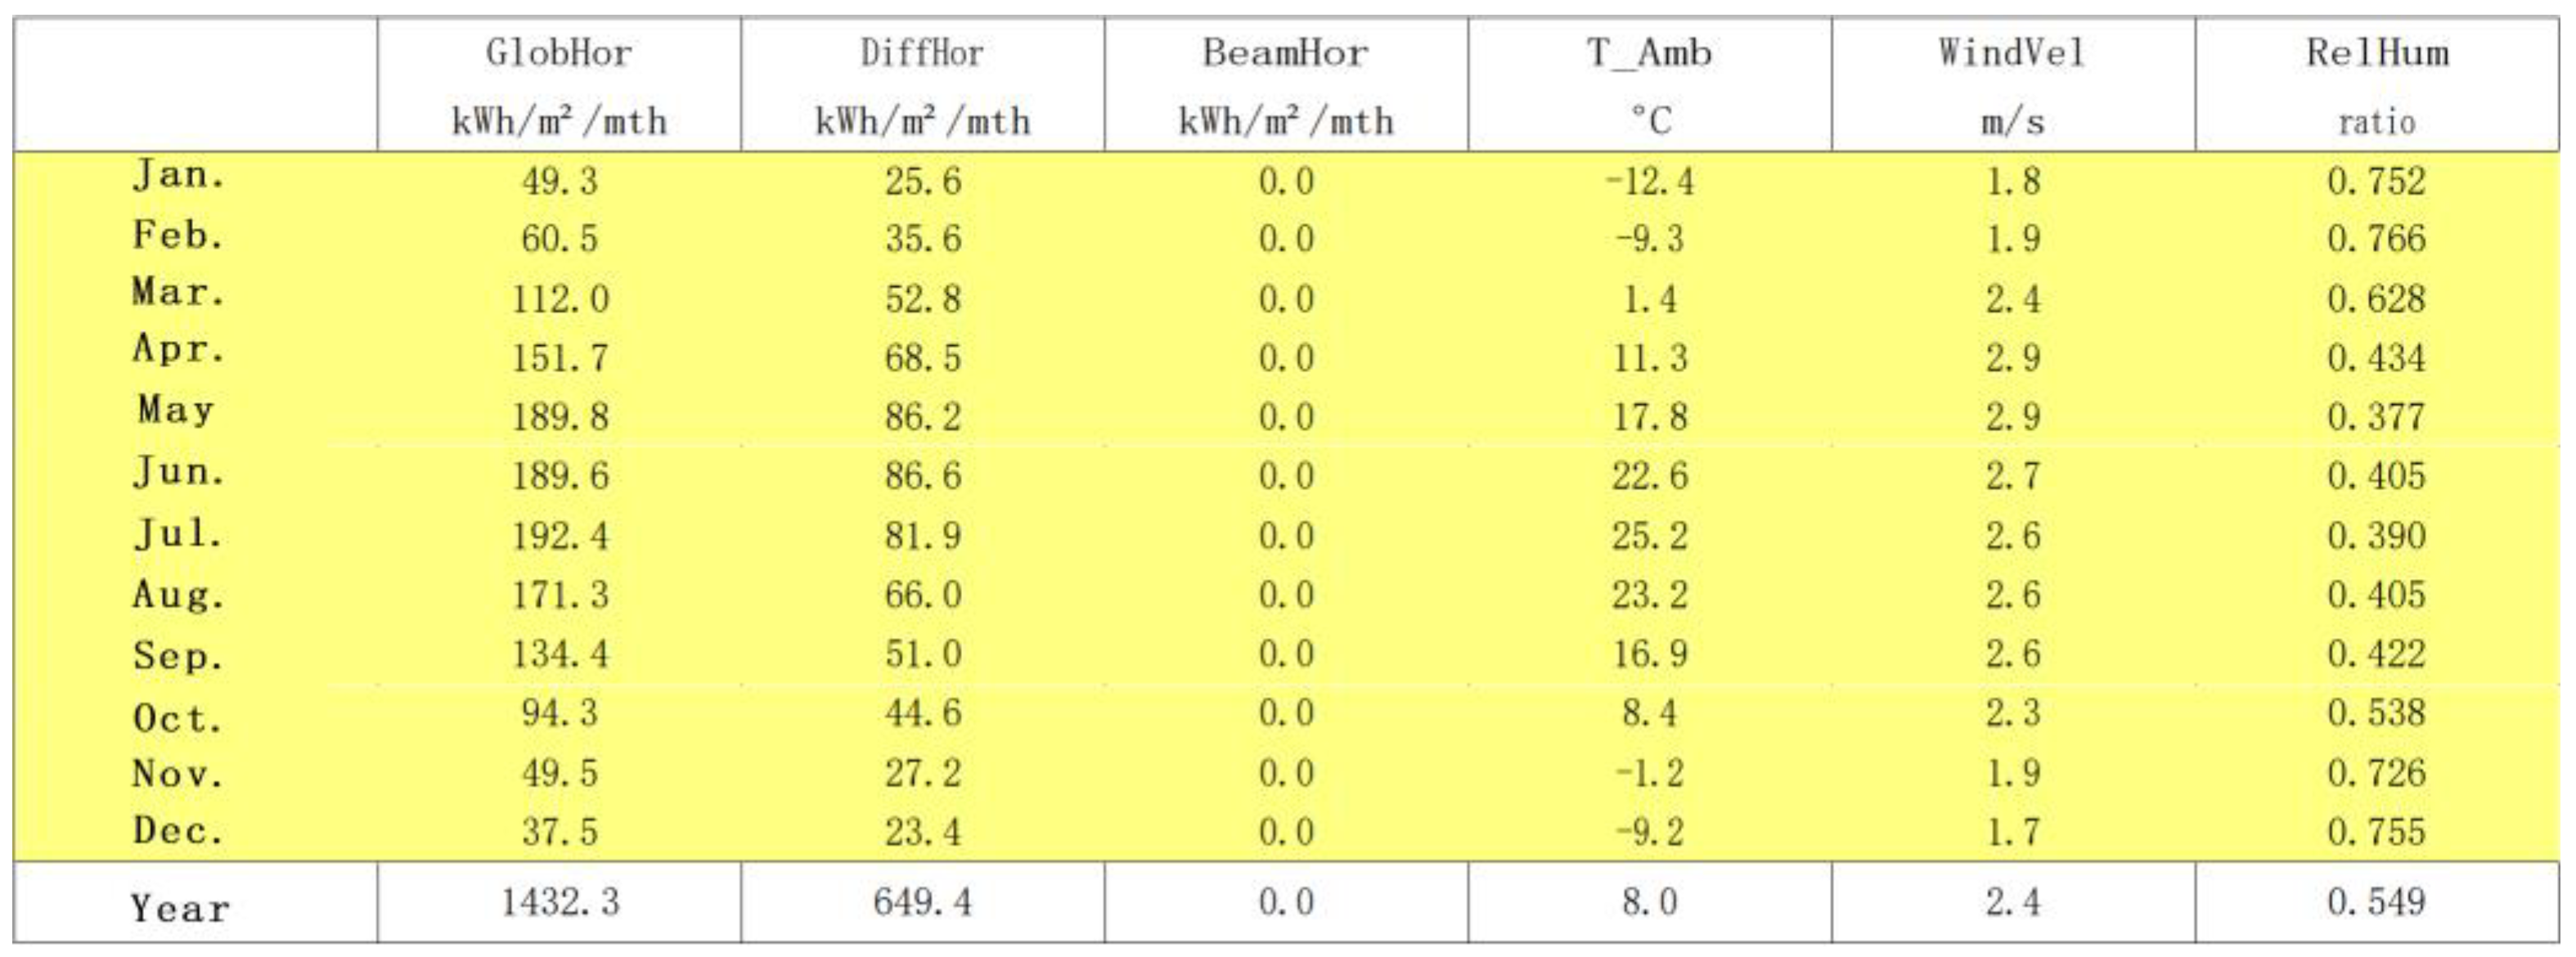
In recent years, increasing attention has been paid towards photovoltaic power generation and it has rapidly developed as one of the solutions to the problem of traditional energy shortage [39]. Photovoltaic power generation does not produce greenhouse gasses, wastewater, and other pollutants, and thus helps prevent environmental damage and meet the electricity demands to a certain extent. Urumqi is the farthest city from the sea in the world. It has a mid-temperate continental arid climate with less rainy weather [40]. Meteorological data show that the total annual radiation in Urumqi is 1432.3 kW∙h/m2, and the diffuse radiation is 649.4 kW∙h/m2. This highlights that Urumqi has rich solar energy resources, as shown in Figure 17.
According to the “Solar Energy Resources Assessment Method”, the Urumqi region is classified as a solar energy-rich zone based on the grades in Table 10 [41]. Solar radiation is low in winter and abundant from March to September. Thus, we can conclude that seven months of annual radiation higher than 110 kW∙h/m2 has a particular use-value, which is suitable for building a photovoltaic roof design.
Project design is the core part of the PVsyst software. The design simulates and calculates power generation by hour step [42]. According to the latitude of Urumqi, PVsyst calculated the optimal installation inclination angle of photovoltaic modules as 35°, as shown in Figure 18. The purple points in the figure correspond to the optimal inclination scheme. Since photovoltaic modules do not block each other, the distance between photovoltaic modules is calculated to be 4.5 m [43]. Regarding the actual shelter situation of the roof, we only installed photovoltaic modules on the roof of the guest room on the second floor. Combined with the distance between the photovoltaic modules and the size parameters of photovoltaic modules, we divided the hotel roof into two installation areas. The layout of the photovoltaic modules on the hotel roof is shown in Figure 19. As seen in the figure, there are 236 photovoltaic modules in the two areas, with an estimated total installed capacity of about 63.5 kW.
As seen in Table 11, the rooftop PV system can generate about 92.56 MW∙h of energy per year, which is equivalent to 7.84% of the building’s annual heating energy consumption before the retrofit. From March to October, power generation continues to maintain a high level of power generation, but power generation in winter is low. Combined with the simulation results of PVsyst, we can expect that the PV system will save 1893.6 t CO2 after 30 years of operation, as shown in Figure 20. The green line shows the annual carbon emissions.

4. Discussion

From the simulation results, we can find the annual proportion of uncomfortable indoor hours corresponding to different retrofit schemes, which is shown in Figure 21. After the hotel retrofit, the uncomfortable indoor hours during heating are significantly reduced. In terms of energy consumption, the comparison of annual heating energy consumption of different retrofit schemes is shown in Figure 22. The yellow area in the figure indicates the best solution for a single transformation. The green area in the figure represents the overall renovation plan. The energy-saving effect of the overall retrofit is the best, followed by the retrofit of the roof, exterior wall, doors, and windows and adjusting the window–wall ratio of each orientation. By reforming the enclosure structure, the annual heating energy consumption can be saved by 748,014.4 kW∙h, with an energy-saving rate of 63.4%. If economic conditions permit, we can install photovoltaic systems on roofs. The rooftop PV system can generate about 92.56 MW∙h of energy per year, equivalent to 7.84% of the building’s annual heating energy consumption before the retrofit. After the overall retrofit and installation of the rooftop PV system, the total energy saving was 840,574.4 kW∙h, with an energy-saving rate of 71.2%.

4.1. Concrete Retrofit Measures of Old Buildings

In the retrofit process of old buildings, renovating and optimizing the external envelope is indispensable. For old buildings of historical significance, caution should be exercised to ensure that the original structure is not altered completely while improving the insulation capacity of the envelope. Therefore, it is necessary to formulate targeted reform measures based on the status of the building. We propose the following measures:
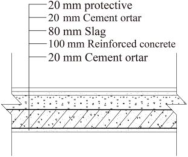
  • Retrofit of the roof: For flat-roofed buildings, an insulation layer on the roof can be laid. The advantages of this approach are good insulation, low cost, and fast construction. The specific method is to apply the waterproof layer first, then lay the insulation layers that meet the roof heat transfer coefficient limit, and finally lay the protective layer on the uppermost layer, as shown in Figure 23.
2.
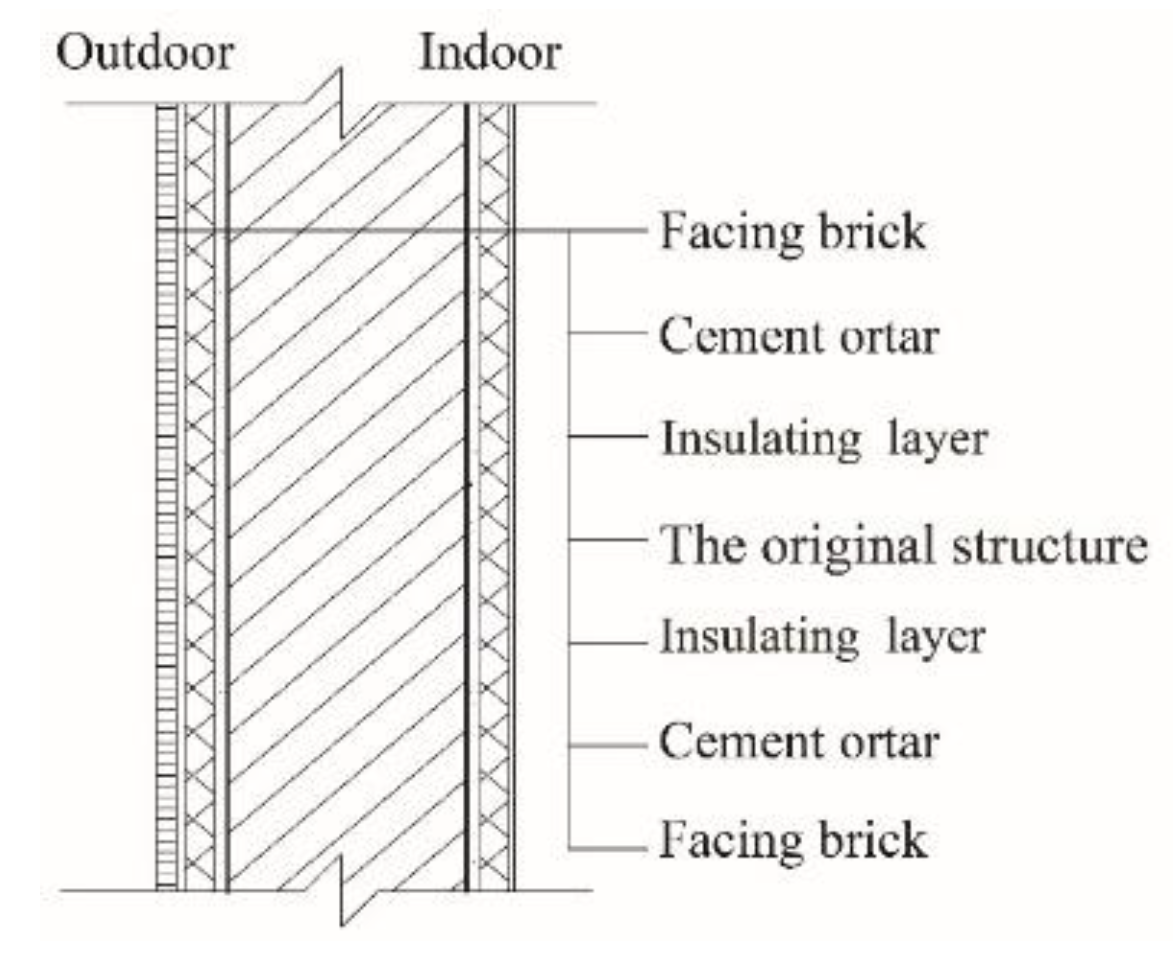
Retrofit of the exterior wall: The external surfaces of some old buildings have preservation value and thus they should be maintained as far as possible. Therefore, when the insulation layer is thick enough, we can lay it on the inner surface of the wall. Nevertheless, if the insulation layer is too thick, laying it on the inner surface of the wall will occupy too much indoor-use area. To prevent this, we can remove the building’s veneer layer, apply the insulation layer and then re-pave the original veneer layer. However, if the insulation layer is too thick and is laid all over the outer surface of the wall, it will change the image of the building. To avoid this, we can apply an insulation layer on both sides of the wall, then lay the cement mortar and the veneer layers, as shown in Figure 24. This method improves the walls’ insulation and preserves the building’s appearance to the greatest extent.
3.
Retrofit of the doors and windows: Old doors and windows with poor thermal insulation ability should be directly replaced with new doors and windows with better thermal insulation effect and better airtightness, and ensure that the original appearance of the building is not damaged as far as possible. One approach is to remove the inner window of the old double window and replace it with a new insulated window, as shown in Figure 25. One can also remove the old exterior window when economic conditions permit and install the double-layer insulating glass with excellent heat preservation performance, as shown in Figure 26. We can replace the outer door with a plastic steel spring door to ensure that the exterior door stays closed as long as possible.
4.
Adjustment of the window–wall ratio in all directions: Due to the lack of relevant specifications during construction, the window area in each direction of some old buildings is too large, which increases the heating energy consumption [44]. Adjusting the windows in all directions of old buildings to a reasonable size according to relevant specifications can effectively raise the indoor temperature in winter and reduce the heating energy consumption.
5.
Installment of a photovoltaic system on the roof: In the retrofit of old buildings, we can consider a photovoltaic power generation system on the roof, which is of great significance to reduce utility-supplied energy use, promote the application of green new energy and construct green and low-carbon buildings.

4.2. The Retrofit Path of Old Buildings

Not all regions in China have an equal status of economic development. Hence, while renovating old buildings one should take into account the actual local economic conditions. In other words, the retrofit path of old buildings should complement the local economic level.
For instance, in severe cold regions, to ensure energy-saving retrofit of old buildings, we can consider the re-construction of roof, exterior walls, doors, and windows, adjustment of the window–wall ratio in all directions, and installment of a rooftop photovoltaic power generation system. For the retrofit of old buildings with limited costs, the “step by step” process should be followed. That is, we should give priority to one effective measure, followed by other measures according to economic conditions, step by step. According to the above simulation results, we should prioritize the retrofit of the roof and the retrofit of the external walls, then the retrofit of doors and windows and finally the adjustment of the window–wall ratio. Finally, a photovoltaic power generation system can be installed on the roof when economic conditions permit.

5. Conclusions

Most old buildings in severely cold regions have low indoor temperatures and high heating energy consumption in winter. Thus, improving indoor comfort and saving energy consumption through a reasonable and practical energy-saving retrofit is necessary. The simulation results of this paper lead to the following conclusions:
  • The thermal performance of the envelope of most old buildings is poor, and the heat transfer coefficient of each part of the building is significant. Hence, the indoor temperature is low in winter, and the heating energy consumption is high. Therefore, we should carry out reasonable energy-saving retrofit in these buildings.
  • In a retrofit, the thermal insulation performance of the building envelope and the utilization of renewable energy are mainly considered. Additionally, we should avoid altering and destroying the original appearance of old buildings and retain its authentic value as far as possible. The specific retrofit measures are to transform the roofs, external walls, doors, and windows and set up a rooftop photovoltaic system to fully use the available local renewable energy.
  • Different regions in China have different levels of economic development, hence, local conditions should be fully considered while undertaking the energy conservation retrofit of old buildings. For areas with better economic conditions, we can carry out the overall retrofitting of the old buildings. On the other hand, we can adopt a “gradual reform” approach for regions with poor economic conditions. Our research demonstrated that in the process of energy-saving retrofitting of old buildings, we should first carry out the roof’s retrofit, followed by the retrofit of external walls, doors and windows, and the adjustment of window–wall ratio. In addition, when economic conditions permit, photovoltaic power generation systems can be installed on the roof.
To surmise, this paper considers only the reduction in building energy consumption and the optimization of indoor thermal environment comfort. However, other building factors, such as layout, life-cycle carbon emissions, economy, aesthetic modeling, and so on are not considered. Therefore, subsequent research should increase the optimization objectives involved in all aspects as much as possible to enhance the guiding value of the final optimization scheme.

Author Contributions

Conceptualization, X.L. and W.W.; methodology, X.L., W.W. and Y.Z.; software, X.L. and Y.Z.; validation, X.L. and Y.Z.; formal analysis, X.L. and Y.Z.; investigation, X.L. and Y.Z.; writing—original draft preparation, X.L.; writing—review and editing, X.L., W.W. and Y.Z. All authors have read and agreed to the published version of the manuscript.

Funding

This research received no external funding.

Institutional Review Board Statement

Not applicable.

Informed Consent Statement

Informed consent was obtained from all the subjects involved in the study.

Data Availability Statement

The datasets used and analyzed during the current study are available from the corresponding author on reasonable request.

Acknowledgments

This work was supported by the National Natural Science Foundation of China Study on Thermal Protection Mechanism and Tectonic System of Buildings in Turpan Area (Grant 431No. XJEDU2019I006).

Conflicts of Interest

The authors declare no conflict of interest.

References

  1. Liu, J. Research on the Trading Market Mechanism of Energy Saving and Low Carbon in China; Fudan University Press: Shanghai, China, 2010. [Google Scholar]
  2. Liu, Q.; Ren, J. Research on the building energy efficiency design strategy of Chinese universities based on green performance analysis. Energy Build. 2020, 224, 110242. [Google Scholar] [CrossRef]
  3. Liang, X.; Lin, S.; Bi, X.; Lu, E.; Li, Z. Chinese construction industry energy efficiency analysis with undesirable carbon emissions and construction waste outputs. Environ. Sci. Pollut. Res. 2020, 28, 15838–15852. [Google Scholar] [CrossRef] [PubMed]
  4. China Association of Building Energy Efficiency. China Building Energy Consumption Research Report 2020; China Association of Building Energy Efficiency: Beijing, China, 2020. [Google Scholar]
  5. Jing, Z. Analysis on the Countermeasures of Energy Saving Reconstruction of Existing Public Buildings in Shijiazhuang City. Master’s Thesis, Hebei University of Technology, Tianjin, China, 2011. [Google Scholar]
  6. Zhang, H. Investigation and Analysis of Energy Consumption of Existing Residential Buildings in Xi′an. Master’s Thesis, Xi’an University of Architecture and Technology, Xi’an, China, 2020. [Google Scholar]
  7. Li, Q.; Zhang, L.Y.; Zhang, L.M.; Wu, X.G. Optimizing energy efficiency and thermal comfort in building green retrofit. Energy 2021, 237, 121509. [Google Scholar] [CrossRef]
  8. Magda, P.; Do Rosario, V.M.; De Freitas, P.V. Towards Resilience and Sustainability for Historic Buildings: A Review of Envelope Retrofit Possibilities and a Discussion on Hygric Compatibility of Thermal Insulations. Int. J. Archit. Herit. 2019, 15, 807–823. [Google Scholar]
  9. Meng, D. Study on the Theory and Method of Urban Human Settlements Quality of Life Evaluation; Atomic Energy Publishing House: Vienna, Austria, 2003. [Google Scholar]
  10. Huang, J.; Lu, H. Optimization of thermal performance of existing residential building envelope energy saving reconstruction. Civ. Archit. Environ. Eng. 2013, 35, 118–124. [Google Scholar]
  11. Qi, F.; Cui, F.; Lv, W. Regional similarity of shape coefficient of rural residences—Taking Hangzhou rural region as a case. Build. Simul. 2019, 12, 597–604. [Google Scholar] [CrossRef]
  12. Bing, W. Research on Energy Saving Design Strategy of Small Town Housing in Cold Area. Master’s Thesis, Tianjin University, Tianjin, China, 2005. [Google Scholar]
  13. Ahmed, A.; Mateo-Garcia, M.; McGough, D.; Gaterell, M. Methodology for Evaluating Innovative Technologies for Low-Energy Retrofitting of Public Buildings. Energy Procedia 2017, 112, 166–175. [Google Scholar] [CrossRef]
  14. Dehwah, A.H.A.; Krarti, M. Impact of switchable roof insulation on energy performance of US residential buildings. Build. Environ. 2020, 177, 106882. [Google Scholar] [CrossRef]
  15. Wang, Y.; Dong, L.; Li, H. Economic Evaluation of Energy-Saving Retrofit of Existing Hotels. Energies 2022, 15, 757. [Google Scholar] [CrossRef]
  16. Wang, R.; Wang, T.; Qian, Y. Comprehensive analysis of the influence of the shape of multi-storey residence on building energy efficiency. Build. Technol. 2010, 41, 276–279. [Google Scholar]
  17. Xiong, K.; Yang, Z. Energy-saving Renovation of Bayu Traditional Residence: Taking Anju Town of Chongqing as the Example. Procedia Eng. 2017, 180, 687–696. [Google Scholar] [CrossRef]
  18. Chen, J.; Du, T. Study on low energy consumption design strategy of rural housing in cold region of Northeast China. J. Archit. 2016, 1, 22–28. [Google Scholar]
  19. Liu, L.; Moshfegh, B.; Akander, J.; Cehlin, M. Comprehensive investigation on energy retrofits in eleven multi-family buildings in Sweden. Energy Build. 2014, 84, 704–715. [Google Scholar] [CrossRef]
  20. Foda, E.; El-Hamalawi, A.; Dréau, J.L. Computational analysis of energy and cost efficient retrofitting measures for the French house. Build. Environ. 2020, 175, 106792. [Google Scholar] [CrossRef]
  21. Wang, Z.; Zhao, Z.; Lin, B. Residential heating energy consumption modeling through a bottom-up approach for China’s Hot Summer–Cold Winter climatic region. Energy Build. 2015, 109, 65–74. [Google Scholar] [CrossRef]
  22. Friess, W.A.; Rakhshan, K.; Hendawi, T.A.; Tajerzadeh, S. Wall insulation measures for residential villas in Dubai: A case study in energy efficiency. Energy Build. 2011, 44, 26–32. [Google Scholar] [CrossRef]
  23. Liu, S.; Wang, Y.; Liu, X.; Yang, L.; Zhang, Y.; He, J. How does future climatic uncertainty affect multi-objective building energy retrofit decisions? Evidence from residential buildings in subtropical Hong Kong. Sustain. Cities Soc. 2023, 92, 104482. [Google Scholar] [CrossRef]
  24. Lin, Z.; Hong, T.; Xu, X.; Chen, J.; Wang, W. Evaluating energy retrofits of historic buildings in a university campus using an urban building energy model that considers uncertainties. Sustain. Cities Soc. 2023, 95, 104602. [Google Scholar] [CrossRef]
  25. Ministry of Construction of the People’s Republic of China. Climatic Zoning Standards for Buildings; China Planning Press: Beijing, China, 1994. [Google Scholar]
  26. Wang, X. Xinjiang Friendship hotel No. 3 building design brief. Archit. J. 1985, 61–65, 85–86. [Google Scholar]
  27. Ministry of Housing and Urban-Rural Development. Standard for Energy Efficiency Design of Residential Buildings in Frigid and Cold Regions; Ministry of Housing and Urban-Rural Development: Beijing, China, 2010. [Google Scholar]
  28. XJJ 001-2021; Energy Efficiency Design Standards for Residential Buildings in Cold and Cold Areas. Department of Housing and Urban-Rural Development. Xinjiang Uygur Autonomous Region: Xinjiang, China, 2021.
  29. Liu, Y.; Meng, S.; Du, Z. Air tightness is a key factor in the realization of passive low energy buildings. Constr. Sci. Technol. 2015, 21–23. [Google Scholar]
  30. Chongqing Building Energy Conservation Center. Home Energy Conservation and Environmental Protection Guide; Chongqing University Press: Chongqing, China, 2012. [Google Scholar]
  31. Zhu, Y.; Wang, H.; Chang, X. The Central Air Conditioning; Posts and Telecommunications Press: Beijing, China, 2003. [Google Scholar]
  32. Kateřina, S.; Nikola, V. Assessment of the Summer Thermal Stability of the Attic Room Using Two Different Software. Civ. Environ. Eng. 2020, 16, 360–369. [Google Scholar]
  33. Berardinis, P.D.; Rotilio, M.; Capannolo, L. Energy and Sustainable Strategies in the Renovation of Existing Buildings: An Italian Case Study. Sustainability 2017, 9, 1472. [Google Scholar] [CrossRef] [Green Version]
  34. Karimi, M.S.; Fazelpour, F.; Rosen, M.A.; Shams, M. Comparative study of solar-powered underfloor heating system performance in distinctive climates. Renew. Energy 2019, 130, 524–535. [Google Scholar] [CrossRef]
  35. Zhang, G.; Zhang, Q.; Wang, F.; Lin, Q.; Liang, R. Study on the influencing factors of energy consumption of traditional residential houses in Kangding rural area based on DesignBuilder. Build. Sci. 2019, 35, 108–115. [Google Scholar]
  36. People’s Government of Urumqi, Xinjiang, China. Regulations of Urumqi on Urban Heat Management. Urumqi Evening News, 13 June 2013. [Google Scholar]
  37. GB/T 50824; Energy Saving Design Standards for Rural Residential Buildings. Ministry of Housing and Urban-Rural Development: Beijing, China, 2013.
  38. Department of Energy Statistics, National Bureau of Statistics. China Energy Statistical Yearbook; China Statistics Press: Beijing, China, 2012. [Google Scholar]
  39. Celadyn, W.; Filipek, P. Investigation of the Effective Use of Photovoltaic Modules in Architecture. Buildings 2020, 10, 145. [Google Scholar] [CrossRef]
  40. Liu, H.; Li, L.; Xu, D. The way of creating urban green space habitat under the influence of natural environment conditions in northwest China. J. Xi’an Univ. Archit. Technol. Nat. Sci. Ed. 2016, 48, 556–561+567. [Google Scholar]
  41. GB/T37526-2019; Assessment Method for Solar Energy Resource. China Meteorological Administration: Beijing, China, 2019.
  42. David, G.; Ignacio, G.; Montserrat, D.; Isabel, D.M.; Cristina, A. Photovoltaic Prediction Software: Evaluation with Real Data from Northern Spain. Appl. Sci. 2021, 11, 5025. [Google Scholar]
  43. Bamboo, Z.X.; Yong, Y.C. Research on rooftop pv design evaluation based on PVSYST. J. Shenyang Inst. Eng. Nat. Sci. Ed. 2019, 15, 20–24. [Google Scholar]
  44. Yang, Q.; Liu, M.; Shu, C.; Mmereki, D.; Hossain, M.U.; Zhan, X.; Lauriat, G. Impact Analysis of Window-Wall Ratio on Heating and Cooling Energy Consumption of Residential Buildings in Hot Summer and Cold Winter Zone in China. J. Eng. 2015, 2015, 538254. [Google Scholar] [CrossRef] [Green Version]
Figure 1. The current situation of the hotel.
Sustainability 15 09926 g001
Figure 2. General layout plan of the hotel.
Sustainability 15 09926 g002
Figure 3. The process of renovating old buildings.
Sustainability 15 09926 g003
Figure 4. Status of the envelope structure.
Sustainability 15 09926 g004
Figure 5. Measurements via the multi-channel heat flow meter.
Sustainability 15 09926 g005
Figure 6. The hotel indoor and outdoor temperatures measuring point layout.
Sustainability 15 09926 g006
Figure 7. The hotel indoor and outdoor temperature test results.
Sustainability 15 09926 g007
Figure 8. Building simulation analysis model.
Sustainability 15 09926 g008
Figure 9. The hotel functional plan.
Sustainability 15 09926 g009
Figure 10. The simulated temperature before the retrofit.
Sustainability 15 09926 g010
Figure 11. Comparison between the measured temperature and simulated temperature before modification.
Sustainability 15 09926 g011
Figure 12. The simulation of indoor temperature before and after retrofit of roof.
Sustainability 15 09926 g012
Figure 13. The simulation of indoor temperature before and after retrofit of the exterior wall.
Sustainability 15 09926 g013
Figure 14. The simulation of indoor temperature before and after retrofit of doors and windows.
Sustainability 15 09926 g014
Figure 15. The simulation of indoor temperature before and after adjustment of window–wall ratio in all directions.
Sustainability 15 09926 g015
Figure 16. The simulation of indoor temperature before and after overall retrofit.
Sustainability 15 09926 g016
Figure 17. Meteorological data of Urumqi region.
Sustainability 15 09926 g017
Figure 18. The optimum inclination of the PV module.
Sustainability 15 09926 g018
Figure 19. Layout plan of PV module.
Sustainability 15 09926 g019
Figure 20. CO2 emissions saved over the full life cycle of 30 years.
Sustainability 15 09926 g020
Figure 21. Comparison of the proportion of uncomfortable time in the heating period between different schemes.
Sustainability 15 09926 g021
Figure 22. Comparison of cumulative annual heating energy consumption between different schemes.
Sustainability 15 09926 g022
Figure 23. Insulation roof modification.
Sustainability 15 09926 g023
Figure 24. Internal and external combined insulation wall.
Sustainability 15 09926 g024
Figure 25. Keep original window + new window.
Sustainability 15 09926 g025
Figure 26. Remove original window + new window.
Sustainability 15 09926 g026
Table 1. Measuring devices and specifications.
EquipmentMeasurement ParameterMeasuring Range and AccuracyRecording Mode
JT-IAQ indoor thermal environment tester
(Jinyang Wanda, Beijing, China)
Air temperature (°C)−20~120 °C, ±0.5 °CAuto
Relative humidity (%)0~100%, ±1.5%RH
Black sphere temperature (°C)−20~120 °C, ±0.5 °C
Air velocity (m/s)0.05~2 m/s, ±(0.03 m/s + 2%)
Comfort level−3~3
Table 2. Limit of heat transfer coefficient of building envelope in the severe cold region.
RoofExternal WallExternal WindowExternal Door
Limit value (W/m2∙K)0.20.31.52.5
Table 3. The structure of the building envelope.
Heat Transfer Coefficient
(W/m2∙K)
Structural Map
External walls1.478Sustainability 15 09926 i001
Roof1.330Sustainability 15 09926 i002
Windows2.734Sustainability 15 09926 i003
Table 4. Window–wall ratio of buildings facing each direction in the severe cold region.
OrientationWindow-Wall Ratio
North0.25
East, West0.30
South0.45
Table 5. Data comparison before and after retrofit of roof.
Before RetrofitAfter Retrofit
Indoor EnvironmentHeating Period—Indoor Average Temperature (°C)16.617.5
Heating Period—Discomfort Hours2551.72013.9
Heating Energy
Consumption
Annual Cumulative Heating Energy Consumption (kW · h)1,180,694.4835,014.3
Annual Cumulative Heating Energy Consumption (kW · h/m2)213.9151.3
Table 6. Data comparison before and after retrofit of the exterior wall.
Before RetrofitAfter Retrofit
Indoor EnvironmentHeating Period—Indoor Average Temperature (°C)16.617.2
Heating Period—Discomfort Hours2551.72082.3
Heating Energy
Consumption
Annual Cumulative Heating Energy Consumption (kW · h)1,180,694.4918,189.6
Annual Cumulative Heating Energy Consumption (kW · h/m2)213.9166.3
Table 7. Data comparison before and after retrofit of doors and windows.
Before RetrofitAfter Retrofit
Indoor EnvironmentHeating Period—Indoor Average Temperature (°C)16.616.9
Heating Period—Discomfort Hours2551.72233.7
Heating Energy
Consumption
Annual Cumulative Heating Energy Consumption (kW · h)1,180,694.41,046,386.2
Annual Cumulative Heating Energy Consumption (kW · h/m2)213.9189.5
Table 8. Data comparison before and after adjustment of window–wall ratio in all directions.
Before RetrofitAfter Retrofit
Indoor EnvironmentHeating Period—Indoor Average Temperature (°C)16.616.7
Heating Period—Discomfort Hours2551.72513.3
Heating Energy
Consumption
Annual Cumulative Heating Energy Consumption (kW · h)1,180,694.41,145,574.6
Annual Cumulative Heating Energy Consumption (kW · h/m2)213.9207.5
Table 9. Data comparison before and after overall retrofit.
Before RetrofitAfter Retrofit
Indoor EnvironmentHeating Period—Indoor Average Temperature (°C)16.618.9
Heating Period—Discomfort Hours2551.71651.4
Heating Energy
Consumption
Annual Cumulative Heating Energy Consumption (kW · h)1,180,694.4432,680.6
Annual Cumulative Heating Energy Consumption (kW · h/m2)213.978.4
Table 10. Classification standard of solar energy resource abundance.
LevelResource CodeTotal Annual Radiation (kW · h/m2)
Most abundantA≥1750
Particularly richB1400~1750
RichC1050~1400
OrdinaryD≤1050
Table 11. PVsyst software simulation results.
GlobHor
kW · h/m2
DiffHor
kW · h/m2
T-Amb
°C
Globlnc
kW · h/m2
EArray
MW ∙ h
E-Grid
MW ∙ h
PR
Ratio
January49.325.6−12.4083.15.275.120.970
February60.535.6−9.3084.85.335.180.961
March112.052.81.40139.98.338.110.912
April151.768.511.30169.59.769.510.883
May189.886.217.80188.910.5210.250.854
June189.686.622.60179.59.869.600.842
July192.481.925.20186.110.119.850.833
August171.366.023.20185.110.179.910.843
September134.451.016.90164.89.238.990.859
October94.344.68.40132.47.777.580.901
November49.527.2−1.2078.54.804.660.935
December37.523.4−9.1962.63.913.800.956
All year round1432.3649.47.981655.195.0692.560.880
GlobHorHorizontal total amount
DiffHorSurface scattering radiation
T-AmbEnvironment temperature
GloblncThe total radiation incident to the light surface
EArrayEffective energy out of the array
E-GridGrid electricity
PRThe efficiency of the system
Disclaimer/Publisher’s Note: The statements, opinions and data contained in all publications are solely those of the individual author(s) and contributor(s) and not of MDPI and/or the editor(s). MDPI and/or the editor(s) disclaim responsibility for any injury to people or property resulting from any ideas, methods, instructions or products referred to in the content.