

Year-Round Testing of Coastal Waters of the Gulf of Gdańsk in the Baltic Sea for Detecting Oil in a Seawater Column Using the Fluorescence Method


Abstract
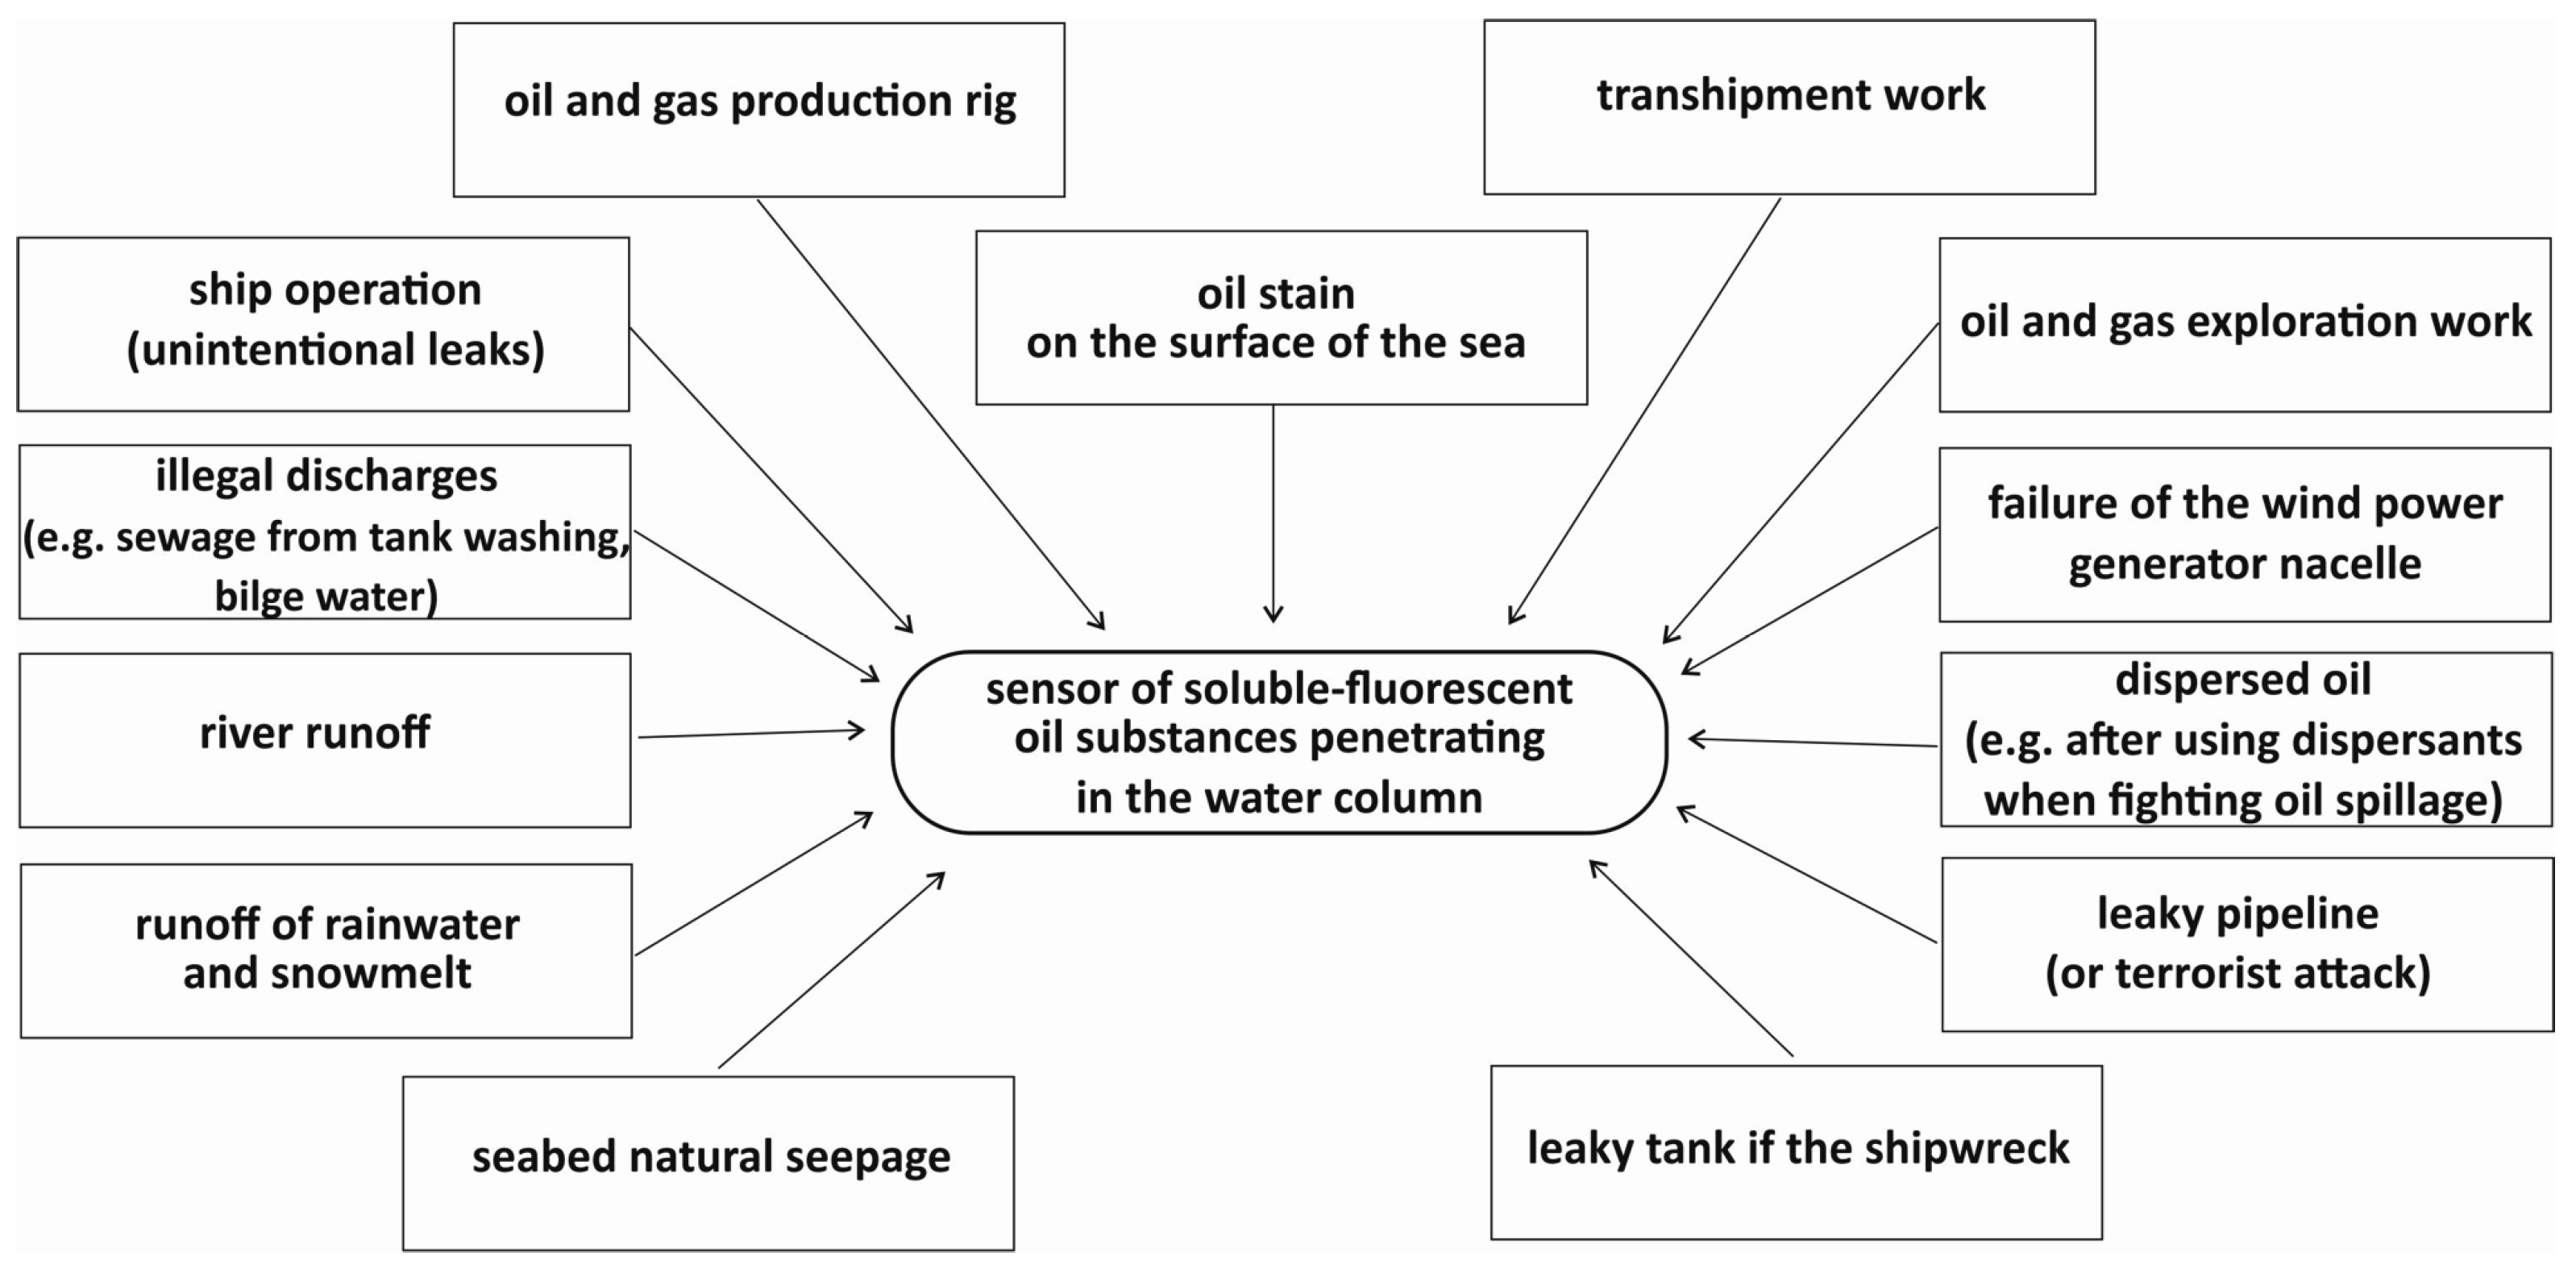
1. Introduction
2. Materials and Methods
2.1. Studied Area
2.2. Seawater Samples
2.3. Oil Contaminant
2.4. Apparatus and Data Processing
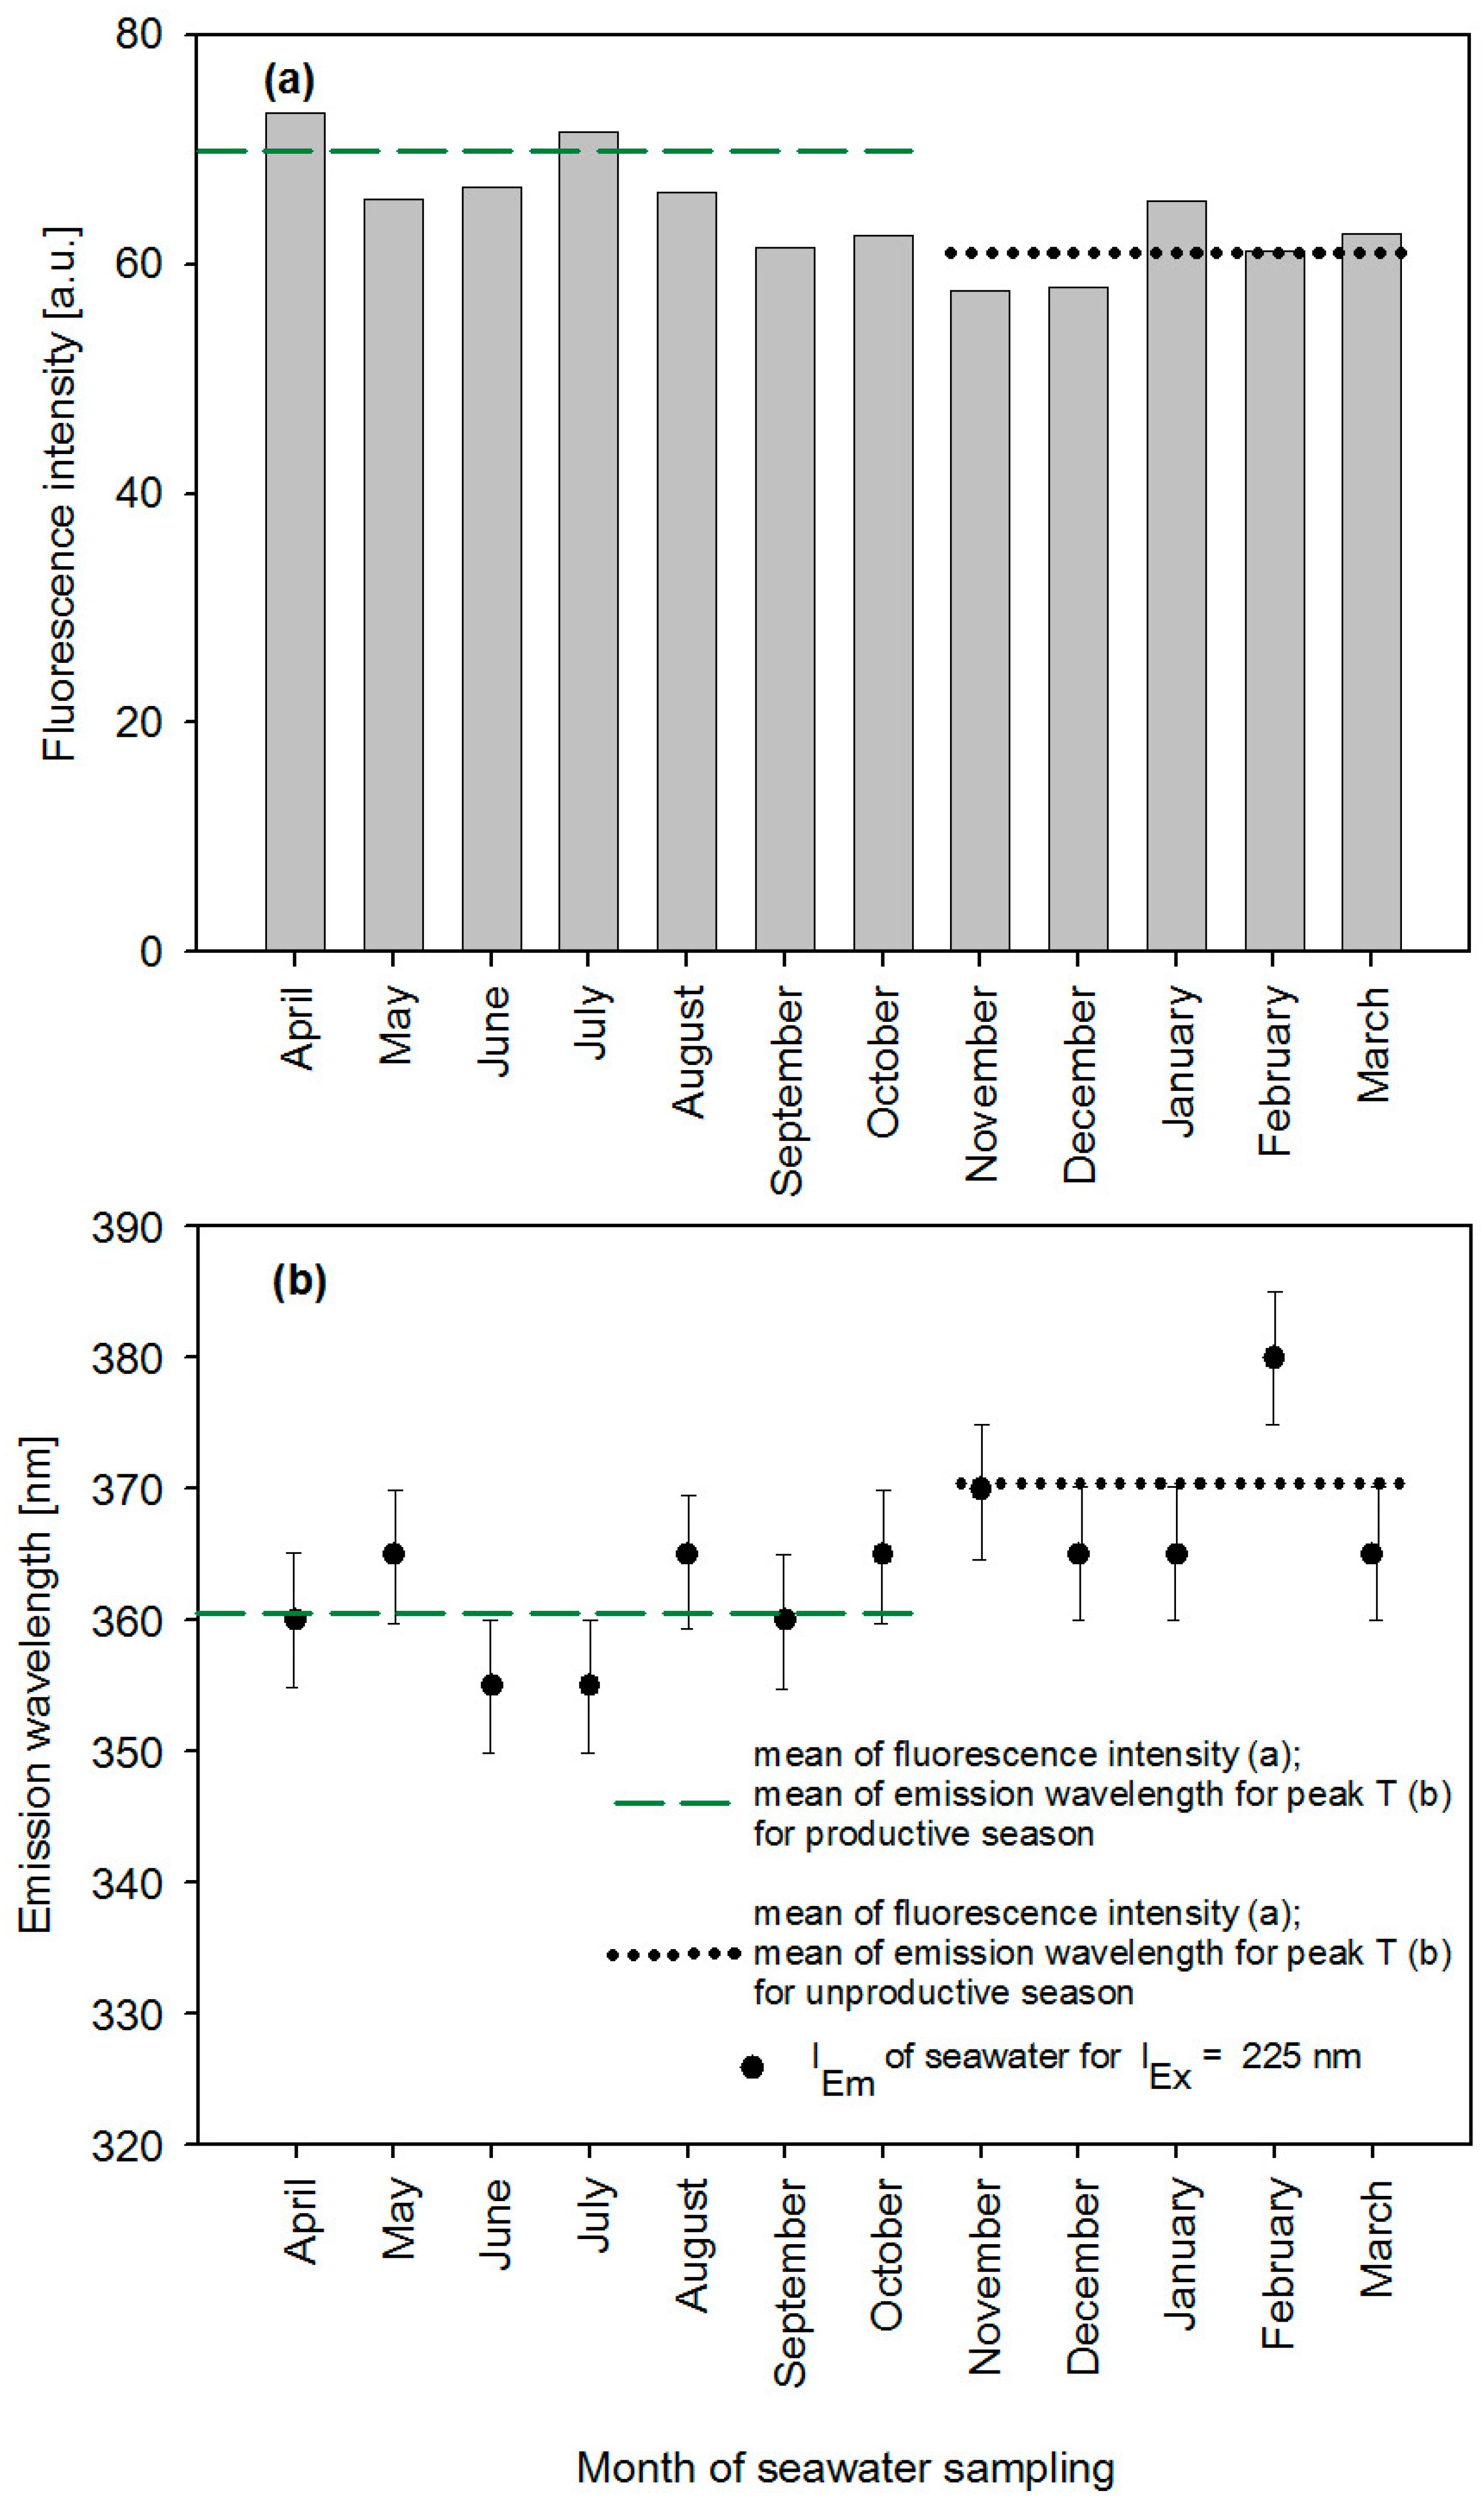
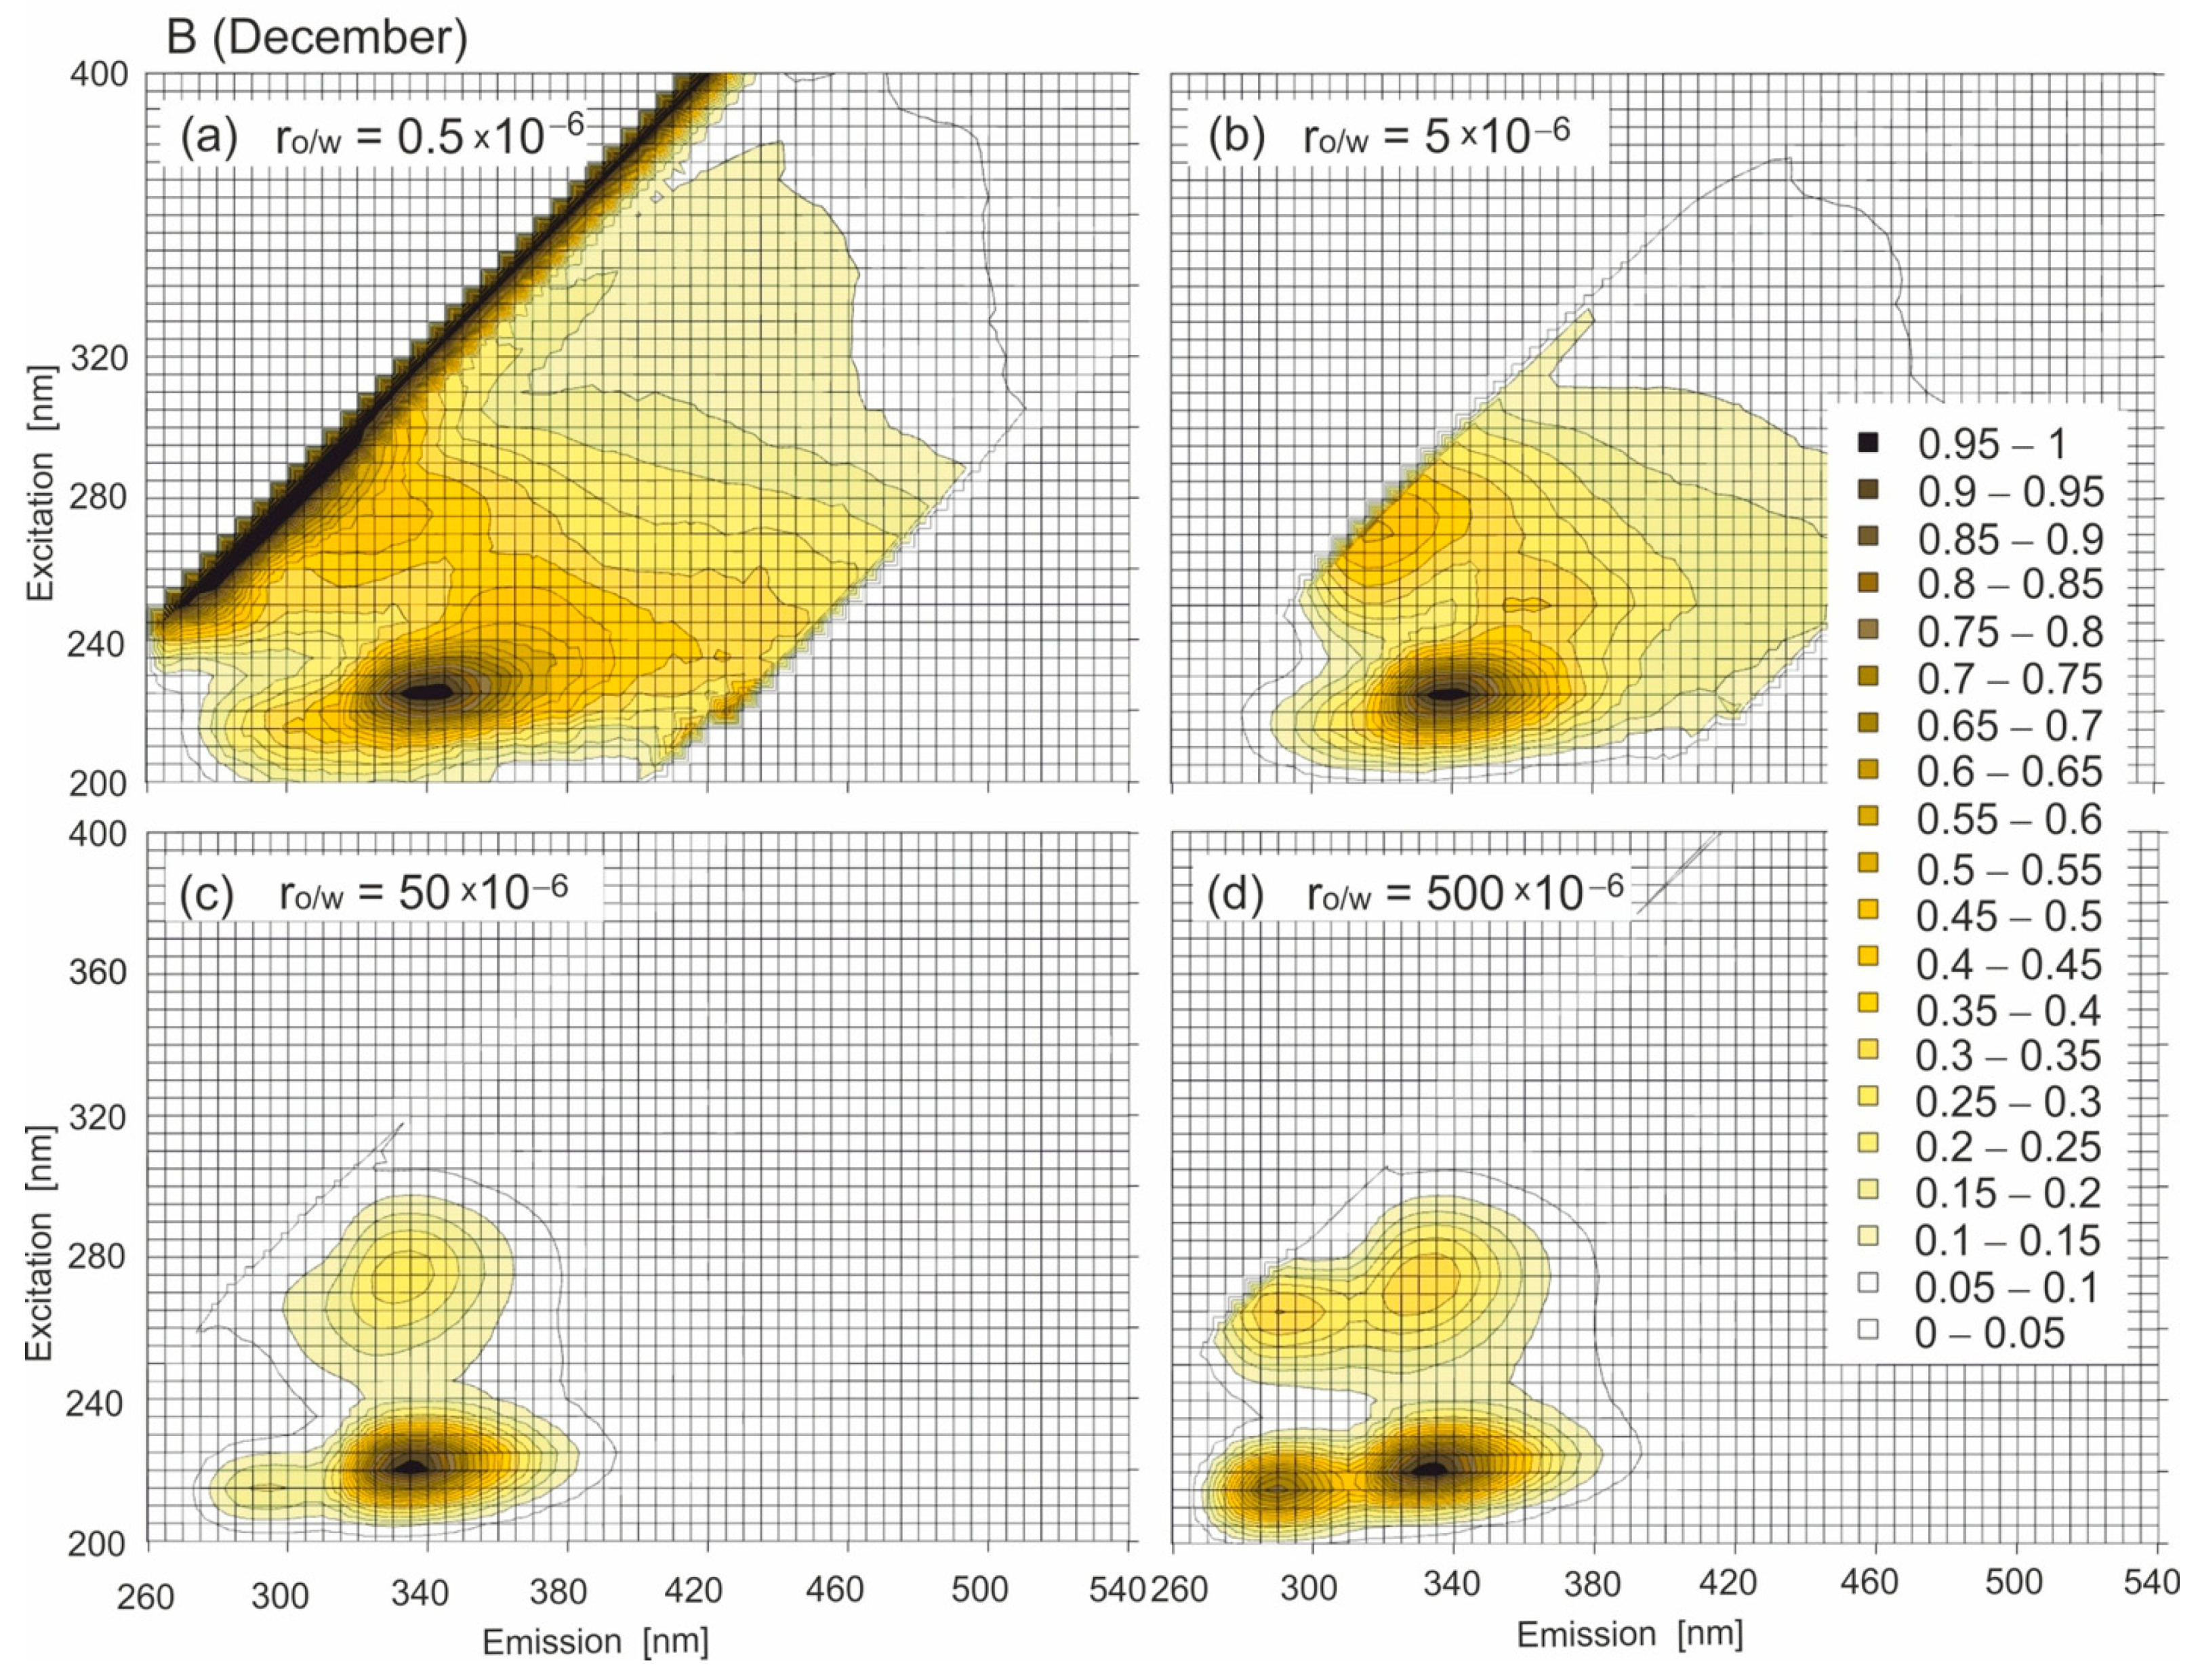
3. Results and Discussion
4. Conclusions
Author Contributions
Funding
Institutional Review Board Statement
Informed Consent Statement
Data Availability Statement
Acknowledgments
Conflicts of Interest
References
- Fingas, M. Oil Spill Science and Technology; Gulf Professional Publishing: Houston: Houston, TX, USA; Elsevier: Amsterdam, The Netherlands, 2011. [Google Scholar]
- Fingas, M. The Basics of Oil Spill Cleanup, 3rd ed.; CRC Press: Boca Raton, FL, USA, 2012. [Google Scholar]
- Fingas, M.; Brown, C.E. Oil spill remote sensing. In Earth System Monitoring: Selected Entries from the Encyclopedia of Sustainability Science and Technology; Orcutt, J., Ed.; Springer: Berlin/Heidelberg, Germany, 2013; pp. 337–388. [Google Scholar] [CrossRef]
- Fingas, M. Marine Oil Spills 2018. J. Mar. Sci. Eng. 2019, 7, 82. [Google Scholar] [CrossRef]
- White, H.K.; Hsing, P.-Y.; Cho, W.; Shank, T.M.; Cordes, E.E.; Quattrini, A.M.; Nelson, R.K.; Camilli, R.; Demopoulos, A.W.J.; German, C.R.; et al. Impact of the Deepwater Horizon oil spill on a deep-water coral community in the Gulf of Mexico. Proc. Natl. Acad. Sci. USA 2012, 109, 20303–20308. [Google Scholar] [CrossRef] [PubMed]
- Hu, C.; Feng, L.; Holmes, J.; Swayze, G.A.; Leifer, I.; Melton, C.; Garcia, O.; Macdonald, I.; Hess, M.; Muller-Karger, F.; et al. Remote sensing estimation of surface oil volume during the 2010 Deepwater Horizon oil blowout in the Gulf of Mexico: Scaling up AVIRIS observations with MODIS measurements. J. Appl. Rem. Sens. 2018, 12, 026008. [Google Scholar] [CrossRef]
- Kujawinski, E.B.; Reddy, C.M.; Rodgers, R.P.; Thrash, J.C.; Valentine, D.L.; White, H.K. The first decade of scientific insights from the Deepwater Horizon oil release. Nat. Rev. Earth Environ. 2020, 1, 237–250. [Google Scholar] [CrossRef]
- Transport Volume of Crude Oil in Seaborne Trade Worldwide from 2010 to 2021. Available online: https://www.statista.com/statistics/264013/transport-volume-of-crude-oil-in-seaborne-trade/ (accessed on 27 April 2023).
- Baltic Lines. Shipping in the Baltic Sea. Past, Present and Future Developments Relevant for Maritime Spatial Planning. Available online: https://vasab.org/wp-content/uploads/2018/06/Baltic-LINes-Shipping_Report-20122016.pdf (accessed on 23 May 2023).
- IMO. The International Convention for the Prevention of Pollution from Ships (MARPOL), 1973, as Modified by the Protocol of 1978. Available online: http://www.imo.org/en/About/conventions/listofconventions/pages/international-convention-for-the-prevention-of-pollution-from-ships-(marpol).aspx (accessed on 27 April 2023).
- Gennaro, M. Oil Pollution Liability and Control under International Maritime Law: Market Incentives as an Alternative to Government Regulation. Vanderbilt J. Transnatl. Law 2004, 37, 265–298. [Google Scholar]
- Illegal Discharges of Oil in the Baltic Sea Baltic Sea Environment Fact Sheet 2016, Published 11 July 2016. Available online: https://helcom.fi/wp-content/uploads/2020/08/Illegal-Discharges-of-Oil-in-the-Baltic-Sea.pdf (accessed on 27 April 2023).
- Al-Ruzouq, R.; Gibril, M.B.A.; Shanableh, A.; Kais, A.; Hamed, O.; Al-Mansoori, S.; Khalil, M.A. Sensors, Features, and Machine Learning for Oil Spill Detection and Monitoring: A Review. Remote Sens. 2020, 12, 3338. [Google Scholar] [CrossRef]
- Pärt, S.; Kankaanpää, H.; Björkqvist, J.-V.; Uiboupin, R. Oil Spill Detection Using Fluorometric Sensors: Laboratory Validation and Implementation to a FerryBox and a Moored SmartBuoy. Front. Mar. Sci. 2021, 8, 778136. [Google Scholar] [CrossRef]
- Hu, C.; Lu, Y.; Sun, S.; Liu, Y. Optical Remote Sensing of Oil Spills in the Ocean: What Is Really Possible? J. Remote Sens. 2021, 2021, 9141902. [Google Scholar] [CrossRef]
- Hou, Y.; Li, Y.; Li, G.; Tong, X.; Wang, Y. Oil-spill detection sensor using ultraviolet-induced fluorescence for routine surveillance in coastal environments. Appl. Phys. B 2022, 128, 41. [Google Scholar] [CrossRef]
- Response to Spills. Available online: https://helcom.fi/action-areas/response-to-spills/ (accessed on 27 April 2023).
- Alpers, W.; Holt, B.; Zeng, K. Remote sensing of environment oil spill detection by imaging radars: Challenges and pitfalls. Remote Sens. Environ. 2017, 201, 133–147. [Google Scholar] [CrossRef]
- Tysiąc, P.; Strelets, T.; Tuszyńska, W. The Application of Satellite Image Analysis in Oil Spill Detection. Appl. Sci. 2022, 12, 4016. [Google Scholar] [CrossRef]
- Sun, S.; Hu, C. The challenges of interpreting oil-water spatial and spectral contrasts for the estimation of oil thickness: Examples from satellite and airborne measurements of the Deepwater Horizon oil spill. IEEE Trans. Geosci. Remote Sens. 2019, 57, 2643–2658. [Google Scholar] [CrossRef]
- Conceição, M.R.A.; de Mendonça, L.F.F.; Lentini, C.A.D.; da Cunha Lima, A.T.; Lopes, J.M.; de Vasconcelos, R.N.; Gouveia, M.B.; Porsani, M.J. SAR Oil Spill Detection System through Random Forest Classifiers. Remote Sens. 2021, 13, 2044. [Google Scholar] [CrossRef]
- Li, X.; Li, C.; Yang, Z.; Pichel, W. SAR imaging of ocean surface oil seep trajectories induced by near-inertial oscillation. Remote Sens. Environ. 2013, 130, 182–187. [Google Scholar] [CrossRef]
- Chen, G.; Li, Y.; Sun, G.; Zhang, Y. Application of deep networks to oil spill detection using polarimetric synthetic aperture radar images. Appl. Sci. 2017, 7, 968. [Google Scholar] [CrossRef]
- EMSA (European Maritime Safety Agency) Outlook 2023. Available online: https://www.emsa.europa.eu/ (accessed on 27 April 2023).
- CleanSeaNet Service Detections and Feedback Data 2021, EMSA; in CleanSeaNet—Detections and Feedback Data (2015–2021). Available online: https://www.emsa.europa.eu/we-do/surveillance/earthobservationservices/item/4645-cleanseanet-detections-and-feedback-data.html (accessed on 27 April 2023).
- Chekalyuk, A.; Hafez, M. Next generation Advanced Laser Fluorometry (ALF) for characterization of natural aquatic environments: New instruments. Opt Express 2013, 21, 14181. [Google Scholar] [CrossRef]
- Xie, M.; Jia, Y.; Li, Y.; Cai, X.; Cao, K. Experimental Analysis on the Optimal Excitation Wavelength for Fine-Grained Identification of Refined Oil Pollutants on WaterSurface Based on Laser-Induced Fluorescence. J. Fluoresc. 2022, 32, 257–265. [Google Scholar] [CrossRef]
- Li, Y.; Jia, Y.; Cai, X.; Xie, M.; Zhang, Z. Oil pollutant identification based on excitation-emission matrix of UV-induced fluorescence and deep convolutional neural network. Environ. Sci. Pollut. Res. 2022, 29, 68152–68160. [Google Scholar] [CrossRef]
- Fingas, M.; Brown, C. A Review of oil spill remote sensing. Sensors 2017, 18, 91. [Google Scholar] [CrossRef]
- Wang, Z.; Stout, S. Oil Spill Environmental Forensics: Fingerprinting and Source Identification, 2nd ed.; Academic Press: London, UK, 2016. [Google Scholar]
- Chepyzhenko, A.A.; Lomakin, P.D.; Chepyzhenko, A.I. Methods and device for dissolved oil in water environment in-situ monitoring. In Atmospheric and Ocean Optics; SPIE: St. Bellingham, WA, USA, 2020. [Google Scholar]
- Geng, T.; Wang, Y.; Yin, X.-L.; Chen, W. A Comprehensive Review on the Excitation-Emission Matrix Fluorescence Spectroscopic Characterization of Petroleum-Containing Substances: Principles, Methods, and Applications. Crit. Rev. Anal. Chem. 2023, 8, 1–23. [Google Scholar] [CrossRef]
- Conmy, R.N.; Coble, P.G.; Farr, J.; Wood, A.M.; Lee, K.; Pegau, W.S.; Walsh, I.D.; Koch, C.R.; Abercrombie, M.I.; Miles, M.S.; et al. Submersible Optical Sensors Exposed to Chemically Dispersed Crude Oil: Wave Tank Simulations for Improved Oil Spill Monitoring. Environ. Sci. Technol. 2014, 48, 1803–1810. [Google Scholar] [CrossRef] [PubMed]
- Ferdinand, O.D.; Friedrichs, A.; Miranda, M.L.; Voß, D.; Zielinski, O. Next-generation fluorescence sensor with multiple excitation and emission wavelengths—NeXOS MatrixFlu-UV. In Proceedings of the OCEANS-2017, Abredeen, UK, 19–22 June 2017; IEEE: Piscataway, NJ, USA, 2017. [Google Scholar] [CrossRef]
- Elsherif, M.; Salih, A.E.; Muñoz Monserrat, G.; Alam, F.; AlQattan, B.; Antonysamy, D.S.; Zaki, M.F.; Yetisen, A.K.; Park, S.; Wilkinson, T.D.; et al. Optical Fiber Sensors: Working Principle, Applications, and Limitations. Adv. Photonics Res. 2022, 3, 2100371. [Google Scholar] [CrossRef]
- Woźniak, S.B.; Meler, J.; Lednicka, B.; Zdun, A.; Stoń-Egiert, J. Inherent optical properties of suspended particulate matter in the southern Baltic Sea. Oceanologia 2011, 53, 691–729. [Google Scholar]
- Soja-Woźniak, M.; Craig, S.E.; Wojtasiewicz, B.; Kratzer, S.; Darecki, M.; Jones, C.T. A Novel Statistical Approach for Ocean Colour Estimation of Inherent Optical Properties and Cyanobacteria Abundance in Optically Complex Waters. Remote Sens. 2017, 9, 343. [Google Scholar] [CrossRef]
- Meler, J.; Kowalczuk, P.; Ostrowska, M.; Ficek, D.; Zabłocka, M.; Zdun, A. Parameterization of the light absorption properties of chromophoric dissolved organic matter in the Baltic Sea and Pomeranian lakes. Ocean. Sci. 2016, 12, 1013–1032. [Google Scholar] [CrossRef]
- Ostrowska, M. Model dependences of the deactivation of phytoplankton pigment excitation energy on environmental conditions in the sea. Oceanology 2012, 54, 545–564. [Google Scholar] [CrossRef]
- McKee, D.; Röttgers, R.; Neukermans, G.; Calzado, V.S.; Trees, C.; Ampolo-Rella, M.; Neil, C.; Cunningham, A. Impact of measurement uncertainties on determination of chlorophyll-specific absorption coefficient for marine phytoplankton. J. Geophys. Res. Oceans 2014, 119, 9013–9025. [Google Scholar] [CrossRef]
- Coble, P.G. Characterization of marine and terrestrial DOM in seawater using excitation-emission matrix spectroscope. Mar. Chem. 1996, 51, 325–346. [Google Scholar] [CrossRef]
- Drozdowska, V.; Wrobel, I.; Markuszewski, P.; Makuch, P.; Raczkowska, A.; Kowalczuk, P. Study on organic matter fractions in the surface microlayer in the Baltic Sea by spectrophotometric and spectrofluorometric methods. Ocean Sci. 2017, 13, 633–647. [Google Scholar] [CrossRef]
- Drozdowska, V.; Kowalczuk, P.; Konik, M.; Dzierzbicka-Glowacka, L. Study on Different Fractions of Organic Molecules in the Baltic Sea Surface Microlayer by Spectrophoto- and Spectrofluorimetric Methods. Front. Mar. Sci. 2018, 5, 456. [Google Scholar] [CrossRef]
- Miranda, M.L.; Mustaffa, N.I.H.; Robinson, T.-B.; Stolle, C.; Ribas-Ribas, M.; Wurl, O.; Zielinski, O. Influence of solar radiation on biogeochemical parameters and fluorescent dissolved organic matter (FDOM) in the sea surface microlayer of the southern coastal North Sea. Elem. Sci. Anth. 2018, 6, 15. [Google Scholar] [CrossRef]
- Zielinski, O.; Rüssmeier, N.; Ferdinand, O.D.; Miranda, M.L.; Wollschläger, J. Assessing Fluorescent Organic Matter in Natural Waters: Towards In Situ Excitation–Emission Matrix Spectroscopy. Appl. Sci. 2018, 8, 2685. [Google Scholar] [CrossRef]
- Kowalczuk, P.; Cooper, W.J.; Durako, M.J.; Kahn, A.E.; Gonsior, M.; Young, H. Characterization of dissolved organic matter fluorescence in the South Atlantic bight with use of PARAFAC model: Relationships between fluorescence and its components, absorption coefficients and organic carbon concentrations. Mar. Chem. 2010, 118, 22–36. [Google Scholar] [CrossRef]
- Baszanowska, E.; Otremba, Z. Modification of optical properties of seawater exposed to oil contaminants based on excitation-emission spectra. J. Eur. Opt. Soc. Rapid Publ. 2015, 10, 10047. [Google Scholar] [CrossRef]
- Ecohydrodynamic Forecast for the Baltic Sea. Available online: http://model.ocean.univ.gda.pl/php/frame.php?area=ZatokaGdanska (accessed on 27 April 2023).
- Coble, P. Colored dissolved organic matter in seawater. In Subsea Optics and Imaging; Elsevier BV: London, UK, 2013; pp. 98–118. [Google Scholar]
- Drozdowska, V.; Freda, W.; Baszanowska, E.; Rudź, K.; Darecki, M.; Heldt, J.; Toczek, H. Spectral properties of natural and oil-polluted Baltic seawater—Results of measurements and modelling. Eur. Phys. J. Spec. Top. 2013, 222, 2157–2170. [Google Scholar] [CrossRef]
- Baszanowska, E.; Otremba, Z. Fluorometric Detection of Oil Traces in a Sea Water Column. Sensors 2022, 22, 2039. [Google Scholar] [CrossRef] [PubMed]
- Baszanowska, E.; Otremba, Z. Detection of Oil in Seawater Based on the Fluorometric Index during the Winter Season in the Baltic Sea—The Case of the Gulf of Gdansk. Sensors 2022, 22, 6014. [Google Scholar] [CrossRef]
- Baszanowska, E.; Otremba, Z. Detecting the Presence of Different Types of Oil in Seawater Using a Fluorometric Index. Sensors 2019, 19, 3774. [Google Scholar] [CrossRef]
- Kowalczuk, P.; Stedmon, C.A.; Markager, M. Modeling absorption by CDOM in the Baltic Sea from the season, salinity and chlorophyll. Mar. Chem. 2006, 101, 1–11. [Google Scholar] [CrossRef]


| April | May | June | July | August | September | October | November | December | January | February | March | |
|---|---|---|---|---|---|---|---|---|---|---|---|---|
| Temperature [°C] | 4.97 | 8.44 | 14.6 | 20.4 | 17.8 | 17.4 | 14.3 | 8.75 | 7.58 | 5.25 | 4.5 | 4.69 |
| Primary production [mg m−2 d−1] | 21.7 | 40 | 27.4 | 2.35 | 8.32 | 5.3 | 80.6 | 0.24 | 0.08 | 0.03 | 0.71 | 44.1 |
| Phytoplankton [mg m−3] | 75.3 | 105 | 77.4 | 20.2 | 30.8 | 46.4 | 122 | 9.1 | 2.1 | 0.4 | 1.6 | 96.6 |
| Month | λEx [nm]/λEm [nm] |
|---|---|
| (T) | |
| IV | 225/360 |
| V | 225/365 |
| VI | 225/355 |
| VII | 225/355 |
| VIII | 225/365 |
| IX | 225/360 |
| X | 225/365 |
| XI | 225/370 |
| XII | 225/370 |
| I | 225/365 |
| II | 225/380 |
| III | 225/365 |
| Month | Fluorescence Intensity [a.u.] | |||
|---|---|---|---|---|
| λEx/λEm | T 225/355–380 | A 265/420 | M 280/380 | C 320/415 |
| IV | 73.21 | 45.05 | 30.08 | 22.82 |
| V | 65.68 | 39.56 | 26.95 | 18.82 |
| VI | 66.68 | 37.77 | 27.66 | 18.70 |
| VII | 71.52 | 39.04 | 29.58 | 18.78 |
| VIII | 66.30 | 38.51 | 28.90 | 19.25 |
| IX | 61.47 | 33.94 | 24.50 | 17.09 |
| X | 62.53 | 34.04 | 25.50 | 17.02 |
| XI | 57.75 | 34.62 | 23.36 | 17.46 |
| XII | 58.04 | 32.20 | 23.27 | 16.24 |
| I | 65.61 | 38.67 | 27.01 | 20.02 |
| II | 61.20 | 37.58 | 25.59 | 18.51 |
| III | 62.74 | 37.49 | 26.11 | 18.51 |
| λEx [nm] ± 5 [nm]/λEm [nm] ± 5 [nm] | ||||
|---|---|---|---|---|
| April ro/w | Peak 1 | Peak 2 | Peak 3 | Peak 4 |
| 0.5 × 10⁻⁶ | 225/345 | 265/325 | ||
| 5 × 10⁻⁶ | 225/340 | 270/330 | ||
| 50 × 10−6 | 220/335 | 215/290 | 275/335 | |
| 500 × 10−6 | 220/335 | 215/290 | 290/265 | 275/335 |
| May | ||||
| 0.5 × 10⁻⁶ | 225/345 | 215/305 | 275/340 | |
| 5 × 10⁻⁶ | 225/340 | 275/340 | ||
| 50 × 10−6 | 220/335 | 215/295 | 275/330 | |
| 500 × 10−6 | 220/335 | 215/290 | 300/265 | 275/335 |
| June | ||||
| 0.5 × 10⁻⁶ | 225/355 | 255/360 | 275/320 | |
| 5 × 10⁻⁶ | 225/340 | 275/340 | ||
| 50 × 10−6 | 220/335 | 215/295 | 275/335 | |
| 500 × 10−6 | 220/335 | 215/290 | 290/265 | 275/330 |
| July | ||||
| 0.5 × 10⁻⁶ | 225/345 | 275/340 | ||
| 5 × 10⁻⁶ | 225/340 | 255/365 | 275/340 | |
| 50 × 10−6 | 220/335 | 215/295 | 275/335 | |
| 500 × 10−6 | 220/335 | 215/290 | 275/330 | |
| August | ||||
| 0.5 × 10⁻⁶ | 225/345 | 270/340 | ||
| 5 × 10⁻⁶ | 225/340 | 275/335 | ||
| 50 × 10−6 | 220/335 | 215/290 | 275/335 | |
| 500 × 10−6 | 220/335 | 215/290 | 295/265 | 275/330 |
| September | ||||
| 0.5 × 10⁻⁶ | 225/345 | 270/340 | ||
| 5 × 10⁻⁶ | 225/340 | 275/330 | ||
| 50 × 10−6 | 220/335 | 215/290 | 270/330 | |
| 500 × 10−6 | 220/335 | 215/290 | 295/265 | 275/330 |
| October | ||||
| 0.5 × 10⁻⁶ | 225/340 | 275/330 | ||
| 5 × 10⁻⁶ | 225/340 | 275/330 | ||
| 50 × 10−6 | 220/335 | 215/290 | 275/335 | |
| 500 × 10−6 | 220/335 | 215/290 | 295/265 | 275/330 |
| λEx [nm] ± 5 [nm]/λEm [nm] ± 5 [nm] | ||||
|---|---|---|---|---|
| November ro/w | Peak 1 | Peak 2 | Peak 3 | Peak 4 |
| 0.5 × 10⁻⁶ | 225/340 | 280/340 | ||
| 5 × 10⁻⁶ | 225/340 | 275/340 | ||
| 50 × 10−6 | 220/335 | 215/290 | 275/330 | |
| 500 × 10−6 | 220/335 | 215/290 | 295/265 | 275/330 |
| December | ||||
| 0.5 × 10⁻⁶ | 225/350 | |||
| 5 × 10⁻⁶ | 225/340 | 270/330 | ||
| 50 × 10−6 | 220/335 | 215/295 | 275/335 | |
| 500 × 10−6 | 220/335 | 215/290 | 295/260 | 275/330 |
| January | ||||
| 0.5 × 10⁻⁶ | 225/355 | |||
| 5 × 10⁻⁶ | 225/340 | |||
| 50 × 10−6 | 220/335 | 215/295 | 275/335 | |
| 500 × 10−6 | 220/340 | 215/295 | 290/265 | 275/330 |
| February | ||||
| 0.5 × 10⁻⁶ | 225/355 | |||
| 5 × 10⁻⁶ | 225/350 | 275/335 | ||
| 50 × 10−6 | 220/335 | 220/295 | 275/335 | |
| 500 × 10−6 | 220/335 | 215/290 | 290/265 | 275/330 |
| March | ||||
| 0.5 × 10⁻⁶ | 225/345 | |||
| 5 × 10⁻⁶ | 225/340 | 275/330 | ||
| 50 × 10−6 | 220/335 | 215/295 | 275/330 | |
| 500 × 10−6 | 220/335 | 215/290 | 290/265 | 275/330 |
| FIo/w [-] | ||||
|---|---|---|---|---|
| ro/w | 0.5 × 10⁻⁶ | 50 × 10−6 | 100 × 10−6 | 500 × 10−6 |
| April | 1.44 | 1.43 | 1.69 | 1.72 |
| May | 1.26 | 1.40 | 1.65 | 1.68 |
| June | 1.18 | 1.36 | 1.68 | 1.70 |
| July | 1.42 | 1.53 | 1.66 | 1.72 |
| August | 1.34 | 1.39 | 1.64 | 1.67 |
| September | 1.37 | 1.38 | 1.67 | 1.73 |
| October | 1.20 | 1.34 | 1.67 | 1.68 |
| November | 1.34 | 1.33 | 1.69 | 1.68 |
| December | 1.24 | 1.41 | 1.65 | 1.71 |
| January | 1.28 | 1.40 | 1.70 | 1.71 |
| February | 1.12 | 1.41 | 1.69 | 1.69 |
| March | 1.35 | 1.44 | 1.66 | 1.68 |
| FIo/w [-] | |
|---|---|
| Natural Seawater | |
| April | 0.86 |
| May | 0.86 |
| June | 0.87 |
| July | 0.87 |
| August | 0.86 |
| September | 0.81 |
| October | 0.85 |
| November | 0.80 |
| December | 0.82 |
| January | 0.80 |
| February | 0.83 |
| March | 0.84 |
Disclaimer/Publisher’s Note: The statements, opinions and data contained in all publications are solely those of the individual author(s) and contributor(s) and not of MDPI and/or the editor(s). MDPI and/or the editor(s) disclaim responsibility for any injury to people or property resulting from any ideas, methods, instructions or products referred to in the content. |
© 2023 by the authors. Licensee MDPI, Basel, Switzerland. This article is an open access article distributed under the terms and conditions of the Creative Commons Attribution (CC BY) license (https://creativecommons.org/licenses/by/4.0/).
Share and Cite
Baszanowska, E.; Otremba, Z. Year-Round Testing of Coastal Waters of the Gulf of Gdańsk in the Baltic Sea for Detecting Oil in a Seawater Column Using the Fluorescence Method. Sustainability 2023, 15, 9898. https://doi.org/10.3390/su15139898
Baszanowska E, Otremba Z. Year-Round Testing of Coastal Waters of the Gulf of Gdańsk in the Baltic Sea for Detecting Oil in a Seawater Column Using the Fluorescence Method. Sustainability. 2023; 15(13):9898. https://doi.org/10.3390/su15139898
Chicago/Turabian StyleBaszanowska, Emilia, and Zbigniew Otremba. 2023. "Year-Round Testing of Coastal Waters of the Gulf of Gdańsk in the Baltic Sea for Detecting Oil in a Seawater Column Using the Fluorescence Method" Sustainability 15, no. 13: 9898. https://doi.org/10.3390/su15139898
APA StyleBaszanowska, E., & Otremba, Z. (2023). Year-Round Testing of Coastal Waters of the Gulf of Gdańsk in the Baltic Sea for Detecting Oil in a Seawater Column Using the Fluorescence Method. Sustainability, 15(13), 9898. https://doi.org/10.3390/su15139898