1. Introduction
In recent years, the increase in greenhouse gas concentrations has led to the intensification of global warming, and addressing climate change has become an essential issue for all humankind to address [
1,
2,
3]. Since climate change has regional interaction effects, countries must coordinate and cooperate to address climate change jointly. In this process, the principles of “common but differentiated responsibilities”, equity, and respective capabilities should be followed, and countries should do their best to contribute to the global response to climate change [
4,
5].
The Belt and Road Initiative region connects two major economic spheres, the Asia Pacific and Europe, which include Central Asia, Southeast Asia, West Asia, and other regions, with more than 60 countries. Together, they account for 62.3% of the world’s population [
6] and 31.2% of its economy [
7], which is significant for global development. Therefore, the region deserves focused attention from the international academic community. Although many countries have strong economies, many developing countries and regions need more resources and adequate infrastructure and have undiversified economic structures, energy and electricity shortages, and fragile ecological environments [
8]. Studying the efficiency of agricultural carbon emissions can help countries along the route to optimize the use of resources, improve the efficiency of agricultural production, and reduce the waste of resources. International Energy Agency (IEA) statistics show that the energy consumption and carbon emissions of countries along the route of the Belt and Road initiative account for more than 50% and 60% of the world’s energy consumption and carbon emissions, respectively. The energy intensity and carbon emissions are high, and will be primary sources of energy consumption and greenhouse gas emission growth in the future [
9]. Since 2021, the growth rate of carbon emissions in countries along the route of the route of the Belt and Road Initiative has been about twice the world average, while the emission intensity has been nearly twice the world average, with a weak foundation for a low-carbon economy. In this context, these countries urgently need to reduce ecological and environmental costs in the process of economic development [
10,
11], avoid high-carbon path lock and accompanying development traps, improve quality low-carbon investment and industry, and share the green benefits brought by low-carbon transformation to promote low-carbon development along the route of the Belt and Road Initiative [
12,
13]. These correspond to climate [
14], energy [
15,
16], and environmental [
17] challenges of great significance.
Agriculture is one of the essential sources of global greenhouse gas emissions [
18]. Studying the efficiency of agricultural carbon emissions in the Belt and Road Initiative region can help us understand the contribution of agriculture in this region to global climate change and suggest measures to reduce greenhouse gas emissions. Promoting advanced agricultural production technologies, encouraging farmers to adopt emission reduction measures, and accelerating the pace of carbon reduction to reduce the negative impacts of agricultural carbon emissions will help better address the challenges posed by global climate change [
19,
20]. The level of agricultural development, energy structure, and policy systems of countries along the route of the Belt and Road Initiative vary greatly. This study will be beneficial for the international community to develop differentiated mechanisms to help reduce carbon emissions in agriculture for different countries. It will help the countries along the route of the Belt and Road Initiative realize the transformation of agriculture and the overall economy as soon as possible.
Research on issues related to agricultural carbon emissions in countries along the route of the Belt and Road Initiative has yet to be fully developed in national academia. However, this research is essential for achieving sustainable development, reducing greenhouse gas emissions, and addressing climate change. Exploring the spatial network structure of agricultural carbon emission efficiency in countries along the route can help us understand the interactions and linkages among these countries. Revealing the drivers can also identify the key factors affecting the efficiency of agricultural carbon emissions and provide a scientific basis for the formulation of targeted policies and measures. It helps address global climate change issues and promotes sustainable agricultural development in countries along the route, and strengthens international cooperation, contributing to the goal of aligning economic prosperity and environmental protection. Accordingly, this paper will propose the following research objectives: first, to describe the countries’ agricultural development along the route of the Belt and Road Initiative and to sort out the relevant literature on agricultural carbon emissions in the international community; second, based on the previous research, we will construct an agricultural carbon emission efficiency input–output index system, calculate the agricultural carbon emission efficiency of the countries along the route of the Belt and Road Initiative, and analyze the causes of fluctuations in agricultural carbon emission efficiency in each country; third, based on the previous paper, we will apply the social network analysis method, construct a spatial correlation binary matrix, and conduct a spatial network structure analysis to explore the overall, individual and cluster structure from three perspectives; fourth, the correlation analysis of the driving factors is conducted to identify the key factors affecting agricultural carbon emission efficiency and explore the relationship between these factors and the spatial correlation network matrix of agricultural carbon emission efficiency in each country, in order to provide a scientific basis and decision support for policymakers to promote low-carbon agriculture and reduce the negative impact of agriculture on climate change.
Compared with the existing studies on agricultural carbon emission efficiency, this paper achieves the following innovations. First, it empirically studies the seriousness of agricultural carbon emission problems in countries along the route of the Belt and Road Initiative from the regional development perspective. This paper presents the problematic aspects of agricultural carbon emissions in each country and among regions to provide theoretical references for promoting the Green Belt and Road Initiative. Secondly, the analysis is based on a relational data and network perspective, which opens up a new research perspective for the study of agricultural carbon emission efficiency. Thirdly, the SBM model (SBM-Undesirable model) with non-desired output is used to measure the agricultural carbon emission efficiency, the modified gravity model is used to construct the gravitational matrix of the spatially linked network of agricultural carbon emission efficiency, and social network analysis (SNA) is applied to analyze the structural characteristics of the spatially linked network, using the assignment procedure model to explore its driving factors. Finally, the QAP model (Quadratic Assignment Procedure model) is used to explore the drivers. Using these methods together, a multi-level analysis can be conducted to comprehensively understand the nature and characteristics of the spatial association networks of the countries along the route of the Belt and Road Initiative, from overall to local and from macro to micro.
2. Review of the Literature
The international community has conducted more research on the issue of agricultural carbon emissions and has developed relatively rich research results, mainly focusing on three aspects.
On the one hand, the World Bank (WBG), the International Energy Agency (IEA), the United Nations Panel on Climate Change (IPCC), the Food and Agriculture Organization of the United Nations (FAO), and other agencies have produced a large number of analytical reports on global carbon emissions.
First, the World Bank (WBG) is committed to promoting sustainable development, including reducing greenhouse gas emissions and adapting to climate change. Its major reports include Low Carbon Development: Priorities and Policy Tools and Greenhouse Gas Emission Trends 2021. The World Bank report on global agricultural carbon emissions states that agricultural production is one of the leading causes of global GHG emissions, accounting for about 25% of total global emissions, and that GHG emissions from agricultural production mainly come from land use change, animal husbandry, fertilizer use, and agricultural machinery use [
21].
Second, the International Energy Agency (IEA) is committed to providing sustainable energy solutions for member countries and the world. Its major reports include Global Energy and CO
2 Emissions: 2021 and World Energy Outlook. In the World Energy Outlook report, the IEA emphasizes the urgency and importance of reducing carbon emissions, especially in addressing climate change, and also stresses the importance of enhancing the use of renewable energy, improving energy efficiency, promoting clean energy technology innovation, and taking global cooperative action, and proposes countermeasures for carbon pricing, energy transition pathways, and policy frameworks [
22].
Additionally, the United Nations Panel on Climate Change (IPCC) works to assess climate change’s scientific basis and impacts and make policy recommendations for climate change mitigation and adaptation. Its major reports include Climate Change 2021: The Physical Science Basis, Climate Change 2022: Impacts, Adaptation, Vulnerability, etc. In the IPCC Sixth Estimates Report (AR6), global agriculture and land use are essential sources contributing to greenhouse gas emissions. Agricultural carbon emissions mainly come from land use change, animal feeding, and agricultural practices. The report states that agricultural carbon emissions have increased over the past decades and are likely to continue to increase, especially in developing countries and regions with emerging economies, and suggests improvements in the potential for reducing emissions from the agricultural sector, including improving agricultural management practices and reducing emissions from livestock [
23].
Finally, the Food and Agriculture Organization of the United Nations (FAO) is committed to achieving the zero hunger goal and promoting sustainable agriculture. Its major reports include the Global Action Plan on Climate in Agriculture and the Guide to Assessing the Carbon Footprint of Food Systems. According to the reports and data provided by the FAO, it can be seen that global agricultural carbon emissions account for a significant proportion of global greenhouse gas emissions. The FAO states that agricultural carbon emissions mainly come from land use change, fertilizer use, animal husbandry, and agricultural machinery and that agricultural carbon emissions significantly impact climate change [
24].
In summary, the reports of these institutions provide essential information and recommendations on global carbon emission trends, impacts, and mitigation measures and are essential references for formulating global climate policies and promoting sustainable development. These reports provide corresponding analyses and presentations of global agricultural carbon emissions and their changes and provide references for developing agricultural carbon emissions in countries along the route of the Belt and Road Initiative.
On the other hand, scholars in the environmental field in various countries have conducted many studies on agricultural carbon emissions in different countries, and these studies cover many aspects, such as the accounting system for agricultural carbon emissions, emission indicators, the relationship between carbon emissions and the agricultural economy, and the simulation of the water-land-energy economic cycle system.
First, scholars have worked to establish a comprehensive agricultural carbon emission accounting system to accurately measure and assess carbon emissions from agricultural activities. Some scholars have conducted systematic studies on agricultural carbon emission accounting systems [
25,
26,
27,
28,
29] to establish accurate and comprehensive agricultural emission accounting methods and models to assess and compare the carbon emission levels in different agricultural systems. They explored in depth the contribution of different agricultural production processes to carbon emissions, including factors in tillage, fertilization, production of agricultural and livestock products, and farm management, to reveal the impact of specific agricultural activities on carbon emissions. Improving the environmental impacts of agricultural production processes and reducing greenhouse gas emissions will also provide essential guidance for achieving low-carbon agricultural development and global climate goals and provide accurate data and scientific recommendations for policymakers and agricultural practitioners.
Second, scholars have focused on the relationship between agricultural carbon emissions and the agricultural economy and explored ways to achieve economic growth while reducing carbon emissions. Some scholars have found that carbon emission intensification reduces agricultural economic growth, increasing renewable energy consumption and greenhouse area enhances agricultural economic growth, and rising energy consumption increases agricultural exports [
30,
31,
32,
33]. Combining green investments in sustainable agricultural production, renewable energy consumption, low-carbon emission technologies, and sustainable agricultural exports can increase technological efficiency, reduce carbon emissions, and improve environmental quality to achieve global sustainable development goals.
In addition, scholars have conducted simulation studies of water-land-energy economic cycle systems to gain a deeper understanding of the interactions between agricultural carbon emissions and other elements. Some scholars have constructed complex system models while considering the interrelationships among agricultural production, energy use, water resources management, and land use [
34,
35,
36]. The carbon cycle processes in different agricultural systems are simulated to assess the impact of different policies and technological measures on carbon emissions. These research models are able to explore how changes in energy demand in one region affect energy, water, and land use in other regions. The results of these simulation studies provide an essential scientific basis for policymakers to develop emission reduction strategies and optimize resource allocation. By applying models, policymakers can better understand the consequences of different policy choices and thus take appropriate measures to reduce agricultural carbon emissions and promote sustainable development.
In summary, scholars in the environmental field in various countries have conducted extensive and in-depth explorations in studying agricultural carbon emissions. Their research has provided crucial theoretical support and practical guidance for formulating relevant policies, promoting sustainable agricultural development, and reducing carbon emissions. It provides strong support for global sustainable agricultural development.
Thirdly, in terms of the regional agricultural carbon emission efficiency spatial correlation network, many scholars have now not only analyzed the differences in agricultural carbon emission efficiency between different regions but also studied in depth the spatial aggregation and convergence of agricultural carbon emission efficiency and other issues involving the spatial correlation network of regional agricultural carbon emission efficiency. In this regard, scholars have conducted extensive studies [
37,
38,
39,
40] exploring spatial spillover effects, spatial correlation relationships, etc. Studies have shown that agricultural carbon emission efficiency exhibits significant spatial autocorrelation, and there is a mutual influence relationship between agricultural carbon emission efficiency in different regions. This implies that the neighboring regions may influence the agricultural carbon emission efficiency level in one region. In addition, study also reveals specific spatial heterogeneity characteristics, i.e., there may be significant differences in agricultural carbon emission efficiency in different regions. Therefore, the analysis of agricultural carbon emission efficiency cannot be limited to the situation within the sample but also needs to consider the spatial factors between samples. Scholars have recognized the importance of inter-regional interactions for forming and improving agricultural carbon emission efficiency. By studying spatial spillover and spatial correlation relationships, they can better understand the spatial distribution pattern of agricultural carbon emission efficiency and provide a scientific basis for formulating policies and measures for different regions.
In summary, current scholars have conducted in-depth studies on the spatial correlation network of regional agricultural carbon emission efficiency. Their studies reveal the spatial characteristics of agricultural carbon emission efficiency, providing essential reference and decision support for regional management and the formulation of agricultural carbon emission reduction policies. Further studies will help promote inter-regional experience exchange and cooperation and promote the overall improvement of agricultural carbon emission efficiency and the achievement of global sustainable development goals.
The findings will accelerate the improvement of agricultural carbon emission reduction policies in the Belt and Road Initiative and provide theoretical references for achieving the dual carbon goals. However, there are still some limitations in the existing studies: firstly, there are certain shortcomings in the measurement methods and input–output indicators regarding the efficiency of agricultural carbon emissions; secondly, with the further development of the Belt and Road Initiative, the exchanges among countries will be further deepened. As a product of socio-economic activities, the spatial effects of carbon emissions also transcend geographical proximity (defined as proximity between countries) and form a spatially linked network globally. However, most existing studies are mainly domestic studies, and there need to be more studies on the efficiency of agricultural carbon emissions among Belt and Road Initiative countries. Moreover, the existing studies only consider the spatial effects of geographic “proximity” or “adjacency”, lacking a holistic approach, and do not consider the possible effects of “non-neighboring” areas on agricultural carbon emission efficiency. Finally, most existing studies focus on reflecting the samples’ attributes, and only some studies explore the interrelationship among multiple samples, making it difficult to accurately characterize the overall network structure of the spatial correlation network of agricultural carbon emission efficiency.
4. Analysis of Agricultural Carbon Emission Efficiency
In this paper, we use Matlab 2021 software, combine the input–output index system (
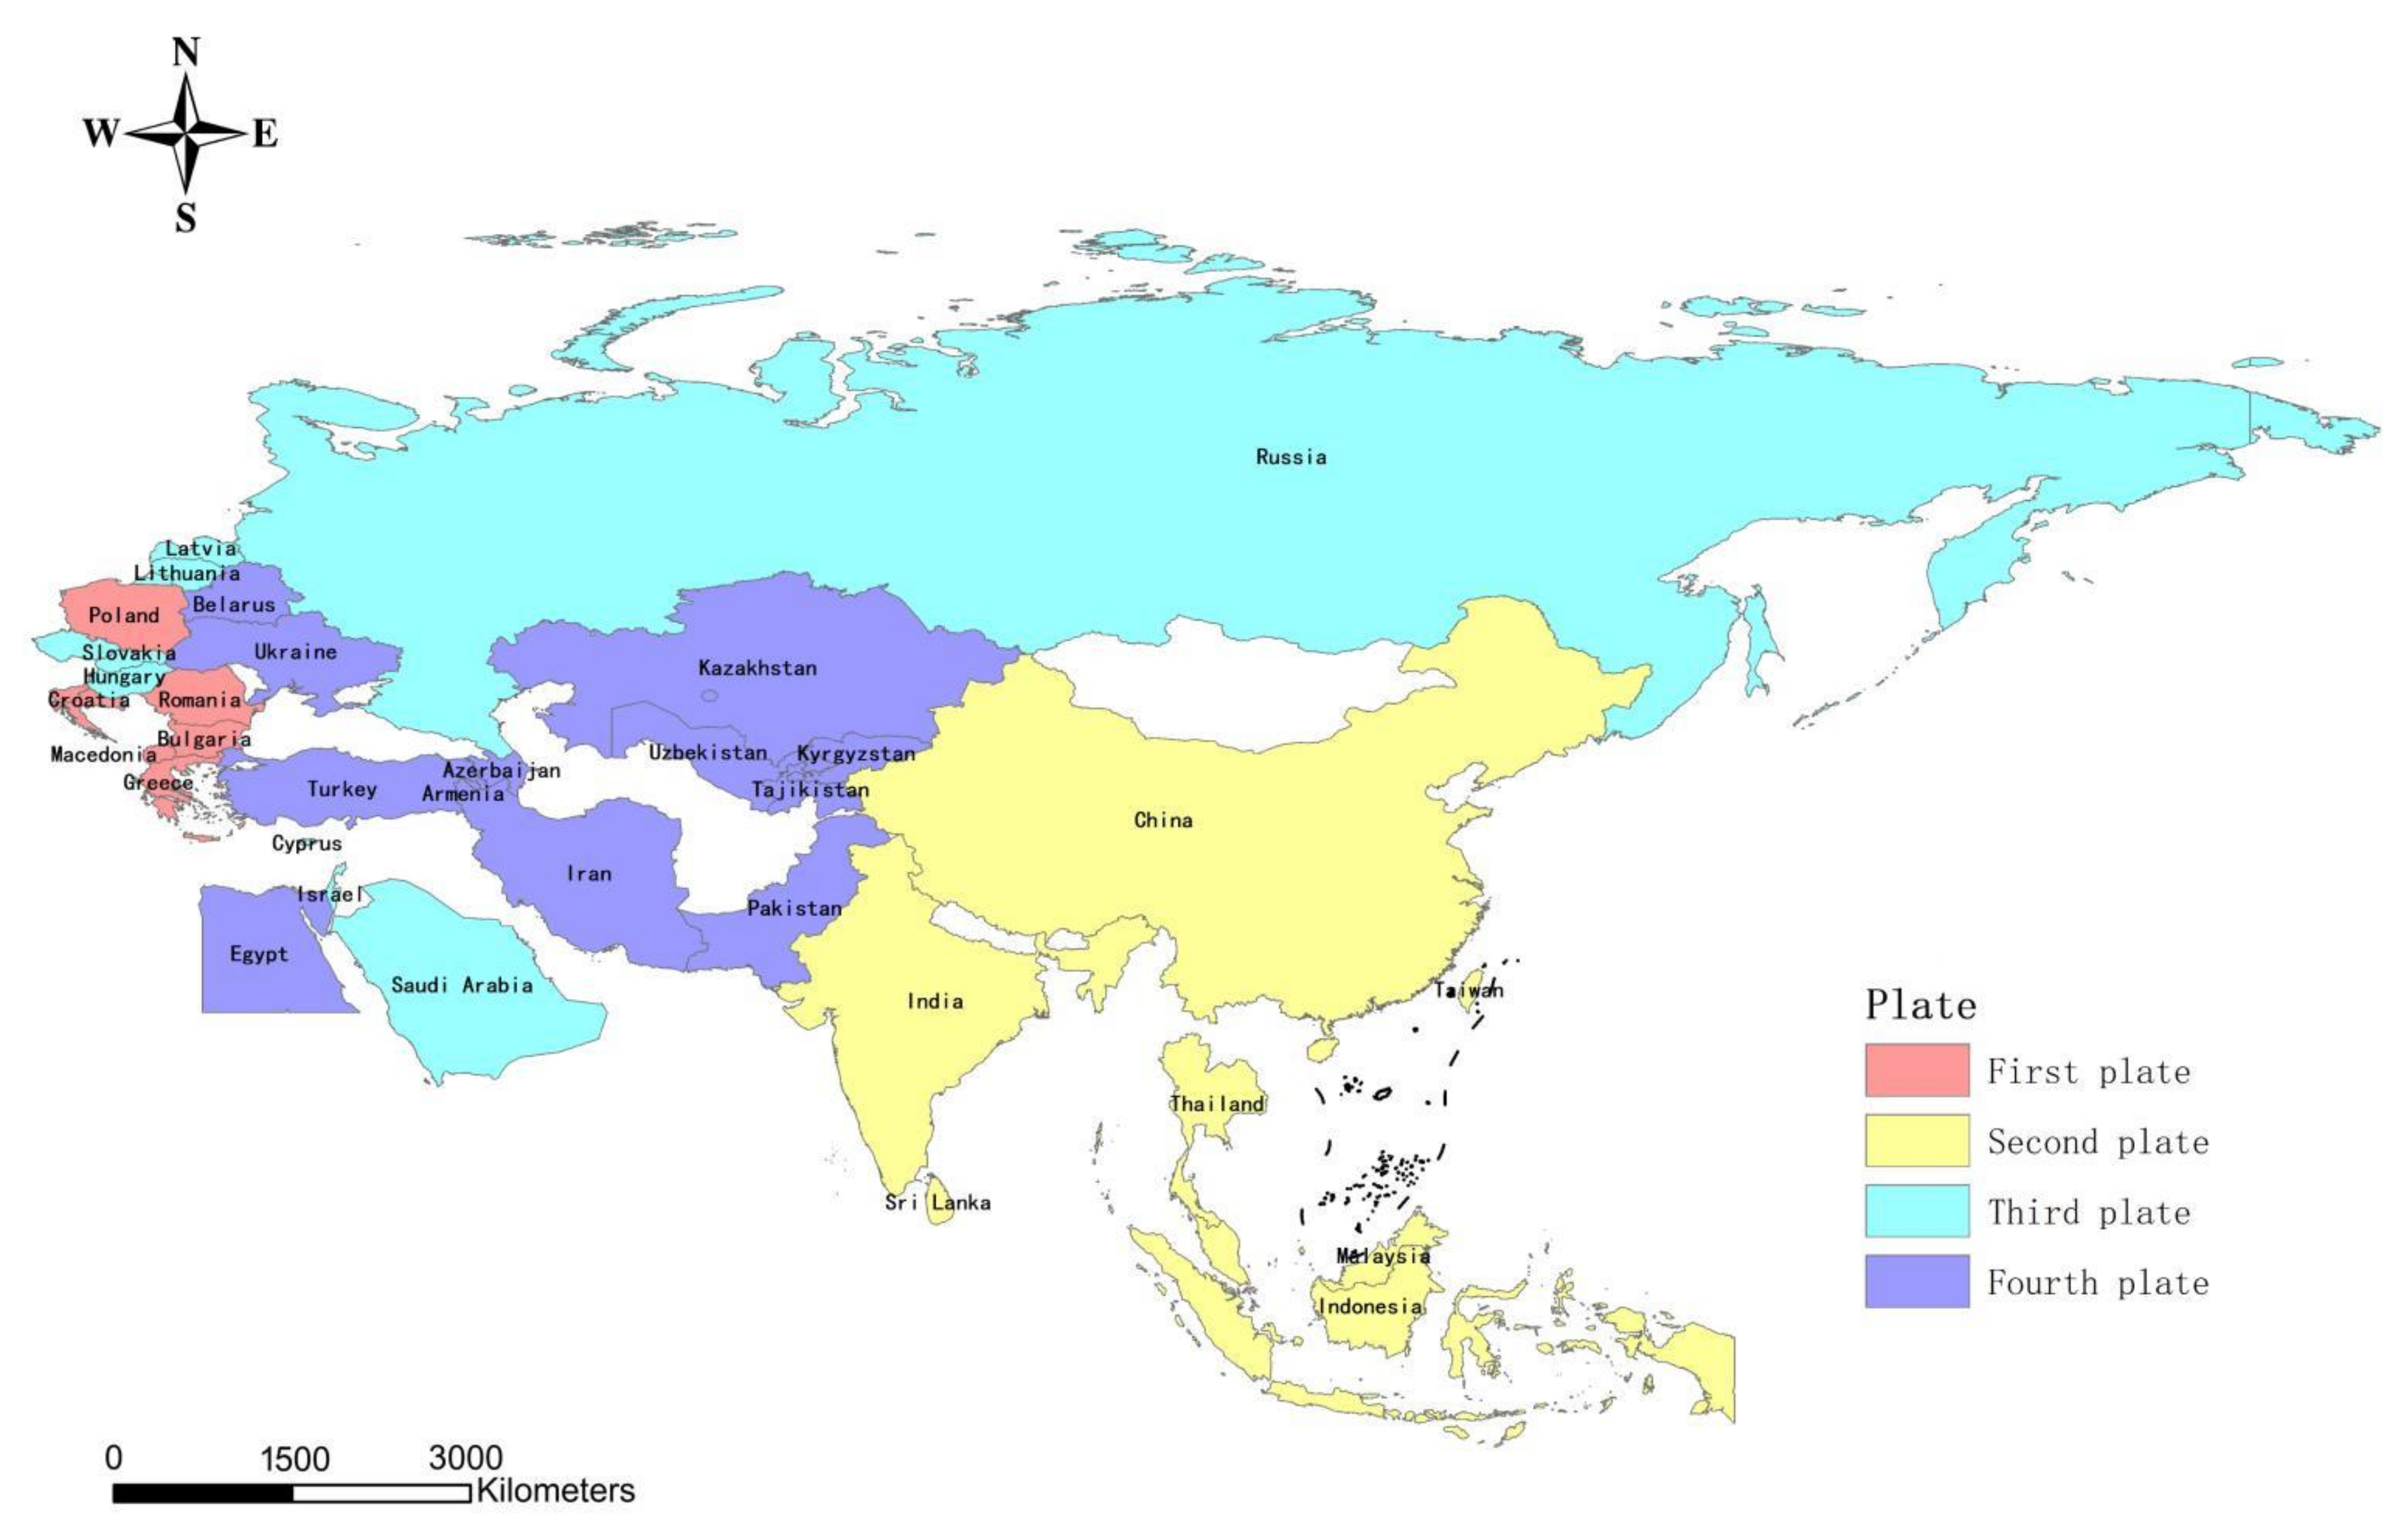
Table 1), and apply the non-expected output SBM model to calculate and obtain the agricultural carbon emission efficiency of 34 countries along the route of the Belt and Road Initiative from 1995 to 2020, and use ArcGIS 10.2 software to draw
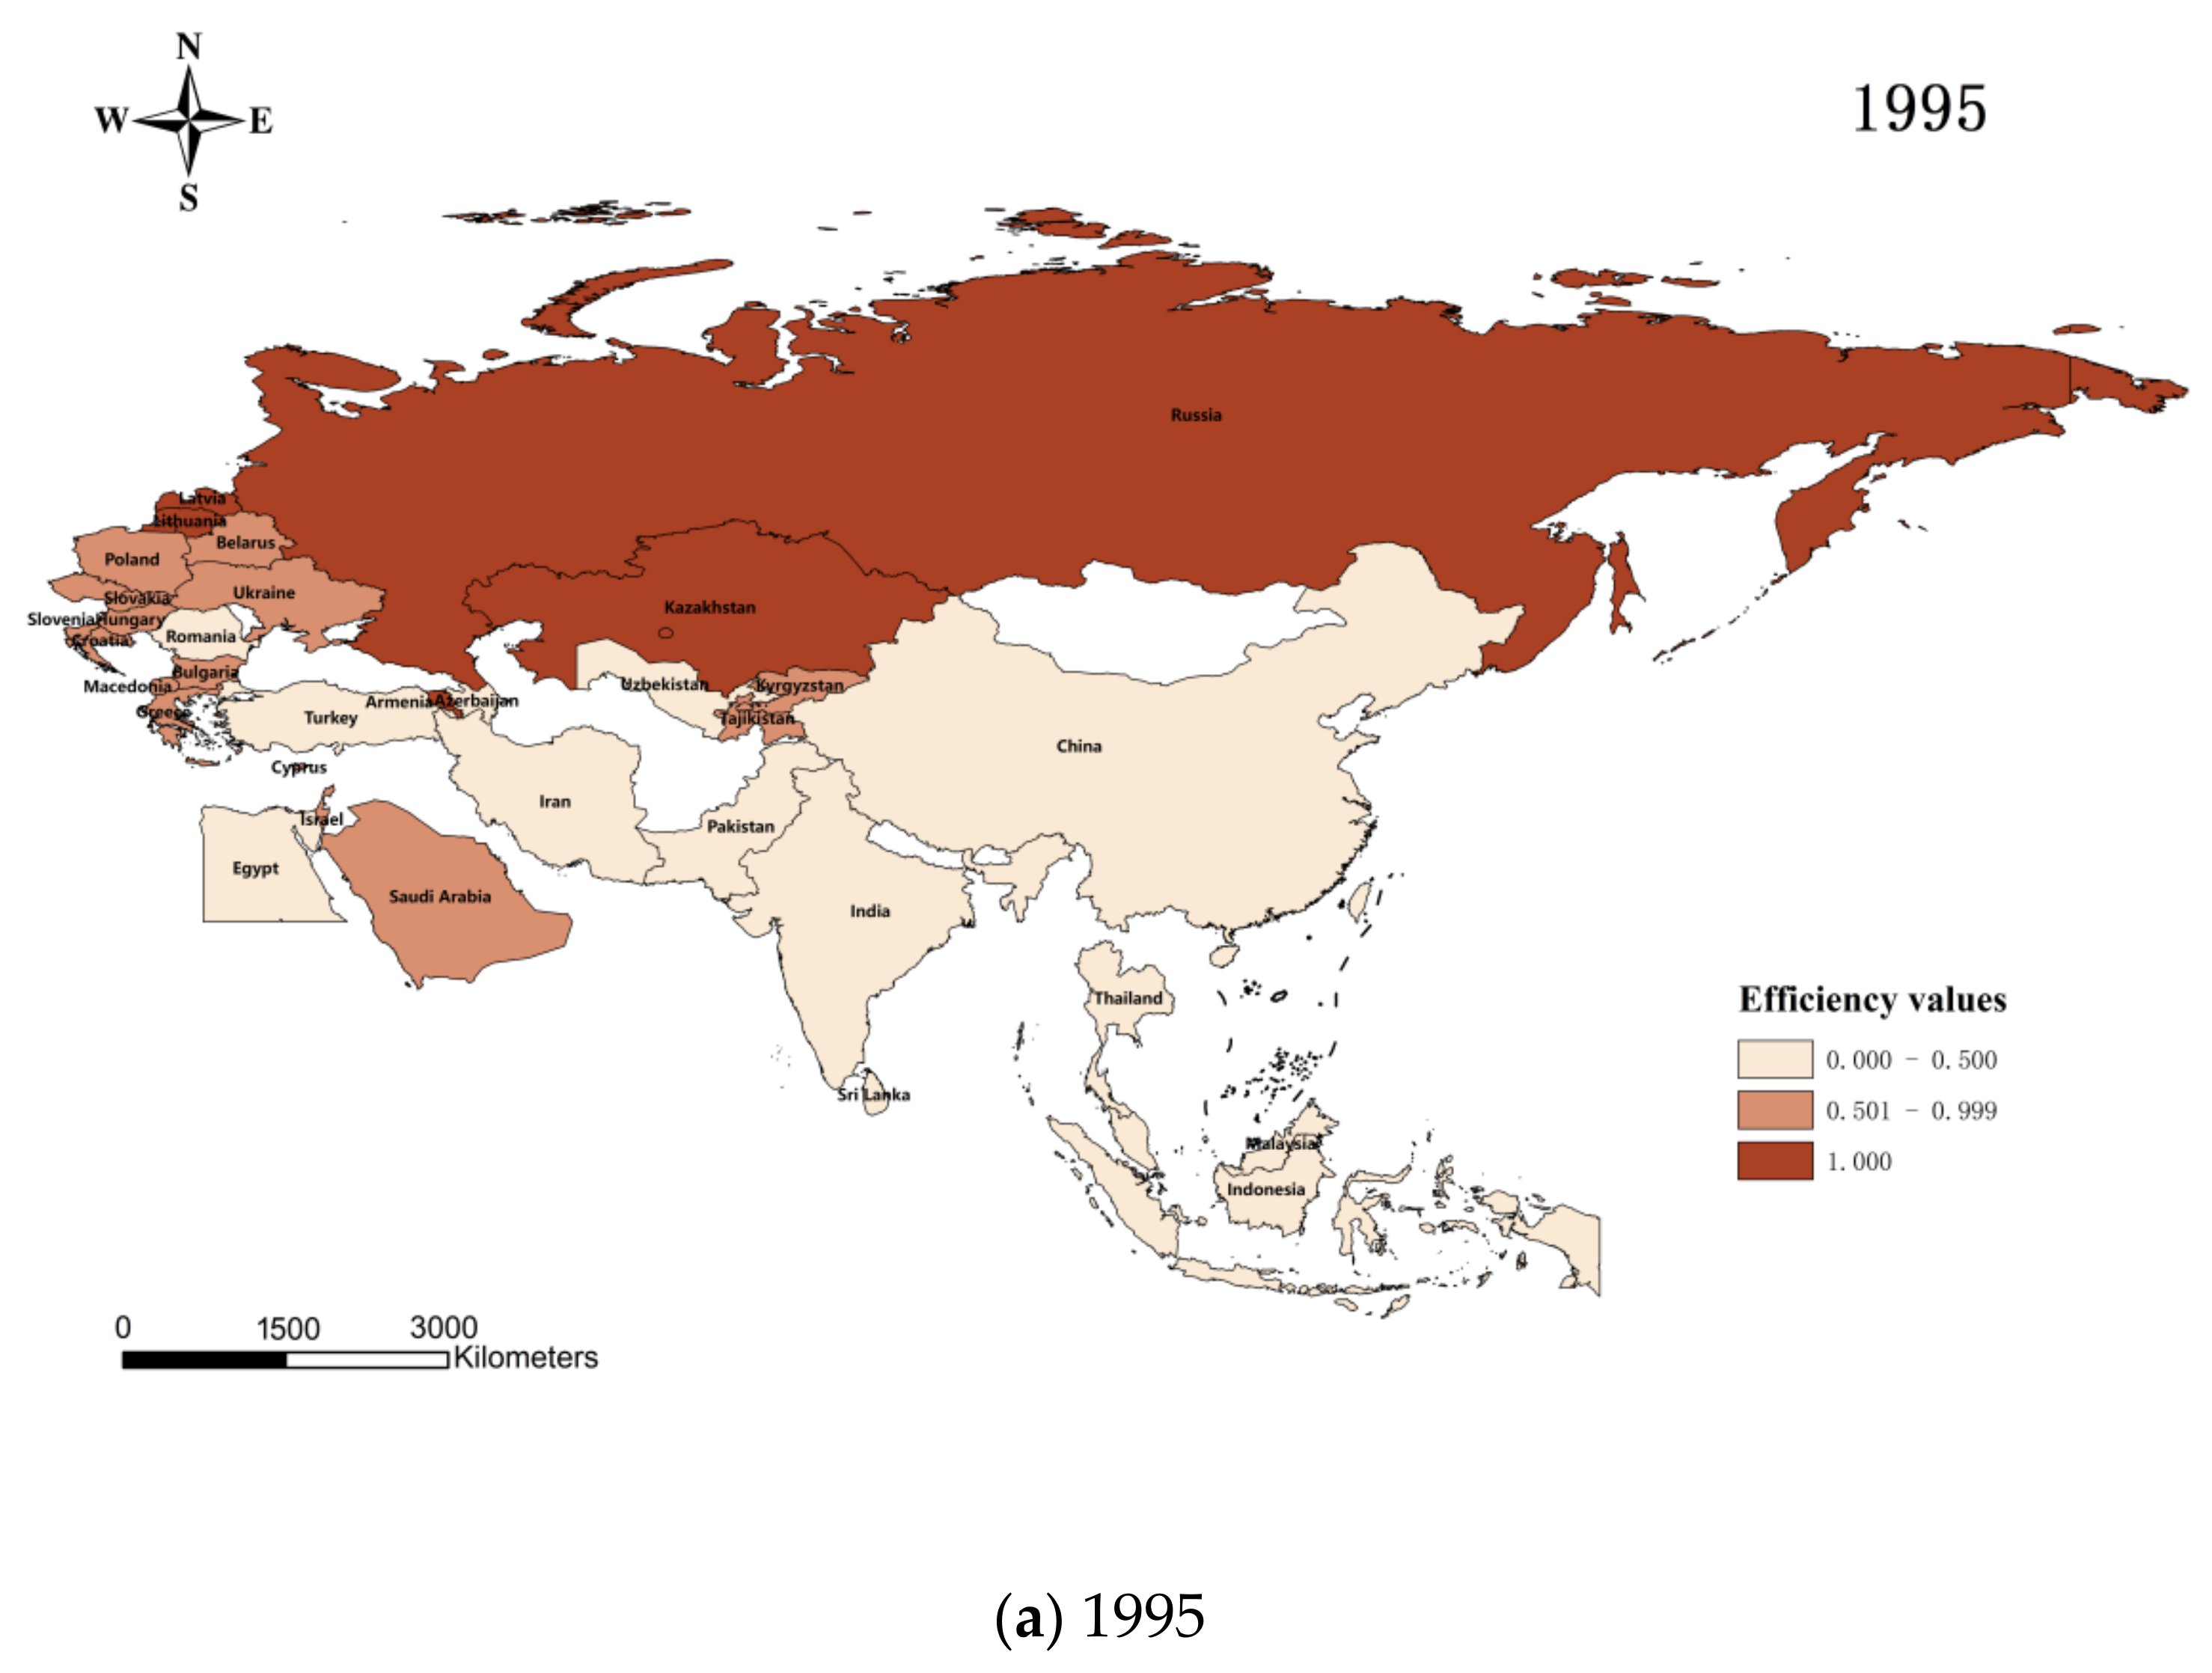
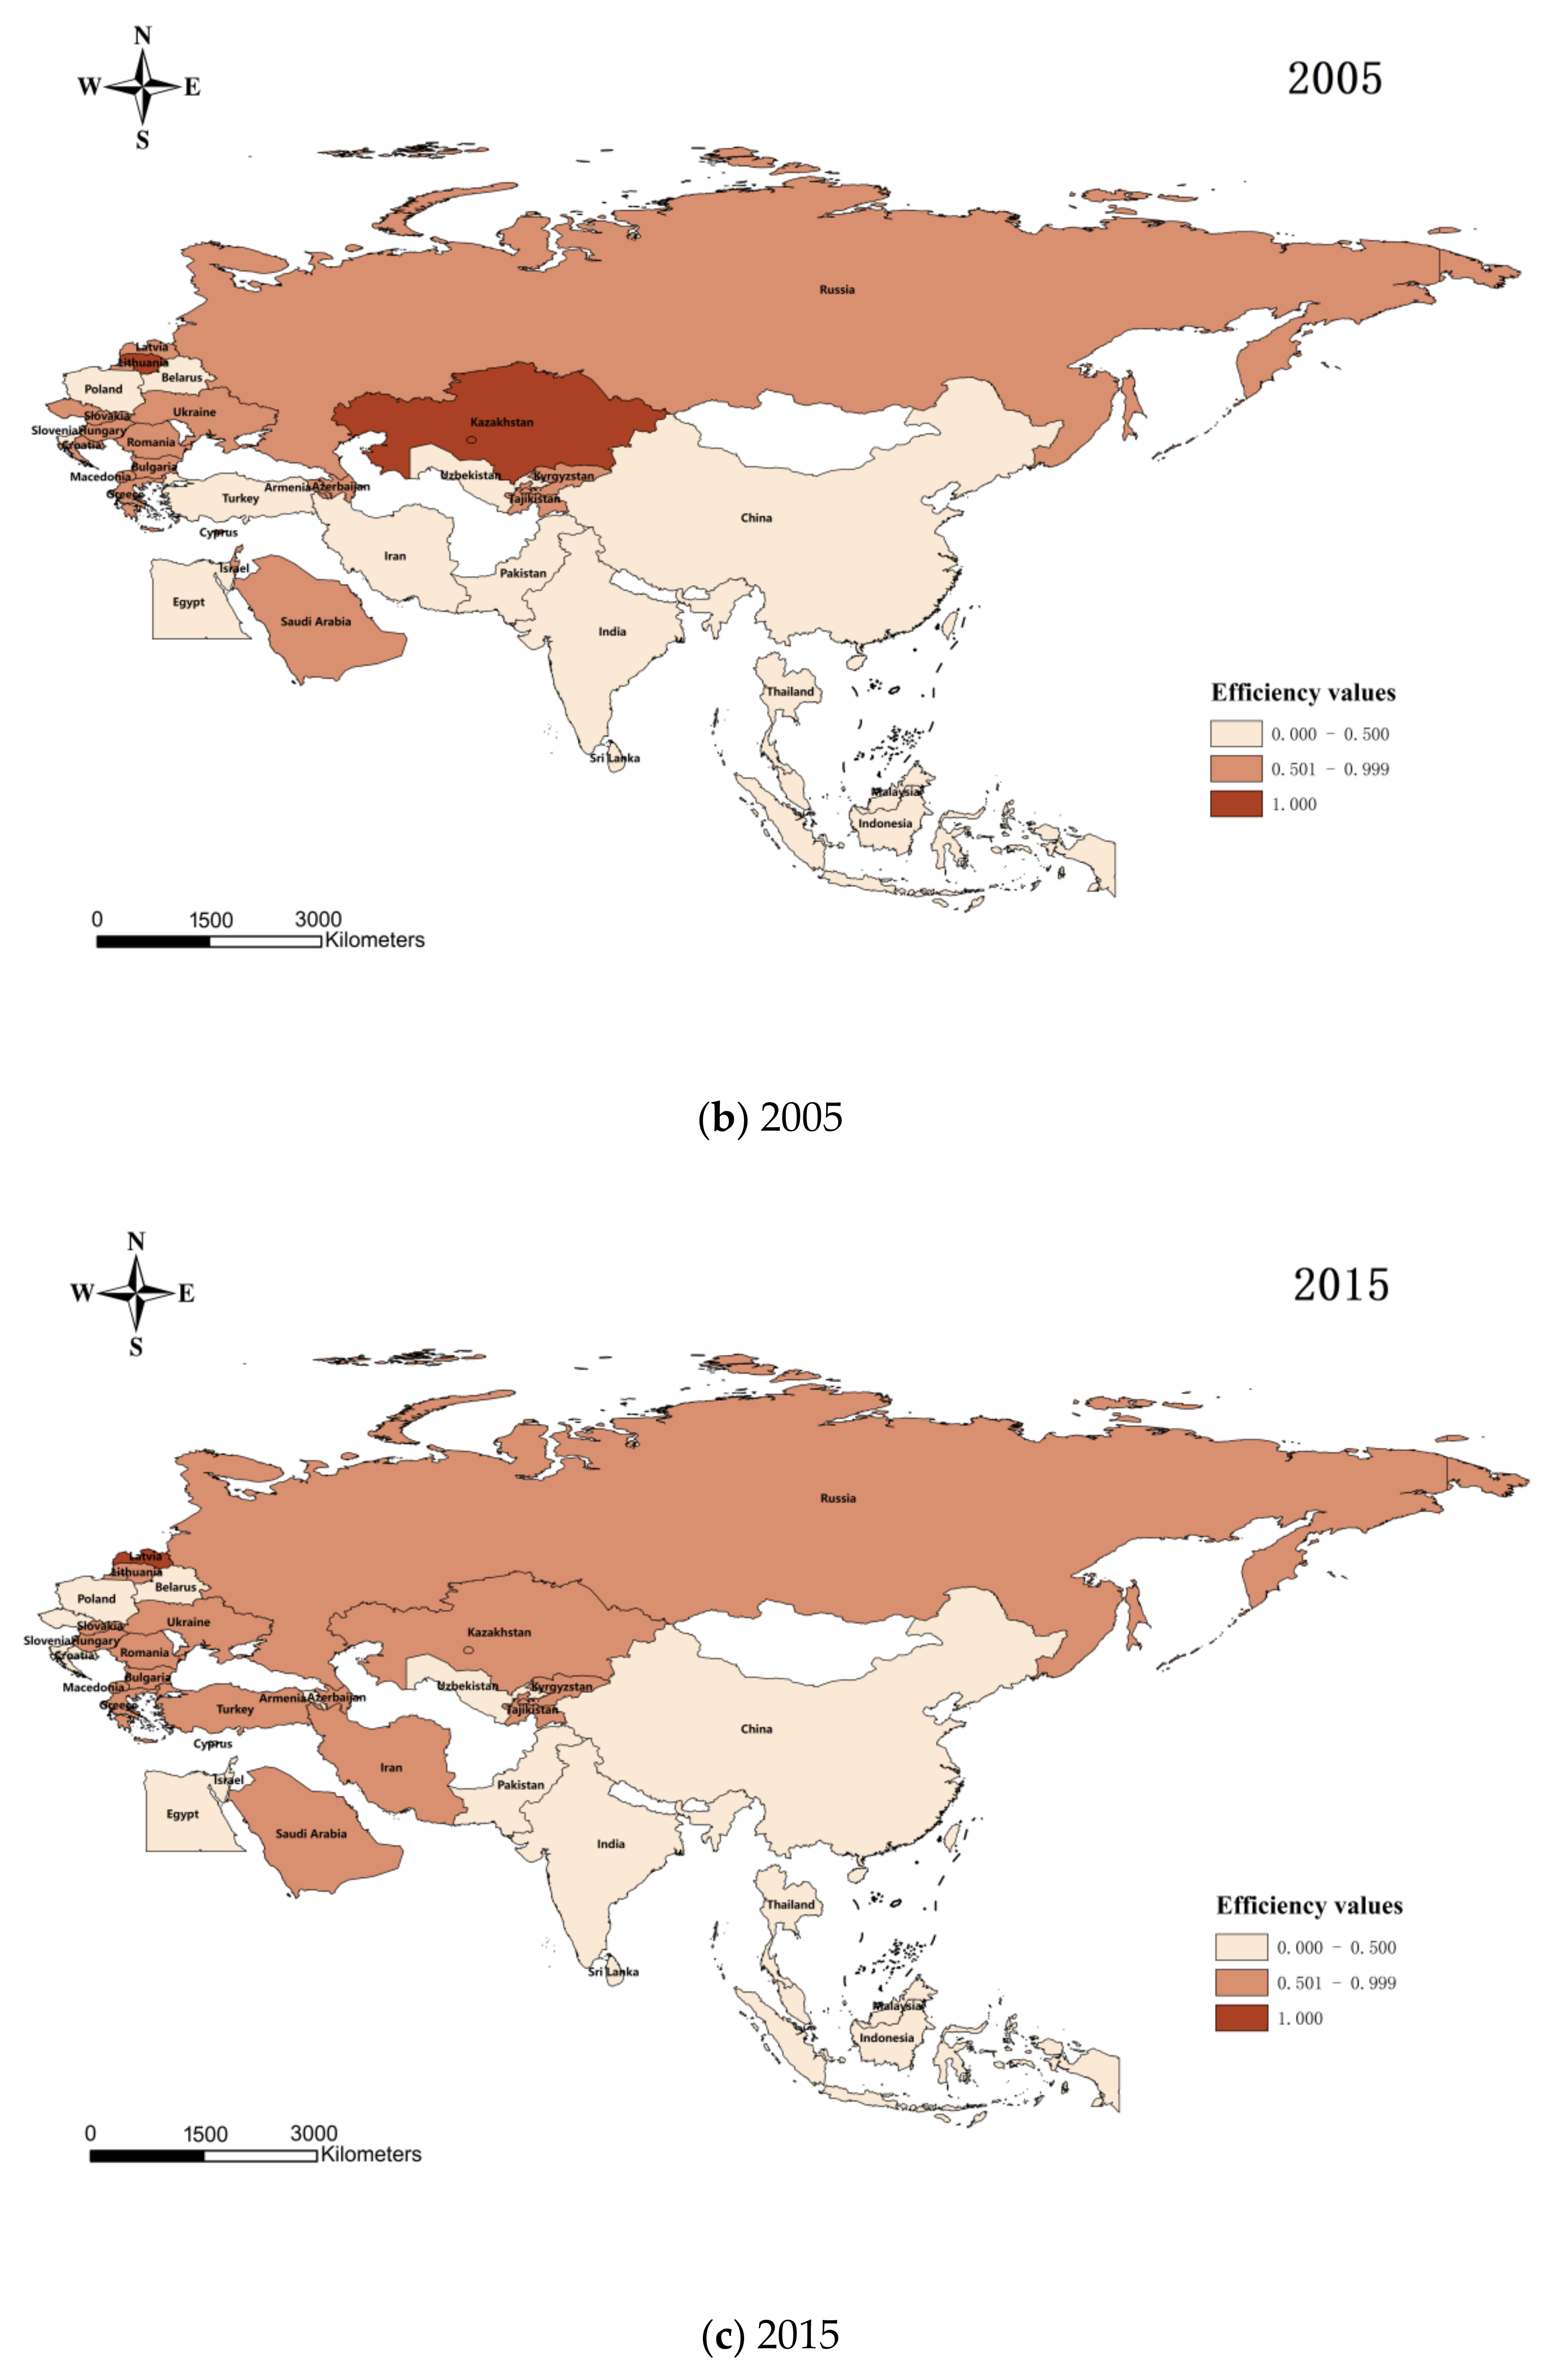
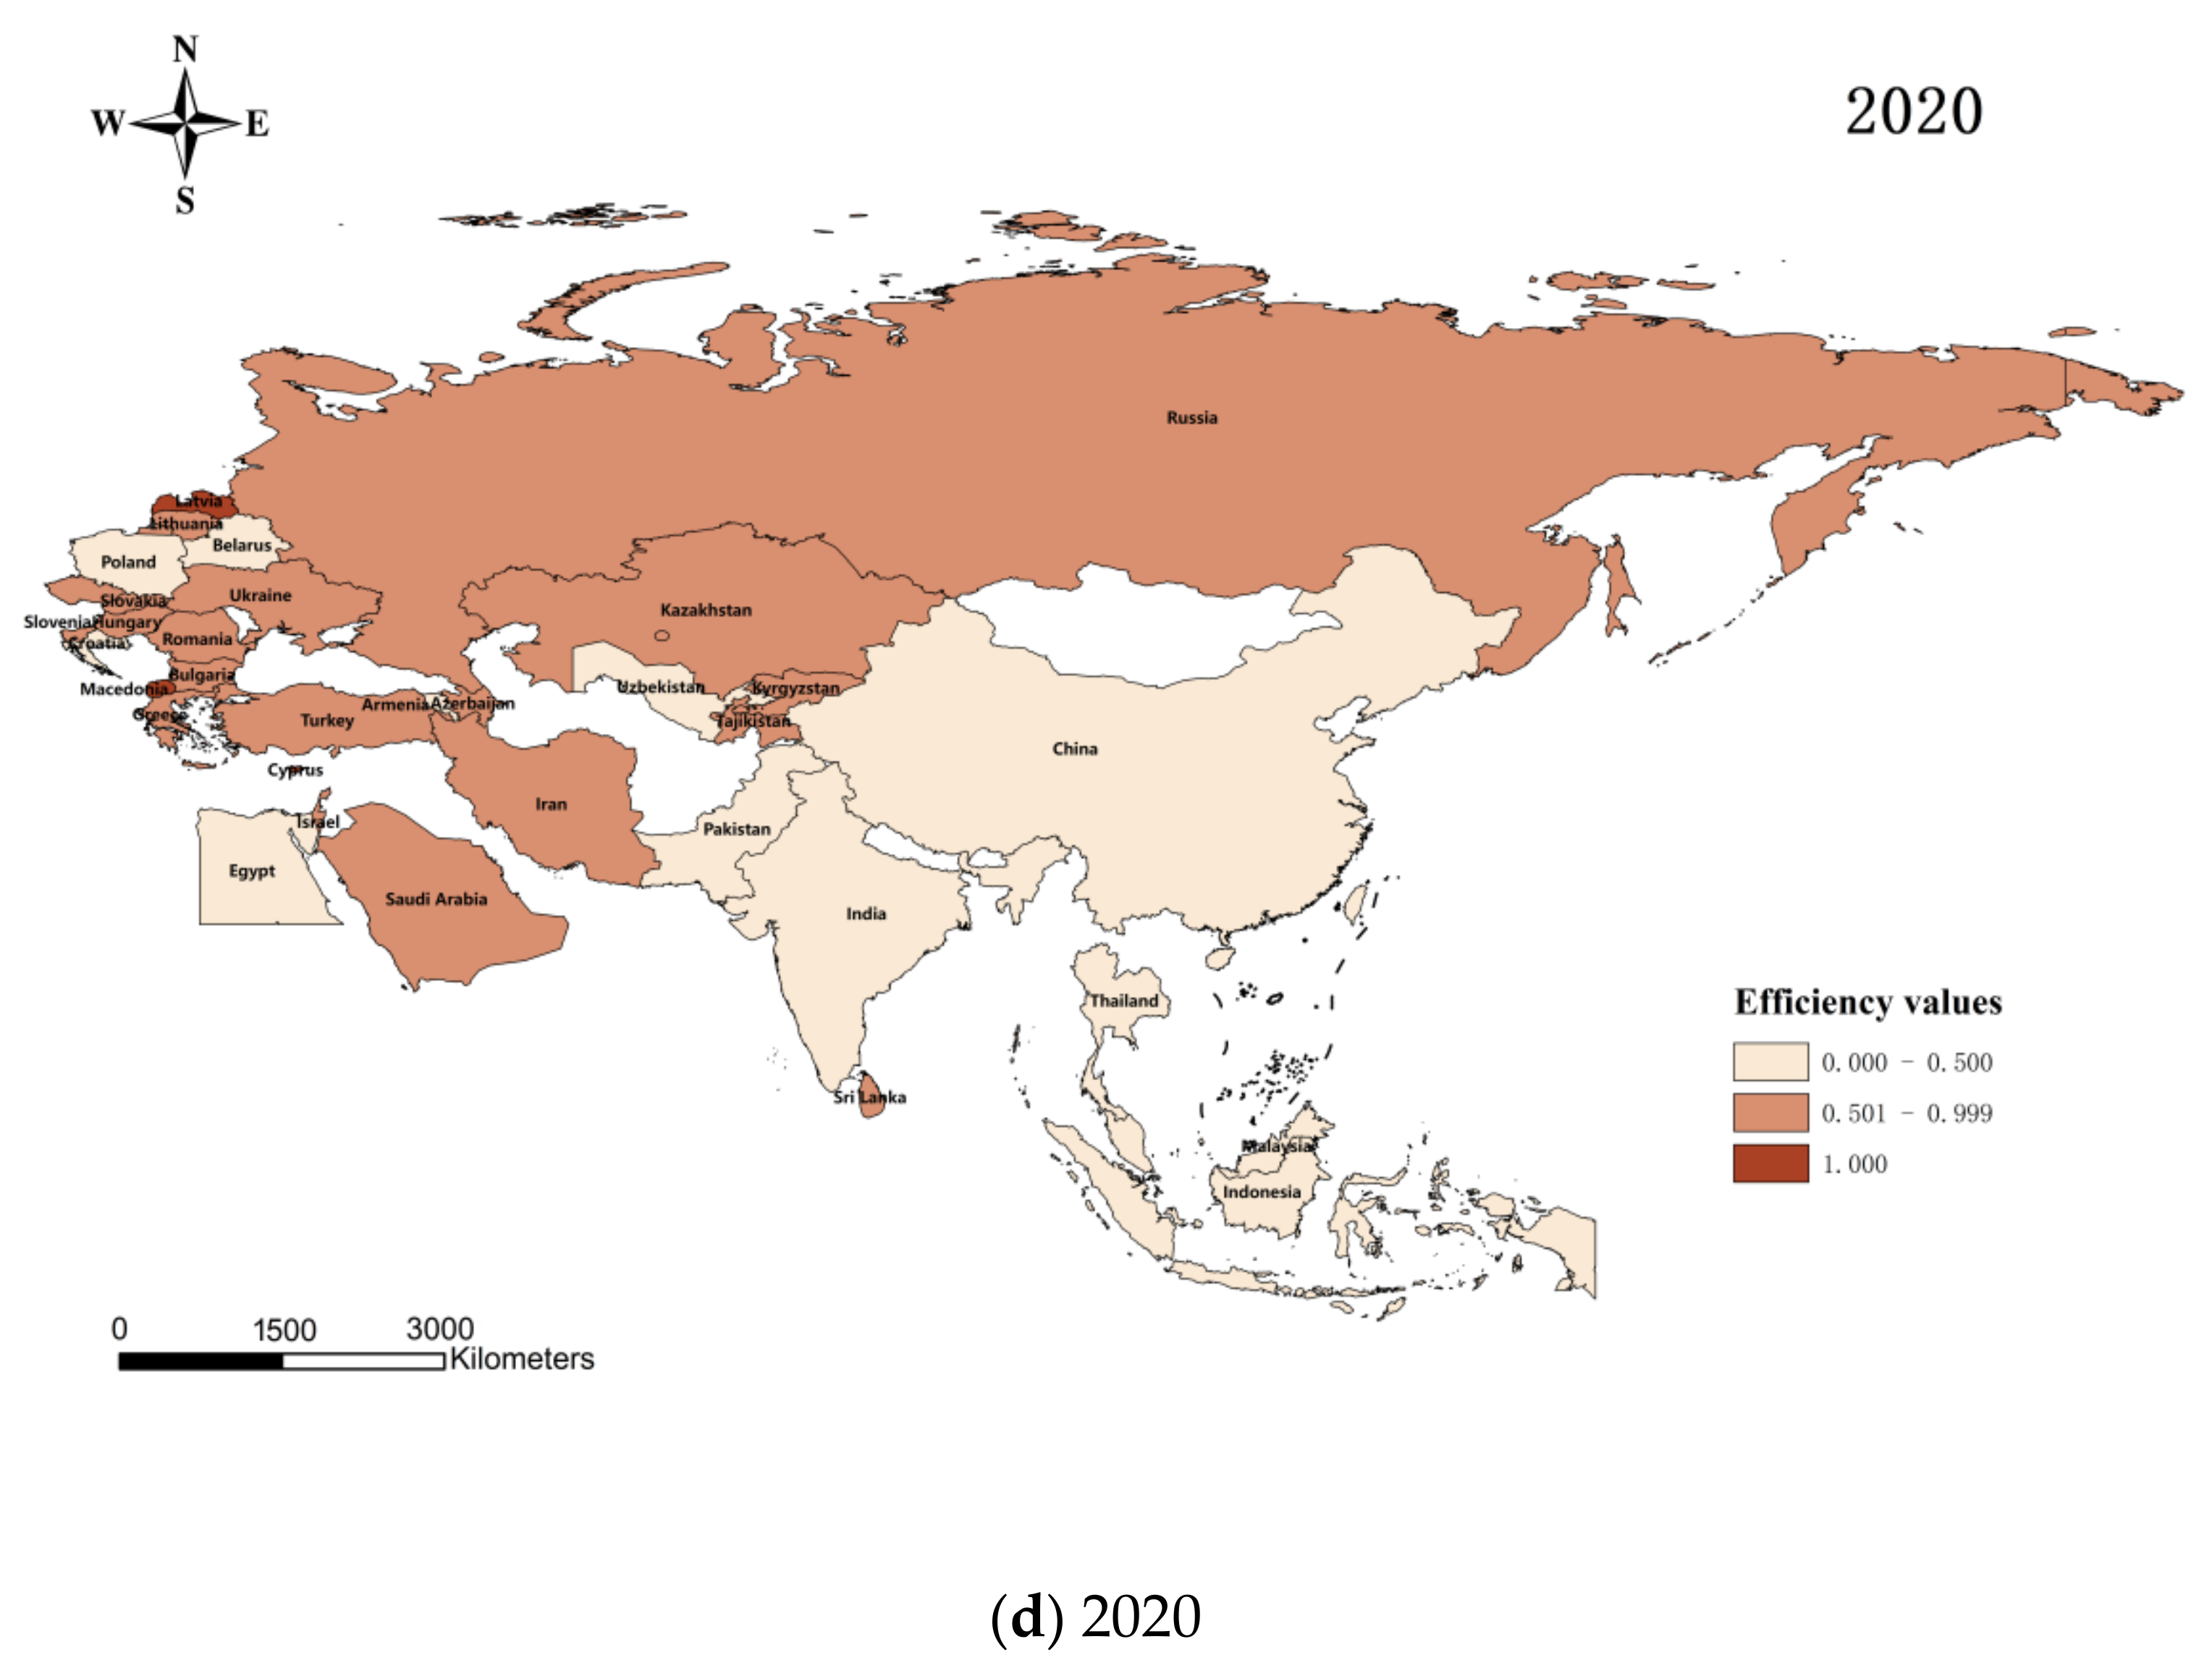
Figure 1. From the figure, we can see the regional differences of agricultural carbon emission efficiency of each country: from 1995 to 2020. The figure shows that regions with higher efficiency of agricultural carbon emissions are less and less every year from 1995 to 2020. It can be seen that the development of low-carbon agriculture in each country lags relatively during the 25 years, and the agricultural carbon emissions increase relatively with the same level of inputs and agricultural economic output, which reflects the incongruous development of agricultural production and environmental protection in each country. The reason may be that the countries along the route of the Belt and Road Initiative have experienced rapid economic development and agricultural production growth in the past decades. With the expansion of agriculture and increased production activities, agricultural carbon emissions may have increased accordingly. Especially in some emerging economies and developing countries, the growth in agricultural production may decrease carbon emission efficiency.
The calculation revealed that each country’s mean value of agricultural carbon emission efficiency decreased from 0.592 to 0.566, with a peak in 2010 (0.660).
Table 4 shows the trends in agricultural carbon emission efficiency in each country in 1995 (mean value of 0.592), 2005 (mean value of 0.566), 2015 (mean value of 0.531), and 2020 (mean value of 0.566). As far as different countries are concerned, in 2020, Macedonia, Latvia, and Cyprus reached the frontier regarding agricultural carbon emission efficiency. The agricultural carbon emission efficiency of 12 countries, including Malaysia, Egypt, Uzbekistan, China, and Indonesia, will still be below 0.500 in 2020, among which Egypt, Belarus, Armenia, and Thailand are mainly affected by climate change and natural environmental constraints, resulting in low agricultural economic output; Pakistan and Croatia may be constrained by the relatively backward agricultural production technology and productivity; countries such as Malaysia, Uzbekistan, and Poland have environmental problems such as water and soil pollution, soil erosion and fertility decline due to the excessive use of chemical fertilizers; India and Indonesia have high agricultural carbon emissions due to farmers burning crop waste and other ways to clean up their farmlands. On the other hand, China’s problems are due to excessive use of agricultural inputs such as chemical fertilizers and pesticides and irrational disposal of agricultural waste such as livestock manure and crop residues, which aggravate soil and water pollution. Overall, within the study interval, the efficiency of agricultural carbon emissions fluctuated widely among countries, with high room for improvement and significant gaps between different countries.
5. Analysis of Spatially Linked Network Structure of Agricultural Carbon Emission Efficiency in Countries along the Route of the Belt and Road Initiative
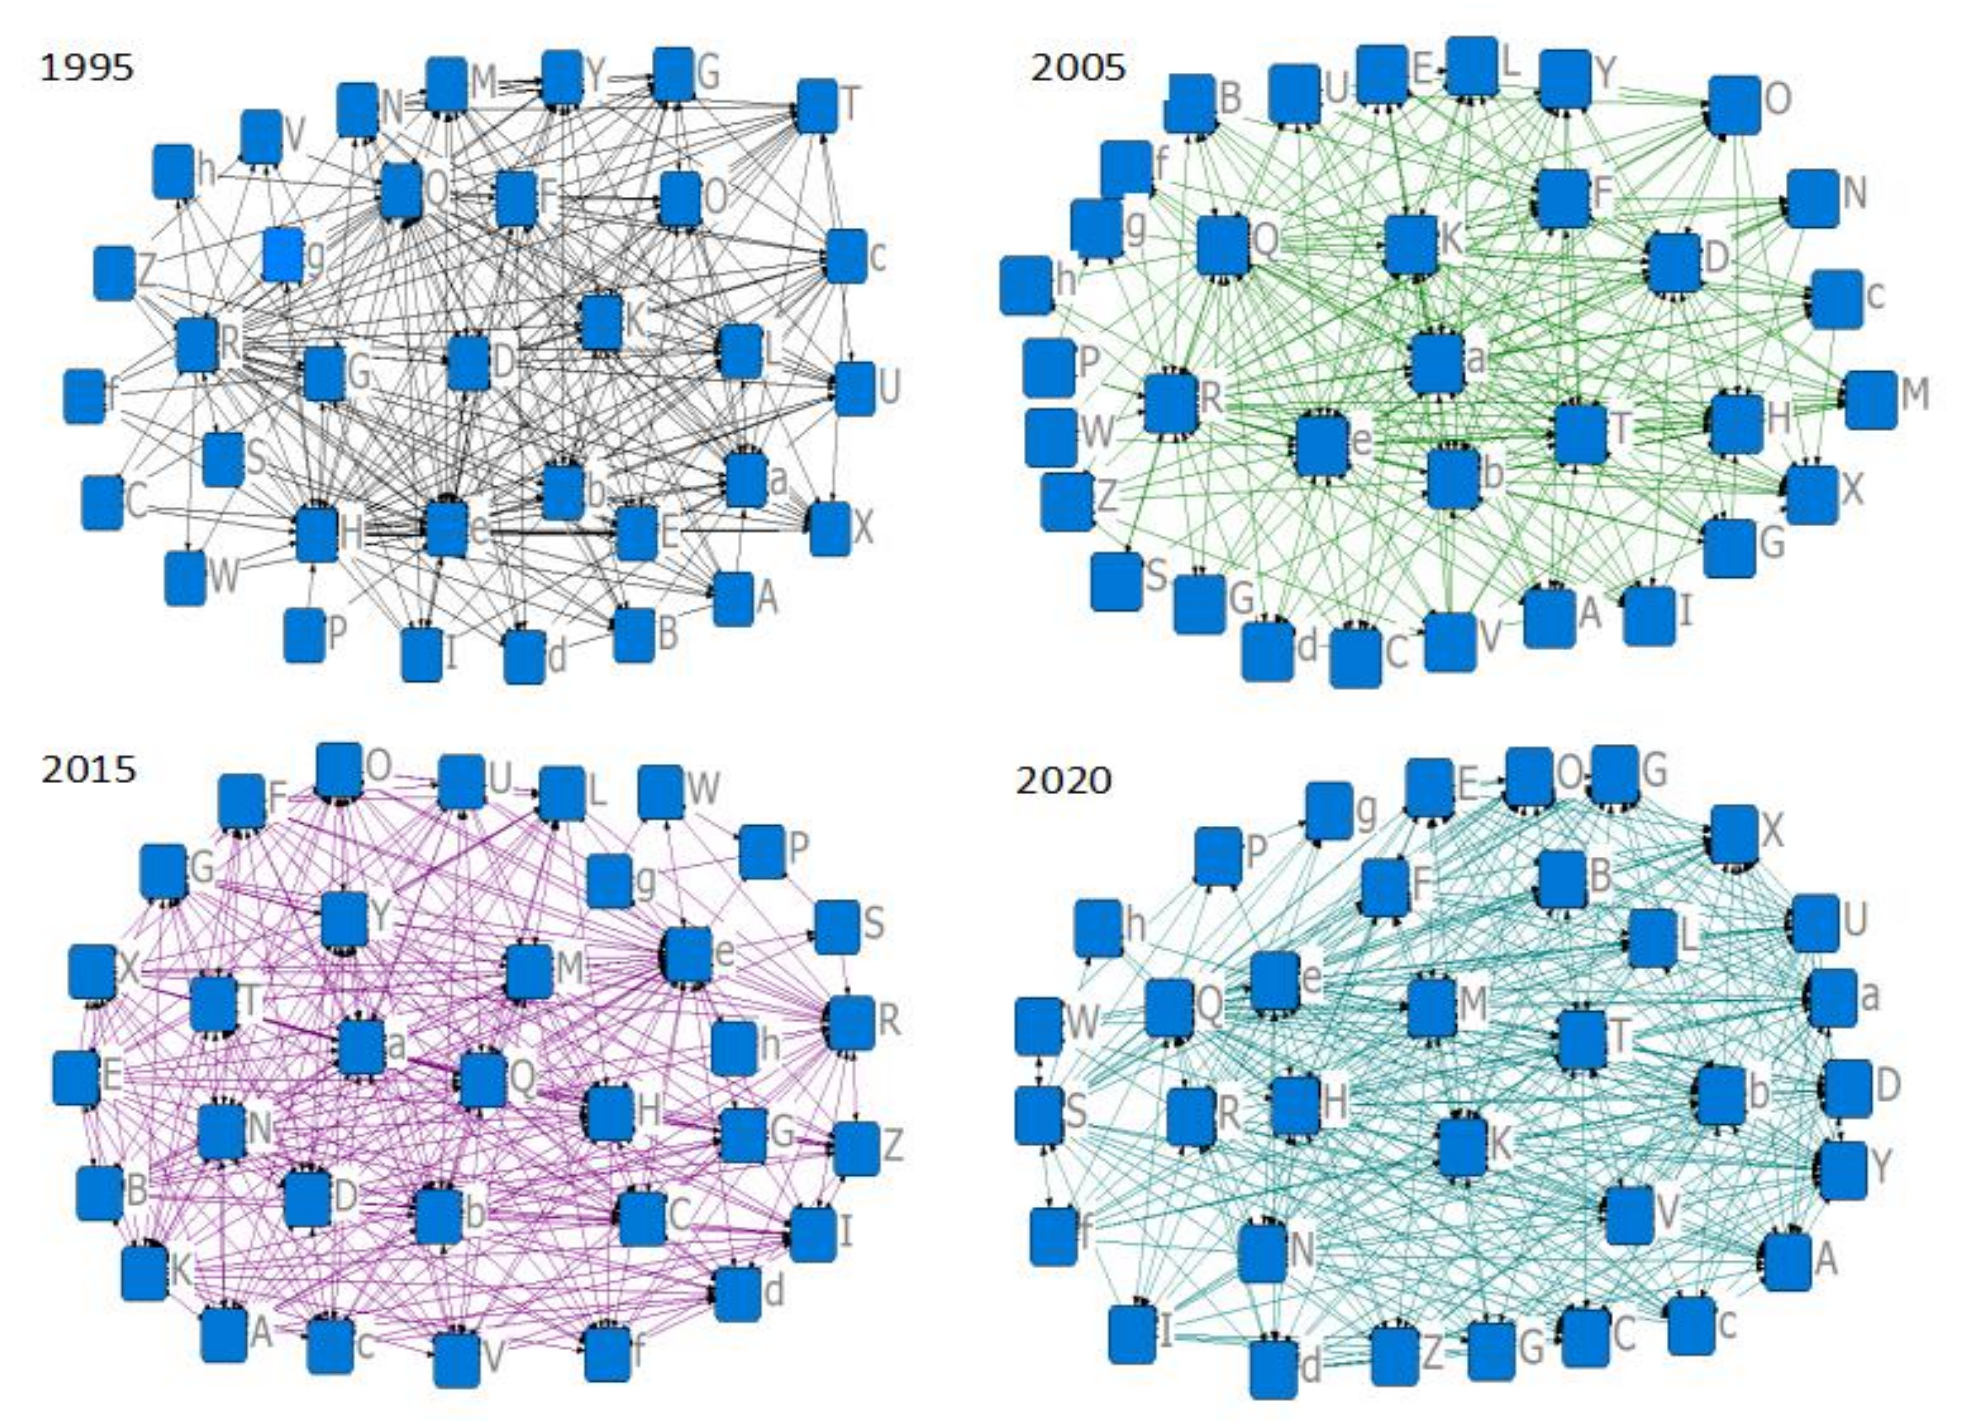
Using the above measured agricultural carbon emission efficiency as the base data for constructing the spatial correlation matrix, the spatial correlation binarization matrix (GL) of agricultural carbon emission efficiency of 34 countries along the route of the Belt and Road Initiative is constructed by combining the results obtained from Equation (1). Then the social network analysis tool UCINET 6 software is applied to produce the spatial network topology map of agricultural carbon emission efficiency of 34 countries along the route of the Belt and Road Initiative. Four years, 1995, 2005, 2015, and 2020, were selected as representatives of the study for image presentation, as shown in
Figure 2. It can be seen that the efficiency of agricultural carbon emissions in 34 countries along the route of the Belt and Road Initiative has broken through the traditional spatial geographic proximity spillover property. There are no isolated points in the network; the whole presents complex spatially linked network characteristics.
Specifically, the countries along the route of the Belt and Road Initiative have formed an interconnected and mutually influencing network. Each country in it has potential connections and links with other countries. The nodes in the network represent different countries, while the edges represent the relationships and interactions among them. The complexity of this network is reflected in the propagation and impact of agricultural carbon efficiency. When a country’s agricultural carbon emission efficiency changes, its impact is not limited to its neighboring countries but spreads through the network to other countries in the whole network. Thus, in this network, the agricultural carbon emission efficiency among countries is interconnected, forming an interdependent network feature.
This complex spatially linked network feature suggests that the influence and interaction of the whole network need to be considered when assessing and improving the agricultural carbon emission efficiency of countries along the route of the Belt and Road Initiative. Rather than relying only on geographical proximity, a comprehensive understanding of the dynamics of nodes and edges in the network is needed to develop more effective policies and measures to improve agricultural carbon emission efficiency and promote sustainable agricultural development.
5.1. Analysis of the Overall Characteristics of the Spatial Correlation Network of Agricultural Carbon Emission Efficiency in Countries along the Route of the Belt and Road Initiative
Using UCINET 6 software, the overall characteristics of the spatially linked network of agricultural carbon emission efficiency of 34 countries along the route of the Belt and Road Initiative from 1995 to 2020 were calculated.
- (1)
Network density. As seen in
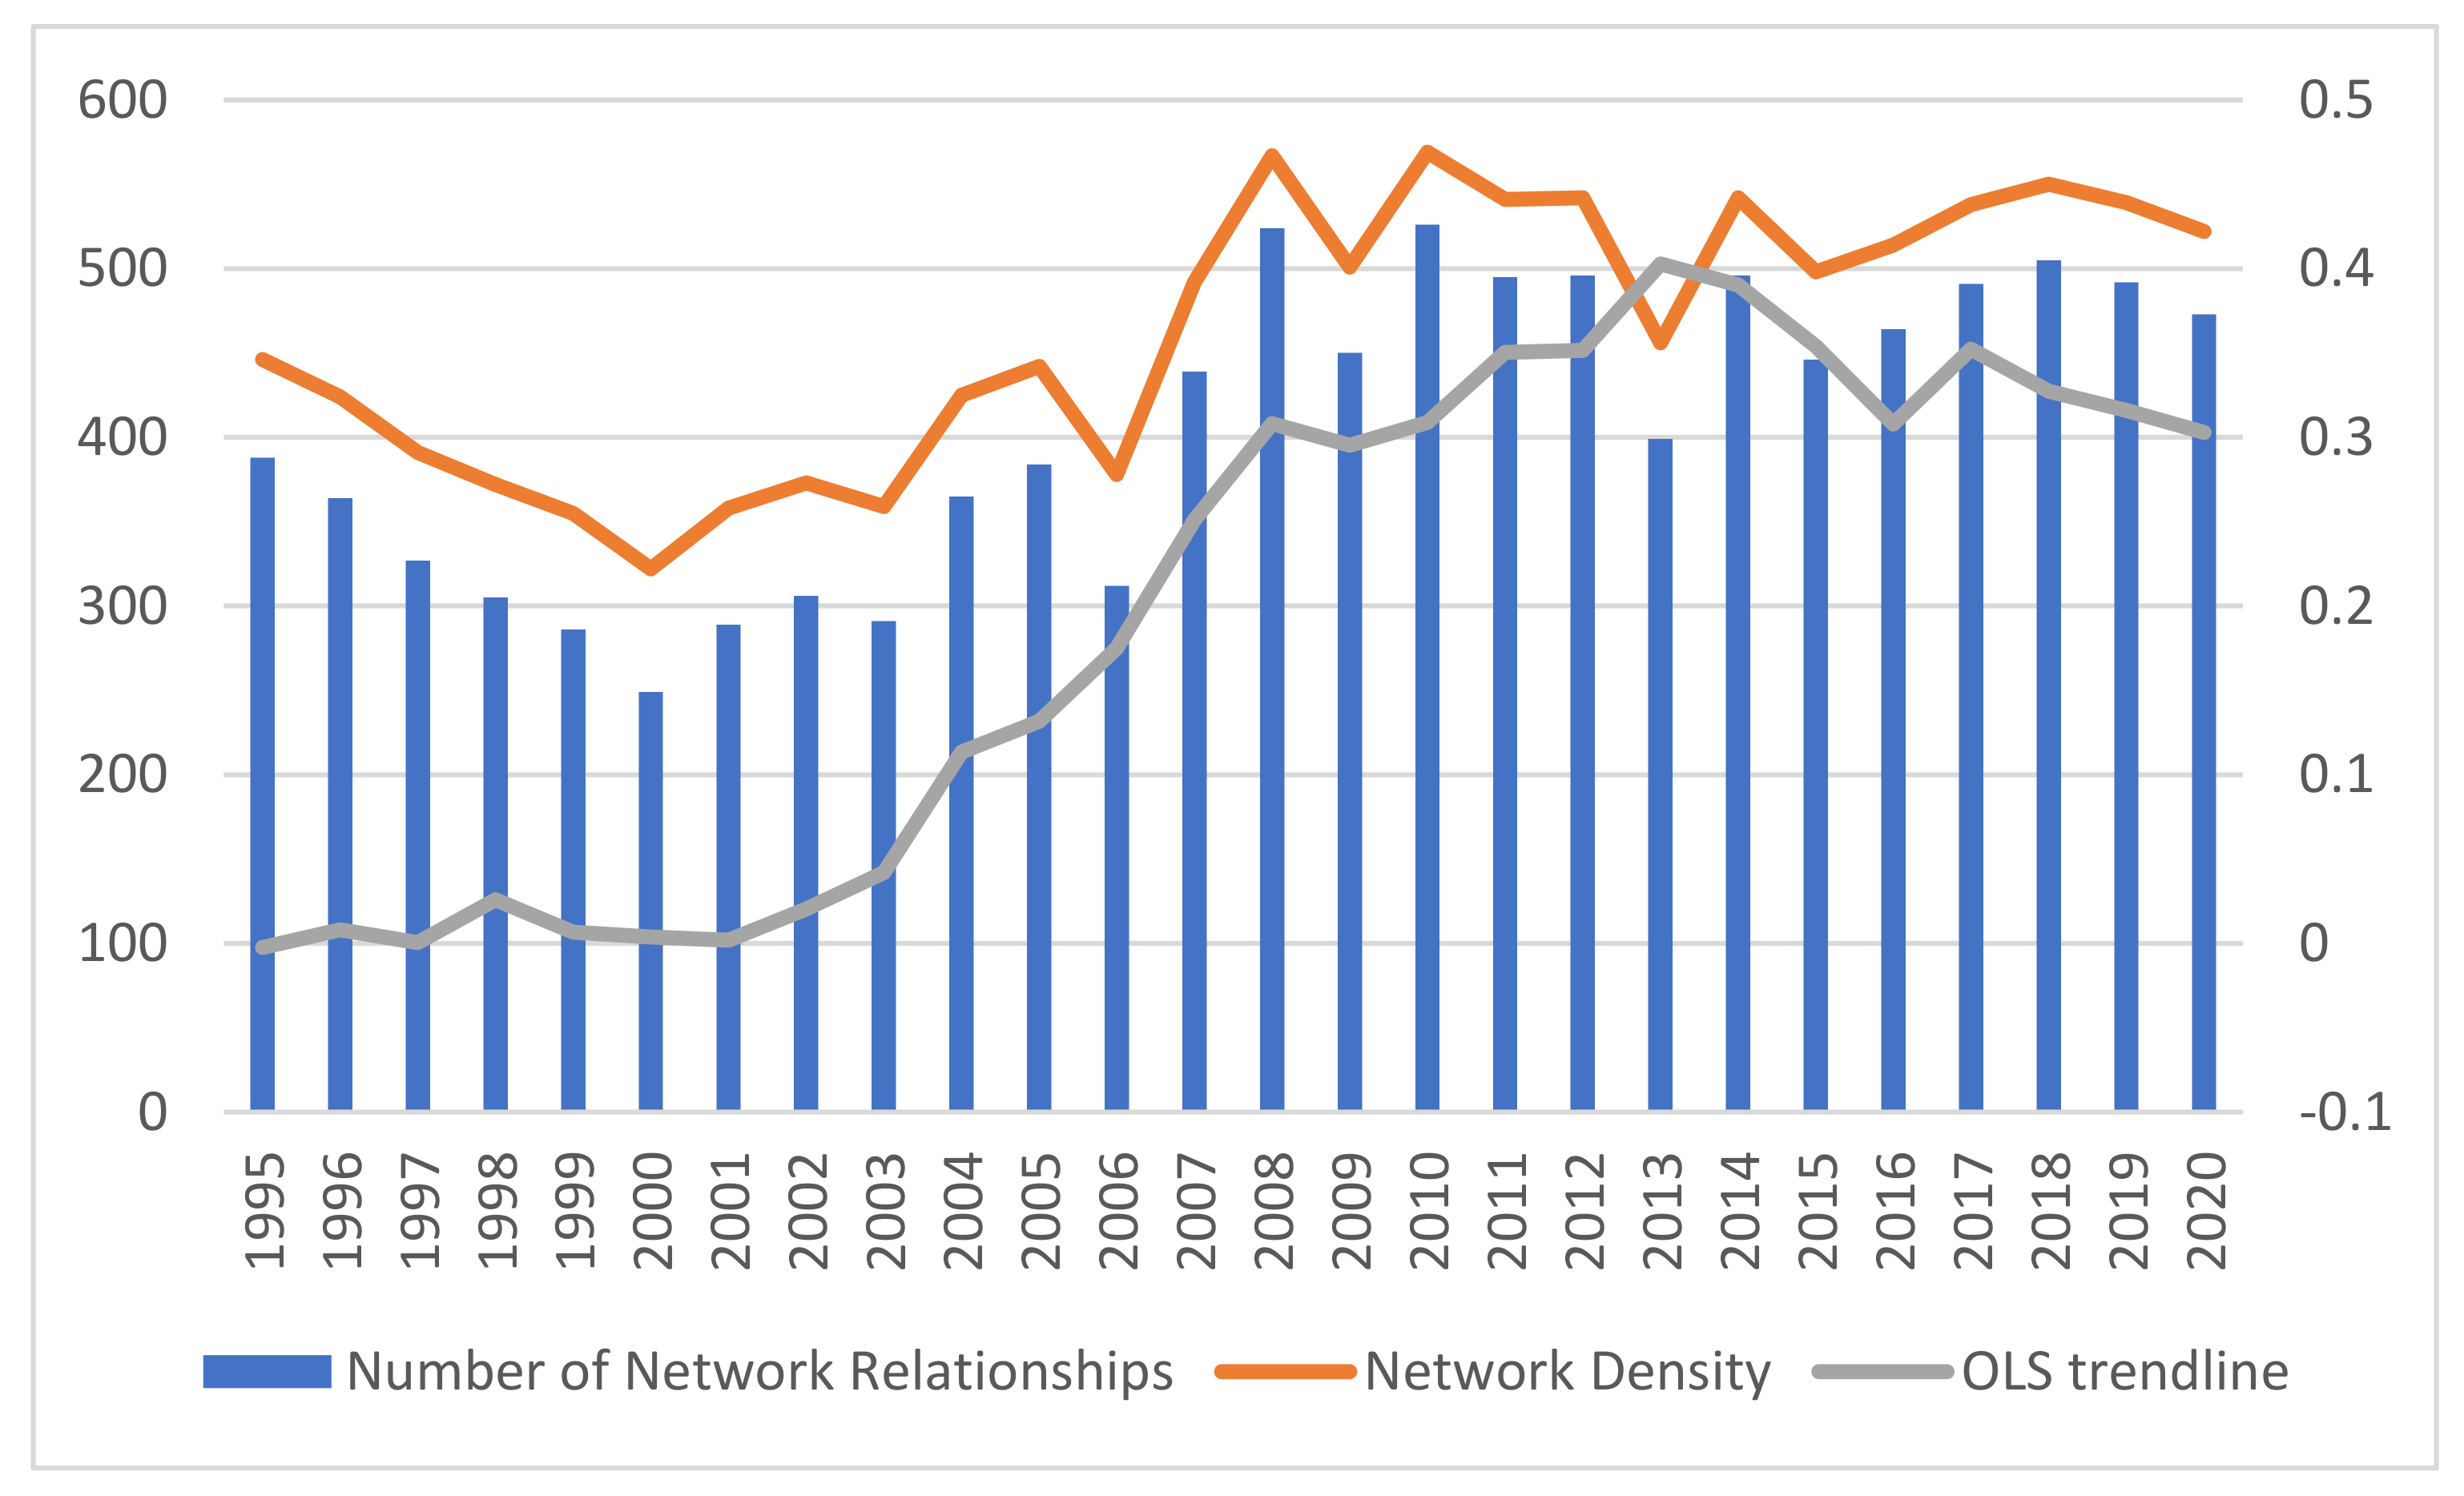
Figure 3, the number of network relationships of the spatially linked network of agricultural carbon emission efficiency in 34 countries along the route of the Belt and Road Initiative shows a fluctuating upward trend, from 388 in 1995 to 473 in 2000, for an overall long-term increase of 21.91%, of which the highest value was 526 in 2010. Network density also shows a fluctuating upward trend, increasing from 0.346 to 0.422, for an overall long-term increase of 21.97%, of which the highest value was 0.469. Moreover, adding the OSL trend line in the figure, it can be seen that the smooth OSL trend line rises from 2001 to 2013, after which the marginal gain strongly decreases, and the rate of increase in the trend line slows down, which indicates that the agricultural carbon emission efficiency is gradually stabilizing. The spatial correlation network of agricultural carbon emission efficiency is gradually converging to a balanced state, and the variability is gradually decreasing. It can be seen that the spatial correlation network of agricultural carbon emission efficiency among countries has increased in intensity and strengthened the interaction among countries in the past 25 years. On the other hand, the opening of China-European trains and the promotion of the Belt and Road Initiative have provided support and impetus for the diffusion of agricultural technologies and the flow of agricultural factors among countries and provided a guarantee for the formation of the spatial correlation of agricultural carbon emission efficiency.
Although the number of network relationships in the spatial association network of agricultural carbon emission efficiency among countries in the study interval has been dramatically improved, there is still a significant gap compared with the total number of 1122 maximum possible relationships (34 × 33). Therefore, there is still room for improving the spatial correlation relationships of agricultural carbon emission efficiency in countries along the route.
- (2)
Network correlation.
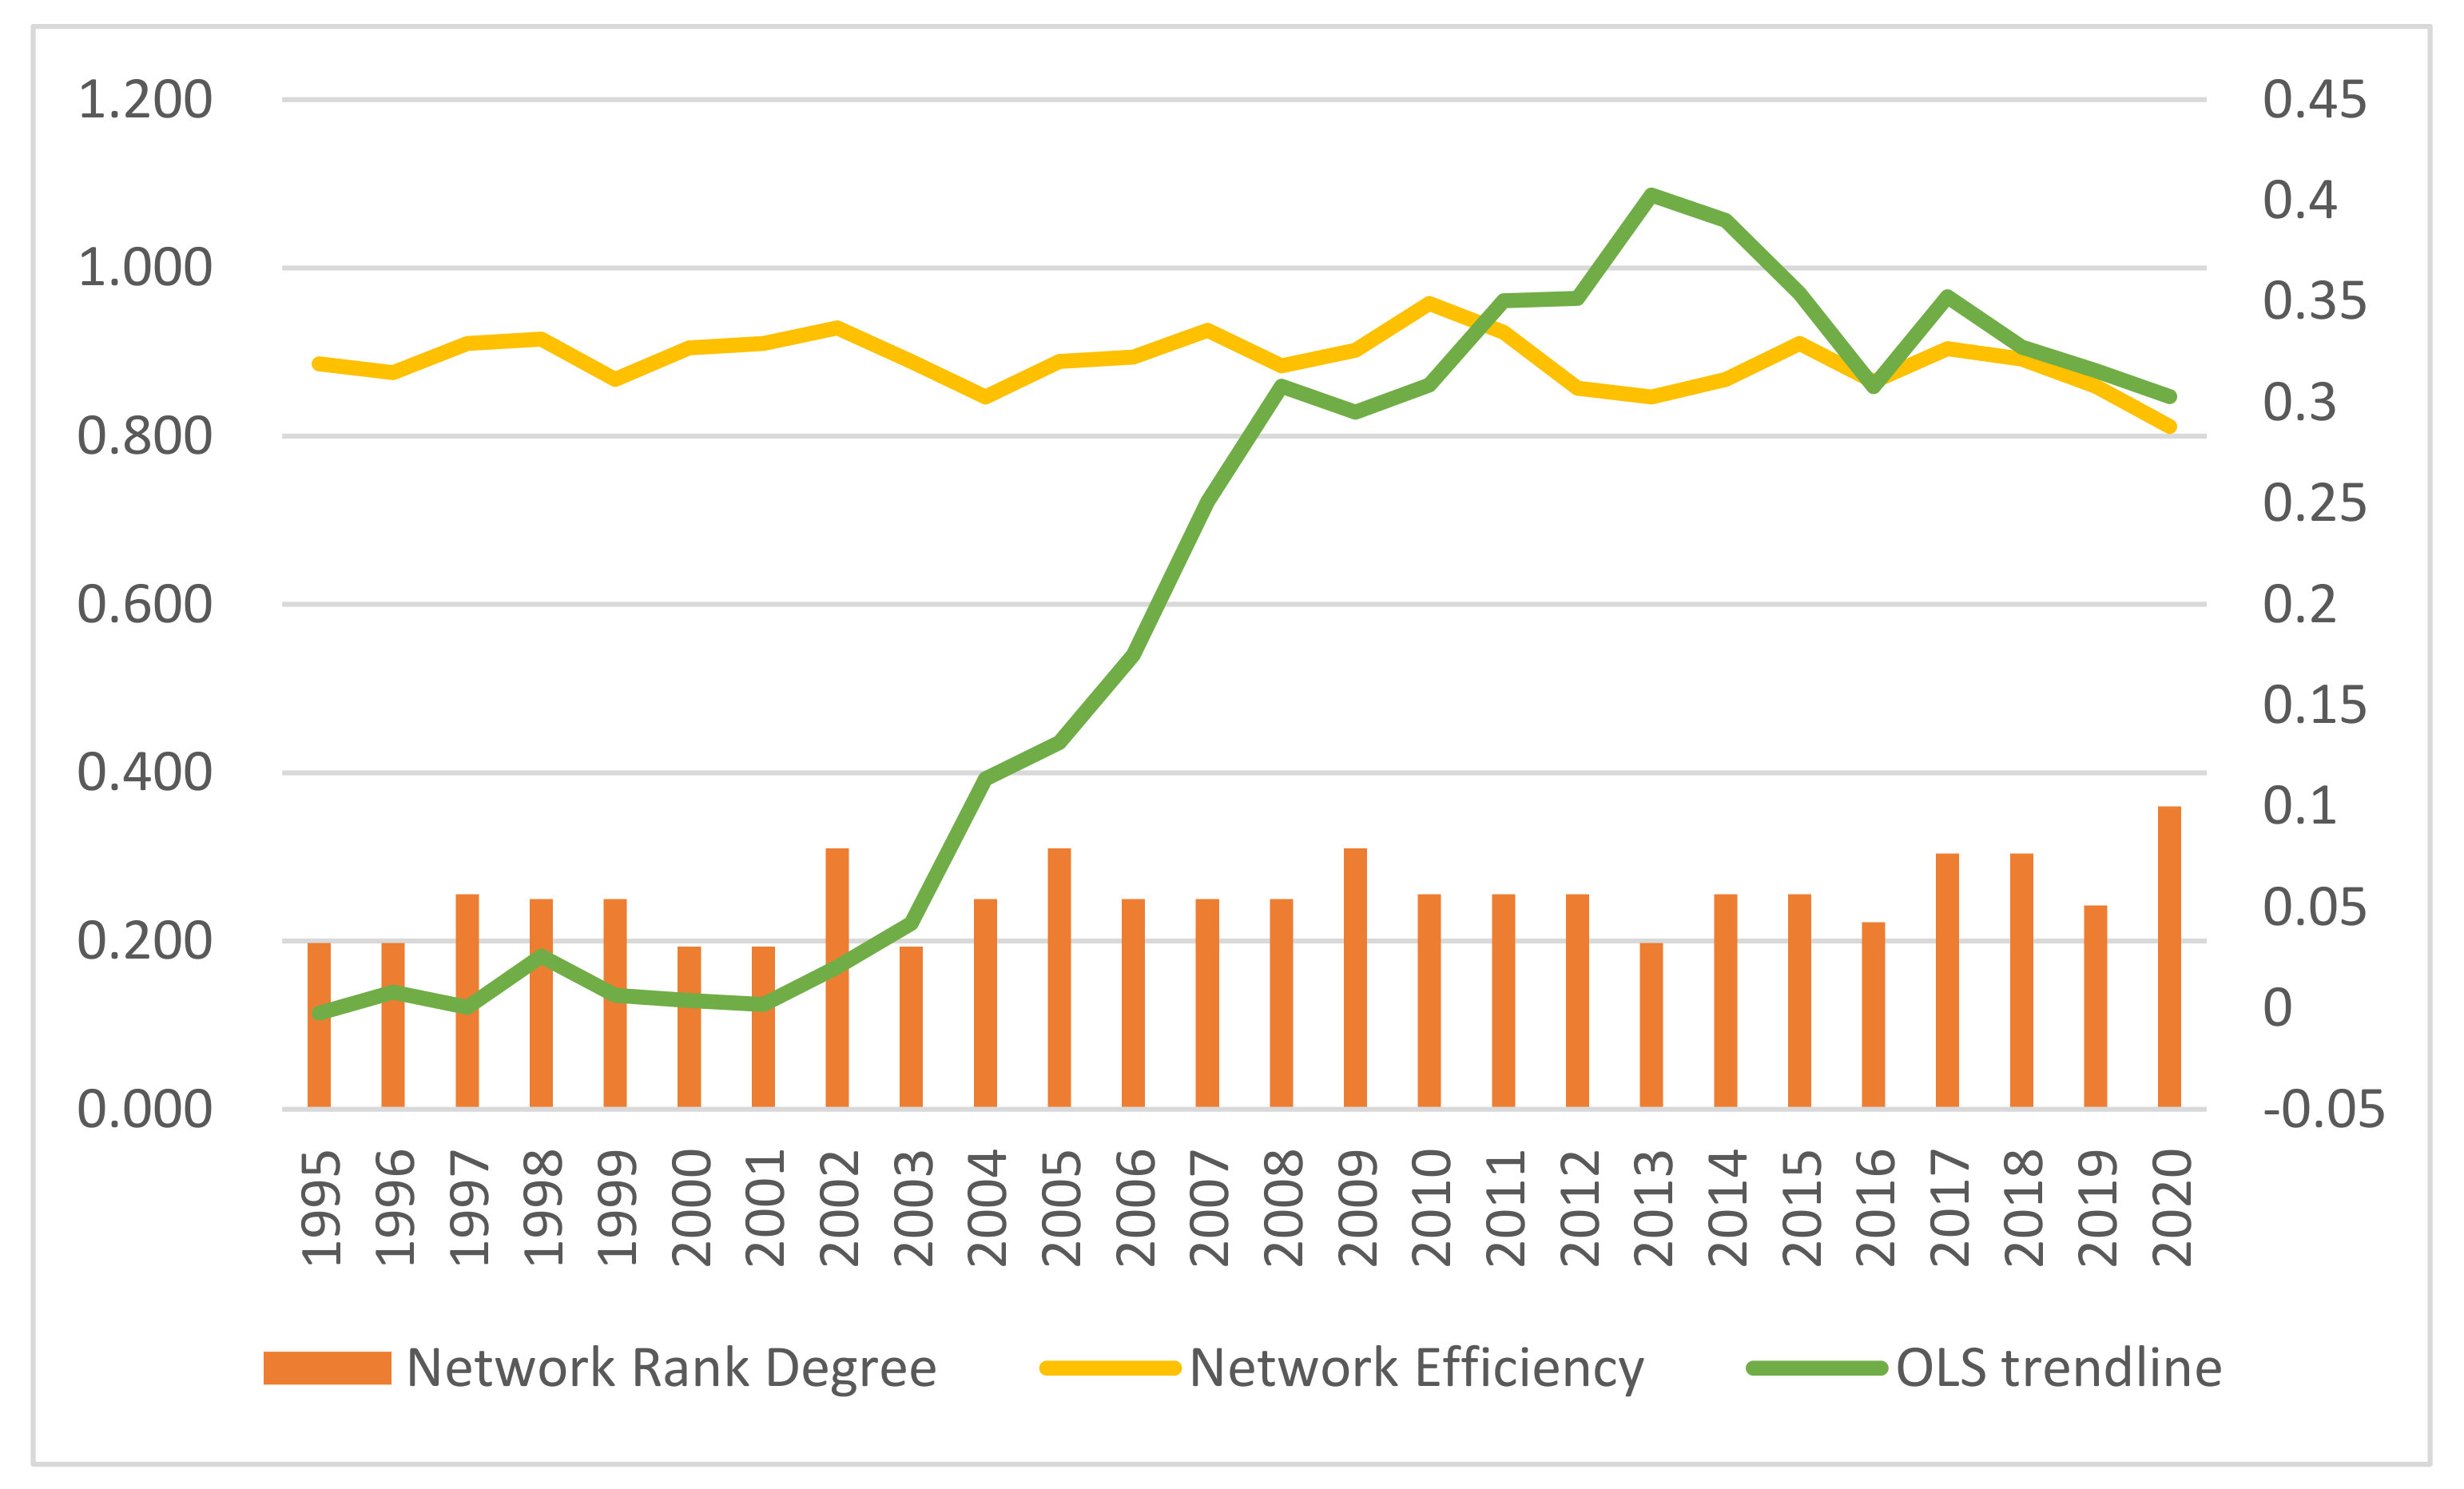
Figure 4, including the OSL trend line during the sample examination period, shows that the overall fluctuation in the spatially correlated network rank degree of agricultural carbon emission efficiency in each country is high. The network rank degree of carbon emission efficiency in each country shows a slight negative decline with increasing regional differences. This is consistent with the fact that the regions with high carbon efficiency are less and less carbon efficient from year to year, as shown in
Figure 1. Rapid economic development and growth in agricultural production lead to increased agricultural carbon emissions in some countries, thus reducing agricultural carbon efficiency. The network hierarchy rose from 0.198 in 1995 to 0.360 in 2000, for an increase of 82.38% over the past 25 years, with the lowest values being 0.194 in 2000, 2001, and 2003, indicating that the rigid hierarchical structure within the spatially linked network of countries’ agricultural carbon emission efficiency still exists, which may be influenced by the level of economic development of each country. Countries with high levels of economic development are likely to invest more resources in technological innovation and environmental protection, thus improving the efficiency of agricultural carbon emissions. Conversely, countries with low levels of economic development may face resource constraints and technological backwardness, resulting in relatively low efficiency of agricultural carbon emissions. At the same time, some countries may have abundant natural resources and agricultural infrastructure, enabling them to use resources more efficiently and increase carbon emission efficiency, while other countries may not be able to achieve the same level of efficiency due to scarce resources or lack of proper investment, thus leading to a specific gap in agricultural carbon emission efficiency across countries. This is also consistent with the results of the agricultural carbon emission efficiency measurement above.
Network efficiency shows a fluctuating downward trend, decreasing from 0.886 to 0.812 over 25 years, for a year-on-year decrease of 8.43%. It indicates that the stability of the spatial correlation network of agricultural carbon emission efficiency among countries is enhanced, probably because, after the Belt and Road Initiative is promoted, the coordination of socio-economic development among various countries is enhanced, which makes the correlation between levels of agricultural carbon emission efficiency of countries increase. The increase in correlation lines among nodes makes the whole network more and more compact, thus realizing stability improvement.
5.2. Individual Structural Characteristics of the Spatial Correlation Network of Agricultural Carbon Emission Efficiency in Countries along the Route of the Belt and Road Initiative
The individual structural indicators of the spatial correlation network of agricultural carbon emission efficiency in 34 countries along the route of the Belt and Road Initiative in 2020 are calculated by UCINET 6 software, and the structural centrality of the spatial correlation network is shown in
Figure 5.
5.2.1. Point Center Degree
The mean value of the point degree centrality of each country’s spatially linked network of agricultural carbon emission efficiency is 64.706. As shown in
Figure 5a, the point degree centrality of 15 countries, including Pakistan, Kazakhstan, Kyrgyzstan, Croatia, and Malaysia, is higher than the mean value, indicating that these countries are closer to the center of the network and have more connections and relationships with other nodal countries that play a crucial role in the formation and stable development of the overall network of agricultural carbon emission efficiency. They play an essential role in the construction and steady growth of the comprehensive network of agricultural carbon efficiency. As key players in information dissemination, resource exchange, or decision-making, these countries play a crucial role as bridges, connecting different sub-networks or groups. At the same time, as important hubs for information exchange and resource flow, they facilitate connections and cooperation among other parts of the network. Moreover, most countries above the mean are concentrated in South and Southeast Asia. These countries can enhance economic cooperation, connectivity, cross-border investment, and political cooperation in the region through the Belt and Road Initiative to achieve mutual benefits in economic development, reduce dependence on Western markets, and promote stability and prosperity in each country, thus improving their agricultural carbon emission efficiency. The histogram in
Figure 5a also clearly demonstrates the trend of network connectivity among nations, and by observing the change in the histogram, it can be verified that the connectivity of the agricultural carbon emission efficiency linkage network among countries shows an increasing trend from 1995 to 2020. It shows that the results have certain robustness and further prove that communication, information transfer, and resource sharing among countries in the network are more frequent and intensive.
In this paper, the above 15 countries are classified into the first group, such as China, India, and Thailand, which benefit from faster domestic economic development, more advanced agricultural technologies, and convenient transportation networks; the countries of the second group, such as Kazakhstan, Kyrgyzstan, and Tajikistan, have higher agricultural carbon emission efficiency (
Figure 1), and their green and low-carbon behaviors will, to a certain extent, drive other countries to reduce the application of chemical fertilizers and pesticides; the third group of countries, such as Pakistan, Croatia, and Armenia, are better located, and their convenient transportation and information networks can help them better communicate with neighboring countries. In addition, five countries, such as Kyrgyzstan, Croatia, and Tajikistan, have more point-in than point-out. This means that other countries are more inclined to point their connections to these five countries, while these are relatively less likely to form links to other countries, thus gaining more elements in the network.
5.2.2. Closeness Center Degree
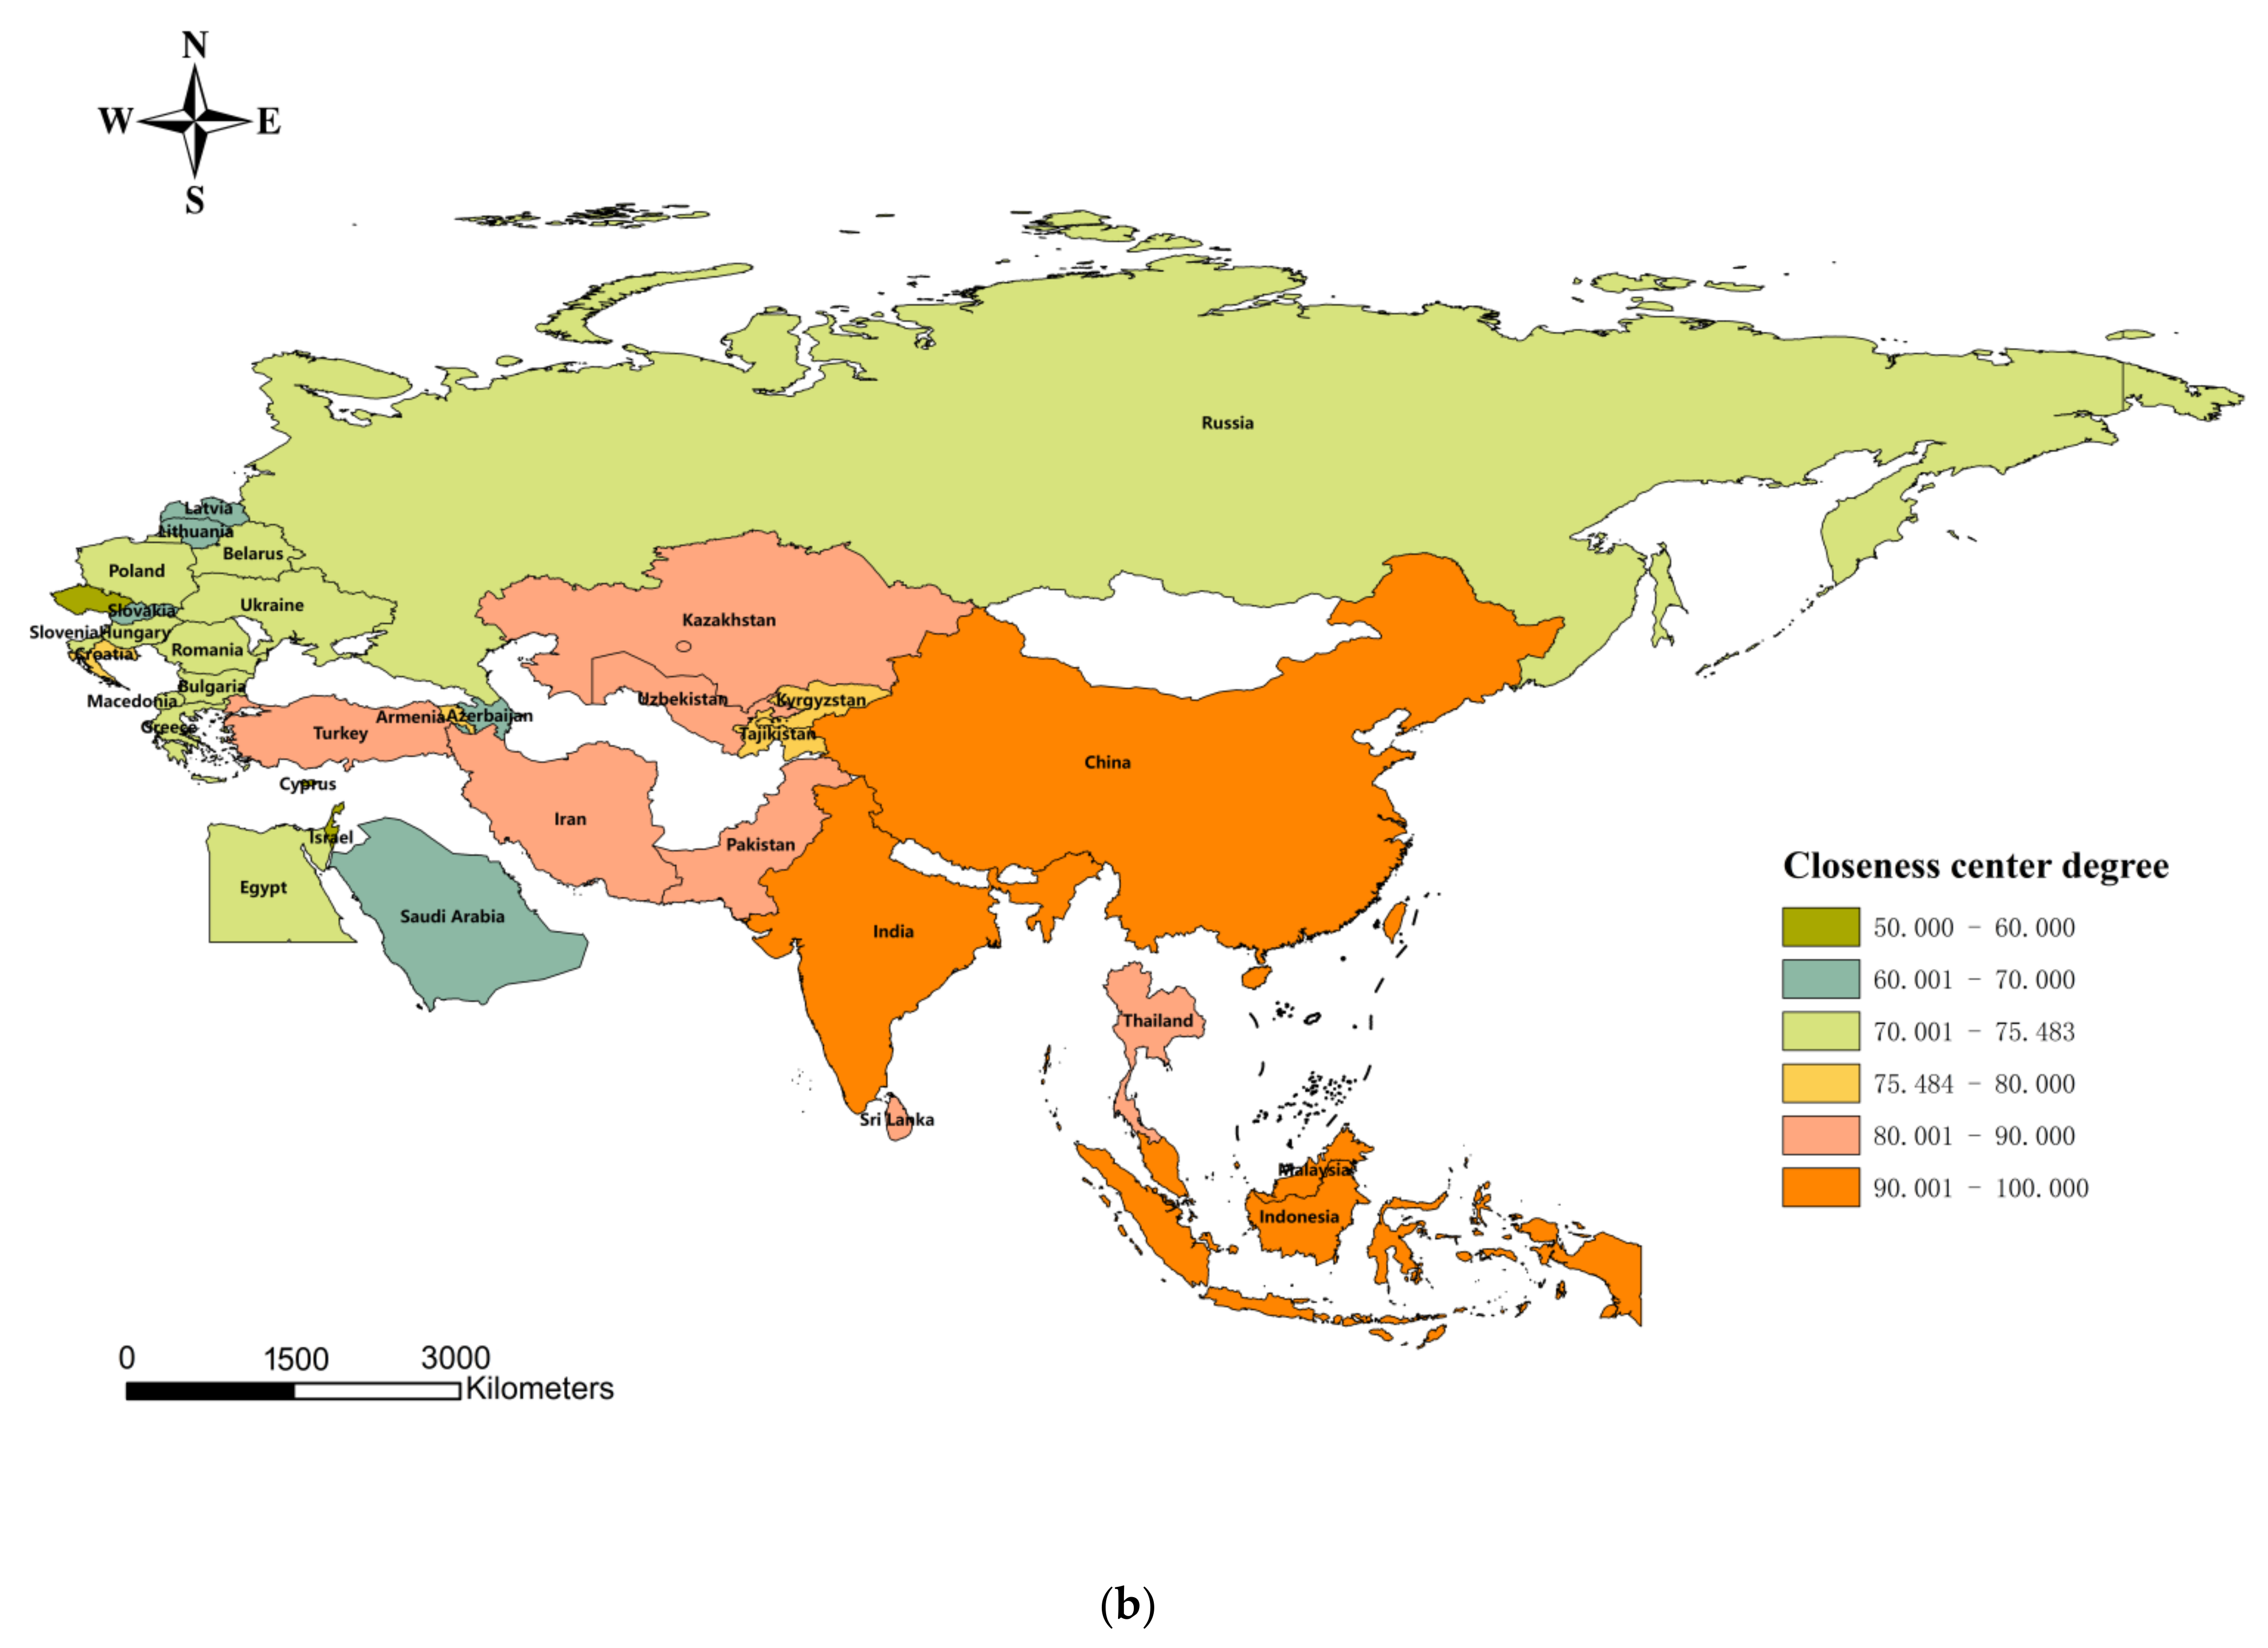
The mean value of the proximity centrality of each country’s spatially linked network of agricultural emission efficiency is 75.482.
Figure 5b shows that 15 countries, such as Sri Lanka, Tajikistan, Thailand, Turkey, and Uzbekistan, exceed the mean value. Most countries above the mean are concentrated in South and Southeast Asia, consistent with the results above. It indicates that these countries are more likely to be spatially connected with other countries, and the elements of agricultural carbon emission efficiency move quickly, which significantly contributes to the improvement of agricultural carbon emission efficiency in other countries. Six countries, such as Israel, Cyprus, and the Czech Republic, which are more challenging to link with spatial networks due to their low proximity to the center, do not have access to resources comparable to countries with high proximity to the center and need to find other opportunities to promote domestic agricultural economy and development and thus improve their agricultural carbon emission efficiency.
5.2.3. Intermediation Center Degree
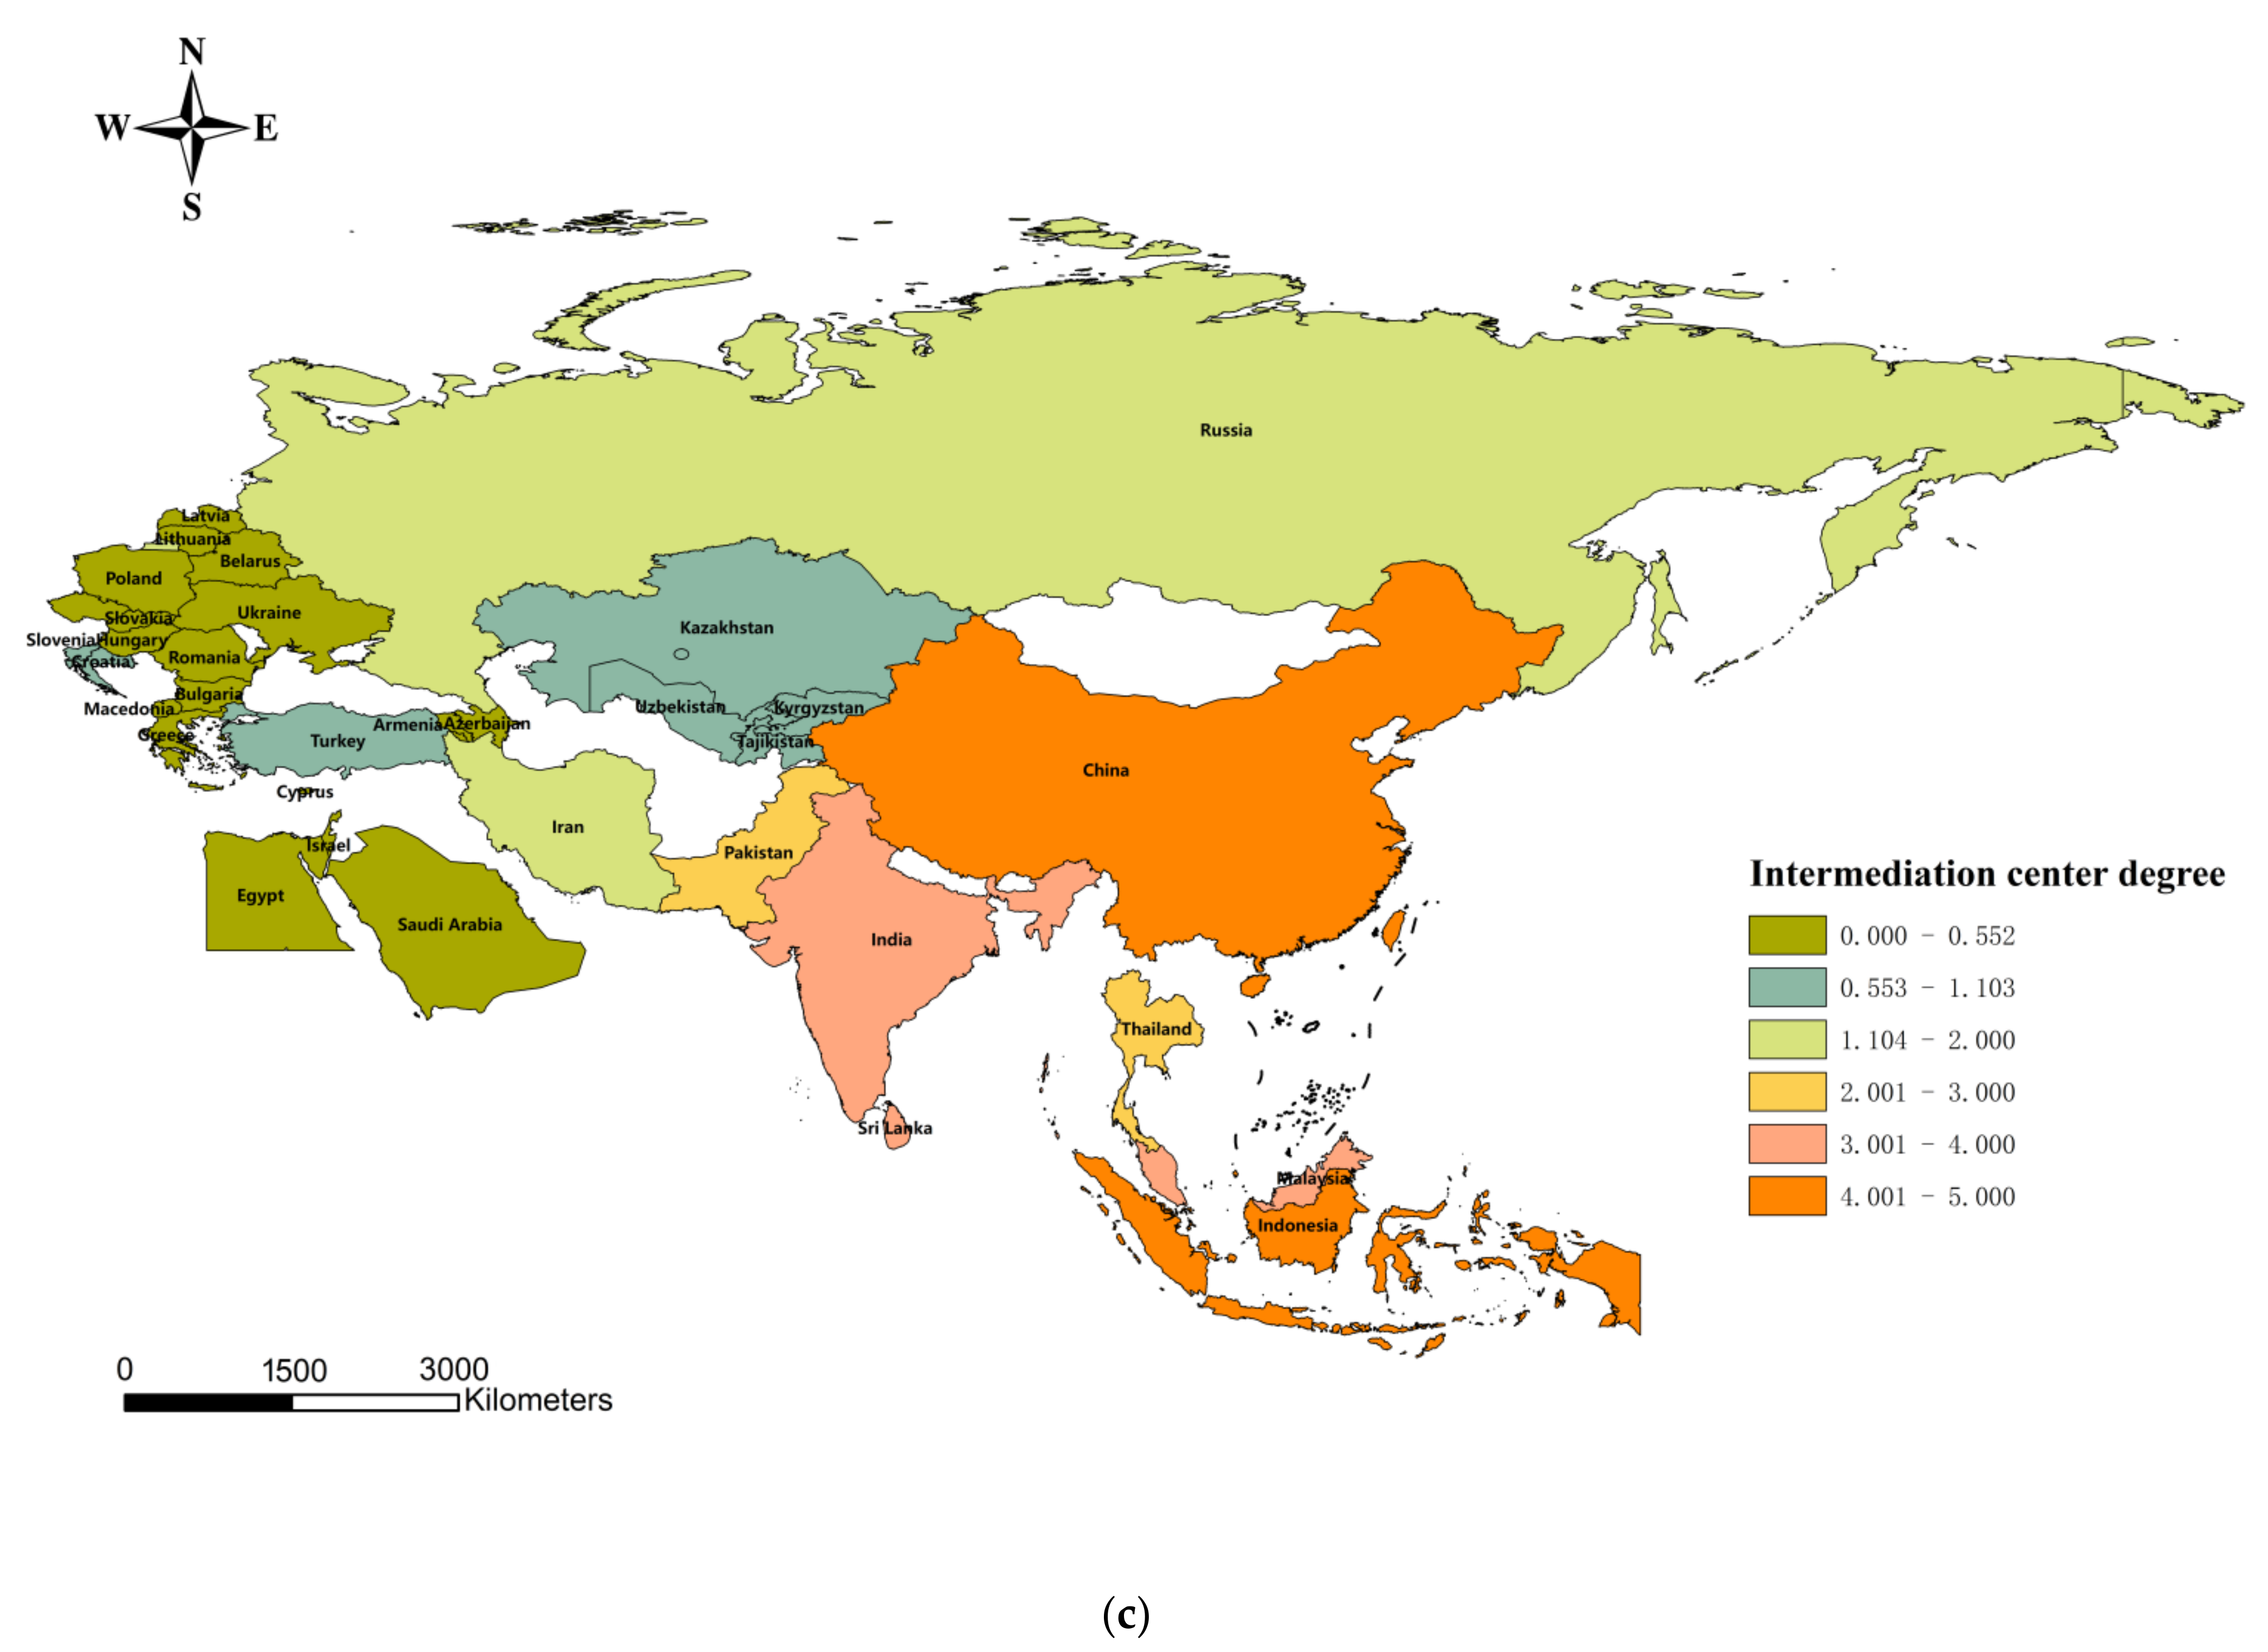
The mean value of intermediation centrality of the spatially linked network of agricultural carbon emission efficiency in each country is 1.103.
Figure 5c shows that the intermediation centrality of India, Malaysia, Indonesia, Thailand, Pakistan, Sri Lanka, Iran, the Russian Federation, and China is higher than the mean value. It indicates that these countries can better influence and control the flow of resources and technologies, such as labor and capital, in the spatial network, further regulating and constraining the efficiency of agricultural carbon emissions in other countries. The total intermediation centrality is 37.768, and the sum of intermediation centrality of the top nine countries accounts for 71.51% of the total, while the intermediation centrality of the bottom five countries is less than 0.2, accounting for only 1.38% of the total. Due to their small economic size and remote location, these countries need help controlling and dominating other countries in the network.
Figure 5c shows that the intermediation centrality of each country is uneven and has unbalanced characteristics, and a considerable number of agricultural carbon emission efficiency linkages are accomplished through economically developed countries such as China, India, and Indonesia.
5.3. Spatial Correlation Network Clustering Structure Characteristics of Agricultural Carbon Emission Efficiency in Countries along the Route of the Belt and Road Initiative
This paper uses a cluster model to analyze the intricate network system of agricultural carbon emission efficiency in 34 countries along the route of the Belt and Road Initiative (
Figure 2), which is divided into four clusters according to the block model cluster attributes using the CONCOR algorithm. Among them, the first cluster has seven members, the second cluster has six members, the third cluster has nine, and the fourth cluster has 12 members. Among the 225 correlations, the number of relationships within the four clusters is 104, and the number of relationships among the four clusters is 145, indicating that the spillover effect among the clusters is noticeable. The specific division is detailed in
Figure 6.
Bulgaria, Croatia, Greece, Macedonia, Poland, Romania, and Slovenia are in the first cluster. As shown in
Table 5, the first cluster issued 51 relationships, of which 13 were within the cluster, and 30 received connections from other clusters, which are “net spillover” clusters. These countries are located in the European region and have high efficiency and technological advantages in agricultural production, so most have relatively high efficiency in agricultural carbon emissions. As “net spillover” clusters, they play an essential role in agricultural trade and cooperation, reducing their agricultural carbon emissions by providing agricultural products and technologies to other countries. Geopolitically, they can lead in agricultural carbon reduction cooperation and technology transfer and promote sustainable agricultural development through agricultural cooperation in the Belt and Road Initiative.
China, India, Indonesia, Malaysia, Sri Lanka, and Thailand are in the second cluster. The second cluster has a significantly higher number of incoming relationships than outgoing relationships, and the proportion of desired internal relationships is much smaller than the actual value, making it a “net benefit” cluster. These countries are located in the Asian region, where the demand for agricultural production factors is high, and the efficiency of agricultural carbon emissions is relatively low. As “net beneficiary” clusters, they have a high market consumption of agricultural products and receive more linkages and benefits from the countries in the Belt and Road Initiative, enjoying factor inputs from other countries. Geopolitically, by strengthening cooperation with the “net spillover” clusters, they can introduce efficient agricultural technologies and management experiences, improve the efficiency of agricultural carbon emissions, achieve sustainable agricultural development, and promote cooperation on agricultural carbon reduction in countries along the route of the Belt and Road Initiative.
Cyprus, the Czech Republic, Hungary, Israel, Latvia, Lithuania, Russia, Saudi Arabia, and Slovakia are in the third cluster. These countries are located in the Eurasian region and have a high variability in agricultural carbon efficiency, both sending and receiving linkages from other areas of the Belt and Road Initiative. As “two-way spillover” clusters, these countries play an important role in agricultural carbon emissions and agricultural trade. Geopolitically, they promote inter-regional economic linkages and cooperation by strengthening cooperation with other clusters and facilitating the transfer of agricultural carbon reduction technologies and sustainable agricultural development.
Armenia, Azerbaijan, Belarus, Egypt, Iran, Kazakhstan, Kyrgyzstan, Pakistan, Tajikistan, Turkey, Ukraine, and Uzbekistan are in the firth cluster. The firth cluster sends out 82 relations, of which 32 are intra-cluster relations, and 41 are received from other clusters, which are “broker” clusters. They play a vital role in the efficiency of agricultural carbon emissions and trade in agricultural products. By acting as a bridge, they facilitate agricultural trade and technology transfer between different countries while also playing a role in achieving agricultural carbon reduction and sustainable agricultural development at home. Geopolitically, they promote the diffusion of agricultural carbon emission reduction technologies and sustainable agricultural growth by strengthening cooperation with other clusters to advance the achievement of agricultural carbon emission reduction targets in the region.
To examine the spatial correlation of agricultural carbon emission efficiency among clusters, this paper calculates each cluster’s network density matrix based on cluster correlation distribution (
Table 5). At the same time, the network density of the spatial association of agricultural carbon emission efficiency in 2020 is 0.422, so when the network density of any cluster is higher than 0.422, agricultural carbon emission efficiency will be more concentrated in that cluster. This paper assigns a value of 1 to the case where the cluster network density is greater than the overall network density and 0 to the opposite point to obtain a matrix like this.
According to
Table 6, there is a two-way spillover relationship between the “net spillover” cluster and the “two-way spillover” cluster regarding agricultural carbon efficiency; the clusters interact closely and are strongly related. The “net spillover” cluster exports agricultural products to the “two-way spillover” cluster and strengthens the link between the two through agricultural trade and cooperation. At the same time, the “two-way spillover” clusters also export agricultural technology and resources to the “net spillover” clusters, contributing to the agricultural development of both sides. This two-way spillover relationship strengthens economic ties and geopolitical influence between clusters.
The linkages between the “two-way spillover” and “broker” clusters are weaker. From the perspective of agricultural carbon efficiency, the spillover effects between these clusters are relatively weak. Their agricultural carbon efficiency is likely influenced mainly by factors within the country, with less interaction and influence with neighboring clusters. This results in relatively weak geopolitical relations between clusters and a low level of cooperation and exchange.
The “net spillover” and “two-way spillover” clusters are not only correlated within themselves regarding agricultural carbon efficiency, but they also receive extensive income from the “net beneficiary” and “broker” clusters. This means that these countries work closely with their internal members in the agricultural sector and further improve their agricultural carbon efficiency through trade and technology exchange with other clusters. This linkage strengthens the links between the “net spillover” and other clusters, with implications for the geopolitical landscape.
The “net beneficiary” clusters play an essential role in the Belt and Road Initiative as the engines of the countries along the route of the Initiative, with larger markets for agricultural products and abundant labor resources. They attract investment and trade in agricultural products from the “net spillover” clusters and other clusters, contributing to the carbon efficiency of agriculture. The agricultural development of these clusters is essential for advancing the Belt and Road Initiative as a whole.
The “broker” cluster acts as a “bridge” and “hub” in the spatially linked network of agricultural carbon efficiency under the Belt and Road Initiative. It has close spatial linkages with the “net spillover” cluster and other clusters, facilitating the communication and exchange of agricultural factors between different clusters. This role gives the “broker” clusters a certain geopolitical status and influence and plays an essential role in promoting regional cooperation and improving the efficiency of agricultural carbon emissions.
