Article

Analysis of Eco-Environmental Quality and Driving Forces in Opencast Coal Mining Area Based on GWANN Model: A Case Study in Shengli Coalfield, China

1
China Energy Digital Intelligence Technology Development (Beijing) Co., Ltd., Beijing 100011, China
2
Research Center for Eco-Environmental Sciences, Chinese Academy of Sciences, Beijing 100085, China
3
Natural Resources Comprehensive Survey Command Center, China Geological Survey, Beijing 100055, China
4
China Institute of Nuclear Industry Strategy (CINIS), Beijing 100048, China
5
Department of Architecture, University of Florence, 50121 Florence, Italy
*
Author to whom correspondence should be addressed.
Sustainability 2023, 15(13), 10656; https://doi.org/10.3390/su151310656
Submission received: 5 May 2023 / Revised: 2 July 2023 / Accepted: 4 July 2023 / Published: 6 July 2023

Abstract

:
Opencast coal mine production and construction activities have a certain impact on the ecological environment, while the development and utilization of large coal bases distributed in semi-arid steppe regions may have a more direct and significant impact on the eco-environment. Therefore, in-depth studies of the ecological impacts of human activities and natural environmental elements in opencast coal mines in typical semi-arid steppe regions and analyses of their driving forces are of great significance for protecting and restoring regional fragile steppe ecosystems. In this paper, the mining area southwest of the Shengli coalfield, a typical ore concentration area in eastern Inner Mongolia, was selected as the research object. Its remote sensing ecological index (RSEI) was calculated using the Google Earth Engine (GEE) platform to analyze the eco-environmental quality in the mining area and its surrounding 2 km from 2005 to 2021. The geographically weighted artificial neural network model (GWANN) was combined with the actual situation of mining activity and ecological restoration to discuss the driving factors of eco-environmental quality change in the study area. The results showed that: (1) the proportion of the study area with excellent and good eco-environmental quality increased from 20.96% to 23.93% from 2005 to 2021, and the proportions of areas with other quality grades fluctuated strongly. (2) The change in eco-environmental quality in the interior of the mining area was closely related to the reclamation of dump sites and migration of the mining area. (3) The maximum contribution rate of the mining activity factor to the external eco-environmental quality of the mining area reached 43.33%, with an annual average contribution rate of 34.48%; as the distance from the mining area increased, its contribution gradually decreased. This quantitative analysis of the driving forces of RSEI change in the mining area will complement future work in ecological evaluations of mining areas while also improving the practicality of ecological evaluation at the mining scale, thereby further helping the ecological management of mining areas.

1. Introduction

With the rapid development of the economy and society in China, the scale of mining activity in opencast coal mines is increasing year by year, which leads to the serious degradation of regional natural ecosystems and environmental quality and causes many eco-environmental problems, such as soil and water loss, land desertification, soil salinization, and changes in vegetation communities and characteristics, thus making the ecosystems in mining areas some of the most degraded ecosystems in the world [1,2,3,4,5,6,7]. In recent years, the retrieval of eco-environmental quality based on remote sensing technology has become the main means of evaluating regional eco-environmental quality [8]. The remote sensing ecological index (RSEI) proposed by Xu Hanqiu [9] is often used as a key index for the quantitative evaluation of the eco-environmental quality impacts of mining activity. Tang et al. [10] analyzed land cover change and evaluated the environmental quality from 2000 to 2020 in a typical mining region based on Landsat series images. Song et al. [11] analyzed the ecological environment changes from 1992 to 2018 based on Landsat and Google Earth historical images in dense mining areas. Xia Nan [12] evaluated the ecological environment of the Wucaiwan mining area from 2003 to 2015 based on Landsat and MODIS images. Though previous studies on mining-scale ecological evaluation have been carried out, there is still a lack of analysis and research on the relevant driving factors of eco-environmental quality change in opencast mining areas, especially for mining activity. These driving factors clearly destroy ecological quality, severely degrading the regional water table and causing soil desertification; furthermore, their influences may extend beyond the mining area, and the extent of their ecological impacts outside the mining area is unclear. Therefore, conducting studies related to the drivers affecting ecological quality change will help to explain not only the real causes of ecological changes but also the actual scope and extent of the impact of factors such as mining activity. In addition, RSEI is more commonly applied to eco-environmental quality evaluation in large-scale regions, and the results of small-scale evaluations, such as in mining areas, need to be verified and discussed.
GEE, which can provide users with massive multisource remote sensing data, has large spatial analysis and supercomputing power ability, greatly saves time and cost, and is often used in ecological quality assessment such as eco-environmental assessment based on RSEI [13,14,15]. In recent years, geographically weighted regression (GWR) has been widely used in ecological research and evaluation, but simple linear regression models cannot accurately fit complex ecological problems [16,17]. However, a geographically weighted artificial neural network (GWANN) uses the distance attenuation kernel function and bandwidth to calculate the geographical weights of observations, which solves the problem in nonstationary spatial modeling, and uses a neural network to construct a nonlinear function model. Therefore, it has been used in ecological and agricultural yield evaluations by many scholars. Li et al. [17] proposed a geographically weighted differential factor-artificial neural network (GWDF-ANN) model based on GWANN, which constructed a nonlinear model while considering the nonstationarity of variables, and analyzed the driving factors of the change in vegetation coverage within a 2 km range around mining areas. Presently, there is a lack of research on using the GWANN model to fit and analyze the driving factors of RSEI change, which could make the study of RSEI more valuable.
The Shengli coalfield, located in the middle of the Inner Mongolia Plateau, is a typical concentrated opencast coal mine area in eastern Inner Mongolia. In this paper, we took the southwest of the Shengli coalfield as the research area. We determined the RSEI values of the study area by analyzing Landsat series images based on the GEE platform from 2005 to 2021, combined the RSEI values of different times with the actual situation of mining activity and ecological restoration to discuss the induction of change in ecological environment quality inside the mining area, and quantitatively analyzed the driving factors of eco-environmental quality change in a certain range outside the mining area based on GWANN. Thus, we provide a basis for the future ecological management of the mining area and further complement the practical significance of ecological evaluation work in mining areas, making it more indicative in practice.

2. Materials and Methods

2.1. Study Area

The southwest of the Shengli coalfield, located in Shengli Sumu, northwest of Xilinhot City, Xilingol League, is the most concentrated area in the coalfield, which includes four opencast coal mines, Shengli No. 1, Shengli West No. 2, Shengli West No. 3, and Wulantuga, with a total area of 65.07 km2 (Figure 1). The geographical coordinates of the study area are 115°53′–117°06′ E and 43°57′–44°52′ N. The study area is covered by the Quaternary System, and the underlying strata range from old to new, including the Xilin Group and Shengli Group of the Lower Cretaceous Bayanhua Formation in the Mesozoic Cretaceous and the Cenozoic strata. Among them, the Xilin Group and Shengli Group are coal-bearing strata. The overall structure of the study area is a north–east-trending graben-type fault basin; its north–west and south–east sides are spread nearly north–east with the same sedimentary positive faults Ft1, F14, and Ft2 forming the boundary of the basin. The groundwater in the study area is divided into two categories. One category is loose rock pore water, which is mainly recharged by atmospheric precipitation, including ice and snow melt water, and forms submerged flow only in the rainy season via runoff discharged from northwest to southeast. The other category is bedrock fracture water, which is stored in the coal group.
At present, the proven coal reserves have reached 15,932 Mt, and the retained coal reserves have reached 15,931 Mt. Meanwhile, the germanium reserves are 760 Mt. With the exception of the Wulantuga mine, which has been mining germanium since 1997, the other coal mines have only been in production since 2005. The area has a typical semi-arid continental climate in the mid-temperate zone, and the average annual temperature, rainfall, and evaporation were 1.7 °C, 294 mm, and 1811 mm during the past 10 years, respectively.
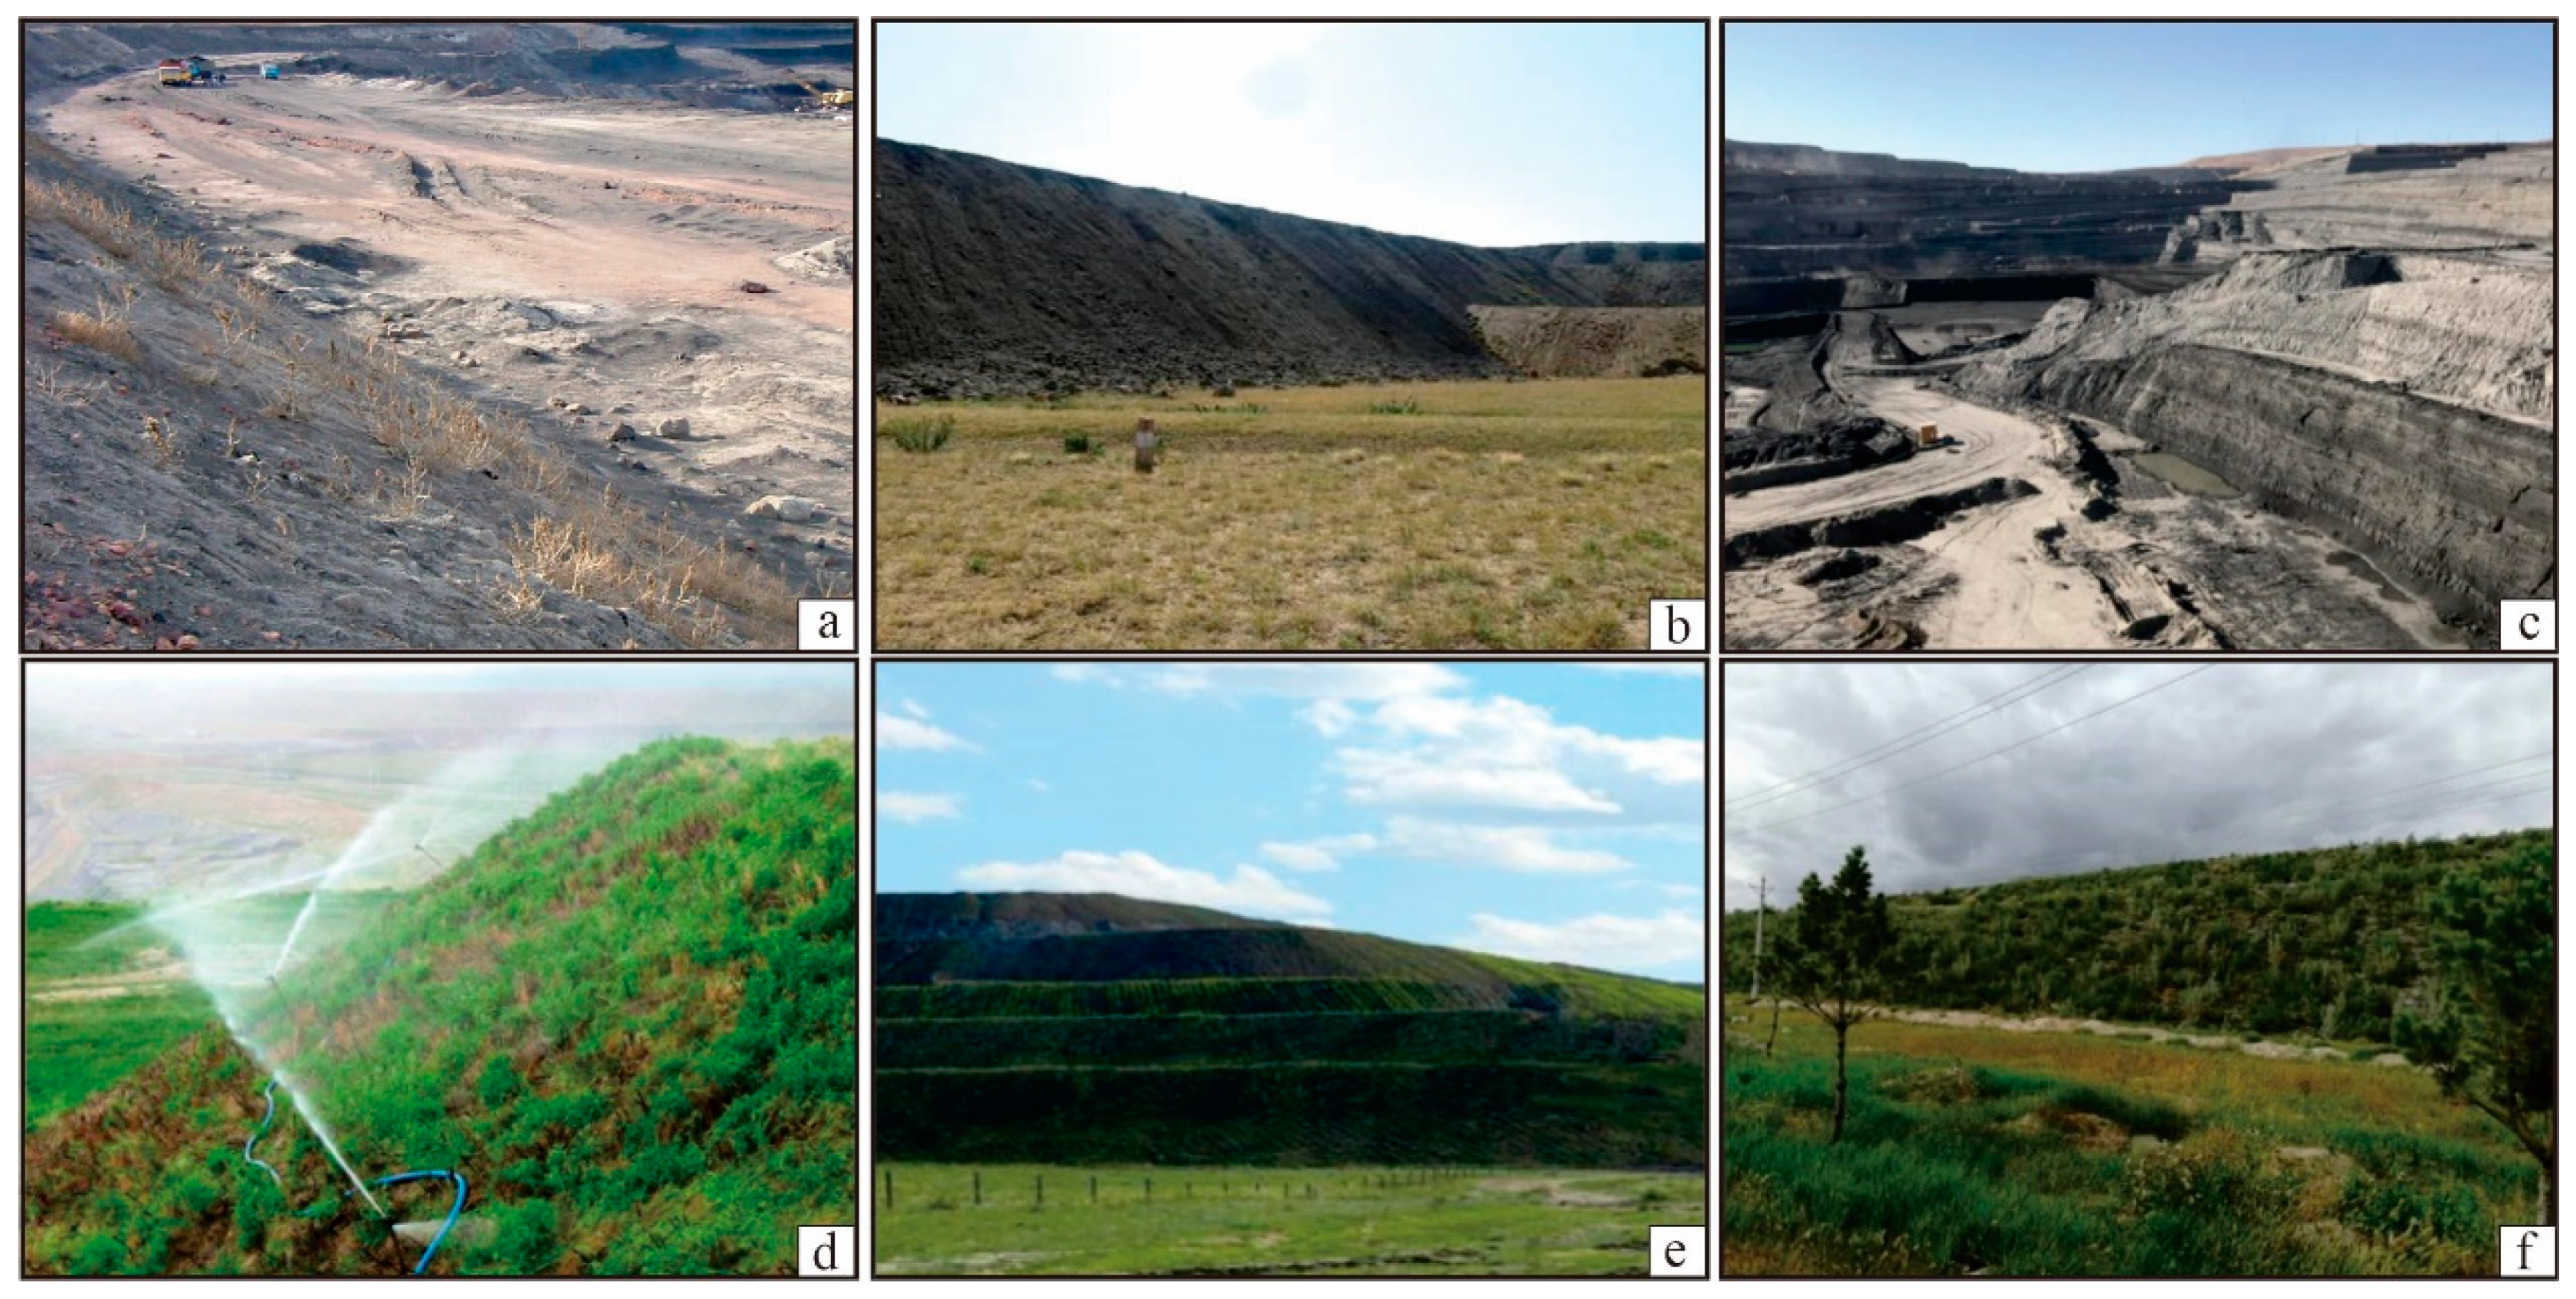
In recent years, a strong contrast has formed between the eco-environmental quality inside and around the mining area (Figure 2). Previous studies have concluded that production and construction activities, land reclamation, and vegetation restoration in mining areas have a certain impact on the surrounding ecological environment, and both previous studies and this paper have shown that the significant impact area is within a 2 km range around the mining area. Therefore, considering the rationality and maneuverability of data acquisition, we selected 2 km in and around the mining area, with an area of 149.28 km2 as the study area, to discuss the change in eco-environmental quality and its driving factors.

2.2. Data Resources and Preprocessing

The remote sensing image data were all derived from the T1-level Landsat 5 TM and Landsat 8 OLI/TIRS surface reflectance products. The imaging period was from 2005 to 2021, that is, remote sensing images of each mining area were obtained since mining began to the current period. We generated a total of 17 minimum cloud cover images in August of the target year, with a spatial resolution of 30 m and a time resolution of 12 months, using Landsat cloud-mask and mean synthesis and other algorithms on the GEE platform.
The annual mean temperature and precipitation data in different geographical locations in 2005, 2010, 2015, and 2021 of the study area were obtained by interpolation using Anusplin 4.2 software based on the related data from the Resource and Environment Data Center of the Chinese Academy of Sciences (https://www.resdc.cn/ (accessed on 1 January 2022)). The topography data were obtained from the Digital Elevation Model (DEM) of the Shuttle Radar Topography Mission (SRTM) released by NASA in 2014, with a spatial resolution of 30 m. The DEM data of the same year were used as topography data because they had not changed much. The mining activity data were obtained using a combination of annual coal production at each mine and the shortest Euclidean distance of the grid cell from the center of the adjacent mine location, which was calculated using Equation (1) [17].
D min e = M E D min e + 1
where M is the mined amount (unit: 104 m3), and EDmine is the shortest Euclidean distance between the grid cell and the center of the adjacent mine (unit: km).

2.3. Methods

2.3.1. RSEI Evaluation Model

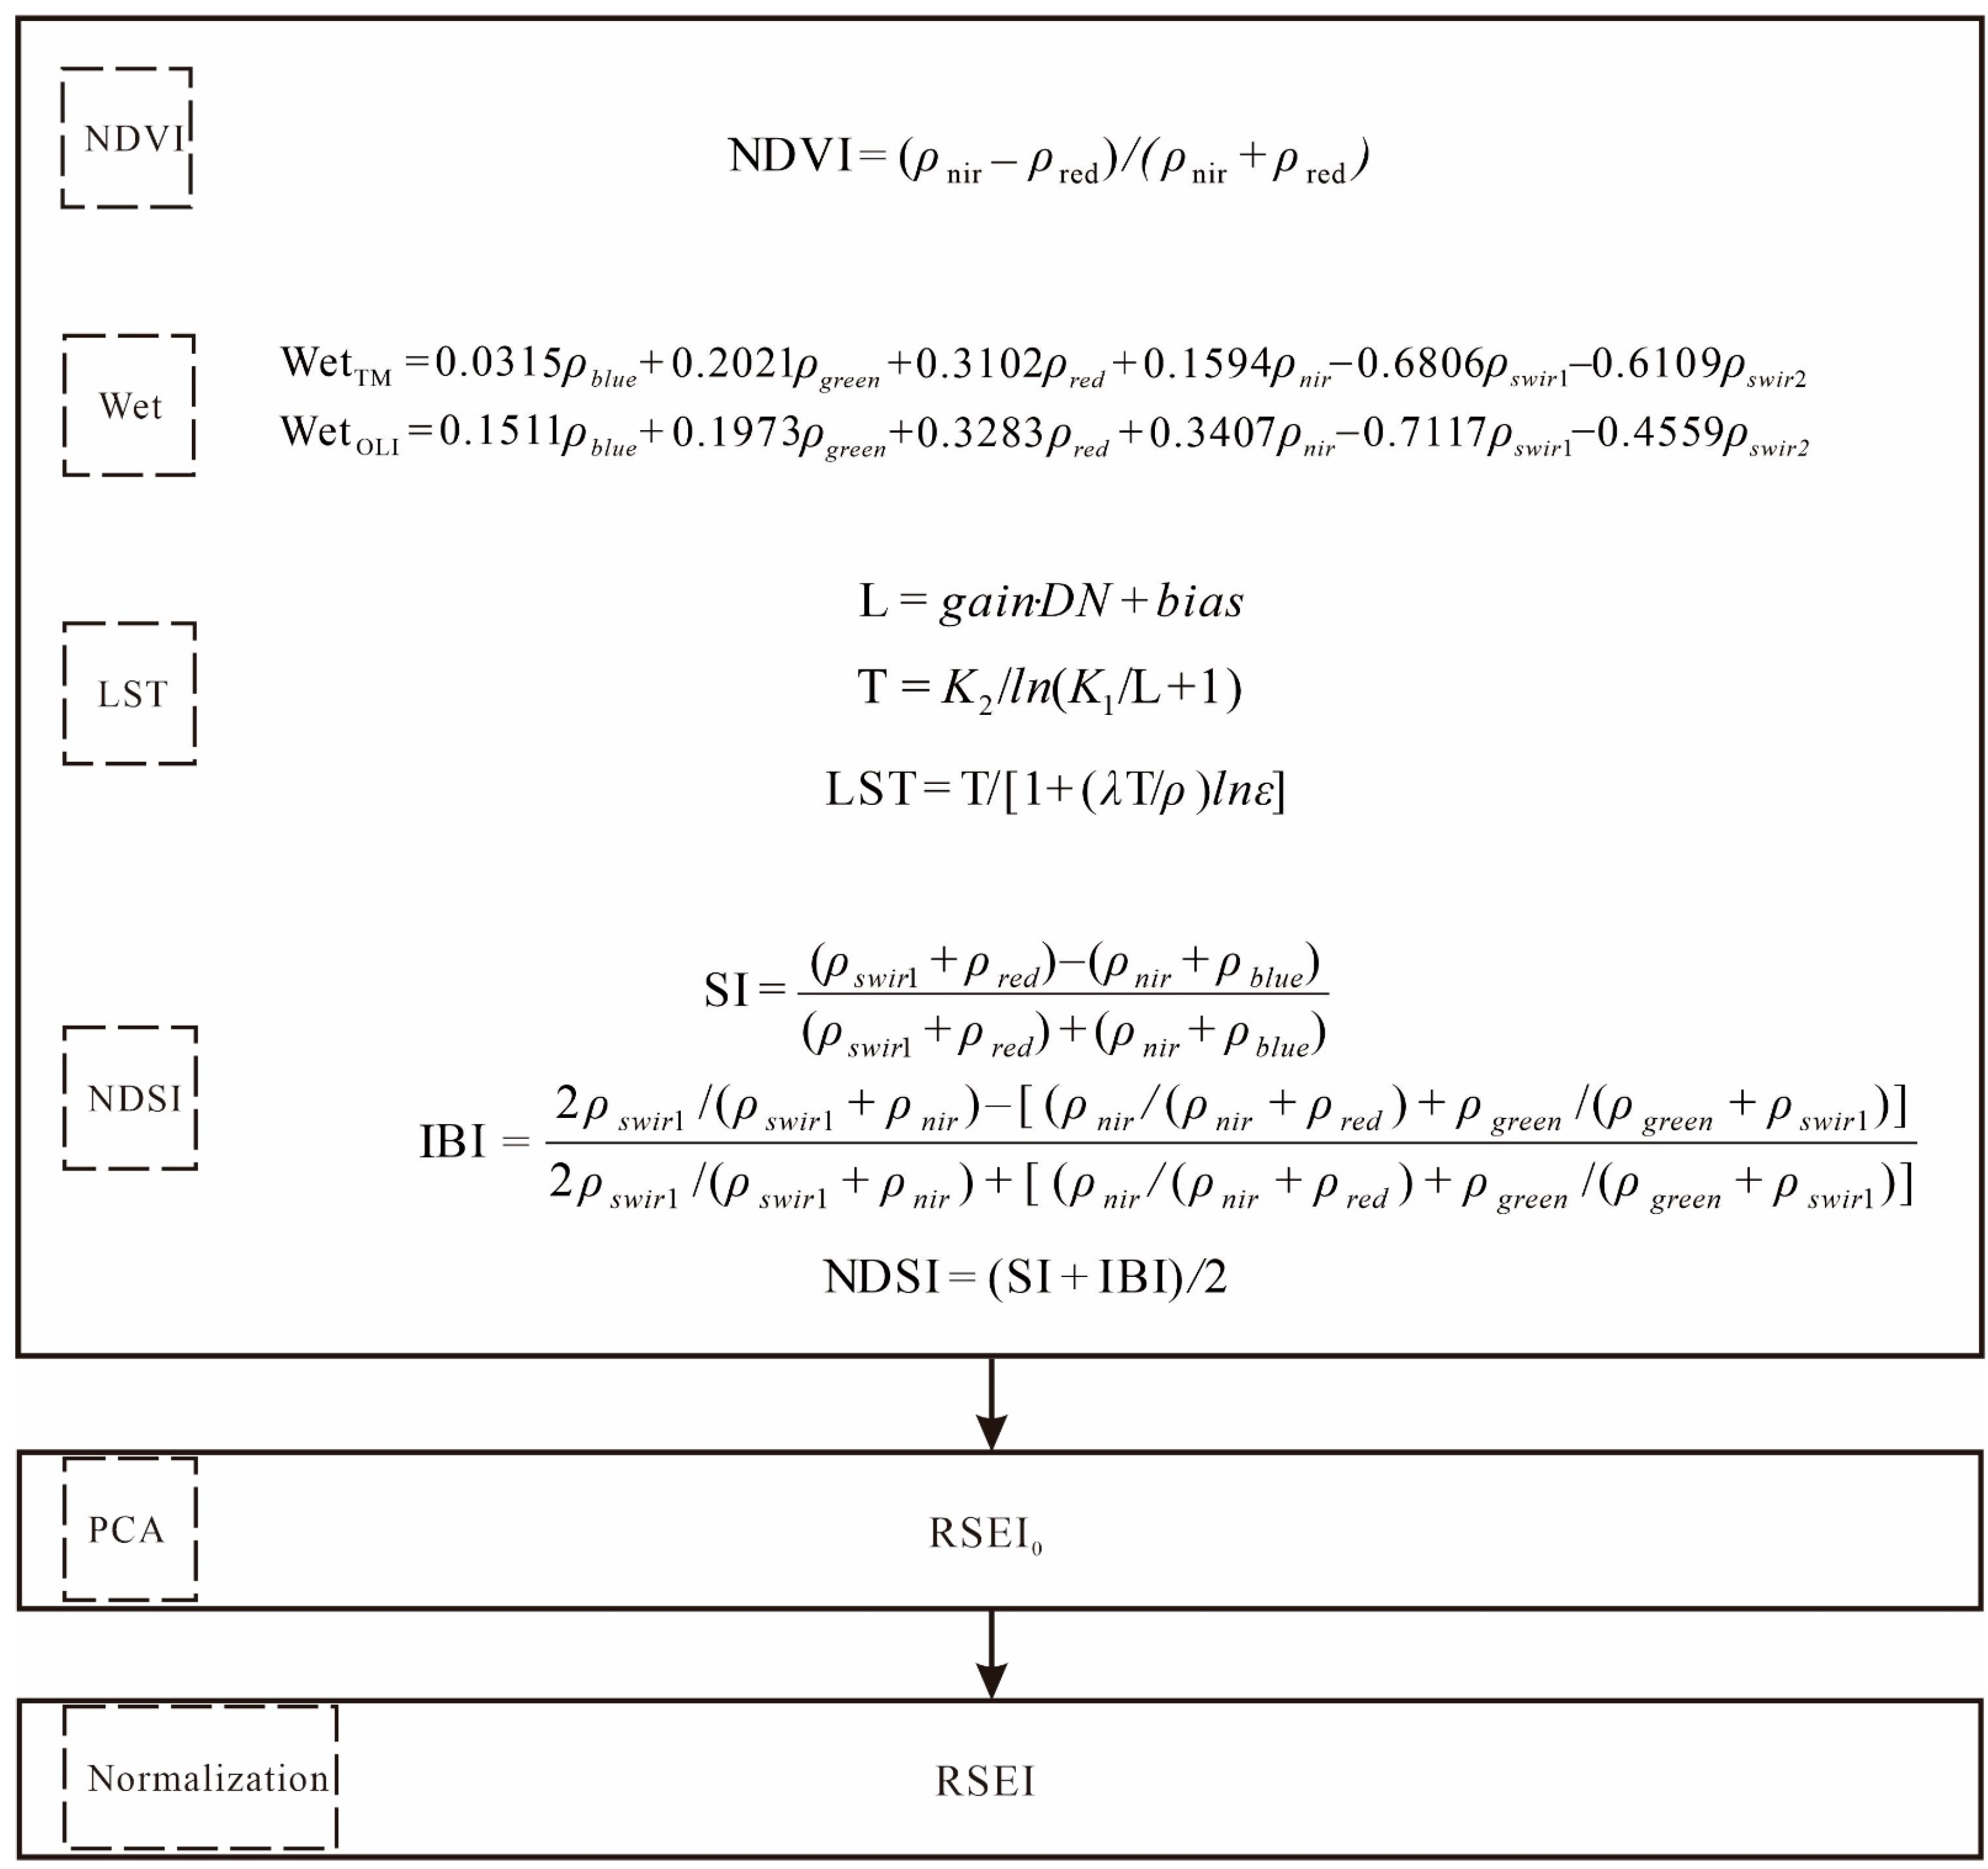
RSEI, obtained by extraction, normalization, and principal component analysis of the four factors of greenness (NDVI), wetness (Wet), dryness (NDSI), and heat (LST), was used to reflect the eco-environmental quality of the mining area in the paper [9], which was calculated using Equation (2). To ensure that the RSEI values could facilitate uniform comparison within the study area, the results were normalized again using Equation (3); the closer the value is to 1, the better the quality of the eco-environment.
RSEI = PC 1 f NDVI , Wet , NDSI , LST
RSEI = RSEI 0 RSEI min RSEI max RSEI min ,
where RSEImin is the minimum value of the ecological index, and RSEImax is the maximum value of the ecological index.
The calculation of each index factor and the detailed calculation of RSEI were performed based on the calculation procedure of Li et al. [18,19,20,21,22,23,24]. The detailed calculation process of each factor and RSEI is shown in Figure 3. The above calculations were performed in the GEE platform by writing a principal component analysis script (PCA, JavaScript).

2.3.2. Geographically Weighted Artificial Neural Network

An artificial neural network (ANN) model is composed of a set of neurons and unidirectional connections between them, making it possible to mimic the brain’s ability to detect patterns and learn relationships within data [25]. Neurons are usually organized by layers, with each neuron in a layer having a directed connection to a neuron in the following layer (Figure 4a). GWANN is a nonlinear GWR approach based on ANN, and it performs training in addition to obtaining neighborhood ratios, which makes it computationally more complex than an ANN model (Figure 4b) [26,27,28]. On the basis of maintaining the structure of the traditional ANN model, the GWANN closely combines the output neurons with the geospatial location to drive each weight factor (ω) to be a weight kernel function about the geospatial distance (dij) and bandwidth (b) [29] using Equation (4).
ω i j = f d i j , b
where ωij is the weight between neurons i and j, f is the weight kernel function, dij is the distance between two samples, and b is the bandwidth parameter. The input neurons included four driving factors: mining activity, temperature, precipitation, and topography, which contained geographic location information.
An input neuron is a grid cell that contains location information, y-values, and x-values. In the paper, the x-values included mining activity, temperature, precipitation, and topography. The first layer is termed the ‘input layer’, the last layer is termed the ‘output layer’, and all the layers in between are termed the ‘hidden layers’. The input neuron to the first hidden layer is calculated using Equation (5), from which it follows that the value of hidden layer m to output layer neuron j is calculated using Equation (6), where the output of neuron bm is calculated by the tanh activation function, as shown in Equations (7) and (8), which is the most commonly used nonlinear hyperbolic tangent activation function in neural networks [30]. Each neuron’s output is then passed to the neurons in the following layer. For each subsequent layer, the process is repeated until the output layer of the network is reached. The output of the output layer represents the total output of the network.
l a y e r h 1 = i = 1 4 ω i h x i
l a y e r j n = m = 1 l v m j b m
b m = Φ l a y e r m
Φ x = e x e x e x + e x
where l a y e r h 1 is the network input of the first hidden layer neuron h, l a y e r j n is the network input of hidden layer neuron j, ωjk is the connection weight between neurons i and h, vmj is the connection weight between neurons m and j, xi is the output value of initial neuron i, bm is the output value of initial neuron m, and Φ is the activation function.
Backpropagation and gradient descent methods are used to optimize the GWANN model. The error function of the GWANN model is based on the error function of the original GWR model ( E = 1 2 i = 1 n t i o i 2 ), which considers the weight of geospatial location information, that is, the weight value is determined based on the spatial distance between the observation and the location of output neuron i, using Equation (9), and the distance value should be computed for each output neuron i. When the output neuron’s location and observation are close, the difference is given more weight than when they are farther apart. In addition, the number of target values must be identical to the number of output neurons [27]. Similarly, the error signal corresponding to the GWANN model needs to take into account the spatial location information weighting factor on the basis of the error signal of the ANN model, and the calculation of the error signal of backpropagation is modified as Equation (10).
E = 1 2 i = 1 n d i y i b i 2
δ j = d j b j y i φ l a y e r j ,   if   j   is   an   output   neuron ,   k δ k ω j k φ l a y e r j ,                         otherwise ,
where E is the error function, yi is the target value of neuron i, bi is the output of output neuron i, bj is the output of output neuron j, di is the geographically weighted distance between the observation and the location of output neuron i, dj is the geographically weighted distance between the observation and the location of output neuron j, n is the number of target values/output neurons, δj is the error signal of neuron j, Φ′ is the derivative of the activation function, and ωjk is the connection weight between neuron j and neuron k.
The connection weights are adjusted using gradient descent, which can significantly enhance training performance and make the training more robust [31], as in Equation (11). Through the optimization of the two steps, the terminating condition is reached, and the predicted value ŷ is finally obtained.
Δ ω i j = η E ω i j = η δ j b i
where ωij is the connection weight between neurons i and j, E is the error function, δj is the error signal of neuron j, bi is the output of neuron i, and η is the learning rate.

2.3.3. Attribution Analysis Based on GWDF-ANN

The GWDF-ANN model calculates the contribution rate of each factor by differentiation on the basis of GWANN [17,32]. The steps are as follows. First, the predicted value of the ecological quality of the study area, RSEI^, was calculated by combining GWANN with the driving factors. Afterwards, we added Δxi to xi using Equation (12), with the other driving factors keeping xj constant, where the value of Δxi was carried out as a threshold value in a series of experiments. This can ensure a moderate change in the contribution of driving factor i; the threshold value was proven by Li et al. [17]. Then, the new predicted value, RSEI x i ^ , corresponding to the increase in driving factor i was calculated, and the partial derivatives of each driving factor i were calculated respectively, as in Equation (13). Finally, the partial derivatives of each factor were normalized, and the contribution of each driving factor i to the RSEI was obtained using Equation (14). The above calculations were performed in RStudio.
Δ x i = x i × 0.001
G x i = RSEI x i 0 RSEI x i Δ x i
W x i = G x i i = 1 n G x i
where Δxi is the bias of xi, xi is the input value of driving factor i, G x i is the partial derivative of xi, RSEI x i ^ is the predicted value of driver i after the increase in Δxi, RSEI x i 0 is the predicted value of the original data, n is the number of the driving factors, and W x i is the contribution of driving factor i.

3. Results

3.1. Spatial and Temporal Patterns of Ecological Quality in the Mining Area

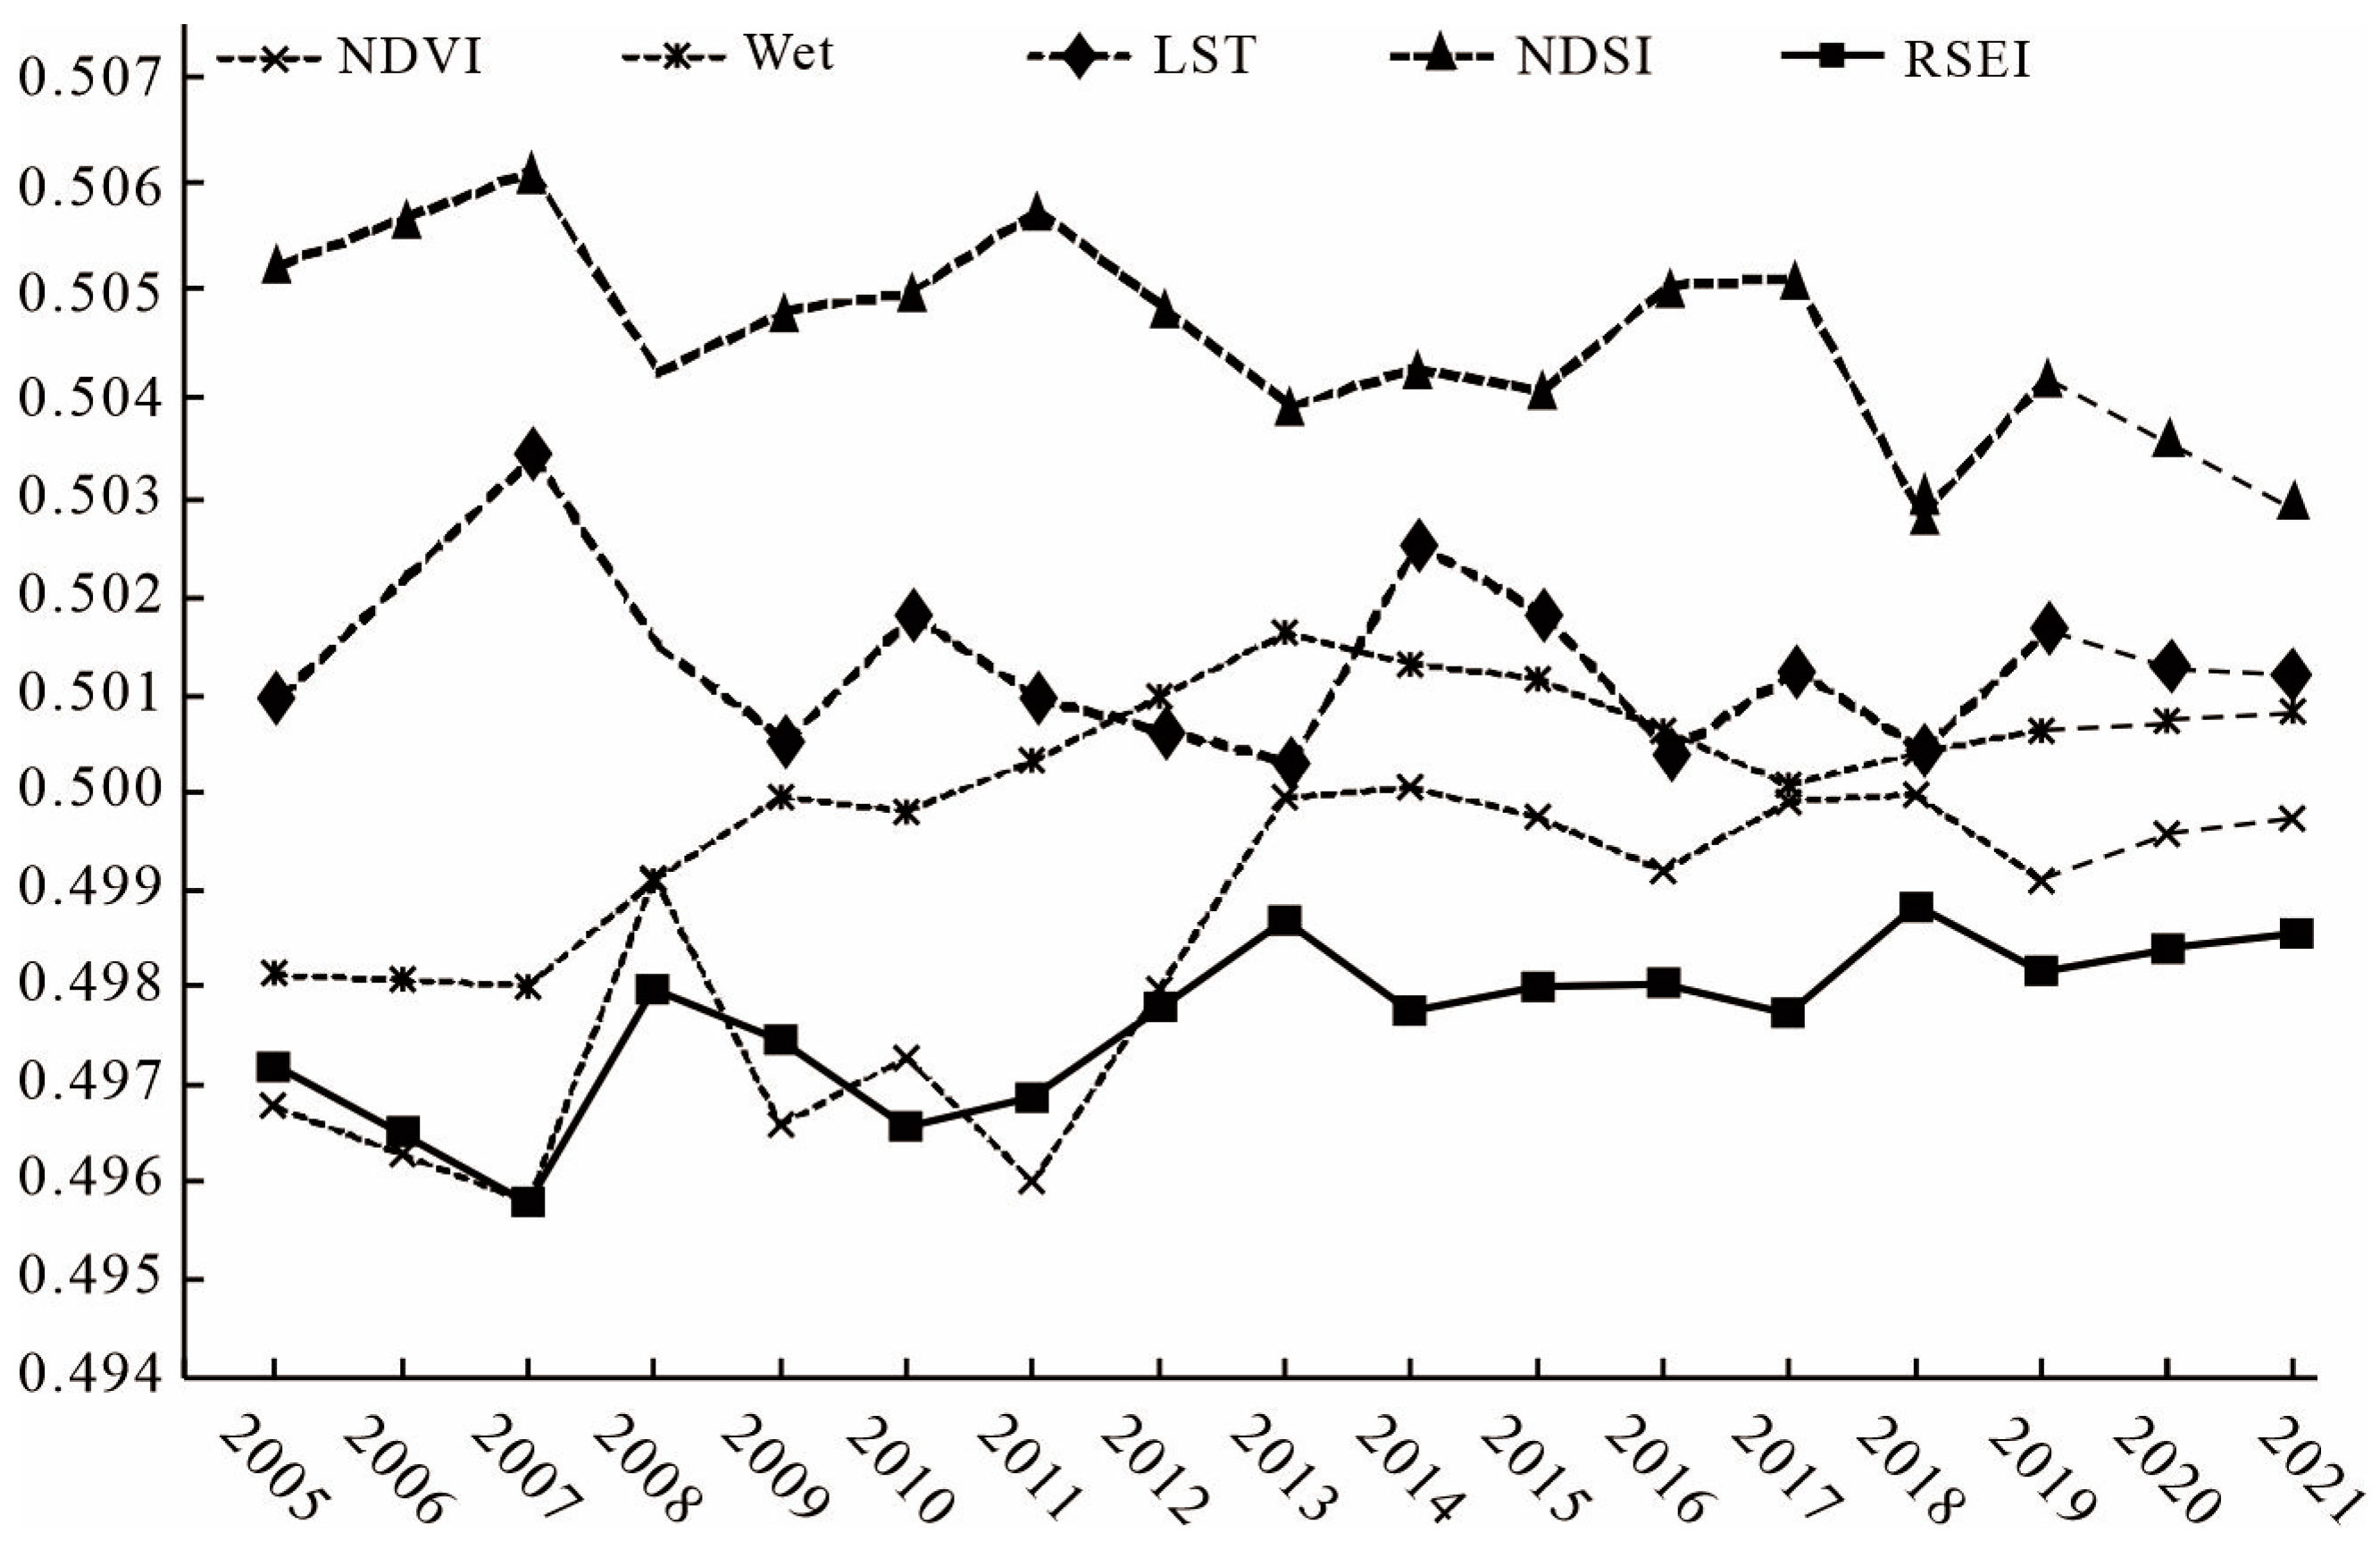
The mean values of the four indicators of RSEI, NDVI, Wet, LST, and NDSI, in the study area from 2005 to 2021 were plotted in Figure 5. The results showed that the eco-environmental quality of the southwest part of the Shengli mining area fluctuated in a downward and then upward trend over the past 17 years, with the changes in the later period being more stable than those in the early period. The changes in the four indicators were closely related to the RSEI values, where NDVI and Wet were positively correlated with RSEI (Figure 5), and LST and NDSI were negatively correlated with RSEI (Figure 5).
According to the development of ecological restoration work in the mining area and the inversion of the RSEI, we selected the RSEI values in 2005, 2010, 2015, and 2021 for the assessment of eco-environmental quality, and divided them into five classes based on equal intervals: poor (0–0.2), inferior (0.2–0.4), medium (0.4–0.6), good (0.6–0.8), and excellent (0.8–1.0). The statistical area of each eco-environmental quality grade is shown in Table 1, and the distribution of grades is shown in Figure 6. The results showed that the area with excellent and good eco-environmental quality increased from 20.96% in 2005 to 23.93% in 2021, and the proportion of the area with excellent eco-environmental quality within the mining area increased. Areas with medium eco-environmental quality accounted for the majority of the study area, with the highest percentage of 61.63% in 2010, and their distribution mainly changed from being concentrated around the mining area to inside the mining area. The proportion of the area with poor and inferior eco-environmental quality fluctuated greatly, below 30%, except in 2015, and its distribution shifted from the eastern portion of the study area to the locations of the mining districts.
In general, the eco-environmental quality of the mine locations was worse than that of the surrounding areas of the mining area in the early stage of coal mining before 2010 (Figure 6a,b). After 2010, the ecological quality of the mining districts, especially the areas of the dump sites, was significantly improved, while the eco-environmental quality around the mining districts was worse than that inside the mining area (Figure 6c,d), indicating that human activities had a greater impact on the eco-environmental quality in the study area.

3.2. Evolution of Eco-Environmental Quality in the Study Area

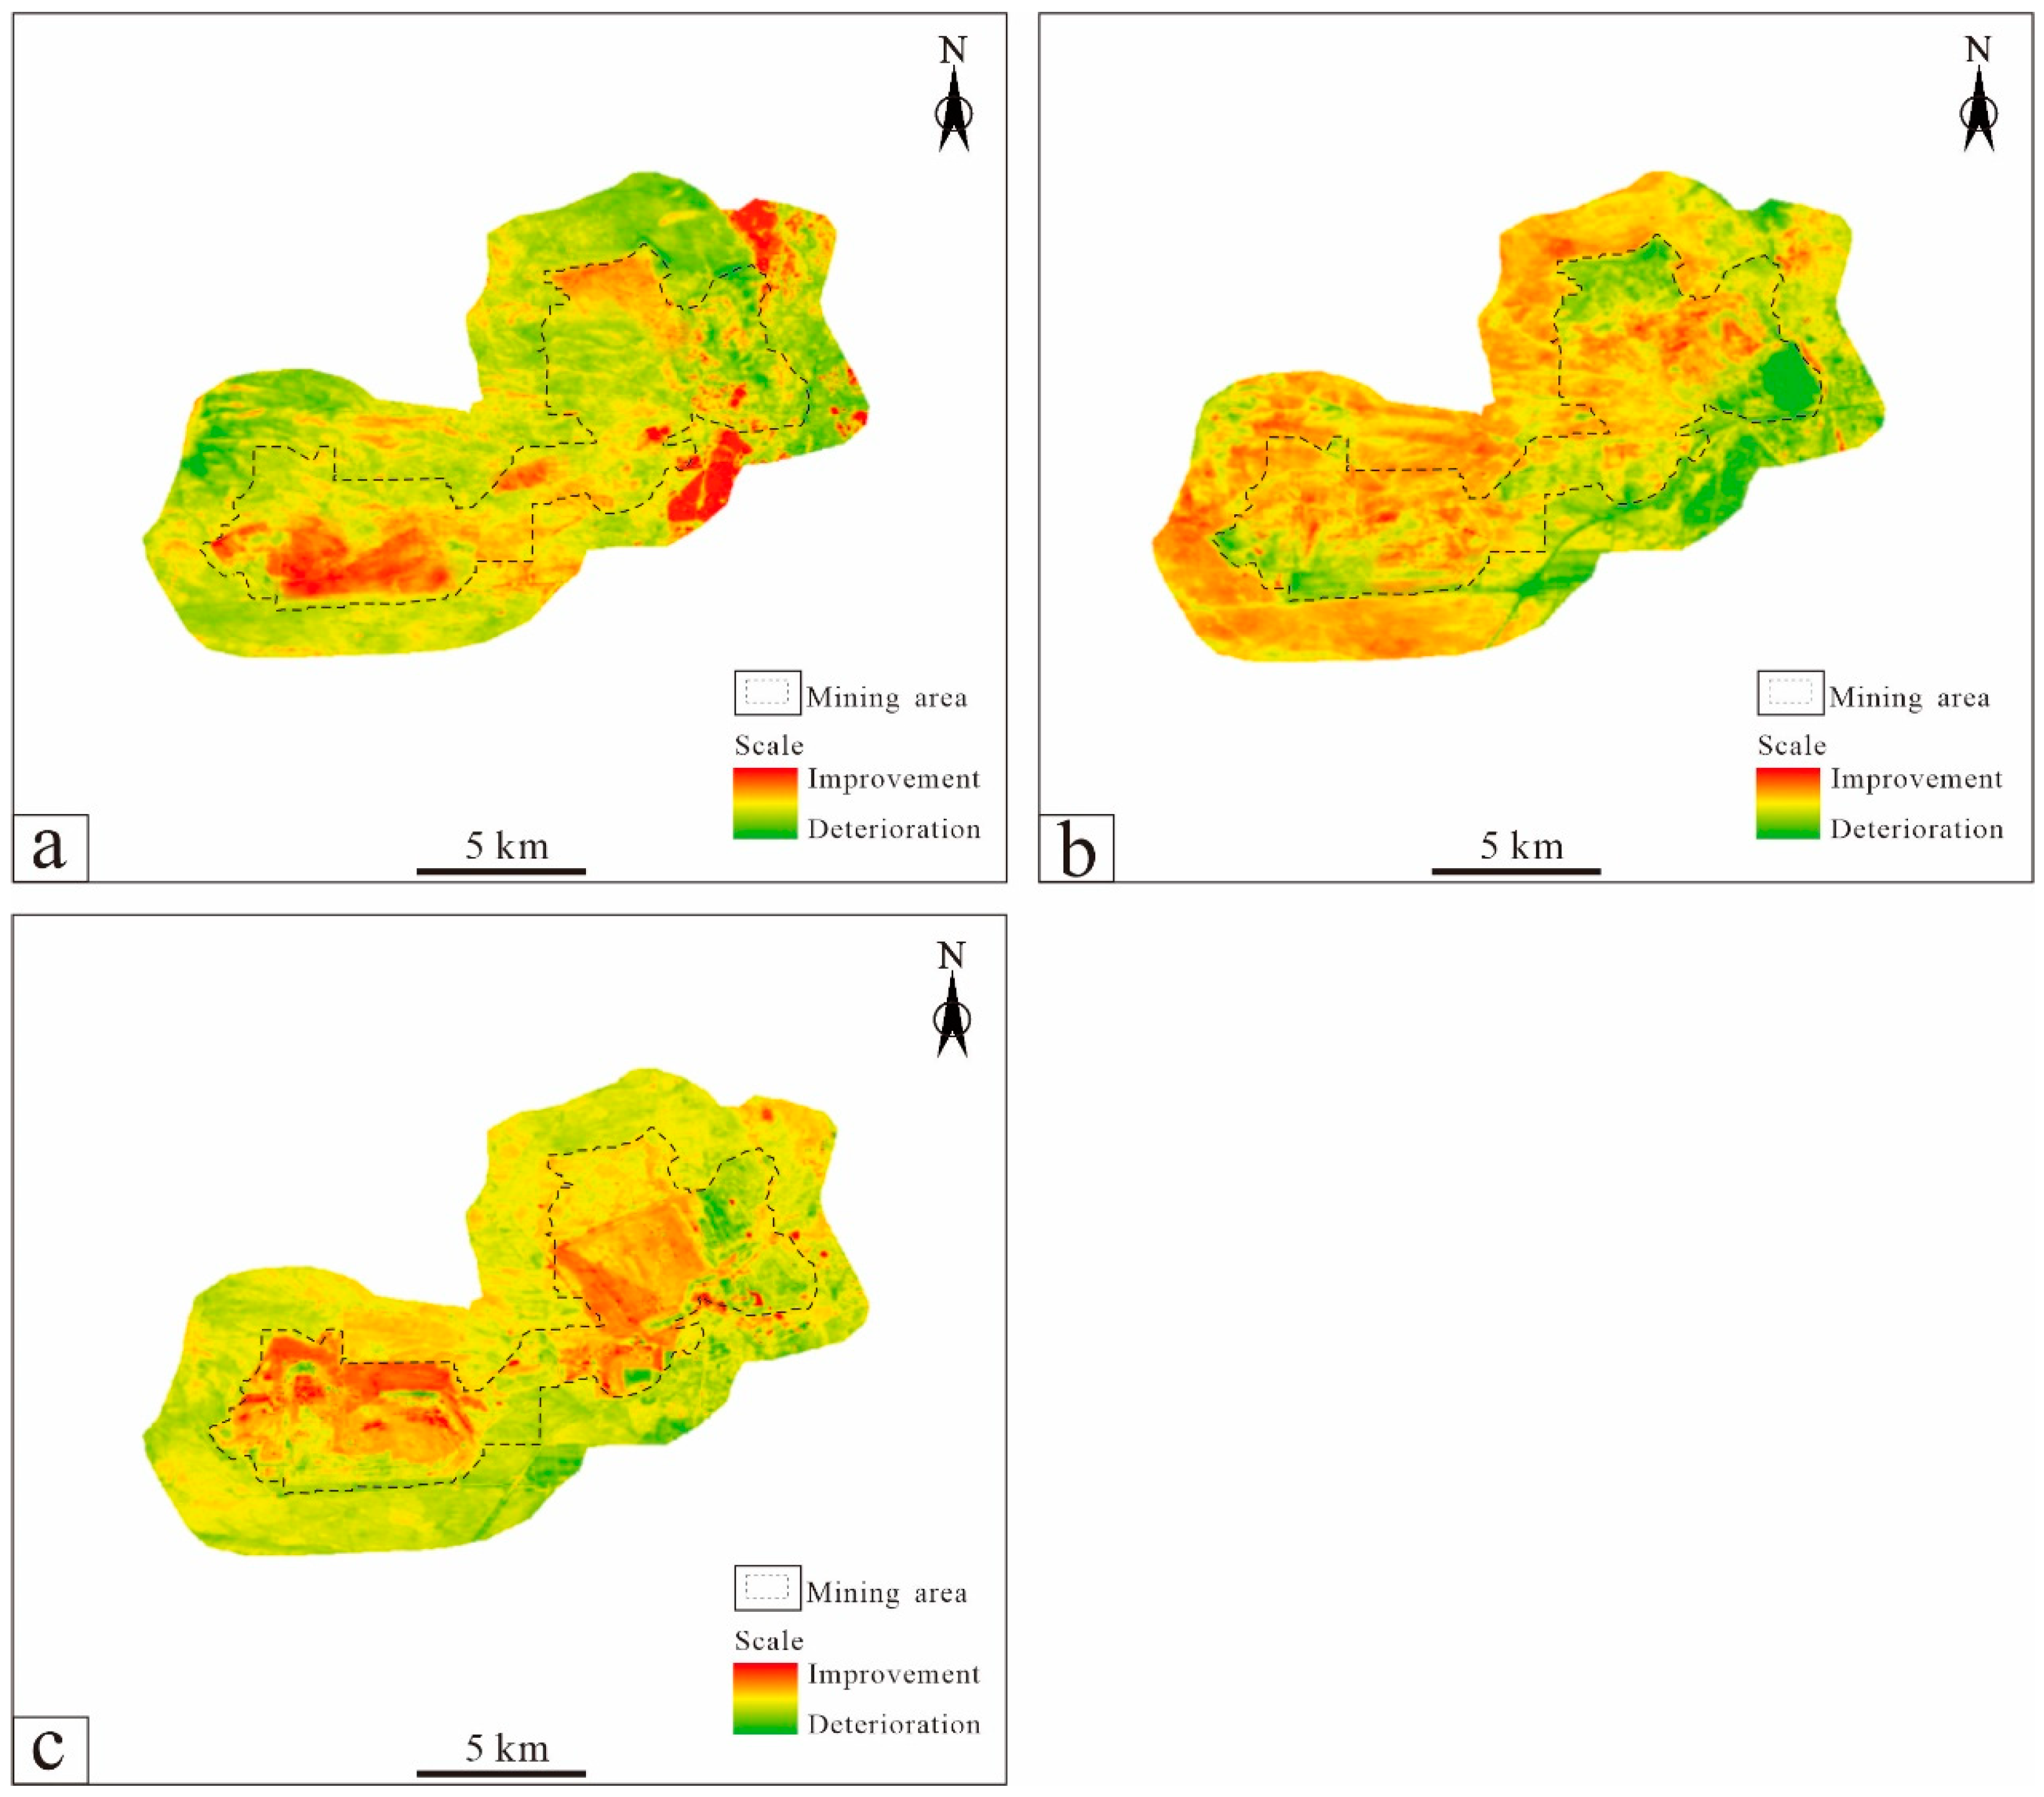
Based on the ridge regression model provided by the GEE platform, we fit the trends of RSEI in the study area over three time periods, from 2005 to 2010, from 2010 to 2015, and from 2015 to 2021, with the slope representing the trend in eco-environmental quality evolution, where a scale > 0 meant eco-environmental quality improvement with larger values representing better improvement, and a scale < 0 meant eco-environmental quality deterioration with a smaller value indicating more serious deterioration (Figure 7).
The results showed that the areas where the eco-environmental quality deteriorated from 2005 to 2010 were concentrated in the mining districts, and areas with improvement in the eco-environmental quality were distributed throughout the region (Figure 7a). From 2010 to 2015, the areas of ecological degradation within the mining area shifted with the mine locations, and the areas of degradation outside the mining area were mainly in the western region. During this period, areas with eco-environmental quality improvement in the mining area were concentrated in the dump sites, and areas with improvement outside the mining area were concentrated in the urban and mining transition area and the park construction area around the city, which was the result of fewer urban buildings and greening efforts (Figure 7b). From 2015 to 2021, the significant ecological degradation areas were concentrated in the new mining districts, and the eco-environmental quality of the outer dump sites was also slightly degraded. The deterioration and improvement in eco-environmental quality outside the mining area was evenly distributed. Areas with improvement in eco-environmental quality were concentrated partly in the dump sites and the transition area between the city and the mining area (Figure 7c).
In summary, from 2005 to 2021, the change trend in the ecological environmental conditions inside the mining area was continuous deterioration in the mining districts and a change from good to stable conditions in the dump sites, while the change trend in eco-environmental quality outside the mining area was continuous improvement in the transition area between the urban and mining areas.

3.3. Accuracy Verification of GWANN

The distribution and evolution characteristics of the ecological environment condition in the mining area were combined with previous research results [17], including four key factors as neuronal inputs: mining activity, temperature, precipitation, and topography. All of these factors, which are closely related to the eco-environmental quality, were selected for the study. We used the ArcGis 10.5 platform sampling tool to randomly select 3000 grid cells within the study area for different years for training, fitted the predicted value of RSEI^ of eco-environmental quality at each grid cell using the GWANN model, and compared it with the actual value of RSEI at each point. RMSE has always been used as a key indicator to assess the accuracy of geospatial modeling [33,34]. We carried the predicted and actual values into the RMSE calculation formula as shown in Equation (15), resulting in an average RMSE of 0.08, with a maximum value of 0.12 and a minimum value of 0.005. The predicted and actual values were linearly fitted (Figure 8a), and the results showed a correlation coefficient R2 value of 0.79. The actual mean RSEI values of the selected fitted points from 2005 to 2021 were statistically plotted against the fitted mean values (Figure 8b). The fitting accuracy was similar to that of the previous fits to fractional vegetation coverage in the study area [17]. Chen et al. [35] used GWR and an ordinary least squares model to fit the improved RSEI values in Jining City, with a maximum R2 of 0.619. In addition, Huang et al. [36] utilized the GWR model and a linear regression model to fit the RSEI values of the typical mining area in Daye City, with a maximum R2 of 0.725, which reflected that the GWANN model fit well and was suitable for quantitative analysis of the eco-environmental quality in the study area.
R M S E = 1 n i = 1 n RSEI i ^ RSEI i 2
where n is the number of training sample points, RSEI i ^ is the predicted value of training sample point i, and RSEIi is the actual value of training sample point i.

3.4. Analysis of the Contribution Rate of the Driving Factors

We assessed the effects of mining activity, temperature, precipitation, and topography on the eco-environmental quality of the study area. As the mining activity required the calculation of the Euclidean distance from the center of the mining area to a grid cell, the scope of the mining activity was not included in the analysis of the attribution factors for eco-environmental quality. The average contributions of the four factors in the study area for 2005, 2010, 2015, and 2021 are shown in Table 2. The contributions of the different factors fluctuated slightly over the years, with the highest being that of mining activity, the average contribution of which was 34.48%, and its contribution decreased slightly with time. The contributions of temperature and precipitation as well as topography factors were not related to time evolution.
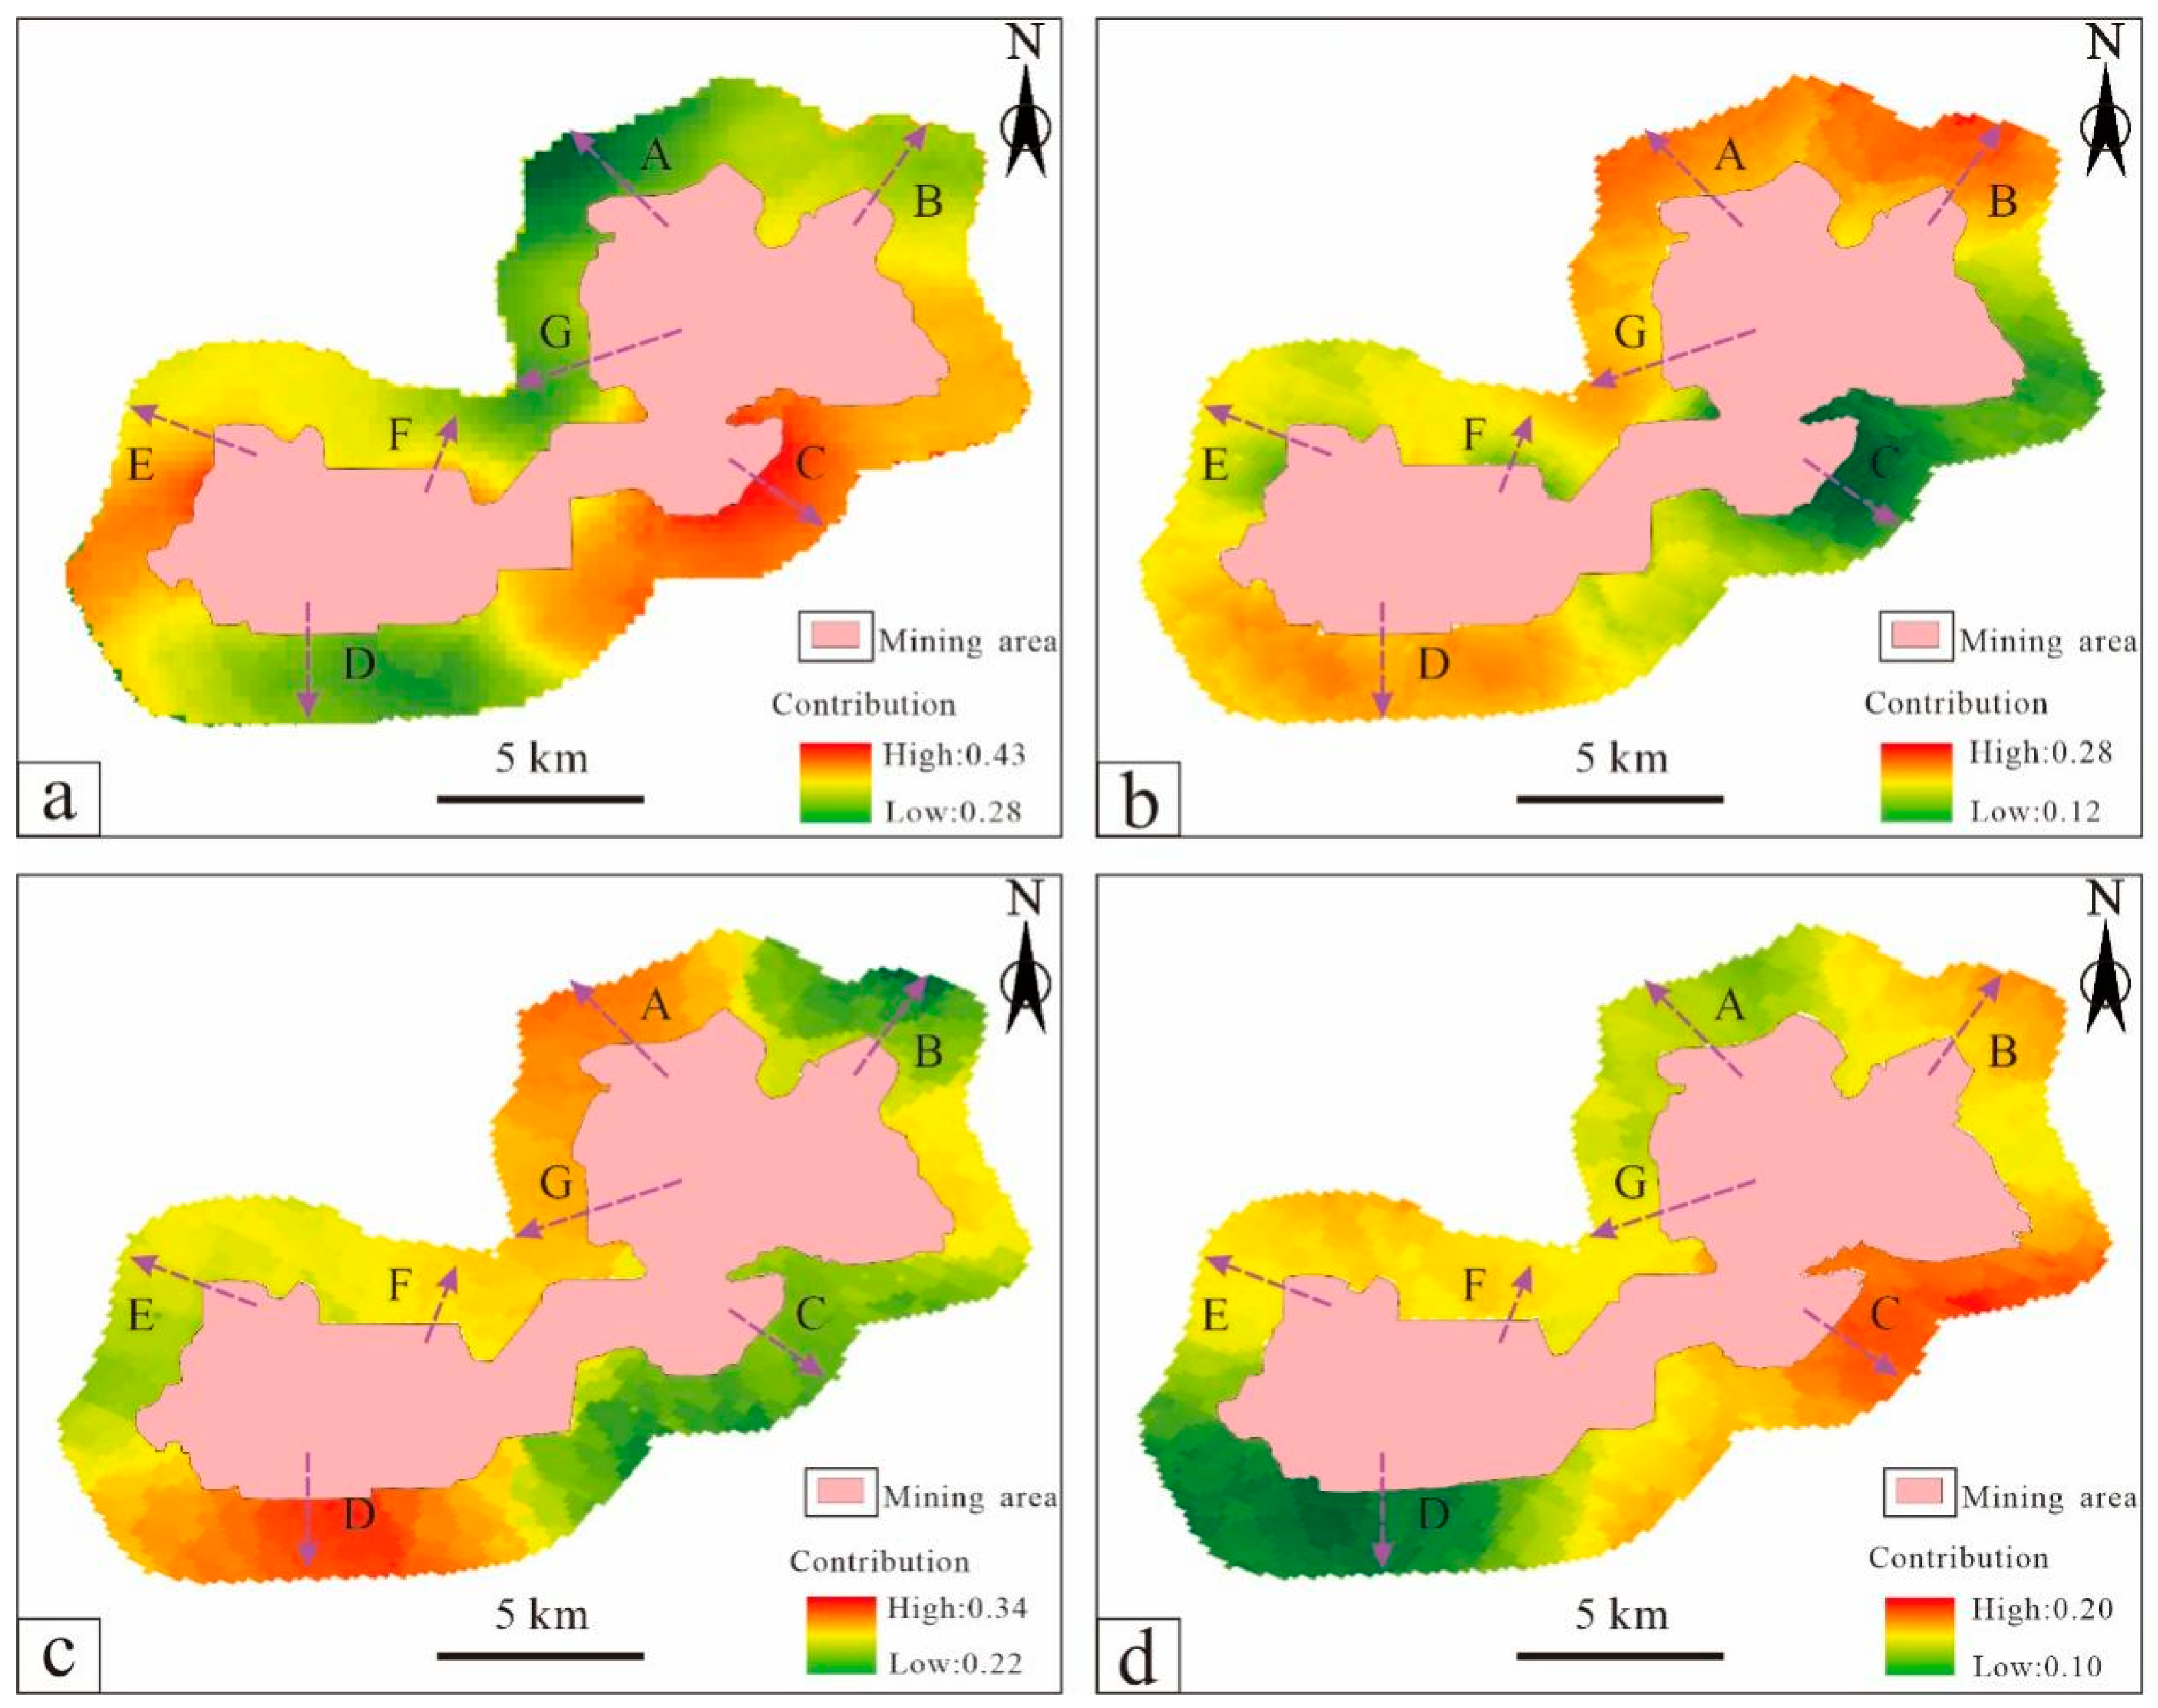
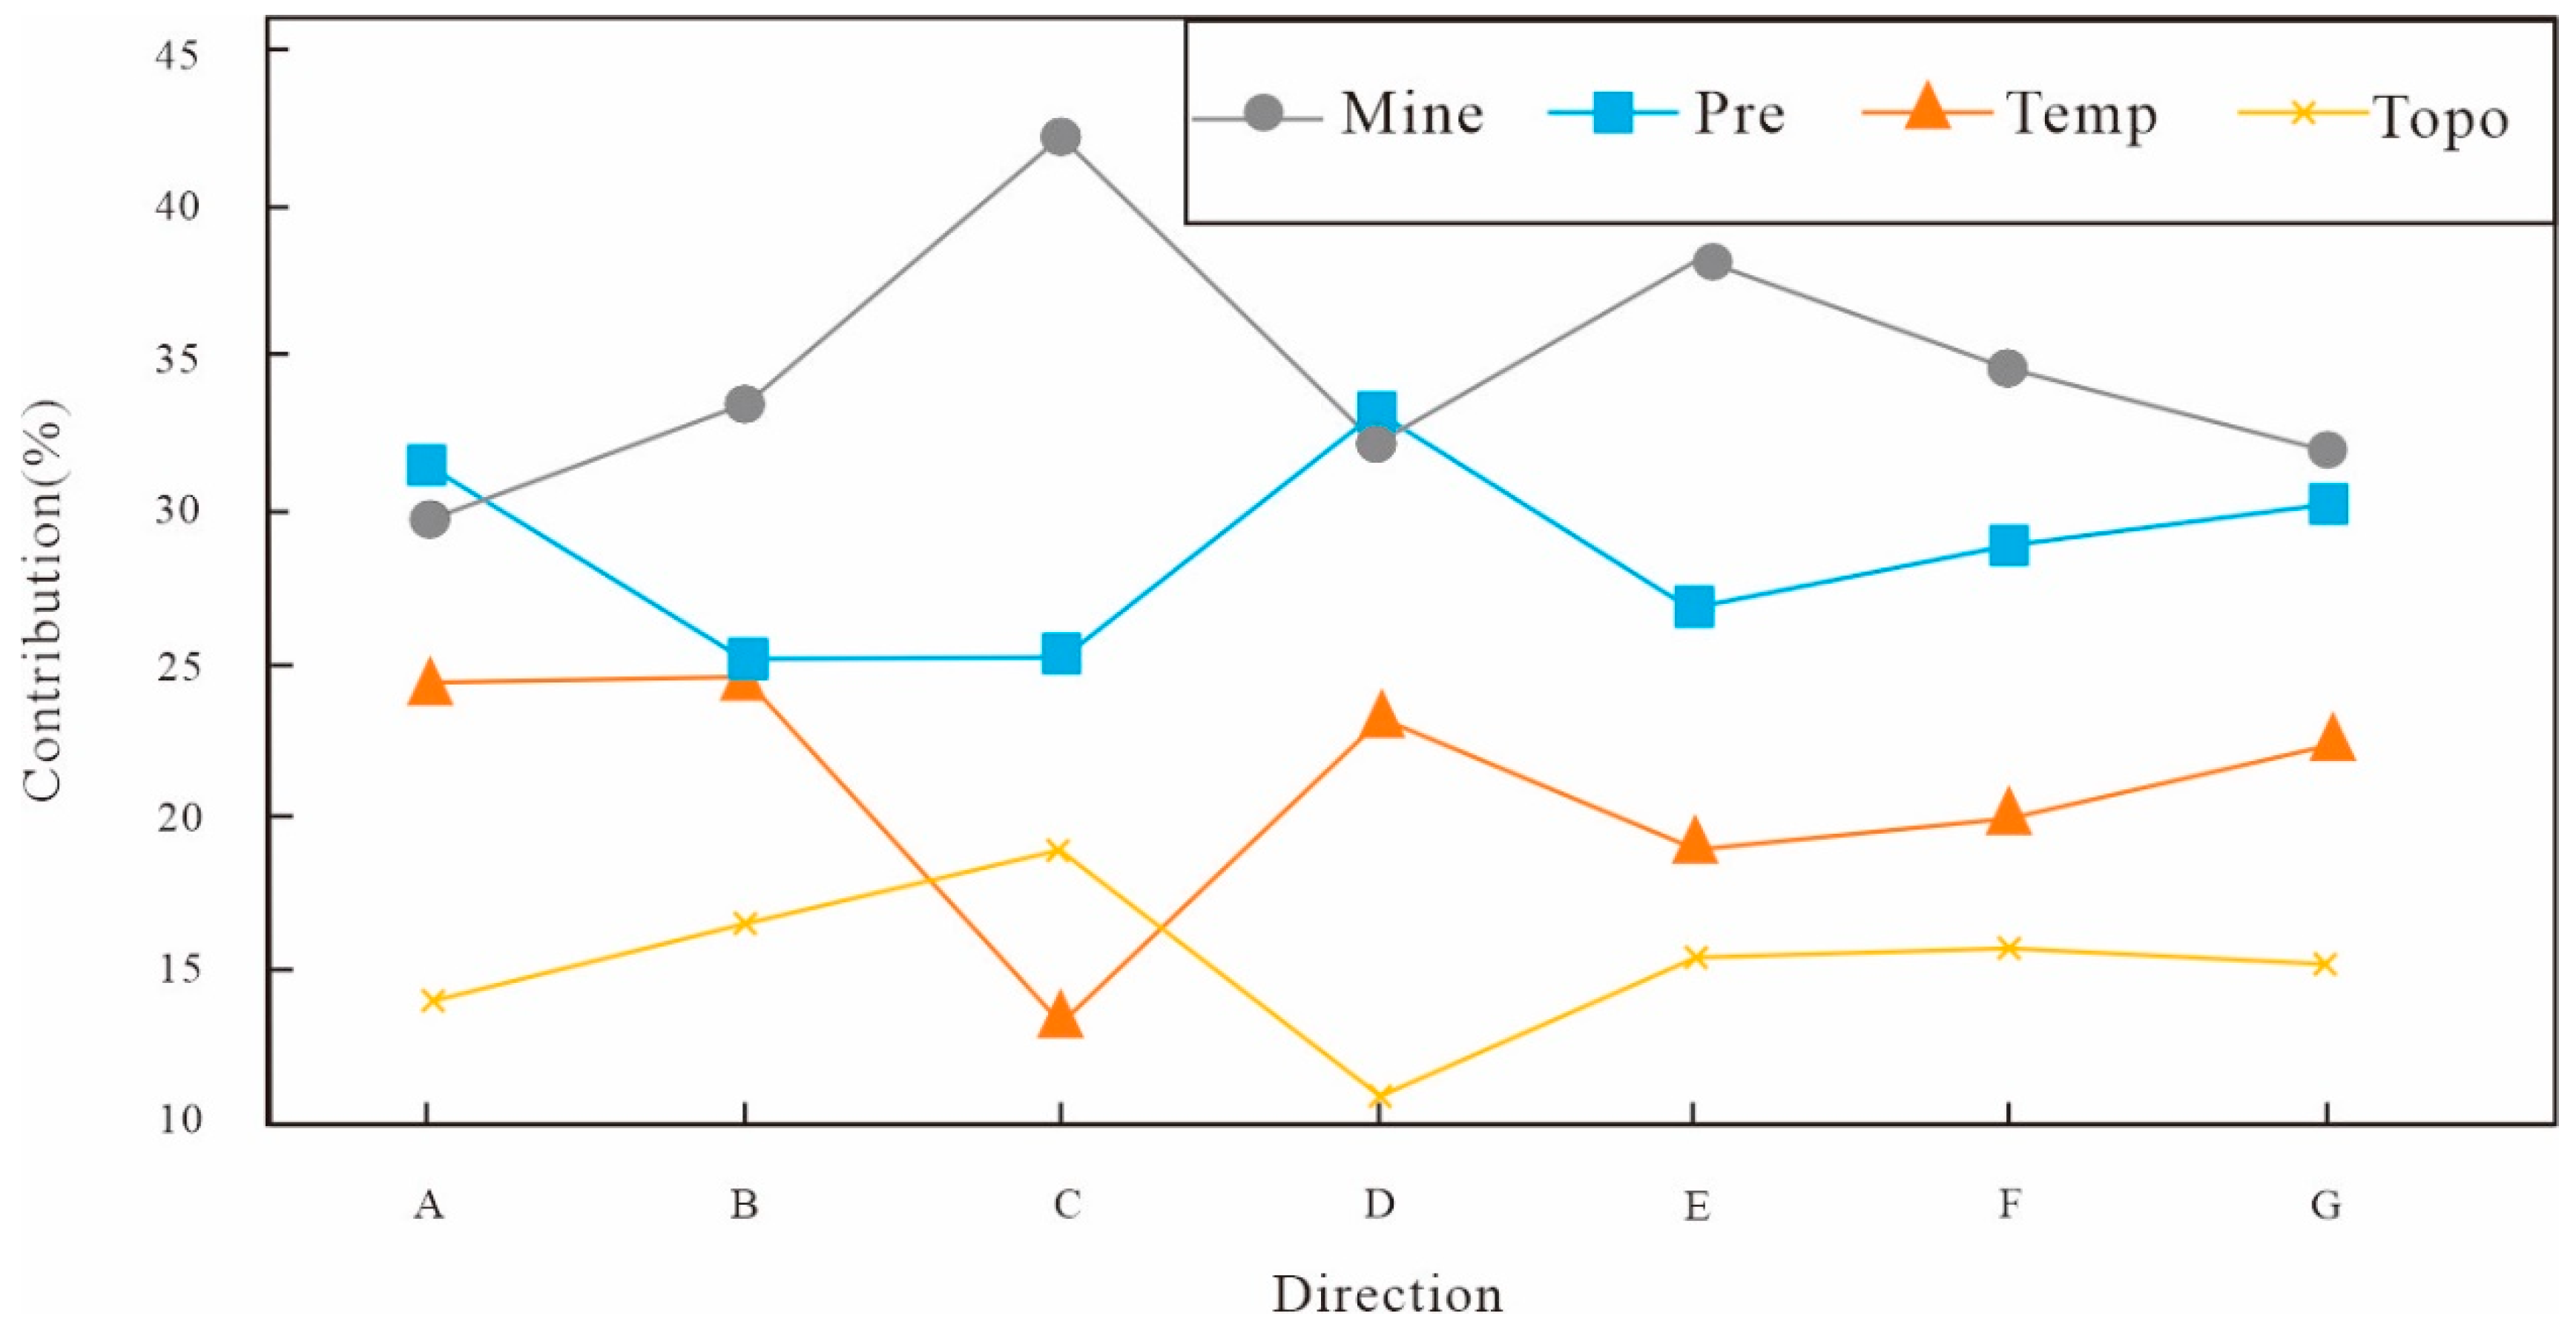
Since the variation in the contribution of each factor to the RSEI over the four years was small, we visualized the spatial impact contribution of the different factors to the RSEI in the study area in 2021 (Figure 9). To more easily analyze their spatial trend characteristics, based on the results of the spatial variation of each driver’s contribution, which covered all directions of the mining areas and considered the important influence of anthropogenic activities such as mining [37,38], seven auxiliary lines were added in the area near the mining districts and dump sites, namely, A, B, C, D, E, F, and G. Auxiliary lines A, B, and D extended from the center of the dump site to the periphery of the mining area, and auxiliary lines C, E, F, and G extended from the center of the mining district to the periphery of the mining area (Figure 9). Among them, the mining activity factor had a maximum contribution in the direction of auxiliary line C, with the highest value of 43.33%, which gradually decreased with increasing distance from the center of the mining area. Furthermore, the trend of its contribution in the directions of auxiliary lines A, E, F, and G also showed a certain inverse relationship with the distance from the center of the mining area. The maximum value of the contribution of the temperature factor was in the direction of auxiliary line B, with a maximum value of 25.54%, while its contribution was also comparatively high in the directions of auxiliary lines A and D. In the direction of auxiliary line C, its contribution reached a minimum of 12.39%. The maximum value for the contribution of the precipitation factor was distributed in the direction of auxiliary line D, with a value reaching 33.65%. In the direction of auxiliary line B, the value reached a minimum of 23.86%; in the directions of auxiliary lines C and E, the contribution rates were also relatively low. The topography factor had a maximum contribution value of 19.36%, with high values mainly in the directions of auxiliary lines C and B, while its contribution was lower in the directions of auxiliary lines D and A, with a minimum value of 10.75%.
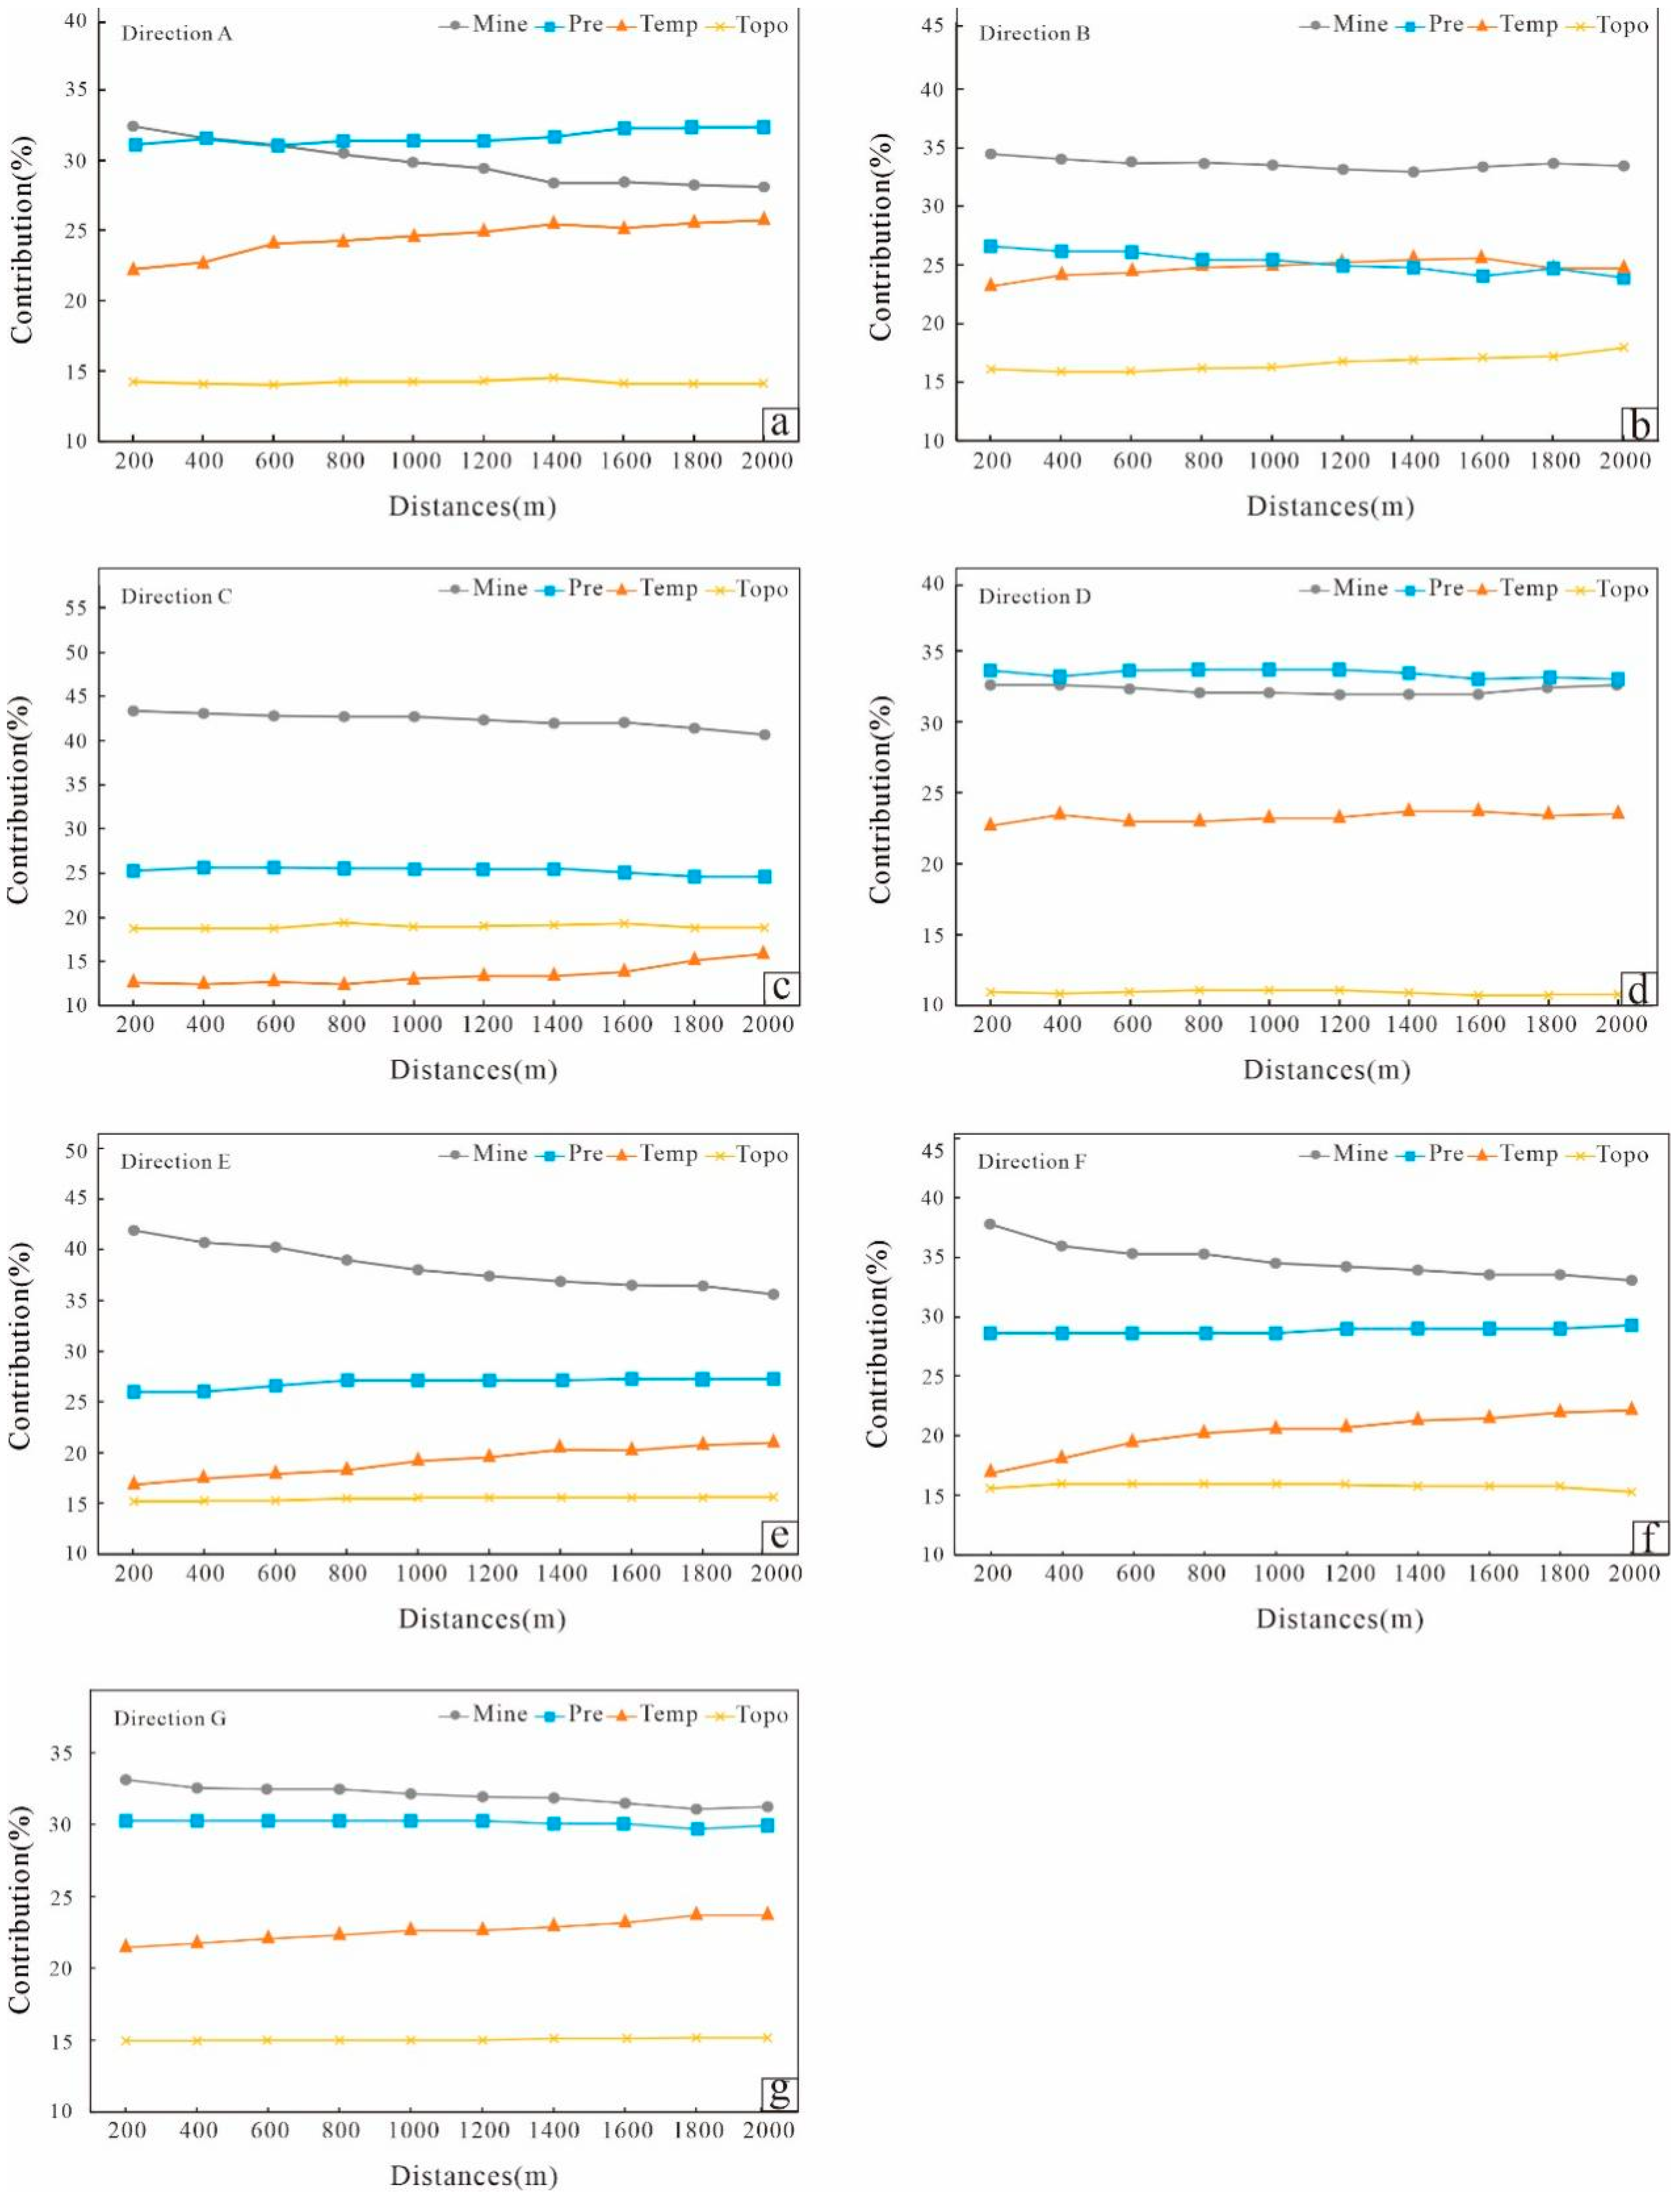
We calculated the average contribution of each driving factor in 10 analysis grid cells at different distances in the same direction from the boundary of the mining area. The results are shown in Figure 10, indicating that the influence of each driving factor on the RSEI values varied greatly in different directions, where the contribution of mining activity in directions A, B, and D, which were closer to the dump sites, was lower than that in directions C, E, and F, which were closer to the mining districts. Furthermore, the influence of the temperature on the RSEI values had the opposite trend to that of the mining activity, with higher contributions in the areas around the dump sites than around the mining districts. The variation trend of the precipitation contribution in each direction was similar to that of the temperature contribution. The contribution of topography to the RSEI values in each direction was slightly lower around the dump sites than around the mining districts.
To more intuitively show the relationship between the contribution of the four driving factors in each direction and the distance from the grid cell to the mining area, we then plotted the contribution values for different direction; the results are presented in Figure 11. With the exception of direction D, the influence of mining activity on the RSEI values showed a clear decreasing trend with increasing distance from the grid cell to the mining area, among which the most obvious decreasing trend was in direction E, where the contribution of the influence decreased from 41.94% at 200 m from the mining area boundary to 35.57% at 2000 m. The contribution of the temperature tended to increase with distance in the A, B, E, F, and G directions, while the contribution of the topography did not vary significantly with distance. In summary, the contribution of each driving factor varied in different locations, indicating that each factor had strong spatial heterogeneity. Anthropogenic factors such as mining activity had a greater impact on the eco-environmental quality in the mining area than natural elements such as temperature, precipitation, and topography, and the change in the contribution of mining activity was correlated with the distance from the boundary of the mining area.

4. Discussion

4.1. Analysis of the Causes of Variation in Eco-Environmental Quality within the Mining Area

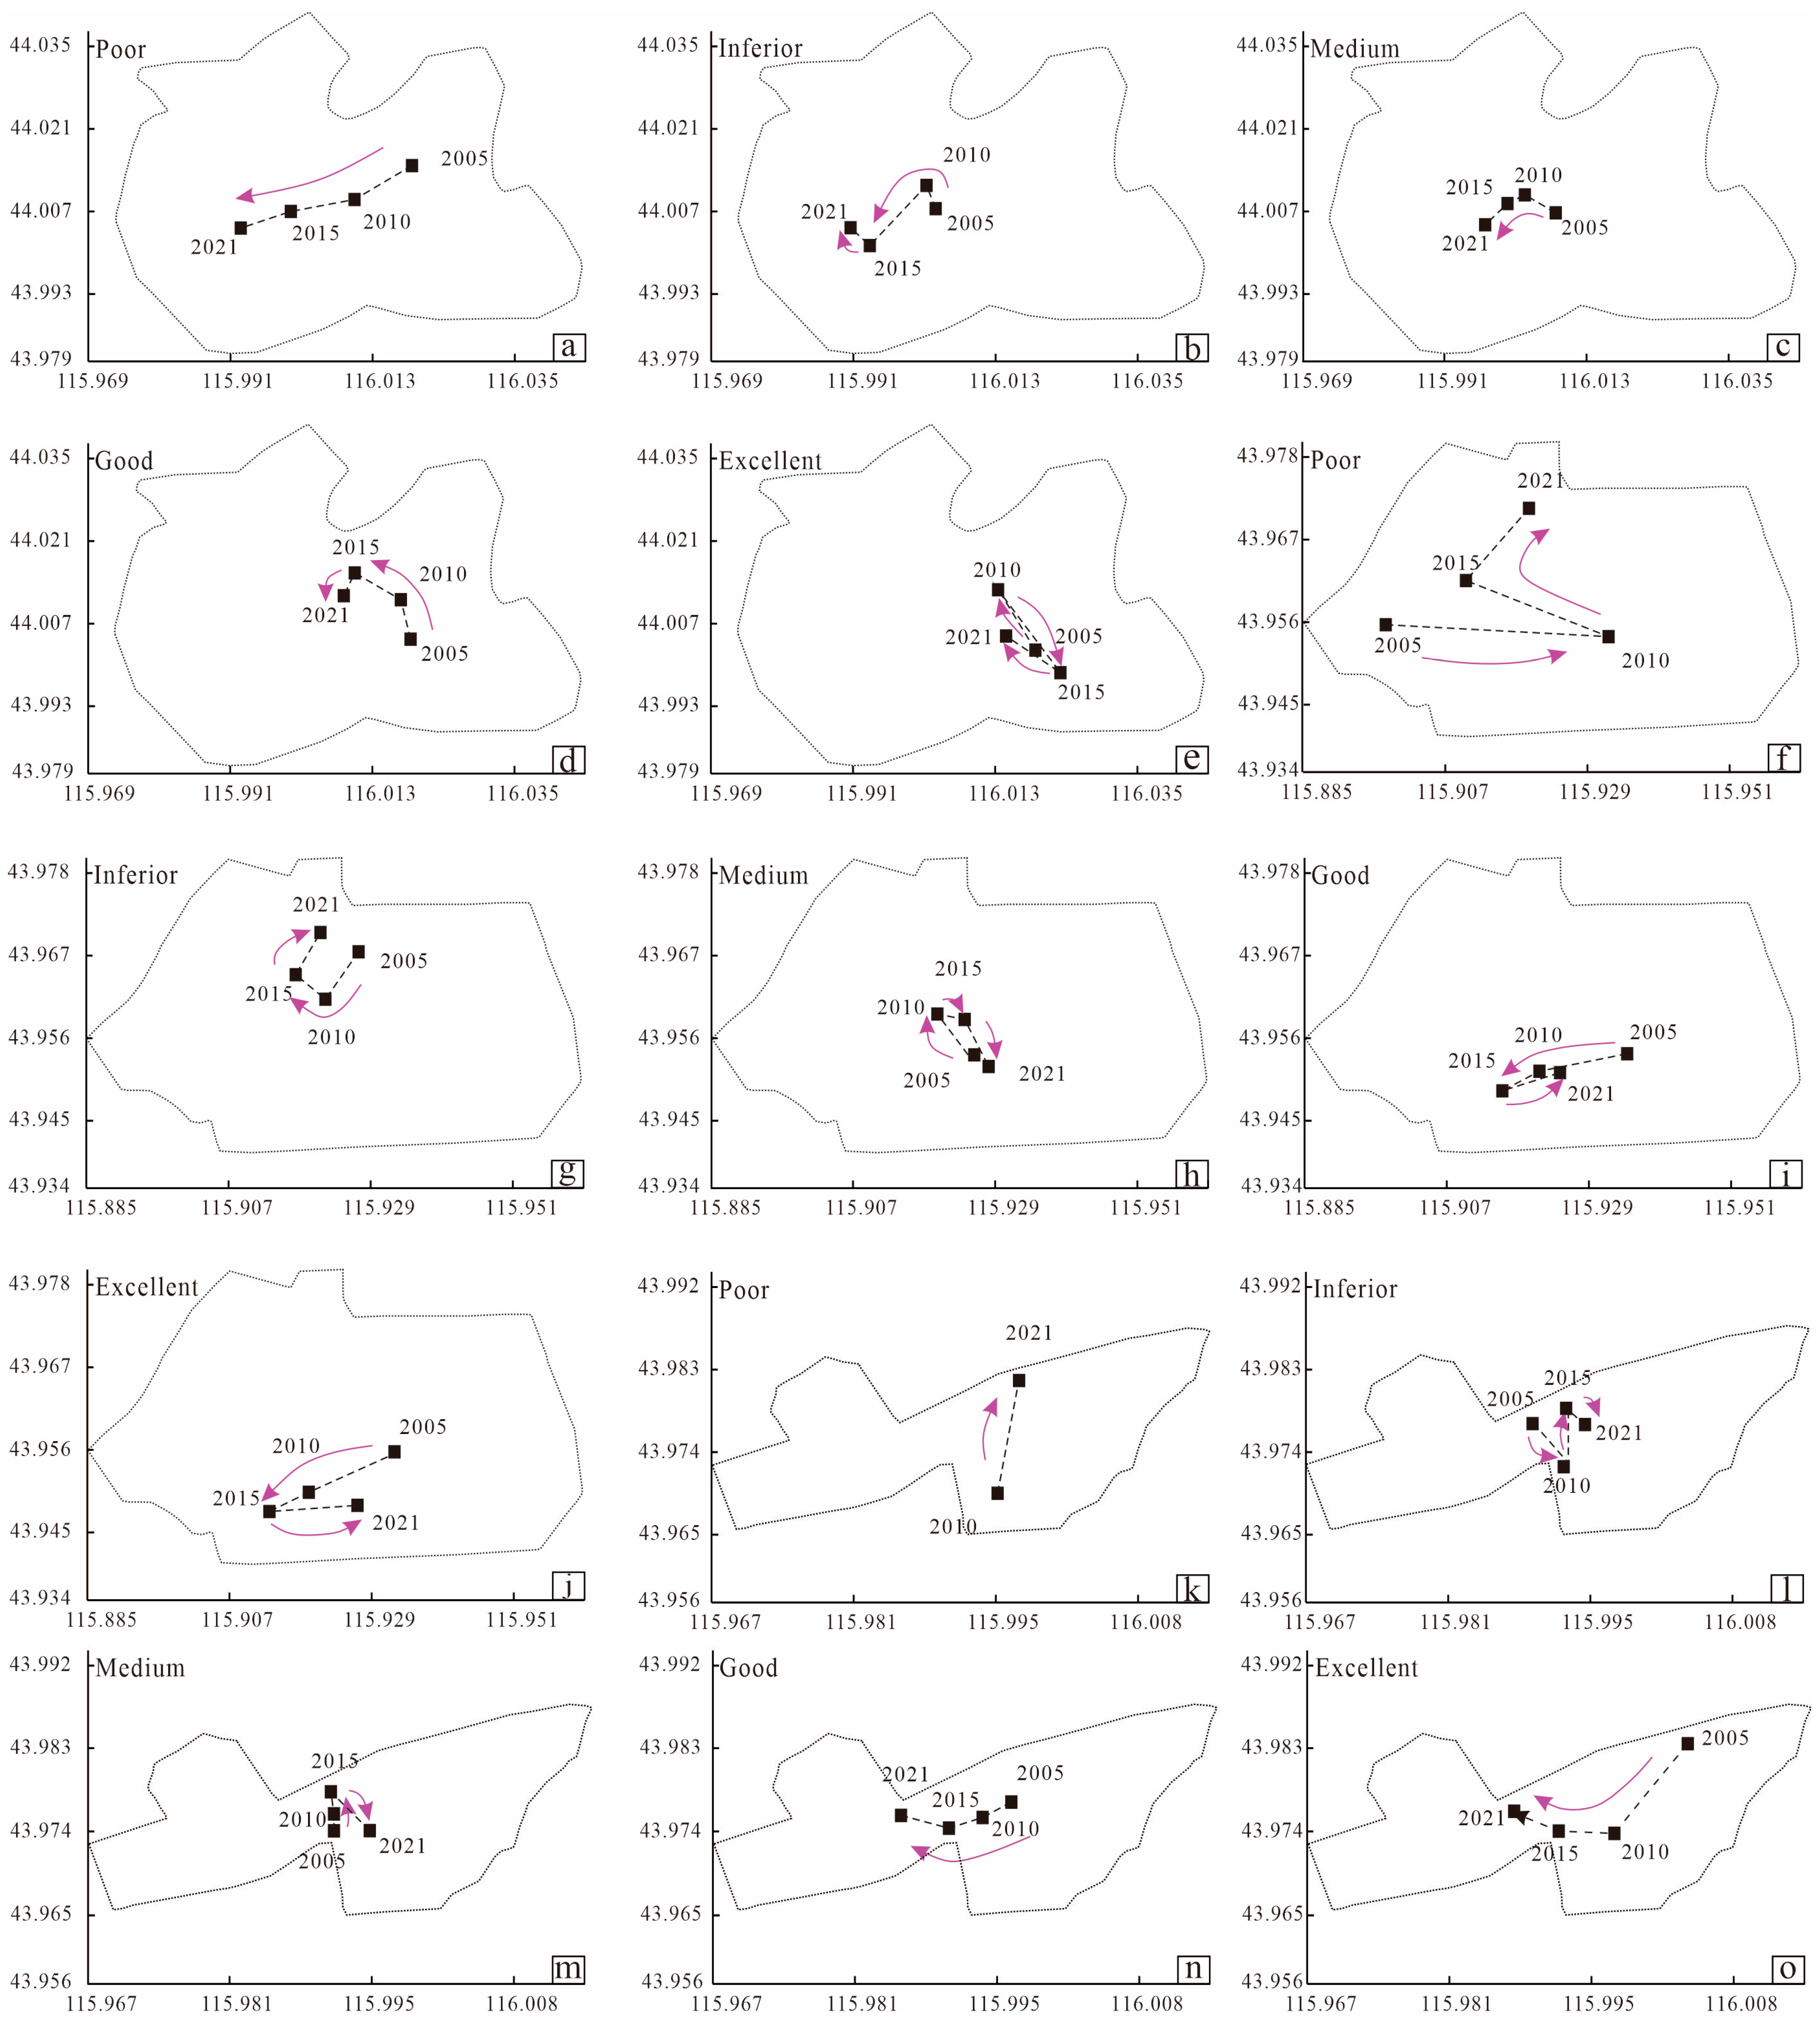
A gravity center displacement model of RSEI can provide a better understanding of the redistribution trends that have occurred, and will continue to occur, in the study area, which is based on using the ArcGis 10.5 platform to map out the center of gravity coordinates for different periods and levels of ecological quality [39,40]. In order to better grasp the evolution of eco-environmental quality deterioration and improvement within each mining area in the study area and to discuss the causes of their evolution, the center of gravity shifts of different ecological quality levels from 2005 to 2021 in each mining area were plotted, as shown in Figure 12. Among them, in the Shengli No. 1 mining area, the center of gravity of the poor and inferior eco-environmental quality area migrated significantly, manifesting as a continuous movement to the southwest (Figure 12a,b), and its migration direction was consistent with the deterioration trend (Figure 7). The areas with medium eco-environmental quality had moved but were mostly concentrated in the central part of the mining area (Figure 12c). The centers of gravity of the area with good and excellent eco-environmental quality were mostly in the southeast and internal dump sites (Figure 12d,e). Combined with the ecological evolution of this area (Figure 7), we could conclude that the Shengli No. 1 mining area was the best area for ecological management. In the Shengli West No. 2 and Wulantuga mining areas, the centers of gravity of the poor eco-environmental quality areas migrated significantly to the northeast parts of the mining areas (Figure 12f), and the migration of inferior and medium eco-environmental quality areas was not obvious, mostly concentrated in the central and northeast parts of the mining areas (Figure 12g,h). The centers of gravity of the areas with good and excellent eco-environment quality migrated mainly around the dump sites in the southwest part of the mining areas (Figure 12i,j). In the Shengli West No. 3 mining area, the center of gravity of the poor eco-environmental quality area migrated from the south to the north parts of the mining area (Figure 12k). In addition, except for the center of gravity of the area with excellent eco-environmental quality, which showed an obvious migration from the east to the west parts of the dump site, the centers of gravity of areas with other ecological quality levels were concentrated in the central part of the mining area (Figure 12l–o). In summary, we could conclude that the evolution of eco-environmental quality within each mining area from 2005 to 2021 showed a large forward movement of good and poor eco-environmental quality areas, among which the areas with good eco-environmental quality mostly migrated from the mining district centers to the centers of the dump sites with good ecological management, and the areas with poor eco-environmental quality mostly migrated from the old mining district centers to the new mining district centers.
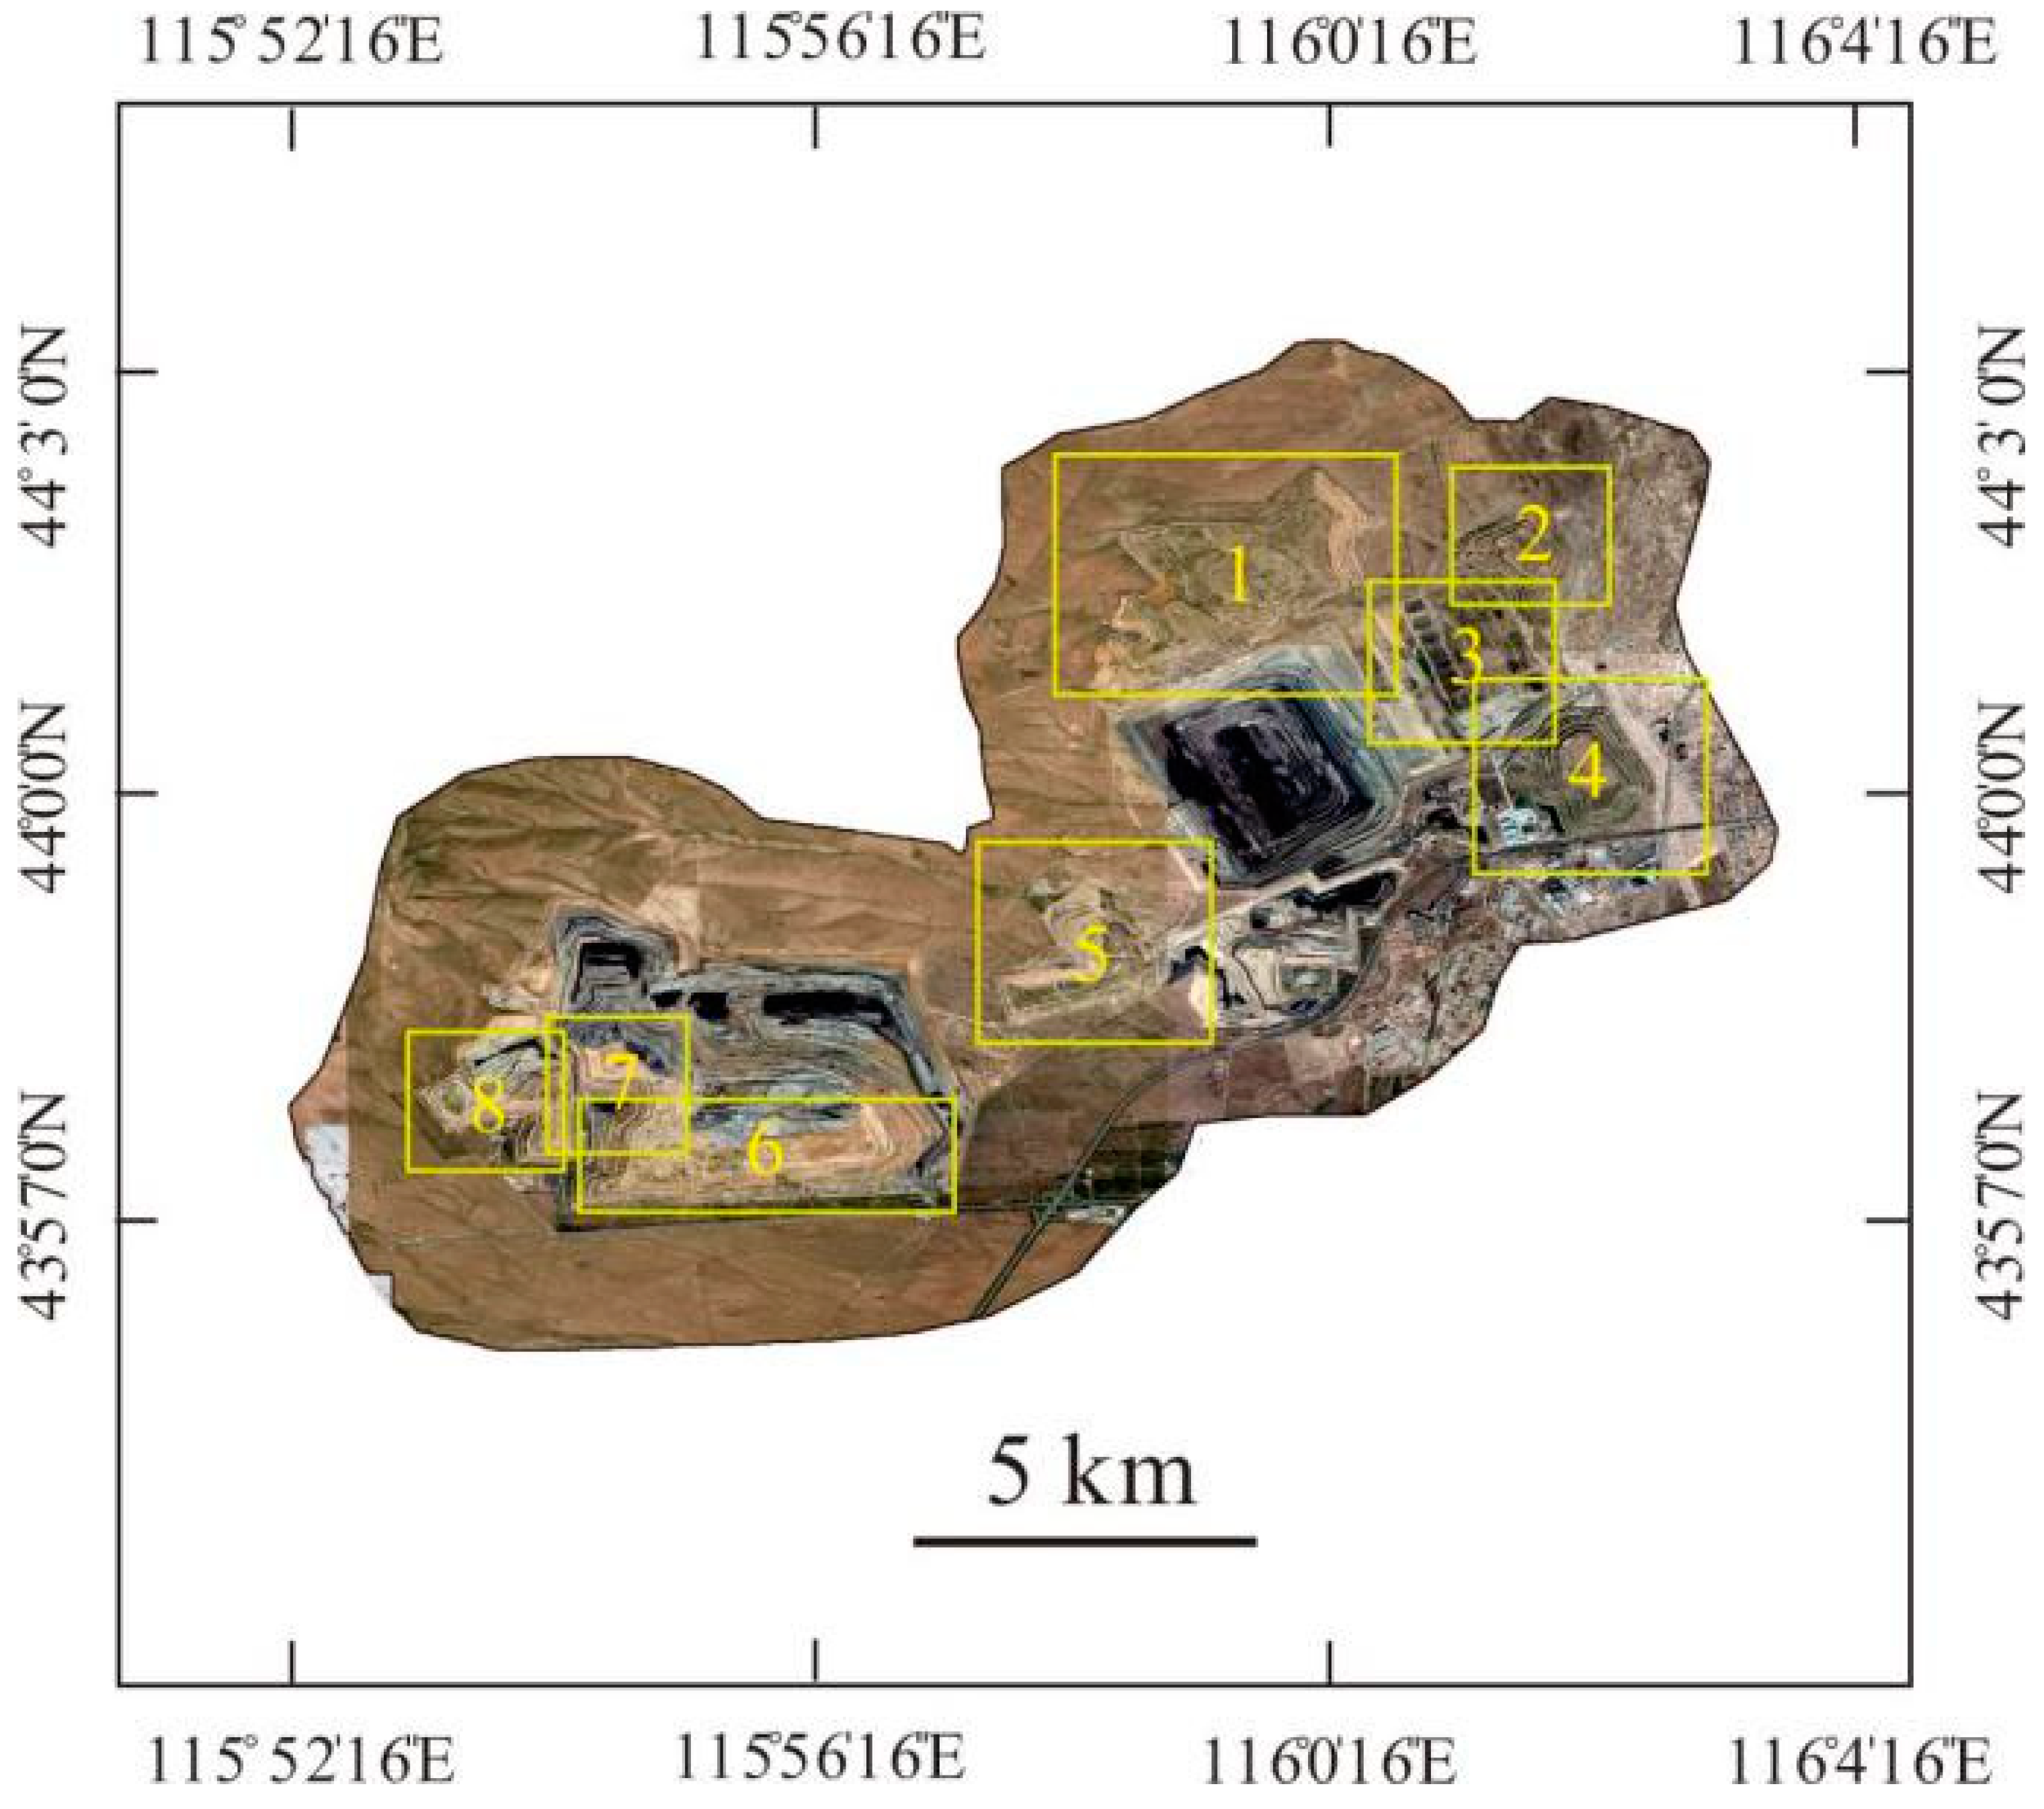
From the results of the analysis of the characteristics concerning the eco-environmental quality of the mining area in different periods, the main locations of the eco-environmental quality changes within the mining area were the dump sites and mining districts. To facilitate the discussion, the dump sites within the mining area were numbered in Figure 13, and the eco-environmental quality status was combined with the land reclamation of the study area over the past 17 years. Among them, dump site No. 1 was used in 2006 and abandoned in 2012, and the mining area was successfully greened in 2013, which was consistent with the evolution of the RSEI values over time (Figure 7b). Dump site No. 2 was used in 2005 and abandoned in 2007, and the mining area was successfully greened in 2008, with the timing of land reclamation coinciding with changes in the RSEI values of the area (Figure 6b and Figure 7a). Similarly, a comparison of the land reclamation of the other dump sites with the RSEI values of the study area indicated that the time of land reclamation was consistent with the corresponding time period of RSEI value improvement (Figure 6 and Figure 7). A comparison of the current vegetation cover of each dump site in 2021 showed that the vegetation coverage of dump sites No. 1 and No. 2 was approximately 36%, that of dump sites No. 3, No. 4, and No. 5 was less than 50%, and that of dump sites No. 6, No. 7, and No. 8 was between 55% and 60%. By combining these findings with the RSEI distribution of each dump site in 2021 (Figure 6d), it could be concluded that there was no obvious relationship with the RSEI when the vegetation cover reached a certain range. The areas with poor eco-environmental quality were concentrated in the mining districts, and the migration direction coincided with the direction of ecological quality deterioration. In general, it could be concluded that for the interior of the mining area, production, construction, and land reclamation activities had a decisive role in the eco-environmental quality of the area for a short period of time, and when the eco-environment quality of the mining area had been restored, improving the vegetation cover should not be used simply as a measure to judge the ecological restoration status. In addition, Bi et al. [41] concluded that improving the ecological resilience of mining areas was a key factor affecting the eco-environmental quality. Zhang et al. [42] concluded that improving ecological resilience had a great impact on the vegetation cover of opencast coal mines. Therefore, improving ecological environment quality within mining areas should start by adjusting mining activity, optimizing reclamation methods, and improving ecological resilience.

4.2. Analysis of Eco-Environmental Quality Spatial Evolution of the Driving Factors around the Mining Area

The spatial contribution characteristics of the driving factors around the mining area indicated the presence of strong spatial heterogeneity. Among the four driving factors, mining activity had the greatest impact on the RSEI value. Previous studies have proposed that mining activity can have an impact on the regional vegetation cover [37,38], which can seriously degrade the regional water table, causing soil desertification and thus deterioration of the vegetation environment. The ecological characteristics of the study area showed that the eco-environmental quality around the mining area was also relatively poor (Figure 6). The contribution of mining activity to the eco-environmental quality within 2 km of the mining area generally exceeded 30% on average, but the impact of human activities such as mining beyond 2 km on the ecological quality decreased significantly, reflecting that human activities not only affected the mining area but also had a certain impact on the surrounding area. In addition, as mentioned above, mining activity is closely related to coal production, and the statistics showed that the sum of coal production in each mining area fluctuated widely, but its average contribution value was relatively stable, indicating that mining activity had a certain cumulative effect on the eco-environmental quality in the study area. The sum of the contributions of precipitation and temperature was approximately 50%; the greenness, humidity, dryness, and heat indicators that determine the RSEI values are also closely related to temperature and precipitation, and the conclusion was consistent with previous studies showing that vegetation cover was closely related to regional precipitation and temperature [43,44,45,46]. The contribution of the topography factor to the eco-environmental quality around the mining area was approximately 15% on average, indicating that a certain correlation was also observed between altitude and eco-environmental quality. In addition, Li et al. [47] proposed that urban construction around mining areas is the main factor leading to regional ecological degradation. However, the RSEI values in the transition area between the mining area and the city steadily increased after 2010, which indicated that the impact of urban construction on the eco-environmental quality was relatively complex.

4.3. The Limitations of the RSEI Model in Eco-Environmental Quality Evaluation

The RSEI model is mostly used in research on eco-environmental management in large-scale areas, and it can integrate diverse ecological factors to derive spatiotemporal changes in regional eco-environmental quality in a short time by using the advantages of macroscopic and long time-series monitoring by remote sensing technology [47]. In recent years, ecological evaluation based on the RSEI model has also been widely used in small-scale areas, such as mining areas [10,11,12,47]. The evolution characteristics of a long-term series of RSEI values can provide a decision-making basis for ecological management in mining areas and help to determine areas with poor eco-environmental quality in order to immediately adjust management plans. However, the RSEI model, which is only calculated using NDVI, Wet, NDSI, and LST factors, ignores the complexity of eco-environmental quality especially in small-scale areas such as mining areas, for which a more accurate evaluation is needed. Therefore, results that only depend on RSEI do not represent the real ecological situation of the mining area. In addition, the application scale of the RSEI model may need to be further verified. Xia Nan [12] proposed that evaluation results using the RSEI model vary greatly due to regional changes and are not suitable for ecological evaluation in arid areas. This paper showed that the general influence of mining activity on the RSEI values around the mining area was greater than that of natural factors, and the changes in RSEI values, mining activity, and land reclamation within the mining area were consistent. Therefore, for regional ecological evaluation, especially for small-scale ecological evaluation, the RSEI model should be combined with ground survey data and other ecological evaluation factors to more effectively and truly reflect the small-scale regional ecological situation.

5. Conclusions

Based on the GEE platform, we obtained the spatiotemporal characteristics of the eco-environmental quality in the southwest part of the Shengli coalfield and its surrounding 2 km area from 2005 to 2021 using the RSEI model. The GWDF-ANN model was used to analyze the ecological impact of mining activity, temperature, precipitation, and topography around the mining area. The actual situation of the mining activity combined with changes in eco-environmental quality within the mining area was analyzed. Finally, the conclusions are as follows:
  • From 2005 to 2021, the deteriorated areas of eco-environmental quality moved with changes in the mining districts, while the areas with improved eco-environmental quality were concentrated in the areas of reclaimed dump sites and the transition area between the mining area and the city.
  • The GWANN model can be applied to eco-environmental quality evaluation research work using RSEI values at the mining-area scale, and the model fit well with a mean value of 0.08 for RMSE.
  • For the ecological quality assessment of a small-scale area such as a mining area, the influence of human activities on the eco-environmental quality change is absolute and higher than that of factors such as precipitation, temperature, and topography, even within a certain range outside the mining area.
  • The use of the RSEI model for small-scale ecological environment quality evaluation needs to be combined with more ecological index factors to truly reflect the real ecological condition of small-scale areas.

Author Contributions

M.C.: Conceptualization, methodology, writing–review & editing. S.M.: Methodology, writing—review & editing. Z.Z.: Investigation, software. R.W.: Investigation, validation. C.Y.: Investigation, formal analysis. Y.Z. (Yuxia Zhao): Investigation, visualization. Y.Z. (Yi Zhou): Data curation, writing—original draft, supervision. All authors have read and agreed to the published version of the manuscript.

Funding

This research was funded by Research on Monitoring Technology and Evaluation System of Coal Mine Ecological Environment (grant No. SHGF-18-72).

Institutional Review Board Statement

Not applicable.

Informed Consent Statement

Not applicable.

Data Availability Statement

Not applicable.

Conflicts of Interest

The authors declare no conflict of interest.

References

  1. Bian, Z.F.; Lu, Q.Q. Ecological effects analysis of land use change in coal mining area based on ecosystem service valuing: A case study in Jiawang. Environ. Earth Sci. 2013, 68, 1619–1630. [Google Scholar] [CrossRef]
  2. Yang, Y.; Erskine, P.D.; Lechner, A.M.; Mulligan, D.; Zhang, S.; Wang, Z. Detecting the dynamics of vegetation disturbance and recovery in surface mining area via Landsat imagery and LandTrendr algorithm. J. Clean. Prod. 2018, 178, 353–362. [Google Scholar] [CrossRef]
  3. Wei, L.; Yuan, Z.; Wang, Z.; Zhao, L.; Zhang, Y.; Lu, X.; Cao, L. Hyperspectral Inversion of Soil Organic Matter Content Based on a Combined Spectral Index Model. Sensors 2020, 20, 2777. [Google Scholar] [CrossRef]
  4. Tao, W.; Jin, Z. Remote Sensing Image Characteristics and Typical Area Analysis of Taiyuan Xishan Ecological Restoration Area. Sensors 2023, 23, 2108. [Google Scholar] [CrossRef]
  5. Zhao, H. Development trend, problems and related suggestions of surface mines in the new era. Coal Econ. Res. 2019, 39, 20–24. [Google Scholar]
  6. Zhang, Y.L. Open Cast Mine Monitoring and Ecological Effect Assessment through Remote Sensing—A Case Study from Pingshuo. Ph.D. Thesis, China University of Geosciences, Beijing, China, May 2014. [Google Scholar]
  7. Hou, H.P. Monitoring and Evaluation of Net Primary Productivity Change in Coal Mine Based on Remote Sensing. Ph.D. Thesis, China University of Mining and Technology, Xuzhou, China, June 2010. [Google Scholar]
  8. Yang, Z.; Tian, J.; Li, W.; Su, W.; Guo, R.; Liu, W. Spatio-temporal pattern and evolution trend of ecological environment quality in the Yellow River Basin. Acta Ecol. Sin. 2021, 41, 7627–7636. [Google Scholar]
  9. Xu, H.Q. A remote sensing urban ecological index and its application. Acta Ecol. Sin. 2013, 33, 7853–7862. [Google Scholar]
  10. Tang, H.; Fang, J.W.; Xie, R.J.; Ji, X.L.; Li, D.Y.; Yuan, J. Impact of Land Cover Change on a Typical Mining Region and Its Ecological Environment Quality Evaluation Using Remote Sensing Based Ecological Index (RSEI). Sustainability 2022, 14, 12694. [Google Scholar] [CrossRef]
  11. Song, W.; Gu, H.; Song, W.; Li, P.; Cheng, S.; Zhang, Y.; Ai, Y. Environmental assessments in dense mining areas using remote sensing information over Qian’an and Qianxi regions China. Ecol. Indic. 2023, 146, 109814. [Google Scholar] [CrossRef]
  12. Xia, N. Study on Remote Sensing Monitoring of Eco-Environment and Assessment Model of Ecological Quality in Zhundong Mining Region. Ph.D. Thesis, Xinjiang University, Xinjiang, China, June 2018. [Google Scholar]
  13. Gino, V.L.S.; Negri, R.G.; Souza, F.N.; Silva, E.A.; Bressane, A.; Mendes, T.S.G.; Casaca, W. Integrating Unsupervised Machine Intelligence and Anomaly Detection for Spatio-Temporal Dynamic Mapping Using Remote Sensing Image Series. Sustainability 2023, 15, 4725. [Google Scholar] [CrossRef]
  14. Shan, W.; Jin, X.; Ren, J.; Wang, Y.; Xu, Z.; Fan, Y.; Gu, Z.; Hong, C.; Lin, J.; Zhou, Y. Ecological environment quality assessment based on remote sensing data for land consolidation. J. Clean. Prod. 2019, 239, 118126. [Google Scholar] [CrossRef]
  15. Liu, P.; Ren, C.; Wang, Z.; Zhang, B.; Chen, L. Assessment of the eco-environmental quality in the Nanweng River Nature Reserve, Northeast China by remote sensing. Chin. J. Appl. Ecol. 2018, 29, 3347–3356. [Google Scholar]
  16. Nelson, A.; Oberthür, T.; Cook, S. Multi-scale correlations between topography and vegetation in a hillside catchment of Honduras. Int. J. Geogr. Inf. Sci. 2007, 21, 145–174. [Google Scholar] [CrossRef]
  17. Li, J.; Qin, T.; Zhang, C.; Zheng, H.; Guo, J.; Xie, H.; Zhang, C.; Zhang, Y. A New Method for Quantitative Analysis of Driving Factors for Vegetation Coverage Change in Mining Areas: GWDF-ANN. Remote Sens. 2022, 14, 1579. [Google Scholar] [CrossRef]
  18. Li, N.; Wang, J.Y. Comprehensive Eco-Environment Quality Index Model with Spatiotemporal Characteristics. Sensors 2022, 22, 9635. [Google Scholar] [CrossRef]
  19. Crist, E.P. A TM tasseled cap equivalent transformation for reflectance factor data. Remote Sens. Environ. 1985, 17, 301–306. [Google Scholar] [CrossRef]
  20. Baig, M.H.A.; Zhang, L.F.; Tong, S.; Tong, Q.X. Derivation of a tasselled cap transformation based on Landsat 8 at-satellite reflectance. Remote Sens. Lett. 2014, 5, 423–431. [Google Scholar] [CrossRef]
  21. Wang, J.; Li, G.X.; Chen, F.Y. Eco-Environmental Effect Evaluation of Tamarix chinesis Forest on Coastal Saline-Alkali Land Based on RSEI Model. Sensors 2022, 22, 5052. [Google Scholar] [CrossRef]
  22. Chander, G.; Markham, B.L.; Helder, D.L. Summary of current radiometric calibration coefficients for Landsat MSS, TM, ETM+, and EO-1 ALI sensors. Remote Sens. Environ. 2009, 113, 893–903. [Google Scholar] [CrossRef]
  23. Nichol, J. Remote sensing of urban heat islands by day and night. Photogramm. Eng. Remote Sens. 2005, 71, 613–621. [Google Scholar] [CrossRef]
  24. Rikimaru, A.; Roy, P.S.; Miyatake, S. Tropical forest cover density mapping. Trop. Ecol. 2002, 43, 39–47. [Google Scholar]
  25. Haykin, S. Neural Networks: A Comprehensive Foundation; Prentice Hall: Upper Saddle River, NJ, USA, 2008. [Google Scholar]
  26. Maind, S.B.; Wankar, P. Research paper on basic of artificial neural network. Int. J. Innov. Technol. Manag. 2014, 2, 96–100. [Google Scholar]
  27. Hagenauer, J.; Helbich, M. A geographically weighted artificial neural network. Int. J. Geogr. Inf. Sci. 2021, 36, 215–235. [Google Scholar] [CrossRef]
  28. Tasyurek, M.; Celik, M. 4D-GWR: Geographically, altitudinal, and temporally weighted regression. Neural. Comput. Appl. 2022, 34, 14777–14791. [Google Scholar] [CrossRef]
  29. Wang, Z.Y. The Method of Global Spatial-Temporal Complex Proximity Neural Network Weighted Regression. Ph.D. Thesis, Zhejiang University, Zhejiang, China, June 2020. [Google Scholar]
  30. Wu, S.S. The Theory and Method of Geographically and Temporally Neural Network Weighted Regression. Ph.D. Thesis, Zhejiang University, Zhejiang, China, June 2018. [Google Scholar]
  31. Sutskever, I.; Martens, J.; Dahl, G.; Hinton, G. On the importance of initialization and momentum in deep learning. In Proceedings of the International Conference on Machine Learning, Atlanta, GA, USA, 16 June 2013; pp. 1139–1147. [Google Scholar]
  32. Nesterov, Y.A. Method of Solving a Convex Programming Problem with Convergence Rate. Dokl. Chem. 1983, 27, 372–376. [Google Scholar]
  33. Liu, Y.L.; Guo, L.; Jiang, Q.H.; Zhang, H.T.; Chen, Y.Y. Comparing geospatial techniques to predict SOC stocks. Soil Tillage Res. 2015, 148, 46–58. [Google Scholar] [CrossRef]
  34. Arora, A.; Pandey, M.; Mishra, V.; Kumar, R.; Rai, P.; Costache, R.; Punia, M.; Di, L. Comparative evaluation of geospatial scenario-based land change simulation models using landscape metrics. Ecol. Indic. 2021, 128, 107810. [Google Scholar] [CrossRef]
  35. Chen, N.; Cheng, G.; Yang, J.; Ding, H.; He, S. Evaluation of Urban Ecological Environment Quality Based on Improved RSEI and Driving Factors Analysis. Sustainability 2023, 15, 8464. [Google Scholar] [CrossRef]
  36. Huang, J.; Chen, Y.; Liang, Y.; Yang, J.; Yang, M. Analysis of Spatial-Temporal Variation and Driving Factors of Ecological Quality in Typical Mining Areas of Daye City. Industrial Minerals & Processing. Available online: https://kns.cnki.net/kcms/detail/detail.aspx?FileName=HGKJ20220914000&DbName=CAPJ2022 (accessed on 17 June 2022).
  37. Fang, A.; Bao, M.; Chen, W.; Dong, J. Assessment of Surface Ecological Quality of Grassland Mining Area and Identification of Its Impact Range. Nat. Resour. Res. 2021, 30, 3819–3837. [Google Scholar] [CrossRef]
  38. Hui, J.; Bai, Z.; Ye, B.; Wang, Z. Remote Sensing Monitoring and Evaluation of Vegetation Restoration in Grassland Mining Areas—A Case Study of the Shengli Mining Area in Xilinhot City, China. Land 2021, 10, 743. [Google Scholar] [CrossRef]
  39. Li, R.; Chen, G.; Li, W.; Meng, R.; Wang, M.; Guo, Y. Spatiotemporal Analusis of Eco-environmental Benefits in Shenfu-Dongshen Mining Area during 1995–2020 Based on RSEI. Bull. Soil Conserv. 2021, 6, 143–151. [Google Scholar]
  40. Ariken, M.; Zhang, F.; Liu, K.; Fang, C.; Kung, H. Coupling coordination analysis of urbanization and eco-environment in Yanqi Basin based on multi-source remote sensing data. Ecol. Indic. 2020, 114, 106331. [Google Scholar] [CrossRef]
  41. Bi, W.; Qian, Z.; Wang, H.; Jiang, N.; Huang, W.; Hua, F. Study on the impact of coal mining subsidence ponding on ecological environment based on RSEI. China Min. Mag. 2021, 30, 38–44. [Google Scholar]
  42. Zhang, S.; Ning, H.; Xu, D.; Ye, H.; Zheng, Y.; Zhang, H.; Huang, Y. Analysis of spatio-temporal evolution and driving factors of vegetation fraction for opencast coal mine in grassland area. Trans. Chin. Soc. Agric. Eng. 2016, 32, 233–241. [Google Scholar]
  43. Chen, Z.F.; Wang, W.G.; Fu, J.Y. Vegetation response to precipitation anomalies under different climatic and biogeographical conditions in China. Sci. Rep. 2020, 10, 830. [Google Scholar] [CrossRef] [PubMed] [Green Version]
  44. Shen, X.; Liu, B.; Li, G.; Yu, P.; Zhou, D. Impacts of grassland types and vegetation cover changes on surface air temperature in the regions of temperate grassland of China. Theor. Appl. Climatol. 2016, 126, 141–150. [Google Scholar] [CrossRef]
  45. Liu, Y.; Shu, H.; Li, Y. Correlation Analysis of Spatio-temporal NDVI, Air Temperature, Precipitation, and Ground Temperature in the Bayinbuluk Grassland. In Proceedings of the IEEE International Geoscience and Remote Sensing Symposium (IGARSS), Denver, CO, USA, 1 July 2006; p. 3368. [Google Scholar]
  46. Zhang, Y.; Liang, W.; Liao, Z.; Han, Z.; Xu, X.; Jiao, R.; Liu, H. Effects of climate change on lake area and vegetation cover over the past 55 years in Northeast Inner Mongolia grassland, China. Theor. Appl. Climatol. 2019, 138, 13–25. [Google Scholar] [CrossRef]
  47. Li, J.; Hao, Y.; Sun, J.; Zhuo, Y.; Qin, J.; Yin, F. Evaluation of Ecological Environment’ Spatio-Temporal Variation In Urban Mine Based on RSEI. Urban Dev. Stud. 2021, 27, 17–22. [Google Scholar]
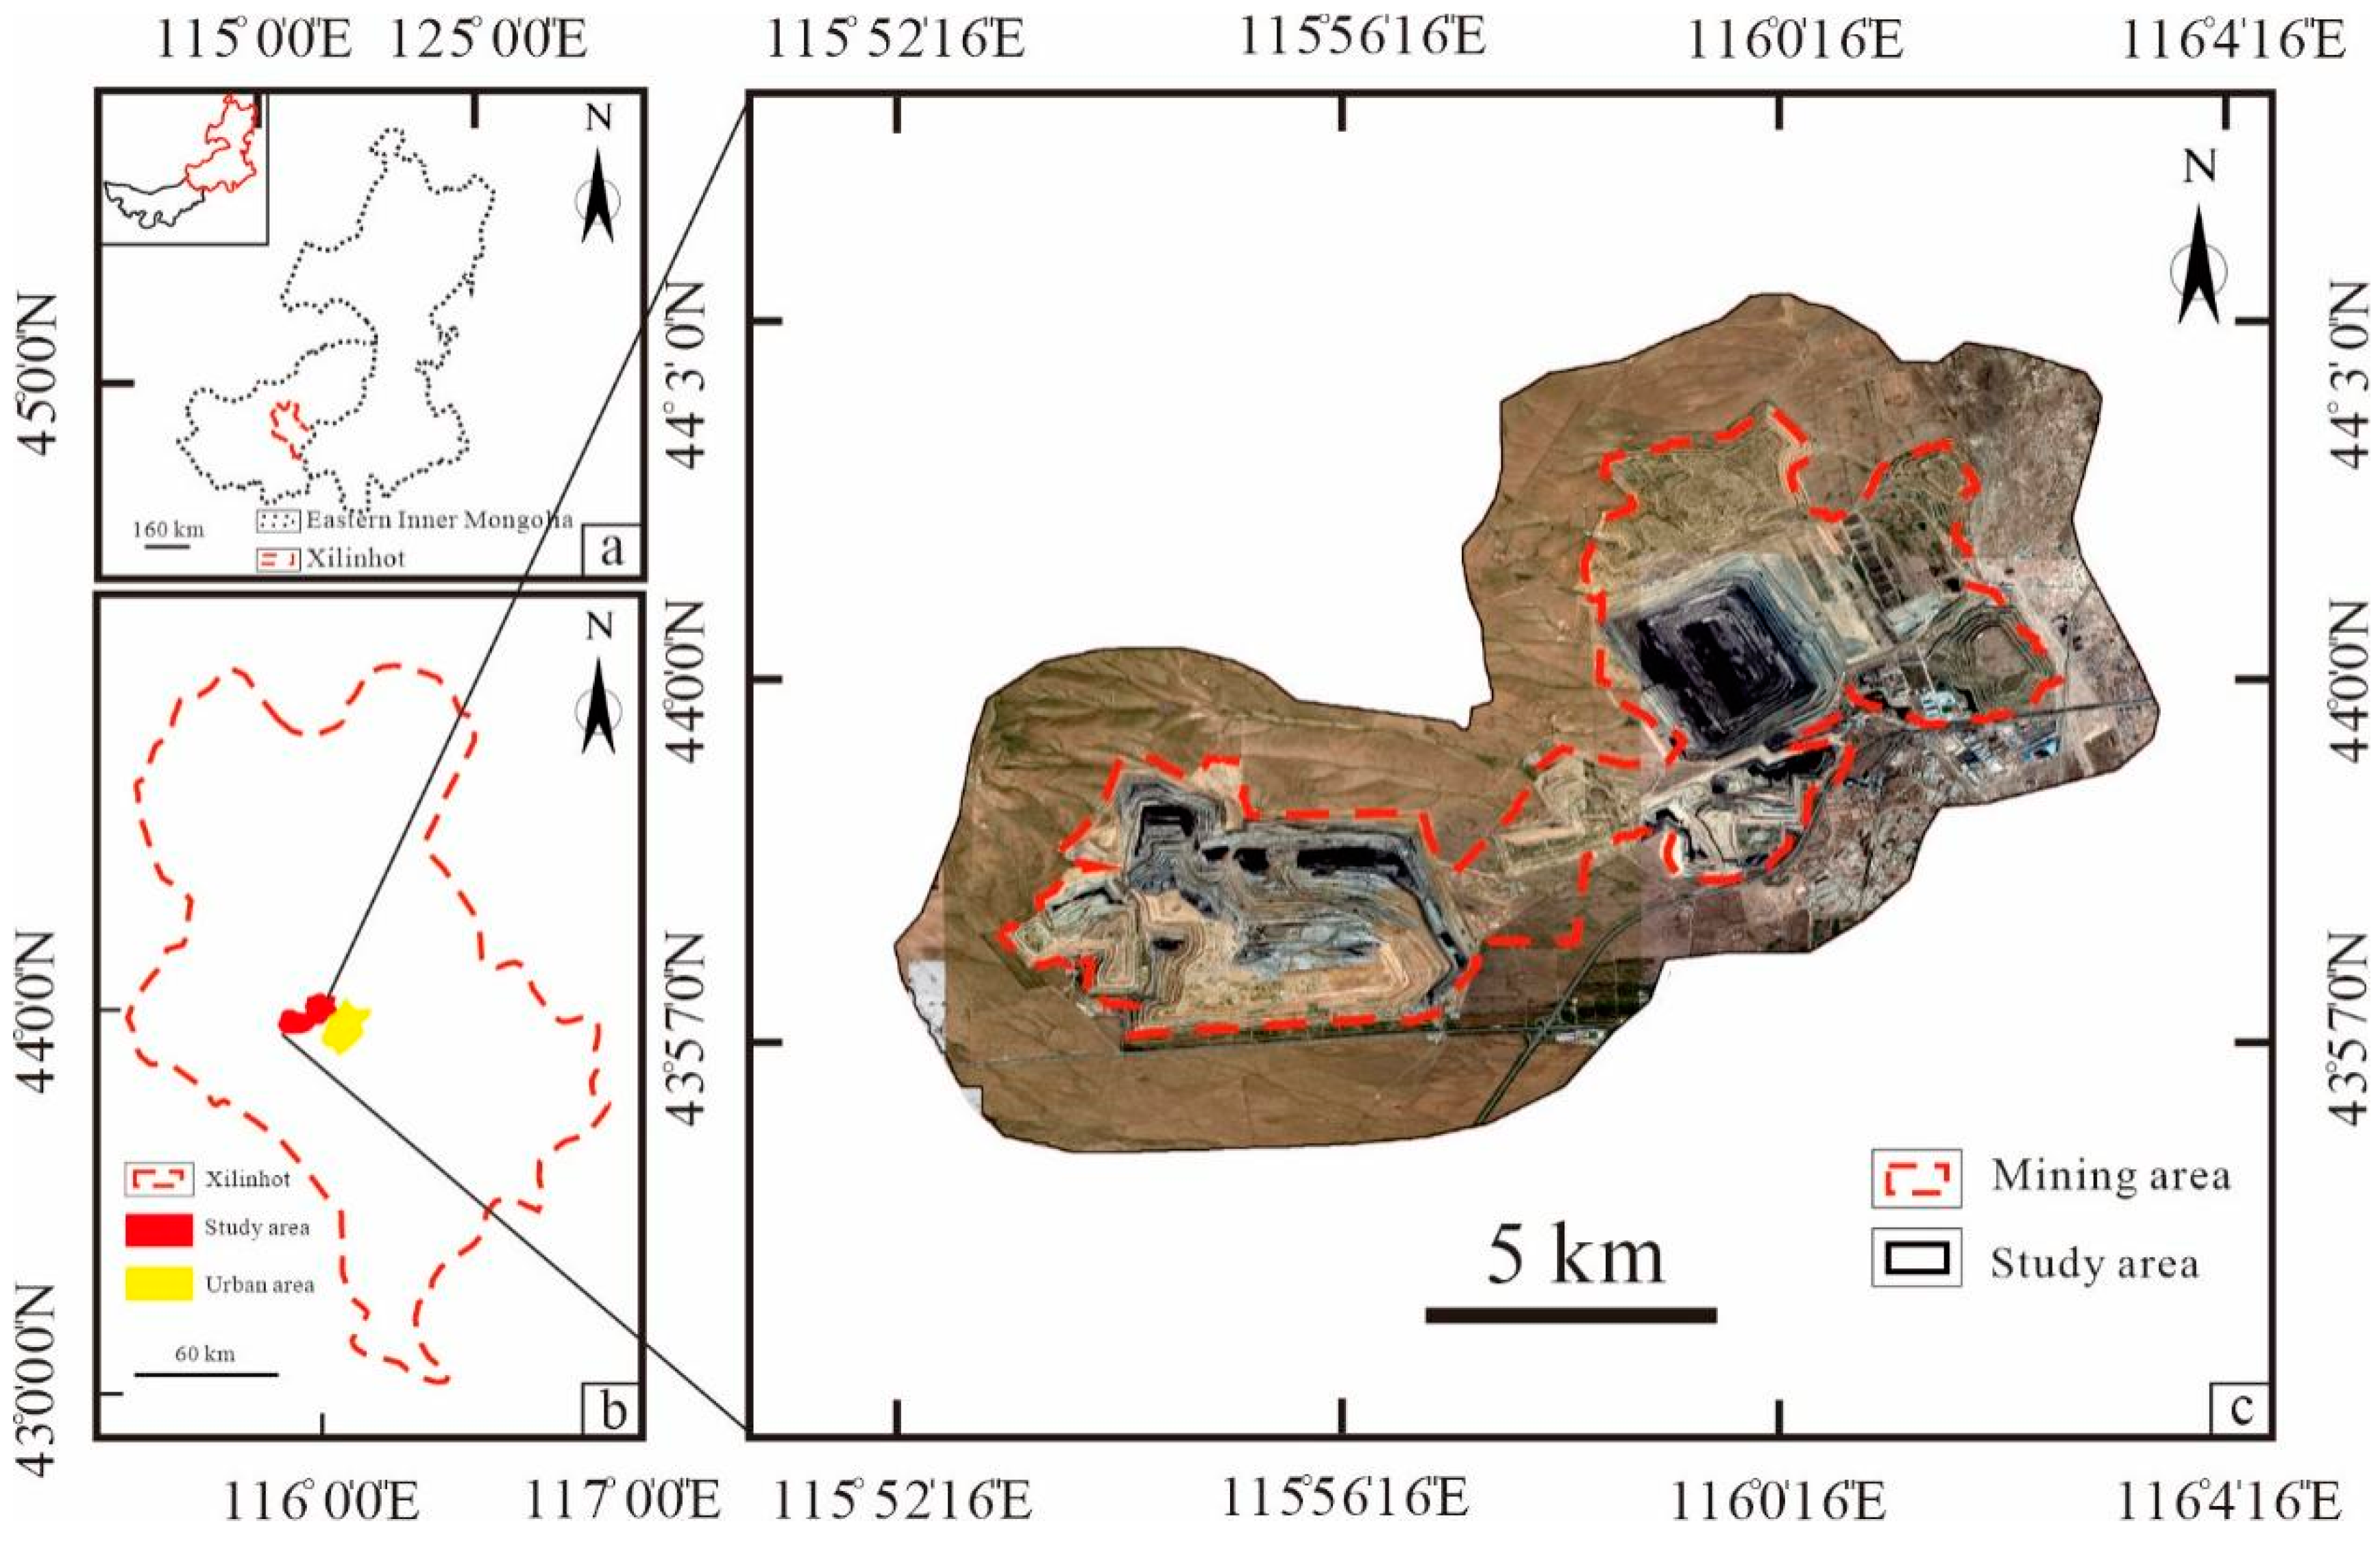
Figure 1. The geographical location of the steppe region in Xilinhot, eastern Inner Mongolia, China: (a) geographical location of Xilinhot; (b) boundaries of the mining and urban areas in Xinlinhot; (c) remote sensing image map of study area in 2021.
Sustainability 15 10656 g001
Figure 2. Images of dump and mining sites of Shengli coalfield in different periods: (a) vegetation status of the slope of the dump site in the Wulantuga mining area in 2005; (b) vegetation status of the slope of the dump site in the Shengli No. 1 mining area in 2011; (c) image of the stope in the Shengli West No. 2. mining area in 2010; (d) situation of slope greening of the dump site in the Wulantuga mining area in 2021; (e) situation of slope greening of the dump site in the Shengli No. 1 mining area in 2021; (f) present situation of slope greening of the dump site in the Shengli West No. 2 mining area.
Sustainability 15 10656 g002
Figure 3. Flow chart of RSEI calculation.
Sustainability 15 10656 g003
Figure 4. (a) ANN with three layers; (b) GWANN with three layers.
Sustainability 15 10656 g004
Figure 5. Changes in the average ecological indexes and RSEI in the mining area from 2005 to 2021.
Sustainability 15 10656 g005
Figure 6. Distribution of RSEI grades in different periods in the mining area: (a) 2005; (b) 2010; (c) 2015; (d) 2021.
Sustainability 15 10656 g006
Figure 7. Characteristic map of eco-environmental quality evolution in different periods in the mining area: (a) from 2005 to 2010; (b) from 2010 to 2015; (c) from 2015 to 2021.
Sustainability 15 10656 g007
Figure 8. (a) The correlation diagram between RSEI and RSEI^; (b) the average change diagram of RSEI and RSEI^ for the training sample point.
Sustainability 15 10656 g008
Figure 9. Spatial distribution chart of the influence of mining activity, temperature, precipitation, and topography factors on the eco-environmental quality of the mining area in 2021: (a) mining activity; (b) temperature; (c) precipitation; (d) topography.
Sustainability 15 10656 g009
Figure 10. The average contribution of driving factors in different directions.
Sustainability 15 10656 g010
Figure 11. The contribution of four driving factors in each direction at different distances from the boundary of the mining area: (a) in direction A; (b) in direction B; (c) in direction C; (d) in direction D; (e) in direction E; (f) in direction F; (g) in direction G.
Sustainability 15 10656 g011
Figure 12. Migration paths of centers of gravity of areas with different levels of RSEI in different stages of the mining area: (ae) migration of the centers of gravity of areas with different levels of eco-environmental quality in the Shengli No. 1 mining area; (fj) migration of the centers of gravity of areas with different levels of eco-environmental quality in the Shengli West No. 2 and Wulantuga mining areas; (ko) migration of the centers of gravity of areas with different levels of eco-environmental quality in the Shengli West No. 3 mining area; The purple curve lines with arrow in the end represent the evolution trend of different years.
Sustainability 15 10656 g012
Figure 13. Image of the mining area in 2021.
Sustainability 15 10656 g013
Table 1. Proportions of areas with different grades of RSEI in the mining area.
RSEI Grade2005201020152021
Poor1.50%3.71%0.30%1.46%
Inferior24.96%17.89%31.95%26.59%
Medium52.58%61.63%44.16%48.02%
Good17.07%13.05%17.77%18.15%
Excellent3.89%3.72%5.82%5.78%
Table 2. The average contribution rate of various factors in the study area from 2005 to 2021.
Driving FactorAnnual Average Contribution (%)
2005201020152021
Mining activity34.6134.7234.5034.09
Temperature22.0321.9722.0622.16
Precipitation27.4927.4227.7127.73
Topography15.8715.8915.7316.02
Disclaimer/Publisher’s Note: The statements, opinions and data contained in all publications are solely those of the individual author(s) and contributor(s) and not of MDPI and/or the editor(s). MDPI and/or the editor(s) disclaim responsibility for any injury to people or property resulting from any ideas, methods, instructions or products referred to in the content.