Article

Explaining Global Trends in Cattle Population Changes between 1961 and 2020 Directly Affecting Methane Emissions

by
Katarzyna Kozicka
1,
Jan Žukovskis
2 and
Elżbieta Wójcik-Gront
1,*
1
Department of Biometry, Institute of Agriculture, Warsaw University of Life Sciences–SGGW, Nowoursynowska 159, 02-776 Warsaw, Poland
2
Department of Business and Rural Development Management, Vytautas Magnus University, 53361 Kaunas, Lithuania
*
Author to whom correspondence should be addressed.
Sustainability 2023, 15(13), 10533; https://doi.org/10.3390/su151310533
Submission received: 8 May 2023 / Revised: 30 June 2023 / Accepted: 3 July 2023 / Published: 4 July 2023

Abstract

:
Methane (CH4) emissions from agricultural sources contribute significantly to the total anthropogenic greenhouse gas emissions, which cause climate change. According to the guidelines of the International Panel on Climate Change (IPCC) for calculating greenhouse gas emissions, agriculture is responsible for approximately 10% of total CH4 emissions from anthropogenic sources. CH4 is primarily emitted from livestock farming, particularly from cattle production during enteric fermentation and from manure. This article describes the results of multivariate statistical analyses carried out on data collected from 1961 to 2020 for thirty countries with the largest cattle populations. The study evaluated the trends in temporal changes in cattle populations and identified groups of countries with similar patterns during the study period. The global cattle population was highly correlated with CH4 emissions from the enteric fermentation of cattle and their manure. The countries experiencing the largest increase in cattle population were primarily developing countries located in South America, Africa and Southeastern Asia. The cattle population in these countries showed a strong correlation with the human population. On the other hand, the countries where the cattle population remained stable during the study period were mainly highly developed countries. The correlations between most of the examined variables associated with cattle production and the cattle population in these countries were inconsistent and relatively weak. In the near future, further increase in the cattle population and the associated CH4 emissions are expected, mainly in developing countries with high population growth.

1. Introduction

One of the main greenhouse gases (GHGs) that contribute to global warming and climate change, alongside carbon dioxide and nitrous oxide, is methane (CH4) [1]. Despite being present in the atmosphere in smaller quantities than carbon dioxide, CH4 has a 100-year global warming potential 25 times greater than carbon dioxide due to its higher ability to absorb infrared radiation [2,3]. CH4 is released from various sources, including landfills, waste management, energy production from coal, oil, and natural gas mining and processing [4]. It is also associated with agricultural practices. The concentration of CH4 in the atmosphere has increased 2.5 times since pre-industrial times, primarily due to the intensive use of fossil fuels and the growth of ruminant farming, landfills, and rice fields, in line with the expansion of the human population [3,5]. Agricultural sector emissions account for approximately 25% of total global anthropogenic emissions, with direct emissions from agriculture estimated to constitute about 10–12% of total global GHG emissions in 2010 [6,7]. Additional indirect emissions result from deforestation, energy use, and the production of animal feed [8]. Livestock, particularly ruminants such as cattle, contribute the majority of direct agricultural emissions [9,10]. Therefore, reducing livestock emissions is crucial for achieving ambitious global mitigation targets [11,12].
The International Panel on Climate Change (IPCC) provides guidelines for estimating livestock emissions [2,13]. Animals are typically categorized by species because the type of digestive system significantly influences CH4 emissions. Ruminant species such as cattle are the main source of CH4 emissions due to their intensive food fermentation [14]. CH4 emissions from manure management are usually lower than those from enteric fermentation [15]. Under anaerobic conditions, manure decomposition leads to substantial CH4 production [2].
As estimated emissions are directly proportional to the cattle population (emission = emission factor × number of cattle) [14], the countries with the highest cattle population are the primary contributors to methane emissions from agricultural sources. The main regions for cattle production are South and North America, as well as Southeastern Asia. Cattle production varies in intensity and efficiency across different regions [16]. Developing countries often have lower productivity in terms of milk and beef, resulting in higher CH4 emissions per unit of milk or beef compared to developed countries. However, developing countries may have lower CH4 emissions per head of cattle due to less intensive production, including poorer nutrition. For example, the annual milk yield per cow in the US is approximately six times higher than in India or Pakistan [17]. GHG output (kg of CO2 equivalents per kg of milk) ranges from 1.3 for developed countries like the USA to 7.4 for central African countries. The same level of milk or beef production can be achieved with a lower cattle population and higher production efficiency or with a higher cattle population and lower production intensity. The growing world population necessitates increased food production, including milk and beef, which can be achieved by increasing the cattle population or improving efficiency. Despite the gradual shift towards plant-based diets, the global demand for milk and beef continues to rise. Therefore, it is crucial to maintain sustainable cattle production [18]. Milk and beef production are closely connected, with dairy-beef accounting for 45% of global beef production, depending on the region [9]. The specific conditions of cattle production in different regions lead to varying changes in the cattle population, influenced by production intensity and the demand for milk and beef. On-farm practices aimed at CH4 mitigation are more likely to focus on reducing emissions per unit of milk or meat rather than individual animal emissions [19]. Mitigation strategies that do not hinder production while effectively reducing CH4 emissions in cattle are necessary. In practice, sustainable cattle production should be economically viable, ensuring high efficiency and low emissions per unit of production [20]. Previous studies have demonstrated that increased livestock production contributes to higher CH4 emissions unless effective strategies to mitigate GHG emissions in livestock systems are implemented [21].
The primary objective of this study is to analyze worldwide trends in cattle populations. Methane emissions and cattle population trends are closely interconnected, as the size and management of cattle populations directly impact methane emissions from the livestock sector. An increasing cattle population generally leads to higher methane emissions. As more cattle are raised for meat and dairy production, the overall methane output from enteric fermentation and manure management tends to rise. Thus, the investigation goals are to identify countries that exhibit similar trends in cattle populations over the past 60 years (1961–2020) and examine the factors associated with these trends. It is expected that countries will fall into categories of growing, stable or declining cattle populations, influenced by various factors such as economic conditions, government policies, environmental concerns and shifts in consumer preferences. Furthermore, this research aims to identify specific variables related to cattle breeding that can effectively characterize the selected groups of countries. The study also includes a comprehensive analysis of CH4 emissions specifically attributed to livestock through enteric fermentation and manure management.

2. Materials and Methods

Data from The Food and Agriculture Organization Corporate Statistical Database (FAOSTAT) [22] spanning the period from 1961 to 2020 were utilized to examine shifts in the global cattle population. The analysis focused on 30 countries that had existed since 1961 and possessed a cattle population of at least 10 million heads. These 30 countries include: Argentina (ARG), Australia (AUS), Bangladesh (BGD), Bolivia (BOL), Brazil (BRA), Burkina Faso (BFA), Canada (CAN), Chad (TCD), China (CHN), Colombia (COL), France (FRA), Germany (DEU), India (IND), Indonesia (IDN), Kenya (KEN), Mali (MLI), Mexico (MEX), Myanmar (MMR), New Zealand (NZL), Niger (NER), Nigeria (NGA), Pakistan (PAK), Paraguay (PRY), South Africa (ZAF), Turkey (TUR), Uganda (UGA), United Republic of Tanzania (TZA), the United States of America (USA), Uruguay (URY), Venezuela (VEN) (Figure 1). The combined cattle population of these countries accounted for over 70% of the global cattle population in 2020 [22]. Therefore, the trends observed in these analyzed countries will significantly influence the overall trends in the global cattle population.
The data analyzed included the following variables related to the cattle population: size of the cattle population (CT), agricultural land (AL), farm machinery (FM), GDP per capita (GDP), land under permanent meadows and pastures (LMP), beef consumption per capita (MBC), total meat consumption per capita (MTC) including fish and seafood, milk consumption per capita (MC), milk yield per animal (MYA), rural population percent (RPP), total population (TP) and two ratios based on cattle population, cattle/agricultural land (CT/AL) and cattle/total population (CT/TP). The data also included CH4 emissions from cattle enteric fermentation and manure management (CH4).
To compare trends in the size of a country’s cattle population, an increment (I) was used instead of absolute numbers of animals. The increment is calculated using the formula:
I = y i + 1 y i y i
where i represents the decade number, starting from the first decade of the analysis (1961–1970) denoted by y i . The last decade is 2011–2020.
The data on CH4 emissions from enteric fermentation and manure management were obtained from the FAOSTAT database. The calculations were performed using the Tier 1 method, separately for dairy cattle and non-dairy cattle [2,22]. The Tier 1 method, as outlined in the 2006 IPCC guidelines, is a simplified approach for estimating CH4 emissions from enteric fermentation and manure management. It provides a basic methodology that can be applied at the country level, taking into account factors such as livestock population, feed intake, CH4 conversion rates and regional characteristics like climate region or temperature. The FAOSTAT database provides CH4 emission data from enteric fermentation and manure management by country, covering the period from 1961 to 2020. CH4 emissions from enteric fermentation are a significant component of the overall GHG emissions from the agricultural sector. The emissions factors (EFs) values for enteric fermentation depend on the livestock type (dairy cattle and non-dairy cattle) and regional grouping specified in IPCC guidelines, Table 10.11 [2]. The EF values for manure management assigned to each country depend on the region and the country average annual temperature. The EF values applied for cattle were taken from IPCC Table 10.14 [2]. The methane emission factors from enteric fermentation and manure management used are presented in Table 1.
Cattle production varies across regions of the world due to various factors such as climate, geography, cultural practices, and economic conditions. The IPCC methodology recognizes that different regions exhibit distinct characteristics in cattle production, which in turn influence the values of emission factors used. In Africa extensive grazing systems are common, with cattle often raised in open pasturelands. Many cattle breeds are adapted to withstand heat and tropical diseases. In Asia diverse cattle production systems exist, including intensive, semi-intensive and extensive systems. In Europe cattle production systems vary from intensive indoor systems to extensive grazing on pasturelands. Dairy farming is a significant focus, with specialized dairy breeds and high milk yields. In Latin America and Caribbean extensive grazing systems and large-scale ranching are common, especially in countries like Brazil and Argentina. In North America cattle production involves a mix of intensive feeding and extensive grazing systems. Dairy farming is also significant, particularly in the United States and Canada. In Oceania, cattle production revolves around extensive grazing systems on large pasturelands. Dairy farming is significant in countries like Australia and New Zealand.
The analysis of obtaining groups with homogeneous countries in terms of the cattle change trend was performed using cluster analysis. This approach facilitates the identification of essential features based on the population trend analysis of each group. Ward’s method, which is based on a variance approach, was applied in the cluster analysis as it is considered very effective [23]. The square of the Euclidean distance was used to calculate the multivariate distance between objects, giving more weight to objects that are farther apart. Correlation coefficients were used to evaluate the relationships between selected variables and the cattle population or the cattle population per agricultural land or per human population. Regression analysis was also performed to evaluate the temporal trends of the cattle population, as well as the cattle population per agricultural land or per human population. Additionally, principal component analysis (PCA) was employed to assess the multivariate differences between the studied countries and the relationships between variables included in the study. The results of PCA were presented graphically as a biplot. The analyses were conducted using Statistica 13 (Tibco Software Inc., Palo Alto, CA, USA). The significance level for all the tests was set at 0.05.

3. Results

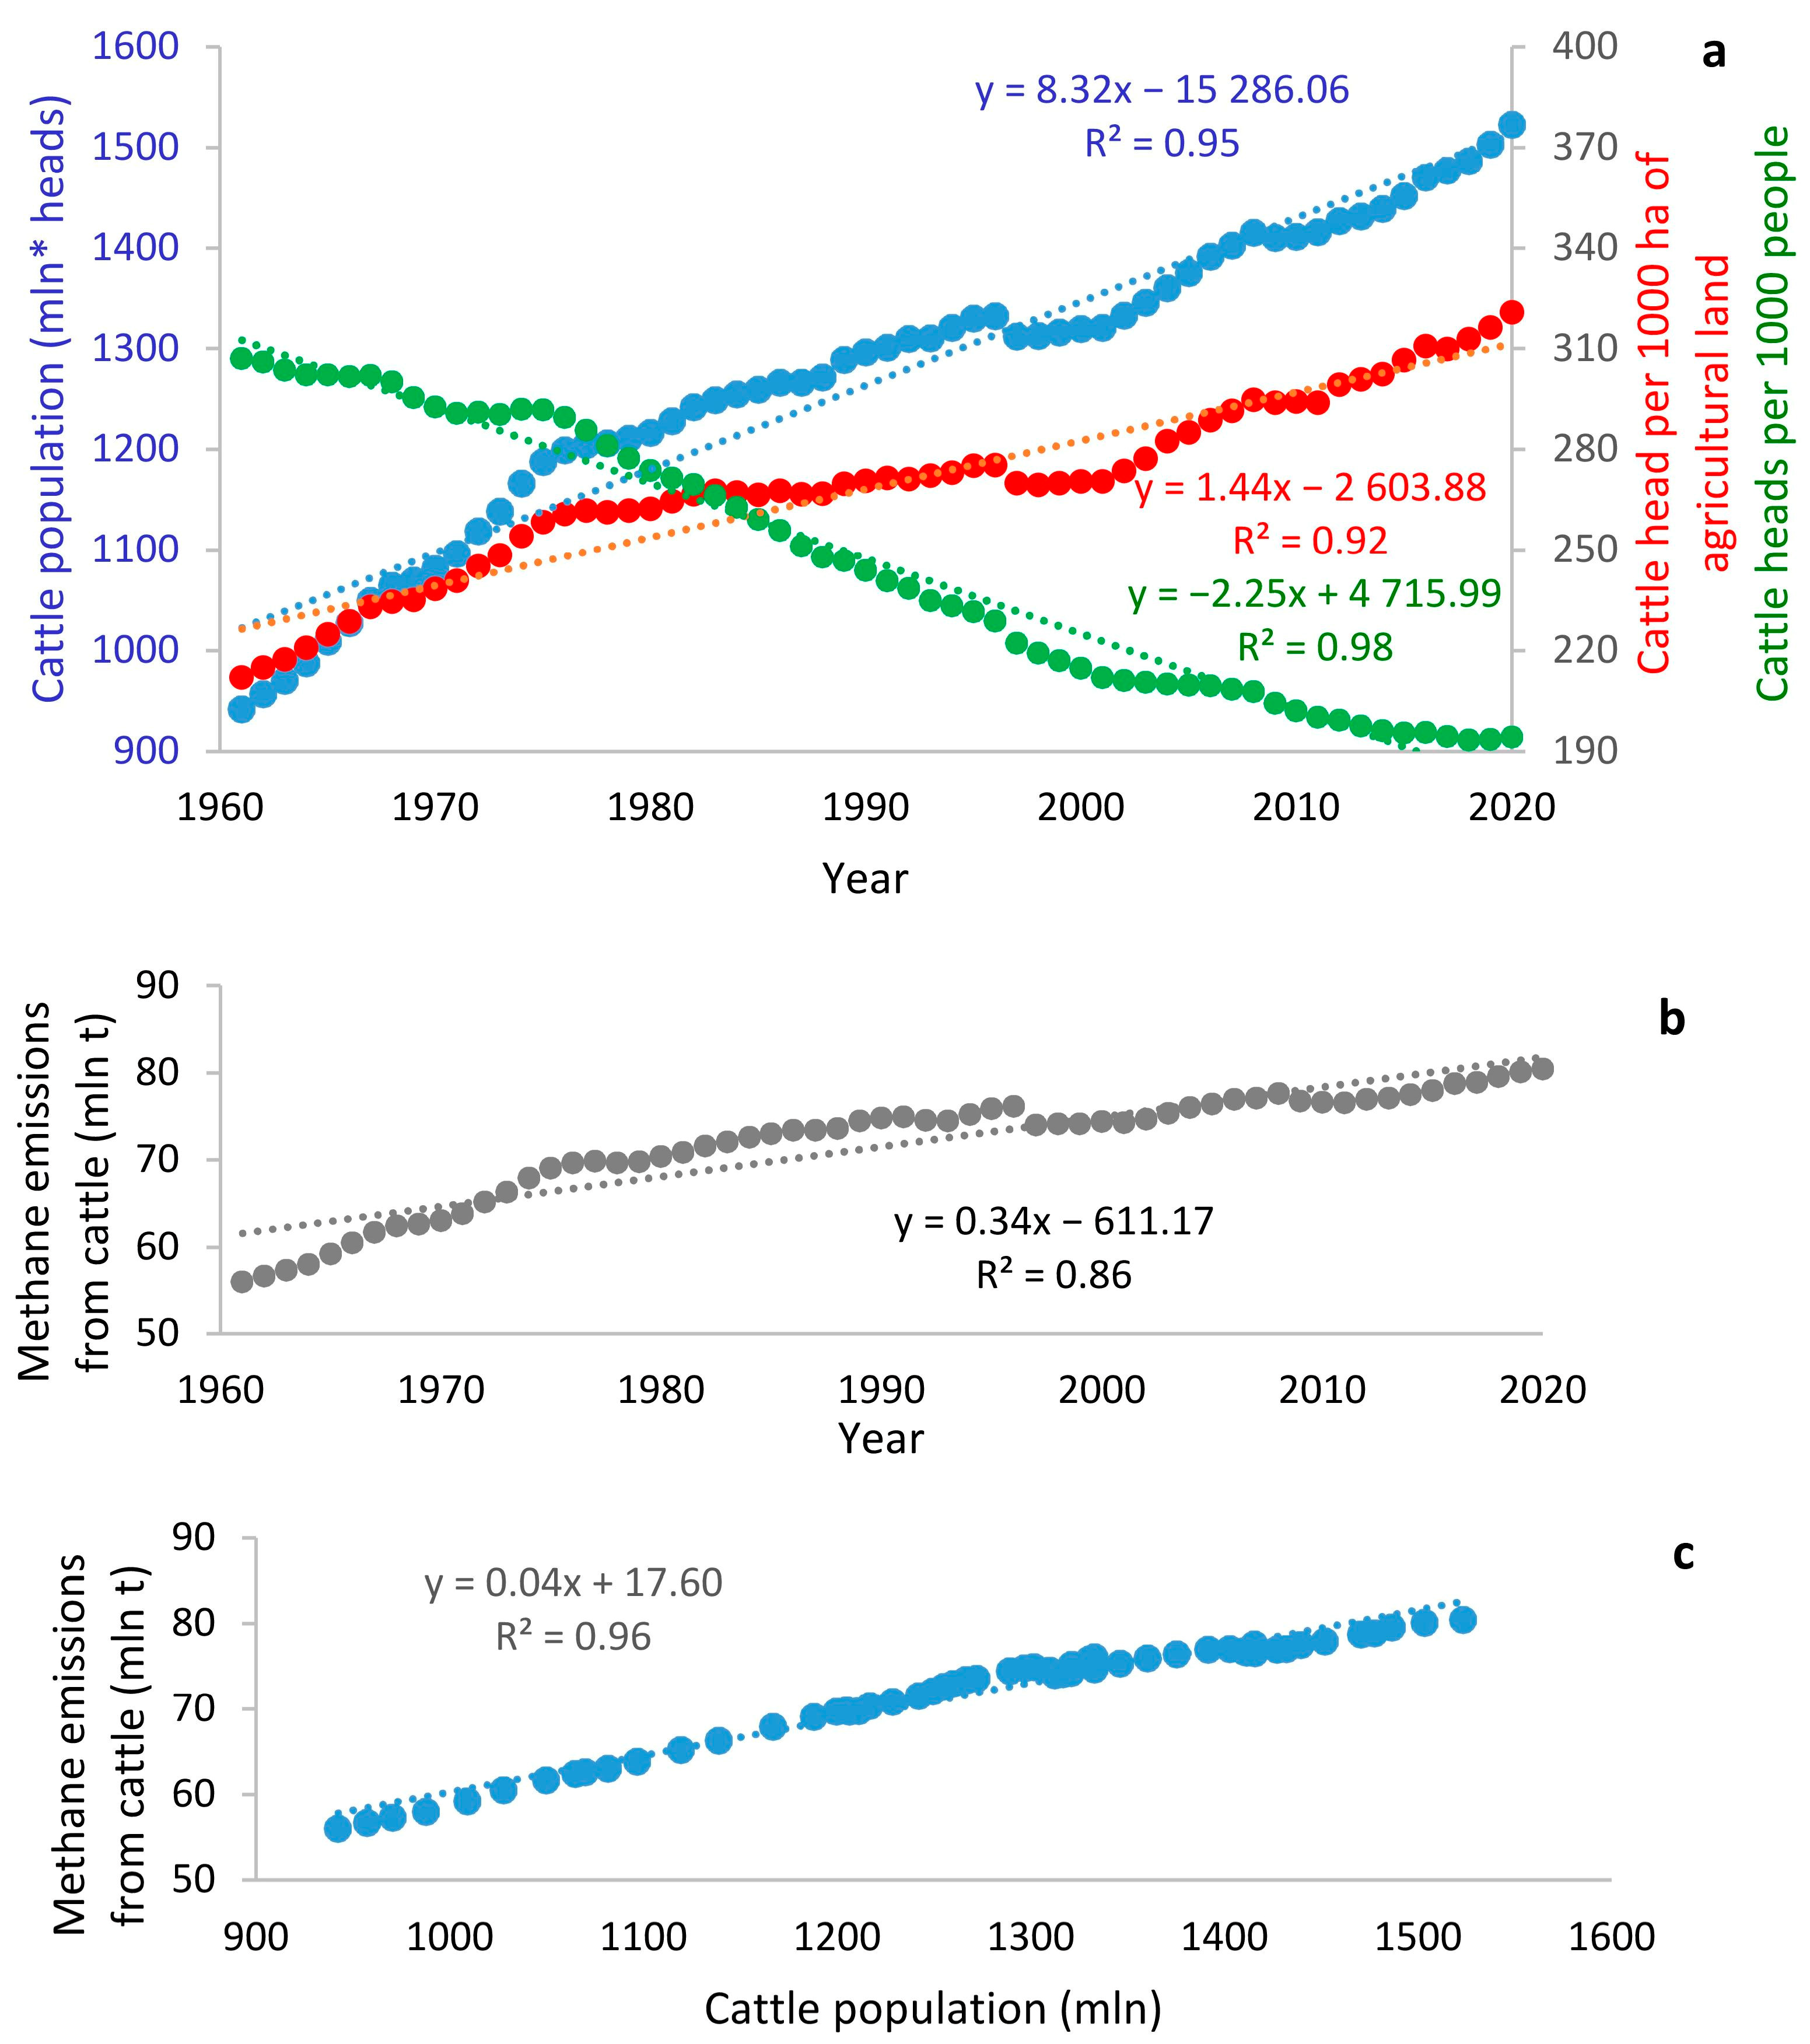
3.1. Temporal Trends in Cattle Population in Period 1961–2020

In 1961, the global cattle population was approximately 942 million. In 2020, it had reached around 1523 million heads. When plotting the changes in the number of cattle over time, the average annual increase is approximately 8.3 million and can be well described by a linear function (R2 = 0.95) (Figure 2a). The increase in the cattle population correlates with the rise in cattle density, represented as the number of cattle heads per 1000 ha of agricultural land. However, the growth rate of the cattle population (about 62% during the study period) surpassed the increase in the cattle-to-agricultural land ratio (about 51%), as depicted in Figure 2. The number of cattle heads per 1000 people exhibited a linear decrease (R2 = 0.98) during the study period, declining from 307 to 194 (a reduction of approximately 37%). The downward trend in recent years has been slower. CH4 emission associated with cattle production, including both enteric fermentation and manure, were strongly correlated with the cattle population (Figure 2b). The average yearly global increase in CH4 emissions during the study period amounted to 0.34 million tons. The relationship between cattle population and methane emission from cattle worldwide was nearly linear (Figure 2c). Based on the regression analysis, it was determined that an increase in the cattle population by one head results in an average annual increase in CH4 emissions of 42.7 kg.
Temporal trends of the cattle population and its ratio per agricultural land or per number of people varied significantly among different countries. To evaluate these changes from 1961 to 2020, the means for decades (1961–1970 and 2011–2020) were calculated. Decade means were used because the values for individual years were highly variable in some countries, such as Germany, where recent data exhibited significant year-to-year variability. The changes between the first decade (1961–1970) and the last decade (2011–2020) are presented in Table 2. The highest increase in the cattle population was observed in Chad (488% higher cattle population in the last decade compared to the first decade). Bolivia and Burkina Faso also experienced increases of over 300% in their cattle population, while Brazil, Niger, Paraguay and Uganda saw increases in the range of 200–300%. Most of the studied countries exhibited an increase in their cattle population, with only three countries experiencing a decrease: Germany (−33%), France (−9%) and the USA (−14%). The area of agricultural land remained relatively stable over time, and the ratio of cattle population to agricultural area was generally higher in the last decade (1961–1970) compared to the first decade (2011–2020).
The number of cattle per 1000 people decreased in most countries, with the strongest decreases observed in Bangladesh (−67%), India (−63%), Turkey (−61%) and South Africa (−66%). Only four countries showed an increase in the cattle population-to-number of people ratio: Burkina Faso (39%), Bolivia (60%), Brazil (10%) and Chad (64%).
To identify groups of countries with similar patterns of cattle population changes, a cluster analysis was conducted. The analysis used mean increments calculated for subsequent decades (1961–1970, …, 2011–2020) based on the formula presented in the Material and Methods section. Since data for the first decade (1961–1970) did not have associated data for the previous decade (1951–1960), five variables were used for the analysis, with the first variable representing the decade 1971–1980 and the last variable representing the decade 2011–2020. The cluster analysis identified four groups of countries, as shown on the dendrogram in Figure 3. The patterns of changes in cattle population over time are presented in Figure 4, and the groups of countries are displayed on the map in Figure 5, along with the percentage change in cattle population between 1961–1970 and 2011–2020. The first group of countries consisted of four countries from central Africa, Burkina Faso, Mali, Niger, Uganda, and one country from south Asia–Pakistan. These countries experienced a high increase in cattle population, particularly in the last two decades (2001–2020). A similar pattern of cattle population changes was also observed in Chad, which was atypical due to the highest increase in cattle population throughout the entire study period, especially in the decade 1991–2000 (approximately 220%). The second group of countries included Bolivia, Brazil, Venezuela, Paraguay, Mexico (South America and the southern part of North America), Indonesia, Myanmar (Southeastern Asia), Kenya, Nigeria and Tanzania (Central Africa). These countries exhibited a relatively stable increase in the cattle population throughout the study period, with slightly higher increases in the first half compared to the second half.
The third group of countries was the largest and included the following countries: Argentina, Uruguay, Colombia (South America), Canada, USA (North America), Germany, France (Europe), Bangladesh, China, India, Turkey (Asia), South Africa, New Zealand and Australia. These countries exhibited a significant increase in cattle population at the beginning of the study period, but from 1981 to 2020, the cattle population remained relatively stable or slightly decreased. The countries in this group are located in different regions of the world, with many of them being highly developed countries.

3.2. Relationship between Cattle Population and Other Variables

To evaluate the relationship between cattle population in each country and various variables that characterize agricultural production, food consumption and economic conditions, a correlation analysis was conducted using yearly data from 1961 to 2020. The results of the correlation analysis are presented in Table 3.
For all countries from the first and second groups, as well as Chad, a very strong positive correlation was observed between the cattle population and the human population. The correlation coefficients ranged from 0.85 to 0.99, indicating that the increase in cattle population in these countries was almost linearly associated with the growth of the human population. Moreover, cattle population showed a strong positive correlation with GDP per capita and the area of agricultural land while exhibiting a negative correlation with the percentage of rural population. These significant correlations were observed for most countries from the first and second groups, although not for all of them. Other correlations within the first and second groups were less consistent. For example, an increase in cattle population was associated with an increase in milk yield per animal, but only for approximately two-thirds of the countries in these groups.
The correlations within the third group of countries were not consistent, as both negative and positive correlations with cattle populations were observed for all variables. Most of these correlations were weaker compared to those observed in countries belonging to the first and second groups.
For Canada, the correlation coefficient between changes in cattle population and changes in CH4 emissions from cattle is positive and statistically significant, albeit lower compared to other countries. This is because the population of dairy cattle in Canada has been declining over the study period, while the number of non-dairy cattle has increased or fluctuated. Dairy cattle tend to have higher CH4 emission factors compared to beef cattle (Table 1), which explains the weaker correlation between cattle population and CH4 emission from cattle during the study period.
In addition to calculating correlations for each country, correlations were also calculated across all countries based on the means for the period 2011–2020. These correlations encompassed all the studied variables. In addition, two ratios: cattle-to-agricultural land and cattle-to-total human population, were included in the analysis. The results showed that the cattle population was significantly correlated only with the area of agricultural land and the total human population. These correlations were positive, indicating that larger agricultural areas are necessary to support a larger population of cattle, and a larger human population may require more animal-based food. The ratio of cattle-to-agricultural land was found to be significantly correlated with both the area of agricultural land and the area of land under permanent meadows and pastures. The correlation was negative, suggesting that countries with larger agricultural areas, including meadows and pastures, tend to have a lower cattle density per unit area. Additionally, the ratio of cattle-to-total-human population exhibited a significant correlation with beef consumption per capita. The correlation was positive, indicating that countries with higher beef consumption tend to have a higher cattle population per 1000 people. However, there was no significant correlation found with milk consumption. These relationships, as presented in Table 4, are also visualized in the form of a PCA biplot in Figure 6.
Positive correlations can be observed across countries for the following variables: GDP per capita (GDP), land under perm. meadows and pastures (LMP), meat beef consumption per capita (MBC), meat total (incl. fish and seafood) consumption per capita (MTC), milk consumption per capita (MC), milk yield per animal (MYA). Conversely, these variables exhibit negative correlations with the percentage of rural population (RPP). Therefore, countries with higher GDP per capita tend to have higher meat and milk consumption per capita, higher milk yield per animal, and a lower percentage of rural population. These are the United States, Australia, Argentina, France, Canada, Brazil, Germany and New Zealand (located on the left side of the biplot in Figure 6). On the other hand, countries like Bangladesh, Uganda, Burkina Faso, Niger, Tanzania, Nigeria and Kenya (located on the right side of the biplot in Figure 6) exhibit lower meat and milk consumption per capita, lower milk yield per animal, and a higher percentage of rural population. Strong positive correlations were identified between cattle population (CP) and farm machinery (FM), methane emission attributed to cattle (CH4), agricultural land (AL), land under perm. meadows and pastures (LMP). Notably, Brazil stands out as the country with the highest values for these variables.

4. Discussion

This study focused on examining the contribution of livestock systems to global warming by analyzing the emissions directly and unambiguously attributed to livestock. The analysis found a strong correlation between cattle population and CH4 emission from cattle, with a correlation coefficient of 0.96 across countries for the last decade (2011–2020). The temporal pattern of changes in cattle population and CH4 emissions at a global scale exhibited a similar trend.
These CH4 emission estimations are based on Tier 1 factors, which are less detailed and may introduce biases. These factors consider regional differences in production intensity and categorize cattle into dairy and non-dairy types. To obtain more accurate emission factors, the Tier 2 method is used, which takes into account specific characteristics and activities of different livestock groups [2]. This approach considers factors like animal characteristics, diet, housing conditions, manure management practices, and other relevant parameters. By incorporating these factors, Tier 2 provides a more precise estimation of greenhouse gas emissions compared to default values. Calculating emission factors using the Tier 2 method requires detailed activity data specific to livestock categories. This data includes information on animal numbers, production parameters, feed consumption, manure management practices and other factors that influence emissions. Studies on CH4 emissions from enteric fermentation and manure management have shown variations in emission factor values, typically around 20%. For example, the UNFCCC (the United Nations Framework Convention on Climate Change) inventory reports indicate that the US reported an enteric fermentation CH4 emission factor for dairy cows of 121 kg CH4 head−1 in 1990 and 149 kg CH4 head−1 in 2020. However, FAOSTAT uses a value of 128 for dairy cows in the US. Similar variations exist in the case of manure management. Notably, CH4 emission rates for manure management can be significantly lower than those for enteric fermentation. The structure of cattle populations and rearing methods also influence CH4 emissions. Although presented study did not account for this structure due to data limitations, its main objective was to demonstrate global trends in cattle population changes and their implications, such as CH4 emissions from livestock.
Presented findings revealed different patterns of temporal changes in cattle populations among groups of countries. Two groups exhibited a strong correlation between cattle and human population growth, mainly in developing or middle-income countries located in Africa, South America, and Southeastern Asia. These countries showed a substantial increase in both cattle and human populations, along with a rise in milk and meat consumption [24,25]. However, their milk and meat consumption levels still remain lower than those in developed countries. The third group consisted primarily of highly developed countries, where cattle populations remained relatively stable, and an increase in cattle production efficiency was observed.
Over the study period (1961–2020), the global human population increased by approximately 155%, from 3.07 to 7.84 billion people, while the cattle population increased by about 62% [26]. This raises the question of whether increasing the cattle population is necessary to meet the growing food demands. It is possible to produce more beef and milk with the same cattle population by enhancing production efficiency. A notable example is the US, where the human population increased by over 100% during the same period, yet the cattle population either remained stable or slightly decreased. Such improvements in cattle production efficiency are beneficial for reducing CH4 emissions as they decrease the emissions per unit of protein produced [16,27]. In many developing countries, CH4 emissions per unit of production are still very high, and there is high potential for increased intensity of beef and milk production to reduce CH4 emissions. Developing countries, especially those in Southeastern Asia and sub-Saharan Africa, still have high CH4 emissions per unit of production, suggesting significant potential for emission intensity reduction through increased efficiency [16]. Productivity gains are particularly crucial for regions experiencing high population growth, as is the case for many developing countries.
In tropical climates, where many developing countries are located, the same livestock management practices used in developed countries may not be applicable. However, one potential approach to reduce CH4 emissions during cattle production in tropical climates is through crossbreeding, which has the potential to improve performance [28]. A study by Haas et al. [29] demonstrated that genetic progress can reduce the intensity of CH4 emissions (CH4 emitted per kg of milk) by approximately 20% over the next 30 years in European conditions.
One challenge associated with improving cattle production efficiency is the negative effect of heat stress, particularly on dairy cows, leading to decreased milk production [30]. Heat stress also diminishes the efficiency of meat production [31,32]. Unfortunately, continuous climate warming exacerbates heat stress in cattle production, posing a significant obstacle to increasing production efficiency, especially in tropical climates.
Various methods can be employed to mitigate global warming by reducing CH4 emissions in cattle production. These methods include improved grazing management, dietary modifications and nutrition for livestock, genetic improvement, better manure management [10,33]. A simple strategy for cattle producers to reduce CH4 emissions is to adopt the practices currently used by leading producers with the lowest emission intensity. While most studies on CH4 reduction in cattle focus on changes in enteric emissions but efforts should encompass a more comprehensive approach that includes other GHG emissions associated with cattle production [34].
Changes in livestock CH4 emissions were primarily influenced by shifts in human population dynamics. However, in highly developed countries, emissions have been reduced through increased efficiency in cattle production. The current global challenges related to increased CH4 emissions from cattle production are primarily concentrated in developing countries, where cattle production efficiency remains low despite growing demands for food due to population growth [35,36]. Our study, along with other research [35], has identified an ongoing increase in CH4 emissions in regions like South Asia, tropical Africa and Brazil, driven by the expansion of cattle populations and low production efficiency. Highly developed countries still have the potential to reduce CH4 emission from cattle production, although this potential is comparatively lower than that of developing countries, mainly due to stable human populations [37,38].

5. Conclusions

During the period from 1961 to 2020, the increase in human population was the primary driver behind the rise in cattle population in less developed countries, predominantly located in Africa and South America. Conversely, developed countries experienced relatively stable cattle populations, but notable improvements in cattle production efficiency were observed, such as higher milk yield per animal. Since methane emission is strongly correlated with cattle population, there is significant potential for mitigating CH4 emissions from cattle production, particularly in developing countries. These regions offer favorable conditions for introducing more efficient cattle management, which can lead to higher beef and milk production while maintaining a similar cattle population.
In planning for future changes in milk and beef production, it is crucial to prioritize achieving higher production efficiency. This can be accomplished by increasing production intensity while ensuring the well-being of the animals. By focusing on both efficiency and animal welfare, it is possible to meet the growing demands for milk and beef while minimizing the environmental impact associated with methane emissions.

Author Contributions

Conceptualization, K.K. and E.W.-G.; methodology, K.K. and E.W.-G.; validation, K.K.; formal analysis, E.W.-G.; investigation, K.K. and E.W.-G.; resources, K.K.; data curation, K.K.; writing—original draft preparation, K.K. and E.W.-G.; writing—review and editing, K.K., E.W.-G. and J.Ž.; visualization, K.K. and E.W.-G.; supervision, E.W.-G. and J.Ž.; project administration, E.W.-G. and J.Ž.; funding acquisition, J.Ž. All authors have read and agreed to the published version of the manuscript.

Funding

This research received no external funding.

Institutional Review Board Statement

Not applicable.

Informed Consent Statement

Not applicable.

Data Availability Statement

Data are available on request from the corresponding author.

Conflicts of Interest

The authors declare no conflict of interest.

References

  1. Wuebbles, D. Atmospheric Methane and Global Change. Earth-Sci. Rev. 2002, 57, 177–210. [Google Scholar] [CrossRef]
  2. IPCC. 2006 IPCC Guidelines for National Greenhouse Gas Inventories; Eggleston, H.S., Ed.; Institute for Global Environmental Strategies: Hayama, Japan, 2006; ISBN 978-4-88788-032-0. [Google Scholar]
  3. Tsuruta, A.; Aalto, T.; Backman, L.; Hakkarainen, J.; van der Laan-Luijkx, I.T.; Krol, M.C.; Spahni, R.; Houweling, S.; Laine, M.; Dlugokencky, E.; et al. Global Methane Emission Estimates for 2000–2012 from CarbonTracker Europe-CH4 v1.0. Geosci. Model Dev. 2017, 10, 1261–1289. [Google Scholar] [CrossRef] [Green Version]
  4. de Gouw, J.A.; Veefkind, J.P.; Roosenbrand, E.; Dix, B.; Lin, J.C.; Landgraf, J.; Levelt, P.F. Daily Satellite Observations of Methane from Oil and Gas Production Regions in the United States. Sci. Rep. 2020, 10, 1379. [Google Scholar] [CrossRef] [Green Version]
  5. Ghosh, A.; Patra, P.K.; Ishijima, K.; Umezawa, T.; Ito, A.; Etheridge, D.M.; Sugawara, S.; Kawamura, K.; Miller, J.B.; Dlugokencky, E.J.; et al. Variations in Global Methane Sources and Sinks during 1910–2010. Atmos. Chem. Phys. 2015, 15, 2595–2612. [Google Scholar] [CrossRef] [Green Version]
  6. Maasakkers, J.D.; Jacob, D.J.; Sulprizio, M.P.; Scarpelli, T.R.; Nesser, H.; Sheng, J.-X.; Zhang, Y.; Hersher, M.; Bloom, A.A.; Bowman, K.W.; et al. Global Distribution of Methane Emissions, Emission Trends, and OH Concentrations and Trends Inferred from an Inversion of GOSAT Satellite Data for 2010–2015. Atmos. Chem. Phys. 2019, 19, 7859–7881. [Google Scholar] [CrossRef] [Green Version]
  7. Lassey, K.R. Livestock Methane Emission: From the Individual Grazing Animal through National Inventories to the Global Methane Cycle. Agric. For. Meteorol. 2007, 142, 120–132. [Google Scholar] [CrossRef]
  8. Smith, P.; Bustamante, M.; Ahammad, H.; Clark, H.; Haberl, H.; Harper, R.; House, J.; Jafari, M.; Masera, O.; Mbow, C.; et al. 11 Agriculture, Forestry and Other Land Use (AFOLU); Cambridge University Press: Cambridge, UK; New York, NY, USA, 2014. [Google Scholar]
  9. Gerber, P.; Opio, C. Greenhouse Gas Emmission from Ruminant Supply Chains: A Global Life Cycle Assessment; Food and Agriculture Organization of the United Nations: Rome, Italy, 2013; ISBN 978-92-5-107945-4. [Google Scholar]
  10. Gerber, P.J.; Steinfeld, H.; Henderson, B.; Mottet, A.; Opio, C.; Dijkman, J.; Falcucci, A.; Tempio, G. Tackling Climate Change through Livestock: A Global Assessment of Emissions and Mitigation Opportunities; Gerber, P.J., Ed.; Food and Agriculture Organization of the United Nations: Rome, Italy, 2013; ISBN 978-92-5-107920-1. [Google Scholar]
  11. Hedenus, F.; Wirsenius, S.; Johansson, D.J.A. The Importance of Reduced Meat and Dairy Consumption for Meeting Stringent Climate Change Targets. Clim. Change 2014, 124, 79–91. [Google Scholar] [CrossRef] [Green Version]
  12. Wollenberg, E.; Richards, M.; Smith, P.; Havlík, P.; Obersteiner, M.; Tubiello, F.N.; Herold, M.; Gerber, P.; Carter, S.; Reisinger, A.; et al. Reducing Emissions from Agriculture to Meet the 2 °C Target. Glob. Change Biol. 2016, 22, 3859–3864. [Google Scholar] [CrossRef] [Green Version]
  13. Masson-Delmotte, V. Climate Change and Land: An IPCC Special Report on Climate Change, Desertification, Land Degradation, Sustainable Land Management, Food Security, and Greenhouse Gas Fluxes in Terrestrial Ecosystems: Summary for Policymakers; Intergovernmental Panel on Climate Change: Geneva, Switzerland, 2019; ISBN 978-92-9169-154-8. [Google Scholar]
  14. Wójcik-Gront, E. Analysis of Sources and Trends in Agricultural GHG Emissions from Annex I Countries. Atmosphere 2020, 11, 392. [Google Scholar] [CrossRef] [Green Version]
  15. Owen, J.J.; Silver, W.L. Greenhouse Gas Emissions from Dairy Manure Management: A Review of Field-Based Studies. Glob. Change Biol. 2015, 21, 550–565. [Google Scholar] [CrossRef] [PubMed] [Green Version]
  16. Chang, J.; Peng, S.; Yin, Y.; Ciais, P.; Havlik, P.; Herrero, M. The Key Role of Production Efficiency Changes in Livestock Methane Emission Mitigation. AGU Adv. 2021, 2, e2021AV000391. [Google Scholar] [CrossRef]
  17. Britt, J.H.; Cushman, R.A.; Dechow, C.D.; Dobson, H.; Humblot, P.; Hutjens, M.F.; Jones, G.A.; Ruegg, P.S.; Sheldon, I.M.; Stevenson, J.S. Invited Review: Learning from the Future—A Vision for Dairy Farms and Cows in 2067. J. Dairy Sci. 2018, 101, 3722–3741. [Google Scholar] [CrossRef] [Green Version]
  18. Salter, A.M. Improving the Sustainability of Global Meat and Milk Production. Proc. Nutr. Soc. 2017, 76, 22–27. [Google Scholar] [CrossRef] [PubMed]
  19. Berndt, A.; Tomkins, N.W. Measurement and Mitigation of Methane Emissions from Beef Cattle in Tropical Grazing Systems: A Perspective from Australia and Brazil. Animal 2013, 7, 363–372. [Google Scholar] [CrossRef] [Green Version]
  20. Prathap, P.; Chauhan, S.S.; Leury, B.J.; Cottrell, J.J.; Dunshea, F.R. Towards Sustainable Livestock Production: Estimation of Methane Emissions and Dietary Interventions for Mitigation. Sustainability 2021, 13, 6081. [Google Scholar] [CrossRef]
  21. Dangal, S.R.S.; Tian, H.; Zhang, B.; Pan, S.; Lu, C.; Yang, J. Methane Emission from Global Livestock Sector during 1890–2014: Magnitude, Trends and Spatiotemporal Patterns. Glob. Change Biol. 2017, 23, 4147–4161. [Google Scholar] [CrossRef]
  22. FAOSTAT. Available online: https://www.fao.org/faostat/en/#home (accessed on 8 May 2023).
  23. Ward, J.H. Hierarchical Grouping to Optimize an Objective Function. J. Am. Stat. Assoc. 1963, 58, 236–244. [Google Scholar] [CrossRef]
  24. Revell, B.J. One Man’s Meat … 2050? Ruminations on Future Meat Demand in the Context of Global Warming. J. Agric. Econ. 2015, 66, 573–614. [Google Scholar] [CrossRef]
  25. Stoll-Kleemann, S.; O’Riordan, T. The Sustainability Challenges of Our Meat and Dairy Diets. Environ. Sci. Policy Sustain. Dev. 2015, 57, 34–48. [Google Scholar] [CrossRef]
  26. Ganivet, E. Growth in Human Population and Consumption Both Need to Be Addressed to Reach an Ecologically Sustainable Future. Environ. Dev. Sustain. 2020, 22, 4979–4998. [Google Scholar] [CrossRef]
  27. Liu, S.; Proudman, J.; Mitloehner, F.M. Rethinking Methane from Animal Agriculture. CABI Agric. Biosci. 2021, 2, 22. [Google Scholar] [CrossRef]
  28. Maciel, I.C.D.F.; Barbosa, F.A.; Tomich, T.R.; Ribeiro, L.G.P.; Alvarenga, R.C.; Lopes, L.S.; Malacco, V.M.R.; Rowntree, J.E.; Thompson, L.R.; Lana, Â.M.Q. Could the Breed Composition Improve Performance and Change the Enteric Methane emissions from Beef Cattle in a Tropical Intensive Production System? PLoS ONE 2019, 14, e0220247. [Google Scholar] [CrossRef] [PubMed]
  29. De Haas, Y.; Veerkamp, R.F.; De Jong, G.; Aldridge, M.N. Selective Breeding as a Mitigation Tool for Methane Emissions from Dairy Cattle. Animal 2021, 15, 100294. [Google Scholar] [CrossRef] [PubMed]
  30. Rhoads, M.L.; Rhoads, R.P.; VanBaale, M.J.; Collier, R.J.; Sanders, S.R.; Weber, W.J.; Crooker, B.A.; Baumgard, L.H. Effects of Heat Stress and Plane of Nutrition on Lactating Holstein Cows: I. Production, Metabolism, and Aspects of Circulating Somatotropin. J. Dairy Sci. 2009, 92, 1986–1997. [Google Scholar] [CrossRef] [Green Version]
  31. Summer, A.; Lora, I.; Formaggioni, P.; Gottardo, F. Impact of Heat Stress on Milk and Meat Production. Anim. Front. 2019, 9, 39–46. [Google Scholar] [CrossRef]
  32. Nardone, A.; Ronchi, B.; Lacetera, N.; Bernabucci, U. Climatic Effects on Productive Traits in Livestock. Vet. Res. Commun. 2006, 30, 75–81. [Google Scholar] [CrossRef]
  33. Cheng, M.; McCarl, B.; Fei, C. Climate Change and Livestock Production: A Literature Review. Atmosphere 2022, 13, 140. [Google Scholar] [CrossRef]
  34. Bačėninaitė, D.; Džermeikaitė, K.; Antanaitis, R. Global Warming and Dairy Cattle: How to Control and Reduce Methane Emission. Animals 2022, 12, 2687. [Google Scholar] [CrossRef] [PubMed]
  35. Zhang, L.; Tian, H.; Shi, H.; Pan, S.; Chang, J.; Dangal, S.R.S.; Qin, X.; Wang, S.; Tubiello, F.N.; Canadell, J.G.; et al. A 130-year Global Inventory of Methane Emissions from Livestock: Trends, Patterns, and Drivers. Glob. Change Biol. 2022, 28, 5142–5158. [Google Scholar] [CrossRef]
  36. Zhang, L.; Tian, H.; Shi, H.; Pan, S.; Qin, X.; Pan, N.; Dangal, S.R.S. Methane Emissions from Livestock in East Asia during 1961−2019. Ecosyst. Health Sustain. 2021, 7, 1918024. [Google Scholar] [CrossRef]
  37. McManus, C.; Barcellos, J.O.J.; Formenton, B.K.; Hermuche, P.M.; Carvalho, O.A.D.; Guimarães, R.; Gianezini, M.; Dias, E.A.; Lampert, V.D.N.; Zago, D.; et al. Dynamics of Cattle Production in Brazil. PLoS ONE 2016, 11, e0147138. [Google Scholar] [CrossRef] [PubMed] [Green Version]
  38. Panel, M.M. Meat, Milk and More: Policy Innovations to Shepherd Inclusive and Sustainable Livestock Systems in Africa; International Food Policy Research Institute: Washington, DC, USA, 2020. [Google Scholar]
Figure 1. Countries selected for the analyses and their cattle population in millions of heads in 2020.
Sustainability 15 10533 g001
Figure 2. The cattle population (in blue) for the entire world from 1961 to 2020 along with the cattle rate per 1000 ha of agricultural land (in red) and per 1000 people (in green) (a), the global CH4 emission from cattle (in grey), which includes both emissions from enteric fermentation and manure management (b) and relationship between the world cattle population and methane emission from cattle (c). * mln—million.
Sustainability 15 10533 g002
Figure 3. Cluster analysis of trends in cattle population for countries around the world based on relative values of changes for subsequent decades (1961–1970, …, 2011–2020).
Sustainability 15 10533 g003
Figure 4. Means values of relative changes in cattle population for subsequent decades (1971–1980, …, 2011–2020) compared to the previous decade for groups distinguished by cluster analysis (group of countries are presented in Figure 3).
Sustainability 15 10533 g004
Figure 5. Maps presenting the distinguished groups of countries based on cluster analysis (Figure 3) in different colors: orange for group 1, where a strong increase in cattle population was observed; yellow for group 2, where a strong increase was observed in the first half of the study period followed by a slight increase; green for group 3, where the cattle population remained quite stable along the study period; and Chad in red, indicating a very strong increase. The values next to the country names represent the percentage change in cattle population between 1961–1970 and 2011–2020.
Sustainability 15 10533 g005
Figure 6. PCA biplot illustrating the relationships between the studied variables, as well as the multivariate differences among the countries included in the analysis, based on the means for the period 2011–2020. Abbreviations variables (marked in green and underlined): the size of the cattle population (CT) in the country and other variables which can be related to the cattle population: agricultural land (AL), farm machinery (FM), GDP per capita (GDP), land under perm. meadows and pastures (LMP), beef consumption per capita (MBC), meat total (incl. fish and seafood) consumption per capita (MTC), milk consumption per capita (MC), milk yield per animal (MYA), rural population percent (RPP), total population (TP) and two ratios based on cattle population, cattle/agricultural land (CT/AL), cattle/total population (CT/TP), methane emission connected with cattle (CH4); countries: Argentina (ARG), Australia (AUS), Bolivia (BOL), Brazil (BRA), Burkina Faso (BFA), Canada (CAN), Chad (TCD), China (CHN), Colombia (COL), France (FRA), Germany (DEU), India (IND), Indonesia (IDN), Kenya (KEN), Mali (MLI), Mexico (MEX), Myanmar (MMR), New Zealand (NZL), Niger (NER), Nigeria (NGA), Paraguay (PRY), South Africa (ZAF), Turkey (TUR), Uganda (UGA), United Republic of Tanzania (TZA), the United States of America (USA), Uruguay (URY), Venezuela (VEN). Different colors of dots for countries indicate groups distinguished in cluster analysis (Figure 3).
Sustainability 15 10533 g006
Table 1. The methane emission factors from enteric fermentation and manure management used in the study.
CH4 Emission Factor [kg head−1 per year]Countries Using Presented Value
Enteric
Fermentation
Manure Management
dairy461 (2 TUR)BFA, KEN, MLI, NER, NGA, TCD, TUR, TZA, UGA, ZAF—Countries of Africa and Middle East
non-dairy311
dairy585BGD, IND, PAK
Countries of Asia
non-dairy272
dairy689 CHN, 27 IDN, 23 MMRCHN, IDN, MMR
Countries of Asia
non-dairy471
dairy721 (2 VEN)ARG, BOL, BRA, COL, MEX, PRY, URY, VEN
Latin America and Caribbean
non-dairy561
dairy9023 NZL, 29 AUSAUS, NZL
Countries of Oceania
non-dairy601 NZL, 2 AUS
dairy11721 DEU, 22 FRADEU, FRA
Countries of Europe
non-dairy576 DEU, 7 FRA
dairy12848CAN, USA
Countries of North America
non-dairy531
Table 2. The mean cattle population for studied countries during the periods 1961–1970 and 2011–2020, as well as the corresponding changes. The color of the background indicates differences between countries in the values shown in the columns.
CountryCattle (mln * heads)Cattle Density (heads/1000 ha of Agricultural Land)Cattle Heads per 1000 People
1961–19702011–2020Change **1961–19702011–2020Change1961–19702011–2020Change
Argentina46.352.413%35145129%24971347−46%
Australia19.026.941%397388%20821331−36%
Burkina Faso2.29.4326%269773188%49468439%
Bangladesh23.023.73%239225055%521171−67%
Bolivia2.19.1345%68243255%61498260%
Brazil65.2214.4229%376911142%1052115510%
Canada11.511.82%18220312%738367−50%
Chad4.425.8488%92516462%1607263264%
China52.663.120%147120−19%8849−45%
Colombia17.524.540%41553228%1310585−55%
Germany18.412.3−33%948735−22%257151−41%
France20.718.9−9%6146577%477313−34%
Indonesia6.715.7135%17426452%8769−20%
India175.9190.78%99310637%445167−63%
Kenya7.619.9162%301718139%1162560−52%
Mexico19.633.772%20034371%630323−49%
Mali4.510.7137%14326082%909824−9%
Myanmar6.114.0128%575109190%316294−7%
Niger4.012.6216%126274118%1339919−31%
Nigeria7.419.9169%128290127%183143−22%
New Zealand7.410.137%467941102%34842480−29%
Pakistan14.442.2194%3941159194%352245−30%
Paraguay4.413.7212%404820103%26232517−4%
Turkey13.114.712%35038510%554216−61%
Tanzania9.226.3185%34368399%1067674−37%
Uganda3.613.8279%377960155%558501−10%
Uruguay8.611.635%53981451%36493506−4%
United States of America106.992.0−14%244227−7%668311−53%
Venezuela7.316.2122%373755102%1100615−44%
South Africa11.713.314%12013815%807272−66%
* mln—milion, ** Relative change between two periods, 2011–2020 and 1961–1970 (reference period).
Table 3. Correlation coefficients between cattle population and other variables from 1961 to 2020, categorized by country groups based on cluster analysis. Positive correlations are indicated by red cells, while negative correlations are marked in blue.
CountryGroupAL 1FMGDPLMPMBCMTCMCMYARPPTPCH4
Chad 00.98 *−0.130.75 *0.000.85 *0.89 *−0.72 *−0.80 *−0.75 *0.98 *1.00 *
Burkina Faso 10.98 *0.44 *0.98 *0.000.76 *0.85 *0.03−0.70 *−0.95 *0.98 *1.00 *
Mali 10.85 *−0.240.87 *0.82 *0.43 *0.28 *0.31 *−0.84 *−0.86 *0.95 *1.00 *
Niger 10.91 *−0.02−0.29 *0.88 *−0.33 *−0.49 *−0.41 *0.80 *−0.53 *0.92 *1.00 *
Pakistan 10.020.92 *0.91 *0.000.97 *0.87 *0.060.92 *−0.89 *0.96 *1.00 *
Bolivia 20.94 *0.50 *0.83 *0.81 *0.92 *0.95 *0.79 *0.94 *−0.97 *0.98 *1.00 *
Brazil 20.78 *0.93 *0.96 *0.66 *0.97 *0.96 *0.95 *0.79 *−0.99 *0.99 *1.00 *
Indonesia 20.92 *0.94 *0.96 *−0.74 *0.82 *0.96 *0.250.91 *−0.94 *0.94 *1.00 *
Kenya 20.87 *0.81 *0.88 *0.00−0.36 *−0.180.37 *0.74 *−0.88 *0.92 *0.98 *
Mexico 20.47 *0.92 *0.94 *0.040.80 *0.87 *0.61 *0.78 *−0.94 *0.88 *1.00 *
Myanmar 20.73 *0.79 *0.74 *−0.240.57 *0.78 *0.65 *0.90 *−0.78 *0.90 *0.85 *
Nigeria 20.71 *0.64 *0.57 *0.23−0.62 *0.50 *−0.36 *0.17−0.97 *0.95 *1.00 *
Paraguay 20.97 *0.77 *0.96 *0.82 *−0.68 *−0.45 *0.72 *0.80 *−0.96 *0.98 *1.00 *
Tanzania 20.94 *−0.46 *0.97 *0.82 *−0.19−0.50 *0.150.96 *−0.86 *0.97 *1.00 *
Uganda 20.87 *0.69 *0.96 *0.93 *−0.38 *0.33 *0.79 *0.53 *−0.44 *0.93 *1.00 *
Venezuela 20.87 *0.93 *0.57 *0.93 *0.150.75 *−0.150.05−0.98 *0.95 *1.00 *
Argentina 3−0.34 *0.050.32 *−0.39 *−0.100.110.120.15−0.42 *0.31 *1.00 *
Australia 3−0.28 *0.50 *0.49 *−0.280.140.59 *−0.56 *0.43 *−0.56 *0.46 *0.99 *
Bangladesh 30.27 *−0.04−0.050.000.34 *0.01−0.090.45 *0.17−0.130.94 *
Canada 30.10−0.10−0.53 *0.030.040.51 *−0.050.25−0.26 *0.250.40 *
China 30.71 *0.38 *0.100.71 *0.47 *0.47 *0.250.23−0.240.56 *0.99 *
Colombia 30.44 *0.39 *0.67 *0.61 *−0.38 *0.53 *0.39 *0.36 *−0.85 *0.72 *0.99 *
France 30.52 *0.77 *−0.54 *0.71 *0.80 *0.040.53 *−0.69 *0.31 *−0.54 *0.95 *
Germany 30.79 *0.97 *−0.91 *0.78 *0.94 *0.13−0.05−0.88 *0.69 *−0.59 *0.99 *
India 30.81 *0.33 *0.32 *−0.72 *−0.160.51 *0.69 *0.43 *−0.63 *0.54 *0.85 *
New Zealand 3−0.80 *0.81 *0.93 *−0.70 *−0.57 *−0.04−0.51 *0.81 *−0.77 *0.85 *0.96 *
South Africa 30.21−0.57 *0.30 *0.07−0.35 *0.42 *−0.63 *0.54 *−0.61 *0.64 *1.00 *
Turkey 3−0.65 *−0.180.12−0.32 *0.30 *0.100.75 *0.080.12−0.070.98 *
Uruguay 3−0.75 *0.190.74 *−0.64 *−0.73 *−0.68 *0.090.71 *−0.80 *0.82 *1.00 *
USA 30.67 *0.24−0.75 *−0.050.92 *−0.58 *0.27 *−0.75 *0.60 *−0.72 *0.94 *
* Significant correlations at 0.05 probability level. 1 Abbreviations used in the table: agricultural land (AL), farm machinery (FM), gross domestic product per capita (GDP), land under perm. meadows and pastures (LMP), meat beef consumption per capita (MBC), meat total (incl. fish and seafood) consumption per capita (MTC), milk consumption per capita (MC), milk yield per animal (MYA), rural population percent (RPP), total population (TP), methane emission from cattle enteric fermentation and manure management (CH4).
Table 4. The correlation coefficients between all studied variables in all countries based on the means for 2011–2020.
CTCT/ALCT/TPALFMGDPLMPMBCMTCMCMYARPPTPCH4
Cattle population (CT) 0.13−0.110.50 *0.140.000.330.210.110.160.05−0.090.57 *0.96 *
Cattle/agricultural land (CT/AL)0.13 0.03−0.37−0.07−0.26−0.41 *−0.27−0.30−0.17−0.340.27−0.020.07
Cattle/total population (CT/TP)−0.110.03 −0.16−0.210.07−0.060.46 *0.110.19−0.06−0.25−0.32−0.07
Agricultural land (AL)0.50 *−0.37−0.16 0.56 *0.38 *0.96 *0.280.48 *0.250.36 *−0.190.65 *0.56 *
Farm machinery (FM)0.14−0.07−0.210.56 * 0.210.52 *−0.100.310.080.24−0.100.70 *0.16
GDP per capita (GDP)0.00−0.260.070.38 *0.21 0.40 *0.56 *0.79 *0.80 *0.88 *−0.66 *−0.080.13
Land under perm. meadows and pastures (LMP)0.33−0.41−0.060.96 *0.520.40 * 0.340.54 *0.270.33−0.240.47 *0.43 *
Meat beef consumption per capita (MBC)0.21−0.270.460.28−0.100.56 *0.34 0.73 *0.74 *0.62 *−0.75 *−0.270.36 *
Meat total (incl. fish and seafood) consumption per capita (MTC)0.11−0.300.110.48 *0.310.79 *0.54 *0.73 * 0.68 *0.79 *−0.74 *−0.020.29
Milk consumption per capita (MC)0.16−0.170.190.250.080.80 *0.270.74 *0.68 * 0.78 *−0.81 *−0.160.29
Milk yield per animal (MYA)0.05−0.34−0.060.36 *0.240.88 *0.330.62 *0.79 *0.78 * −0.70 *0.000.18
Rural population percent (RPP)−0.090.27−0.25−0.19−0.10−0.66 *−0.24−0.75 *−0.74 *−0.81 *−0.70 * 0.17−0.23
Total population (TP)0.57 *−0.02−0.320.65 *0.70−0.080.47 *−0.27−0.02−0.160.000.17 0.46 *
Methane emission (CH4)0.96 *0.07−0.070.56 *0.160.130.43 *0.36 *0.290.290.18−0.230.46 *
* Significant correlations at 0.05 probability level.
Disclaimer/Publisher’s Note: The statements, opinions and data contained in all publications are solely those of the individual author(s) and contributor(s) and not of MDPI and/or the editor(s). MDPI and/or the editor(s) disclaim responsibility for any injury to people or property resulting from any ideas, methods, instructions or products referred to in the content.

