
The Influence of Street Components on Age Diversity: A Case Study on a Living Street in Shanghai

Abstract
1. Introduction
- To understand the quantification of age diversity and identify the relationships between street components and age diversity to identify critical elements.
- To focus on the critical elements to explain what kind of public space is most suitable for co-living and how space transformation can mitigate coexistence issues between the old and young.
- To provide insights for urban micro-renewal and offer valuable recommendations for revitalising streets and making cities more vibrant.
2. Review
2.1. Perspective
2.2. Environment Indicators
- (1)
- Street space usually referred to the physical components of the street created by architecture and zoning and included the street’s length and width [13,14,15,16], architectural features [13,14,15,25] (indicators generated by street architecture usually included facade continuity, facade sticker rate, and facade transparency), and traffic accessibility [12,13,18] (whether people could reach their destinations quickly and safely).
- (2)
- Street layout included sky openness [8,13] (usually determined by the proportions of buildings and streets, which affected people’s view), flatness of the pavement [11,13,14,17,18] (whether people could easily walk, which was related to the possibility of danger), colour aesthetic characteristics [13,14], and street connectivity [26] (the opportunity and convenience of coming to the street).
- (3)
- (4)
2.3. Demographic Index
2.4. Method
2.5. Summary
- The practise of micro-updating at the micro-scale level was not sufficient;
- The methods and framework for quantifying street space indicators were not comprehensive;
- In the design of demographic factors, age was not considered in sufficient depth, and the perspective of age diversity was lacking.
3. Research Design
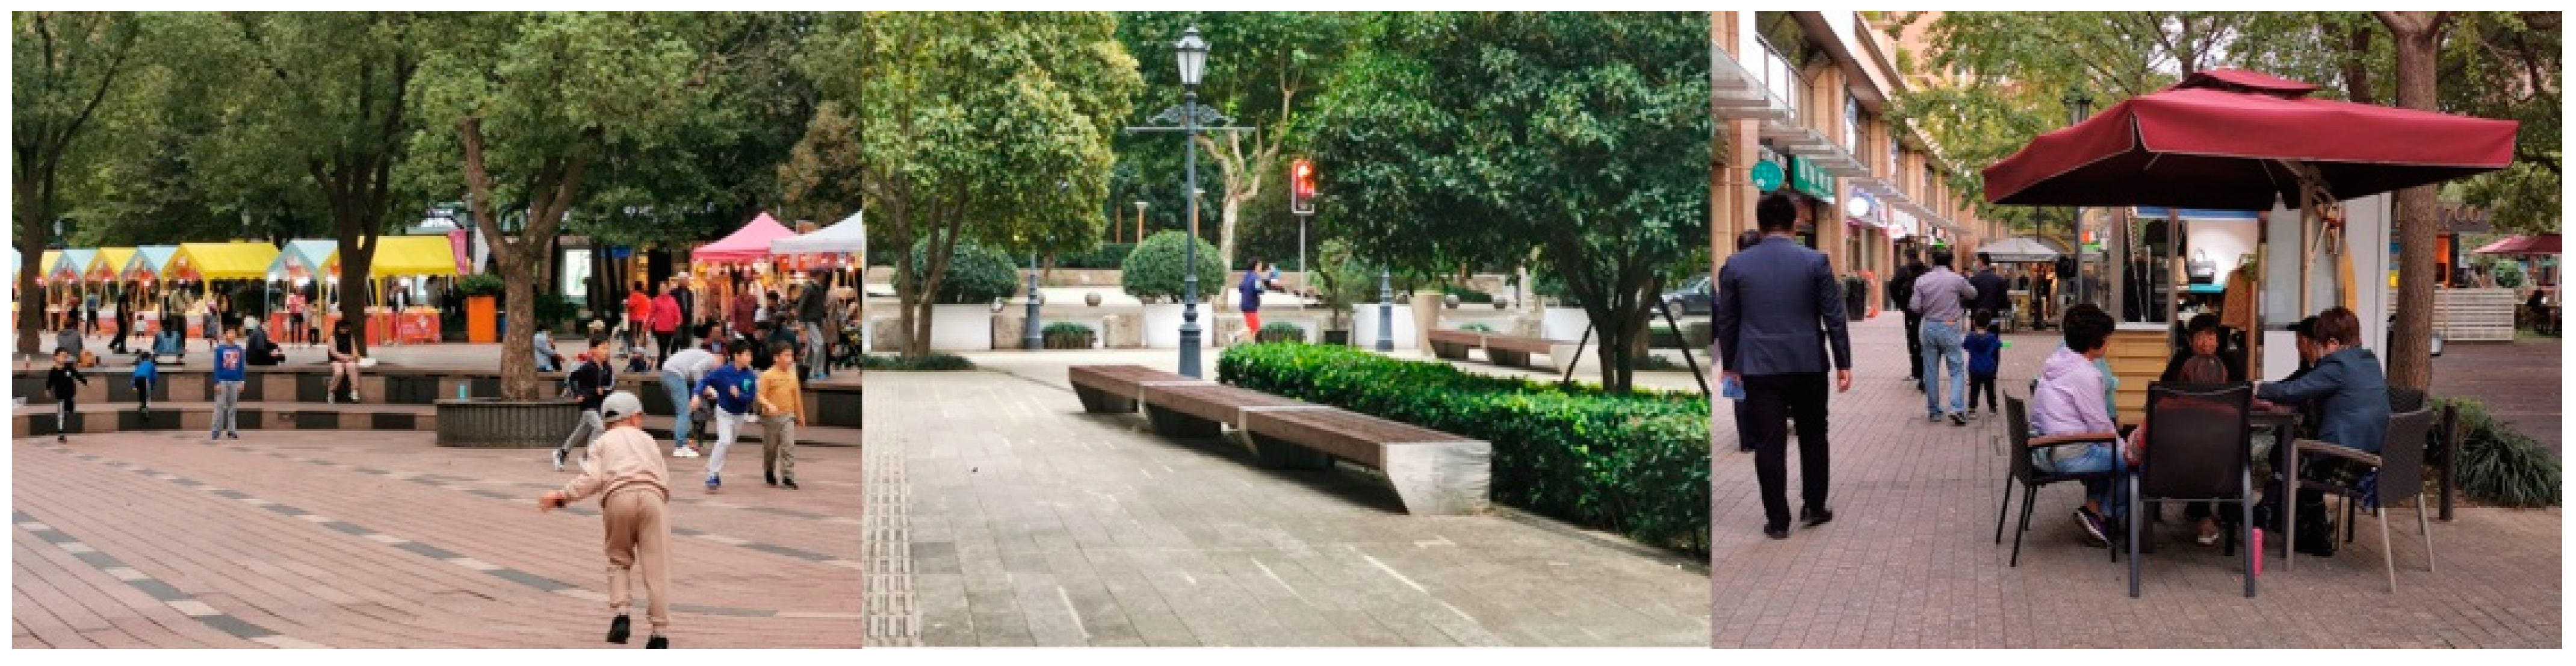
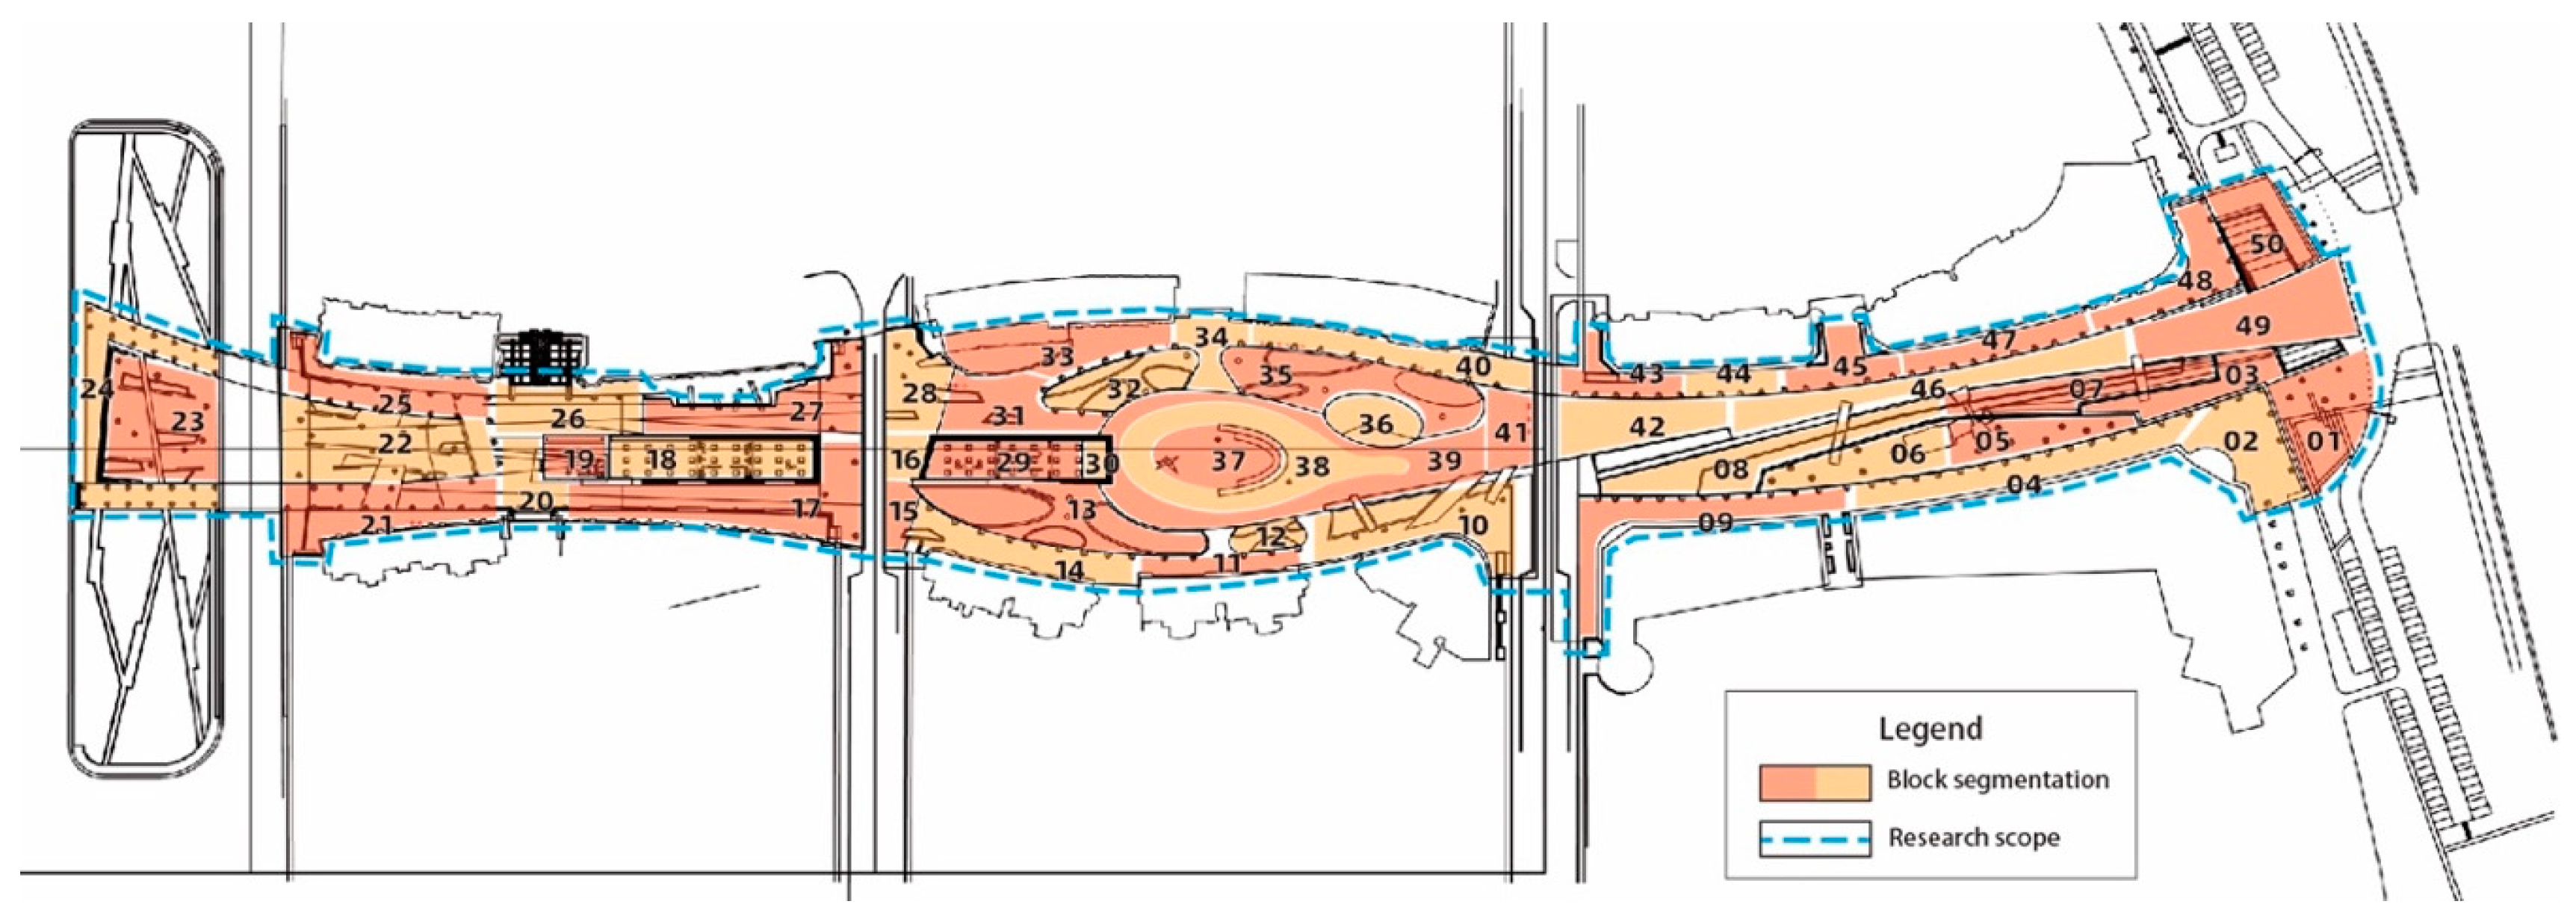
3.1. Research Scope
3.2. Research Object
3.2.1. Demographic Indicators
3.2.2. Spatial Indicators
3.3. Research Hypothesis
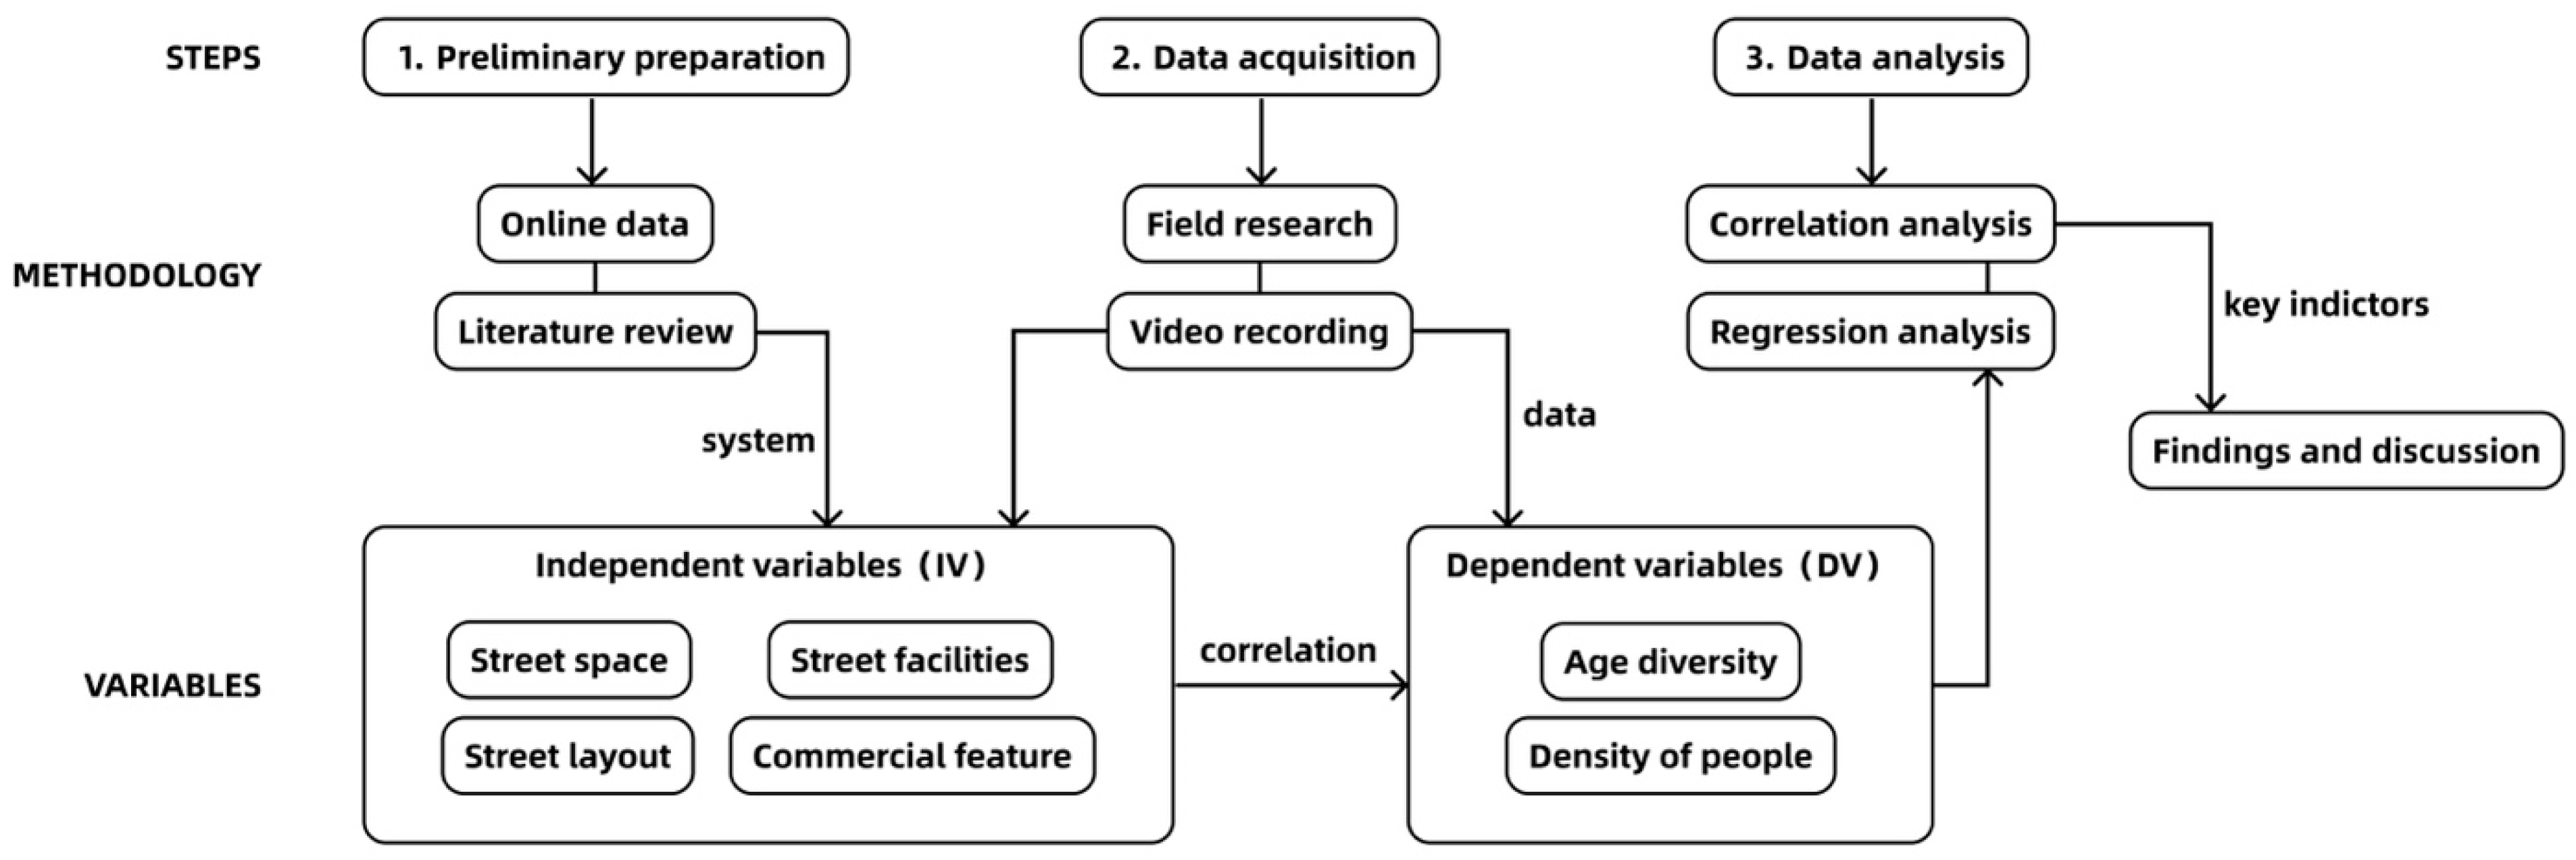
4. Methodology
4.1. Dependent Variables: Age Diversity and Crowd Density
4.2. Independent Variable: Living Street Components
4.3. Analytical Method
5. Findings
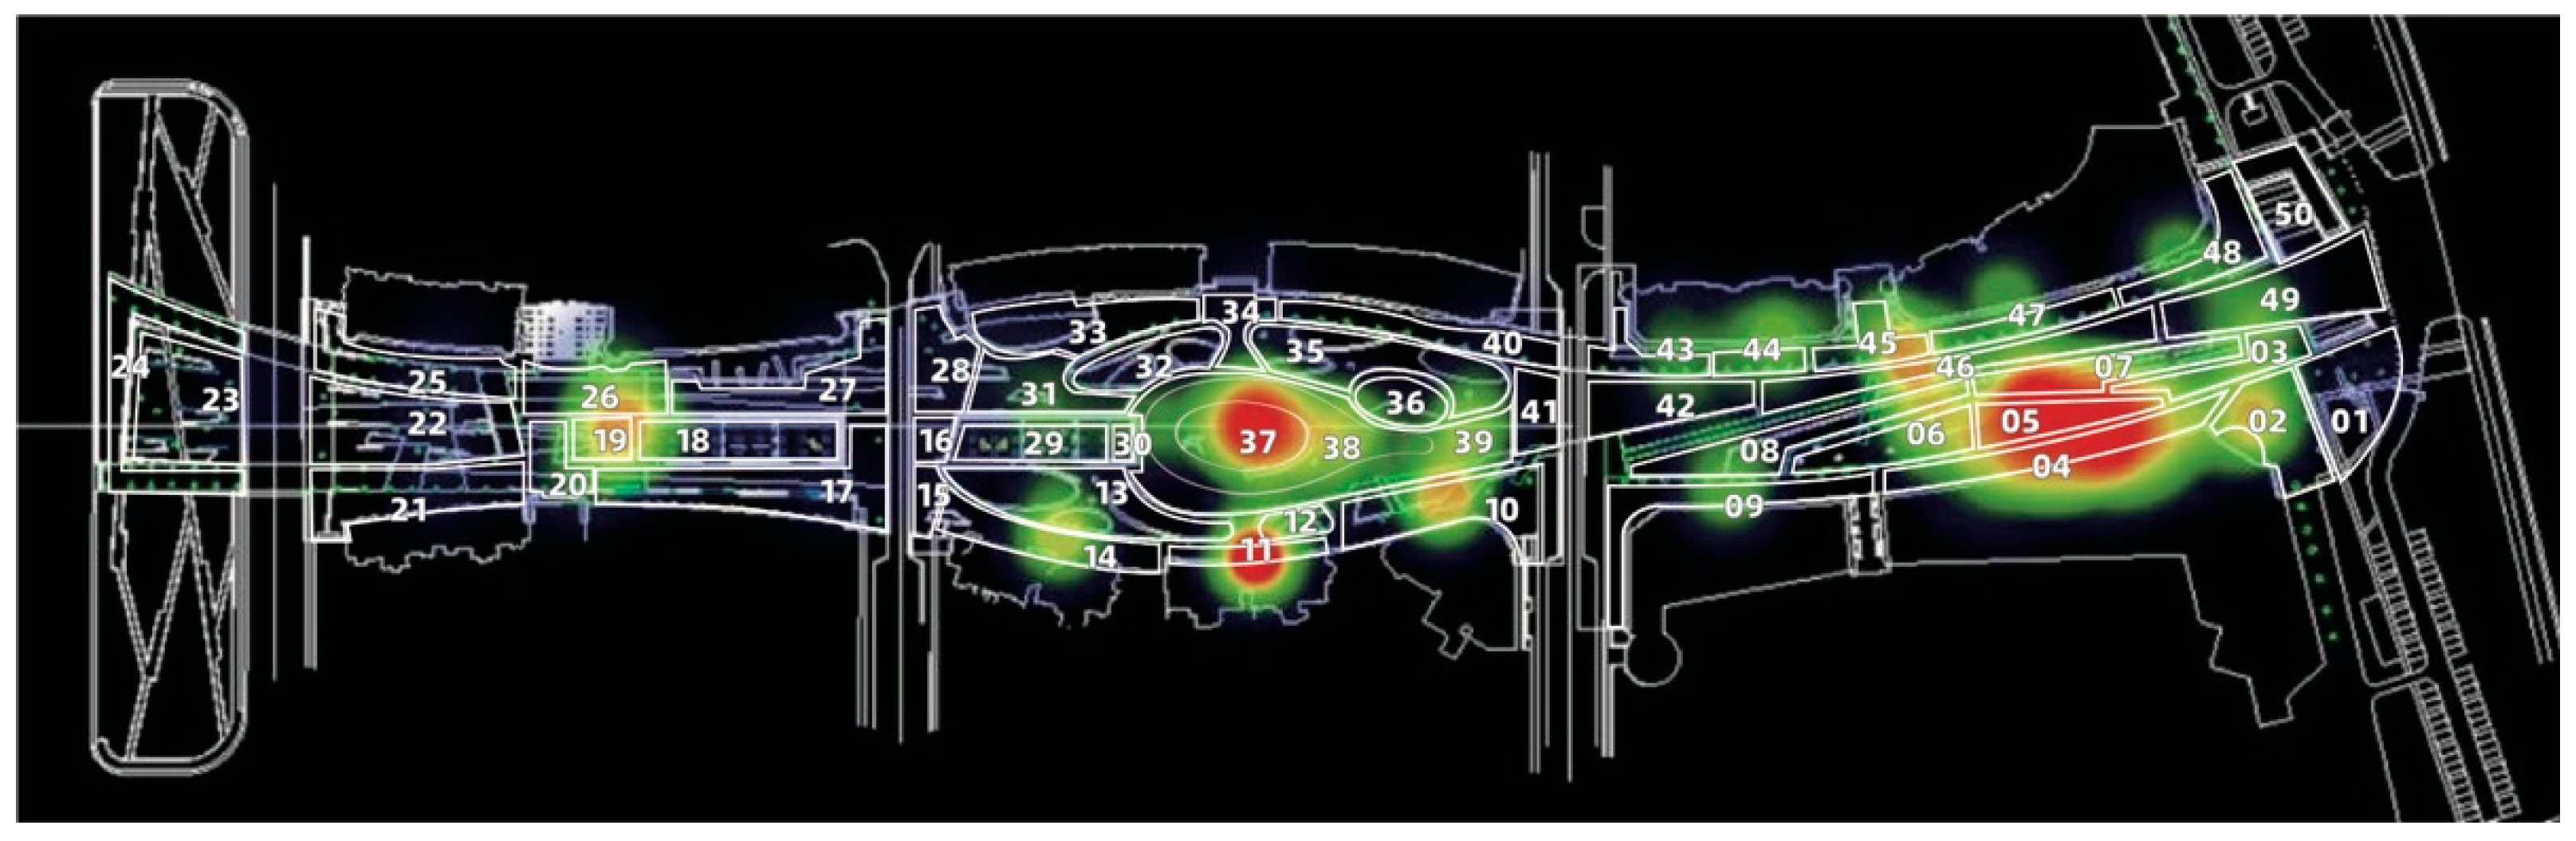
5.1. Analysis of Spatial Distribution Components of Street Crowd Density
5.2. Analysis of the Spatial Distribution Components of the Age Diversity of the Street Demographic
5.3. Correlation Analysis of Constituents Affecting Street Dynamics
5.3.1. Variable Correlation Test
5.3.2. Linear Regression Analysis
6. Discussion
6.1. Research Summary
6.1.1. Explanations of Age Diversity
6.1.2. Suggestions for Spatial Components
6.1.3. Insights for Management and Policy-Making
6.2. Limitations and Prospects for Urban Street Development
Author Contributions
Funding
Institutional Review Board Statement
Informed Consent Statement
Data Availability Statement
Conflicts of Interest
References
- Yildiz, S.; Kivrak, S.; Arslan, G. Contribution of built environment design elements to the sustainability of urban renewal projects: Model proposal. J. Urban Plan. Dev. 2019, 145, 04018045. [Google Scholar] [CrossRef]
- Gutman, R. The social function of the built environment. In The Mutual Interaction of People and Their Built Environment; De Gruyter Mouton: Berlin, Germany, 1976; pp. 37–51. [Google Scholar]
- Allocated, L.; Core, C. Streets as Public Spaces and Drivers of Urban Prosperity; UN-Habitat: Nairobi, Kenya, 2013; Volume 108. [Google Scholar]
- Jacobs, J. The Death and Life of Great American Cities; Vintage: New York, NY, USA, 2016. [Google Scholar]
- Sabatini, F.; Salcedo, R. Gated communities and the poor in Santiago, Chile: Functional and symbolic integration in a context of aggressive capitalist colonization of lower-class areas. Hous. Policy Debate 2007, 18, 577–606. [Google Scholar] [CrossRef]
- Carmona, M. Public Places, Urban Spaces: The Dimensions of Urban Design; Routledge: Abingdon-on-Thames, UK, 2010. [Google Scholar]
- Keyes, L.; Rader, C.; Berger, C. Creating communities: Atlanta’s lifelong community initiative. Phys. Occup. Ther. Geriatr. 2011, 29, 59–74. [Google Scholar] [CrossRef]
- Liu, S.; Lai, S. Factors influence users diversity of urban waterfront public spaces based on multi-source data. Landsc. Archit. 2021, 28, 75–81. [Google Scholar]
- Cain, K.L.; Millstein, R.A.; Sallis, J.F.; Conway, T.L.; Gavand, K.A.; Frank, L.D.; Saelens, B.E.; Geremia, C.M.; Chapman, J.; Adams, M.A. Contribution of streetscape audits to explanation of physical activity in four age groups based on the Microscale Audit of Pedestrian Streetscapes (MAPS). Soc. Sci. Med. 2014, 116, 82–92. [Google Scholar] [CrossRef]
- Long, Y.; Liu, L. How green are the streets? An analysis for central areas of Chinese cities using Tencent Street View. PLoS ONE 2017, 12, e0171110. [Google Scholar] [CrossRef]
- Mahmoudi, M.; Ahmad, F.; Abbasi, B. Livable streets: The effects of physical problems on the quality and livability of Kuala Lumpur streets. Cities 2015, 43, 104–114. [Google Scholar] [CrossRef]
- Steinmetz-Wood, M.; Velauthapillai, K.; O’Brien, G.; Ross, N.A. Assessing the micro-scale environment using Google Street View: The virtual systematic tool for evaluating pedestrian streetscapes (virtual-STEPS). BMC Public Health 2019, 19, 1246. [Google Scholar] [CrossRef]
- Zarin, S.Z.; Niroomand, M.; Heidari, A.A. Physical and social aspects of vitality case study: Traditional Street and modern street in Tehran. Procedia-Soc. Behav. Sci. 2015, 170, 659–668. [Google Scholar] [CrossRef]
- Kang, Y.-W.; Kim, J.-G.; Kim, Y.-J.; Oh, S.-H. A study on the evaluation and improvement for physical elements of Slow Street in the commercial area. KSCE J. Civ. Eng. 2015, 19, 1523. [Google Scholar] [CrossRef]
- Huang, D.; Dai, D. Effect of Living Street’s Components on Vitality—Taking Typical Streets in Shenzhen as an Example. Chin. Landsc. Archit. 2019, 35, 89–94. [Google Scholar]
- Chen, Y.; Zhao, X. Research on ground-floor interfaces along streets from the perspective of pedestrians: A case study of Huaihai Road in Shanghai. City Plan. Rev 2014, 38, 24–31. [Google Scholar]
- Hou, Y. Research on Park Characteristics Identification and Optimization Pattern Based on Leisure Physical Activity; Harbin Industrial University: Harbin, China, 2019. [Google Scholar]
- Jiang, L. Quantitative Assessment and Shaping Strategy of Vitality of Urban Streets; Dalian University of Technology: Dalian, China, 2013. [Google Scholar]
- Chapman, D.W. Applying macro urban morphology to urban design and development planning: Valletta and Floriana. Urban Morphol. 2006, 10, 23–40. [Google Scholar] [CrossRef]
- Mehanna, W.A.E.-H.; Mehanna, W.A.E.-H. Urban renewal for traditional commercial streets at the historical centers of cities. Alex. Eng. J. 2019, 58, 1127–1143. [Google Scholar] [CrossRef]
- Zhang, Z.; Wang, X.; Zhu, G.; Zhang, W.; Chen, L.; Fang, K.; Xie, Y.; Shen, M.; Furuya, N. A micro-scale study on the spontaneous spatial improvement of in-between spaces in Chinese traditional districts considering the relationship between modifications and encroachment. J. Asian Archit. Build. Eng. 2022, 22, 783–801. [Google Scholar] [CrossRef]
- Fang, K.; Wang, X.; Zhang, W.; Zhang, Z.; Xie, Y.; Chen, L.; Zhu, G.; Furuya, N. Characteristics of space network system formed by the constituent elements in urban streets: Tianzifang in Shanghai as a case study. J. Asian Archit. Build. Eng. 2021, 20, 627–639. [Google Scholar] [CrossRef]
- Sun, X.; Wang, L.; Wang, F.; Soltani, S. Behaviors of seniors and impact of spatial form in small-scale public spaces in Chinese old city zones. Cities 2020, 107, 102894. [Google Scholar] [CrossRef]
- Bansiya, J.; Davis, C.G. A hierarchical model for object-oriented design quality assessment. IEEE Trans. Softw. Eng. 2002, 28, 4–17. [Google Scholar] [CrossRef]
- Li, S.; Ma, S.; Tong, D.; Jia, Z.; Li, P.; Long, Y. Associations between the quality of street space and the attributes of the built environment using large volumes of street view pictures. Environ. Plan. B Urban Anal. City Sci. 2022, 49, 1197–1211. [Google Scholar] [CrossRef]
- Zlatkovic, M.; Zlatkovic, S.; Sullivan, T.; Bjornstad, J.; Shahandashti, S.K.F. Assessment of effects of street connectivity on traffic performance and sustainability within communities and neighborhoods through traffic simulation. Sustain. Cities Soc. 2019, 46, 101409. [Google Scholar] [CrossRef]
- Ozbil, A.; Gurleyen, T.; Yesiltepe, D.; Zunbuloglu, E. Comparative associations of street network design, streetscape attributes and land-use characteristics on pedestrian flows in peripheral neighbourhoods. Int. J. Environ. Res. Public Health 2019, 16, 1846. [Google Scholar] [CrossRef] [PubMed]
- Kitchin, R. The real-time city? Big data and smart urbanism. GeoJournal 2014, 79, 1–14. [Google Scholar] [CrossRef]
- Smith, G. Step away from stepwise. J. Big Data 2018, 5, 32. [Google Scholar] [CrossRef]
- Mehta, V. Lively streets: Determining environmental characteristics to support social behavior. J. Plan. Educ. Res. 2007, 27, 165–187. [Google Scholar] [CrossRef]
- Wineman, J.D.; Marans, R.W.; Schulz, A.J.; van der Westhuizen, D.L.; Mentz, G.B.; Max, P. Designing healthy neighborhoods: Contributions of the built environment to physical activity in Detroit. J. Plan. Educ. Res. 2014, 34, 180–189. [Google Scholar] [CrossRef]
- Gehl, J. Public Space & Public Life in Central Stockholm; The City: New York, NY, USA, 1991. [Google Scholar]
- Whyte, W.F. Street Corner Society: The Social Structure of an Italian Slum; University of Chicago Press: Chicago, IL, USA, 2012. [Google Scholar]
- Russell, E.; Skinner, M.W.; Fowler, K. Emergent challenges and opportunities to sustaining age-friendly initiatives: Qualitative findings from a Canadian age-friendly funding program. J. Aging Soc. Policy 2022, 34, 198–217. [Google Scholar] [CrossRef]
- Van Blerk, L. Diversity and difference in the everyday lives of Ugandan street children: The significance of age and gender for understanding the use of space. Soc. Dyn. 2006, 32, 47–74. [Google Scholar] [CrossRef]
- Moore, T.; Kesten, J.; López-López, J.A.; Ijaz, S.; McAleenan, A.; Richards, A.; Gray, S.; Savović, J.; Audrey, S. The effects of changes to the built environment on the mental health and well-being of adults: Systematic review. Health Place 2018, 53, 237–257. [Google Scholar] [CrossRef]
- Jacobs, A.B. Great Streets; University of California Transportation Center: Berkeley, CA, USA, 1993. [Google Scholar]
- Li, M.; Shen, Z.; Hao, X. Revealing the relationship between spatio-temporal distribution of population and urban function with social media data. GeoJournal 2016, 81, 919–935. [Google Scholar] [CrossRef]
- Paydar, M.; Kamani Fard, A. The impact of legibility and seating areas on social interaction in the neighbourhood park and plaza. Archnet-IJAR Int. J. Archit. Res. 2021, 15, 571–588. [Google Scholar] [CrossRef]
- Mehta, V. Lively Streets: Exploring the Relationship between Built Environment and Social Behavior; University of Maryland: College Park, MD, USA, 2006. [Google Scholar]
- Yip, P.S.; Tsang, E.W. Interpreting dummy variables and their interaction effects in strategy research. Strateg. Organ. 2007, 5, 13–30. [Google Scholar] [CrossRef]
- Li, Q.; Cui, C.; Liu, F.; Wu, Q.; Run, Y.; Han, Z. Multidimensional urban vitality on streets: Spatial patterns and influence factor identification using multisource urban data. ISPRS Int. J. Geo-Inf. 2021, 11, 2. [Google Scholar] [CrossRef]
- Gehl, J.; Kaefer, L.J.; Reigstad, S. Close encounters with buildings. Urban Des. Int. 2006, 11, 29–47. [Google Scholar] [CrossRef]
- Hall, E.T. The Hidden Dimension; Anchor: Albany, NY, USA, 1966; Volume 609. [Google Scholar]
- Tao, Z.; Cheng, Y.; Dai, T.; Rosenberg, M.W. Spatial optimization of residential care facility locations in Beijing, China: Maximum equity in accessibility. Int. J. Health Geogr. 2014, 13, 33. [Google Scholar] [CrossRef]
- Owen, N.; Cerin, E.; Leslie, E.; Coffee, N.; Frank, L.D.; Bauman, A.E.; Hugo, G.; Saelens, B.E.; Sallis, J.F. Neighborhood walkability and the walking behavior of Australian adults. Am. J. Prev. Med. 2007, 33, 387–395. [Google Scholar] [CrossRef]
- Lehto, X.Y.; Cai, L.A.; O’Leary, J.T.; Huan, T.-C. Tourist shopping preferences and expenditure behaviours: The case of the Taiwanese outbound market. J. Vacat. Mark. 2004, 10, 320–332. [Google Scholar] [CrossRef]
- Newbold, P. Statistics for Business and Economics; Pearson: New York, NY, USA, 2013. [Google Scholar]
- Li, X. Inclusive Design: Public space renewal strategy of communities for all ages. Urban Dev. Res. 2019, 26, 27–31. [Google Scholar]
- Mehta, V. The Street: A Quintessential Social Public Space; Routledge: Abingdon-on-Thames, UK, 2013. [Google Scholar]
- Fernando, N.A. Open-ended space: Urban streets in different cultural contexts. In Loose Space; Routledge: Abingdon-on-Thames, UK, 2006; pp. 54–72. [Google Scholar]
- Yung, E.H.; Conejos, S.; Chan, E.H. Social needs of the elderly and active aging in public open spaces in urban renewal. Cities 2016, 52, 114–122. [Google Scholar] [CrossRef]
- Ries, A.V.; Yan, A.F.; Voorhees, C.C. The neighborhood recreational environment and physical activity among urban youth: An examination of public and private recreational facilities. J. Community Health 2011, 36, 640–649. [Google Scholar] [CrossRef]
- Main, B.; Hannah, G.G. Site Furnishings: A Complete Guide to the Planning, Selection and Use of Landscape Furniture and Amenities; John Wiley & Sons: Hoboken, NJ, USA, 2010. [Google Scholar]
- Shaftoe, H. Convivial Urban Spaces: Creating Effective Public Places; Earthscan: Oxford, UK, 2012. [Google Scholar]
- Chen, L.; Ng, E. Outdoor thermal comfort and outdoor activities: A review of research in the past decade. Cities 2012, 29, 118–125. [Google Scholar] [CrossRef]


| Author | Mohadeseh Mahmoudi [11] | Madeleine Steinmetz-Wood [12] | Shadi Zang Zarin [13] | Youn-Won Kang [14] | |
|---|---|---|---|---|---|
| Dependent Variable Selection | Quality and liveability | Walking level | Relevance and availability, facility diversity, benefits, etc. | Importance and satisfaction | |
| Street Length and Width | √ * | √ | |||
| Street Spatial Features | Traffic Accessibility | √ | √ | √ | √ |
| Facade Characteristics | √ | √ | |||
| Garbage Can Density | √ | ||||
| Street Furnishings | Rest Seat Density | √ | √ | √ | √ |
| Green View Rate | √ | √ | √ | ||
| Street Layout Features | Sky Openness | √ | |||
| Flat Pavement | √ | √ | √ | ||
| Colour Aesthetic Characteristics | √ | √ | √ | √ | |
| Commercial Features | Store Density | √ | |||
| Business Mix | |||||
| Social Places Density | |||||
| Surrounding Dwelling Density | √ | ||||
| Data Acquisition | Questionnaire | Google Street View | Field research, questionnaire survey | Field research | |
| Technical Method | Correlation analysis | Virtual-STEPS | Correlation analysis, regression analysis | IPA analysis | |
| Research Area | Street (2) | Community (40) | Street (2) | Street (2) |
| Author | Huang Dan [15] | Liu Song [8] | Chen Yong [16] | Hou Yunjing [17] | Long Ying [10] | Jiang Lei [18] | |
|---|---|---|---|---|---|---|---|
| Dependent Variable Selection | Number of residents, time-age structure, and type of behaviour | Demographic density and age diversity | Stay activity density | Recreational physical activity capacity | Intensity of tourists’ walking and parking behaviour | Number and length of stays | |
| Street Spatial Features | Street Length and Width | √ * | √ | √ | √ | ||
| Traffic Accessibility | √ | √ | |||||
| Facade Characteristics | √ | √ | √ | ||||
| Street Furnishings | Garbage Can Density | √ | √ | ||||
| Rest Seat Density | √ | √ | √ | √ | |||
| Green View Rate | √ | √ | √ | √ | √ | ||
| Street Layout Features | Sky Openness | √ | √ | ||||
| Flat Pavement | √ | √ | √ | √ | |||
| Colour Aesthetic Characteristics | |||||||
| Store Density | √ | √ | √ | √ | |||
| Commercial Features | Business Mix | √ | √ | √ | |||
| Social Places Density | √ | √ | √ | ||||
| Surrounding Dwelling Density | √ | √ | |||||
| Organisational Features | Structural Topological Relationship | √ | |||||
| Data Acquisition | Field research | Cell phone signalling | Field research | Network research, visual analysis | Field research, machine algorithms | On-site observation, online inquiry | |
| Technical Method | Linear regression, one-way variance | Correlation analysis, linear regression | Multiple logistic regression | Space syntax | Linear regression | Correlation analysis | |
| Research Area | Street (19) | Waterfront Space (85) | Street Section (17) | Park (16) | Street (144) | Street (8) |
| Major Categories | Minor Categories |
|---|---|
| Retail Shopping | Daily Use |
| Clothing Accessories | |
| Specialty Stores | |
| General Department Store | |
| Catering | Mobile Booths |
| Catering | |
| Leisure and Entertainment | Leisure and Entertainment |
| Education and Training | |
| Family Services | |
| Services | Medical Insurance |
| Financial Insurance |
| Indicators | Calculation Mode | |
|---|---|---|
| Street Space | Street length | Map survey |
| Street width | Map survey | |
| Facade transparency | (Length of A interface × 1.25 + length of B interface length + length of interface C × 0.75)/total length of the building interface | |
| Facade sticker rate | Floor area/total street length | |
| Street Facilities | Seat density | (Number of rattan chairs + number of plastic seats + length of wooden benches/1.2) |
| Trash can density | Number of trash cans/place area | |
| Amusement facility density | Number of amusement facilities/place area | |
| Street Layout | Proportion of walking area | Walking area/place area |
| Street connectivity | Number of secondary spaces connected to each place | |
| Commercial features | Commercial stores | Binary variable |
| Crowd Density | Age Diversity | |
|---|---|---|
| Proportion of Walking Area | 0.359 ** | 0.171 |
| Street Length | 0.095 | −0.059 |
| Street Width | −0.499 *** | 0.09 |
| Seat Density | 0.33 ** | −0.266 |
| Facade Sticker Rate | 0.239 | −0.475 *** |
| Facade Transparency | −0.063 | 0.326 ** |
| Trash Can Density | 0.122 | 0.123 |
| Street Connectivity | 0.232 | 0.026 |
| Number of Amusement Facilities | 0.069 | 0.421 *** |
| Retail Shopping | −0.168 | −0.13 |
| Catering | 0.385 *** | −0.109 |
| Leisure and Entertainment | 0.035 | −0.382 *** |
| Services | −0.036 | 0.185 |
| Nonstandardised Coefficient | Standardised Coefficient | t | p | Collinearity Diagnosis | |||
|---|---|---|---|---|---|---|---|
| B | Standard Error | Beta | VIF | Tolerance | |||
| Constant | 0.113 | 0.080 | - | 1.413 | 0.165 | - | - |
| Proportion of Walking Area | 0.177 | 0.068 | 0.295 | 2.610 | 0.012 ** | 1.124 | 0.890 |
| Street Width | −0.006 | 0.002 | −0.331 | −2.875 | 0.006 *** | 1.168 | 0.856 |
| Seat Density | 0.001 | 0.001 | 0.257 | 2.332 | 0.024 ** | 1.068 | 0.936 |
| Catering | 0.129 | 0.040 | 0.347 | 3.231 | 0.002 *** | 1.016 | 0.984 |
| R2 | 0.489 | ||||||
| F | F (4.45) =10.777, p = 0.000 | ||||||
| D-W | 1.776 | ||||||
| Nonstandardised Coefficient | Standardised Coefficient | t | p | Collinearity Diagnosis | |||
|---|---|---|---|---|---|---|---|
| B | Standard Error | Beta | VIF | Tolerance | |||
| Constant | 0.777 | 0.147 | - | 5.266 | 0.000 *** | - | - |
| Facade Sticker Rate | −0.206 | 0.104 | −0.407 | −1.989 | 0.053 | 3.282 | 0.305 |
| Facade Transparency | −0.016 | 0.137 | −0.023 | −0.115 | 0.909 | 3.139 | 0.319 |
| Number of Amusement Facilities | 0.162 | 0.066 | 0.296 | 2.467 | 0.018 ** | 1.128 | 0.886 |
| Leisure and Entertainment | −0.129 | 0.048 | −0.307 | −2.688 | 0.010 ** | 1.024 | 0.977 |
| R2 | 0.427 | ||||||
| F | F (4.45) = 8.395, p = 0.000 | ||||||
| D-W | 1.717 | ||||||
Disclaimer/Publisher’s Note: The statements, opinions and data contained in all publications are solely those of the individual author(s) and contributor(s) and not of MDPI and/or the editor(s). MDPI and/or the editor(s) disclaim responsibility for any injury to people or property resulting from any ideas, methods, instructions or products referred to in the content. |
© 2023 by the authors. Licensee MDPI, Basel, Switzerland. This article is an open access article distributed under the terms and conditions of the Creative Commons Attribution (CC BY) license (https://creativecommons.org/licenses/by/4.0/).
Share and Cite
An, D.; Liu, Y.; Huang, Y. The Influence of Street Components on Age Diversity: A Case Study on a Living Street in Shanghai. Sustainability 2023, 15, 10493. https://doi.org/10.3390/su151310493
An D, Liu Y, Huang Y. The Influence of Street Components on Age Diversity: A Case Study on a Living Street in Shanghai. Sustainability. 2023; 15(13):10493. https://doi.org/10.3390/su151310493
Chicago/Turabian StyleAn, Dadi, Yan Liu, and Yihua Huang. 2023. "The Influence of Street Components on Age Diversity: A Case Study on a Living Street in Shanghai" Sustainability 15, no. 13: 10493. https://doi.org/10.3390/su151310493
APA StyleAn, D., Liu, Y., & Huang, Y. (2023). The Influence of Street Components on Age Diversity: A Case Study on a Living Street in Shanghai. Sustainability, 15(13), 10493. https://doi.org/10.3390/su151310493