Article

Spatial Distribution and Future Projections of Thermal Comfort Conditions during the Hot Period of the Year in Diyarbakır City, Southeastern Turkey

1
Republic of Turkey Ministry of National Education, Amasya 05100, Turkey
2
Climate Change and Policies Implementation and Research Center, Boğaziçi University, Istanbul 34342, Turkey
*
Author to whom correspondence should be addressed.
Sustainability 2023, 15(13), 10473; https://doi.org/10.3390/su151310473
Submission received: 20 May 2023 / Revised: 23 June 2023 / Accepted: 26 June 2023 / Published: 3 July 2023
(This article belongs to the Special Issue Climate Change and Urban Thermal Effects)

Abstract

:
Cities are highly vulnerable areas affected by climate change. For sustainable urbanization, it is of great importance to determine the thermal conditions in cities and to make predictions for the future. Therefore, in this study, the spatial distribution of the thermal comfort conditions in the city of Diyarbakır, located in the southeastern Turkey, during the hot period of the year is explained and predictions for the future are made. In the study, measurement data from meteorological stations and the data of the SSP-2 and SSP-5 scenarios were used. Thermal comfort conditions were determined according to the PET (physiological equivalent temperature) index using RayMan software. The ArcGIS 10.5 program was used for defining the spatial distribution of thermal comfort conditions. As a result of the study, it is seen that the areas with dense construction and a low amount of green area in the old urbanized area, which is the central business district (CBD), have uncomfortable conditions. It is predicted that uncomfortable areas will increase in the near and distant future and threaten human health. For climate-resilient, healthy, and comfortable cities that can adapt to adverse effects of climate change, urban design and planning should be carried out with a holistic perspective.

1. Introduction

Climate conditions, defined as the average of long-term weather conditions, directly and indirectly affect people’s lifestyles, economic activities, settlement, and dwelling types. Climate has affected human life since the early ages. The choice of the first settlements, the way houses were built, the plans of settlements, etc., have been decisive for human activities. For this reason, climate events are frequently used in literature, poetry, proverbs, and folk songs [1,2,3]. It is known that climate conditions have tended to change since the formation of the Earth. Since the industrial revolution, this trend in the change in climate has gained a different dimension due to anthropogenic factors such as increase in human population, improper land use, increased consumption of more natural resources, generation of domestic and industrial wastes, etc. This change causes the loss of flora and fauna, causing many species to disappear. Rapid and sudden warming climatic conditions exceed the adaptive capacity of nature and human beings [4].
Extreme weather events (heat waves, etc.) in the last century have made it widespread to analyze thermal comfort conditions closely related to human life and to reveal their spatial distribution. It has been explained in many studies that thermal comfort conditions affect cardiovascular diseases, respiratory system diseases, and mortality [5,6,7,8,9]. It is stated that cities are among the leading areas to be affected by changing climatic conditions and that disaster-scale impacts will be experienced in cities in the coming years [10,11,12]. Cities constitute the source of socioeconomic development, scientific discoveries, and cultural progress, and are the intangible and tangible universal heritage sites of human history. In addition to these, the growth of urban areas with the migration movement from rural to urban areas, the increase in the use of motor vehicles, the increase in asphalt and concrete surfaces, the destruction of natural areas, the increase in domestic and industrial wastes have caused climatic conditions in cities to differentiate and transform cities into sensitive areas [13,14,15,16,17]. Cities have higher temperatures compared to their surroundings than semirural and rural areas [14,15,16]. Therefore, it is of great importance to determine the thermal comfort conditions in the cities, especially in the hot period and to make predictions for the future. Thermal comfort can be defined as the state of feeling comfortable or happy in the environment or thermal environment (mainly temperature, humidity, wind climatology) [18,19]. Uncomfortable conditions adversely affect people’s health and work efficiency and lead to many social, economic, and physical negativities such as increases in energy use [20,21,22,23,24,25].
Many countries have begun to experience some problems due to climate change. These are floods, overflows, flash floods, urban floods, drought, heat waves, urban heat islands, forest fires, and public health problems [26,27,28,29]. Therefore, in recent years, there have been studies on the thermal comfort conditions in cities in different countries of the world from many disciplines. These studies have been widely conducted in Canada [30], USA [31], Poland [32], Italy [33], Hungary [34], and Cuba [35]. In Turkey, thermal comfort conditions of cities in Erzurum [36], Ankara [37] and Eskişehir [17] have been studied. In these studies, the current thermal comfort conditions in the cities have been examined.
In China and many Asian countries, it has been reported that more than 50 percent of newly developed urban areas will be spread over existing cultivated areas due to urban expansion [38]. This situation will cause urban areas to expand further and become very vulnerable in terms of being affected by climate change. Studies on the effects of climate change on the thermal comfort conditions in cities or inferences for the future have remained limited. In Germany, the number and duration of heat stresses are projected to increase in the coming decades (2031–2050), and humid, hot conditions are expected to prevail [39]. In Hong Kong, China [40], and Freiburg, Germany, the effect of climate change on the thermal comfort conditions in the city was explained [41]; in Athens, Greece, the effect of climate change on tourism thermal comfort conditions was examined [42], and in Argentina, the effects of climate change on the thermal comfort and design of buildings were revealed [43]. In Turkey, which is one of the most vulnerable countries to be affected by climate change, the effect of climate change on thermal comfort conditions has been studied for tourism in the Western Mediterranean Region [44,45]. Studies on the impact of climate change on the thermal comfort conditions in cities and developing projections for the future were limited to Amasya [46] and Bolu [47].
According to many studies that account for the changes between the middle and the end of the century, air temperatures in Turkey, along with many other countries in the Mediterranean Basin, in the coming decades will be higher in the warmer part of the year (e.g., summer); for example, toward the end of the century temperatures will be 3 to 7 °C higher than today [48,49]. In Turkey, almost all cities, large and small, are warming rapidly. In the Southeastern Anatolia Region, the number of summers with tropical-day air temperatures, record high air temperatures, hot weather frequency, and the duration, frequency, and intensities of the heat waves are increasing rapidly (with statistical significance) [50]. All of these results show that climatic thermal comfort is deteriorating rapidly even today, and this deterioration or negativity may become more severe in the future.
This study aims to analyze the thermal comfort conditions in Diyarbakır, a historical city with hot and dry conditions in summers, located in the Southeast Anatolia Region of Turkey and characterized by a dry summer, subtropical Mediterranean climate having a dry–subhumid climate type, and to make predictions for the future. The city of Diyarbakır is located in the hot climate zone. Therefore, thermal comfort conditions that are risky for human health are expected during the hot period of the year [50]. Therefore, it is aimed to examine the land characteristics of the city due to urbanization and to make predictions about the urban land cover in the near future (2021–2050) and distant future (2071–2100), to determine the spatial distribution of today’s thermal comfort conditions in the hot period of the year, and to make predictions about the near future (2021–2050) and distant future (2071–2100). The determination of hourly and daily thermal comfort conditions is also an important issue. This issue can be explained in a different study. It is aimed at making suggestions about the measures to be taken in cities in terms of adaptation to adverse thermal comfort conditions, climate resilience, and climate change.

2. Materials and Methods

General Physical Geography Features

Diyarbakır is at level-3 in the Şanlıurfa Subregion of the Southeastern Anatolia Region according to NUTS (Nomenclature of Territorial Units for Statistics). Geographically, it is located in the Tigris Section of the Southeastern Anatolia Region, between 38°02′ and 37°48′ north latitudes and 40°18′ and 40°01′ east longitudes. The city of Diyarbakır, which has the status of a metropolitan city, consists of the district centers of Bağlar, Kayapınar, Yenişehir, and Sur (Figure 1).
The city was founded on a broad basalt plateau extending horizontally on the eastern edge of the Tigris River valley [51]. Diyarbakir is one of the oldest settlements in the Anatolia, as it is located on the city trade routes established by the Tigris River, and it is also a city of history, culture, and civilizations.
According to the Köppen–Geiger climate classification, Diyarbakır has a dry summer Mediterranean climate (Csa) with hot and dry summers and rainy winters [52]. According to long-term averages, the average mean annual temperature is 15.9 °C, rising to 38.4 °C in summer and falling to −2.2 °C in winter. The average relative humidity is 55.2% and the total annual rainfall is 498.4 mm. The maximum precipitation falls in the winter and spring seasons and drought is experienced in the summer season. The average wind velocity is 1.1 m/s. The average and extreme values for Diyarbakır are given in Table 1.
Land use characteristics of the urban area were obtained from Corine and Urban Atlas data at 100 m resolution [53]. Shared socioeconomic pathways (SSPs) were utilized for projections on land use characteristics. The SSP scenarios consist of projections at ten-year intervals from the global 1 km reduced urban land extent projection spatial urban land fraction data by 2000–2100 [54]. Among the SSP scenarios, the data from the moderate SSP-2 (RCP4.5) and the worst SSP-5 (RCP8.5) scenarios were used. SSP scenarios are prepared in the IPCC 6th Assessment Report and are expressed as the scenarios for the 21st century. They were published in 2022 and are the most up-to-date scenarios. These scenarios cover socioeconomic parameters such as population, economic growth, education, urbanization, and technological development rates. For the future, the SSP-2 scenario, which is based on change according to today’s rates of change, and the SSP-5 scenario, which may be more unfavorable, is preferred in the study [55]. From these data, predictions were made for the land characteristics of the city in 2050 and 2100.
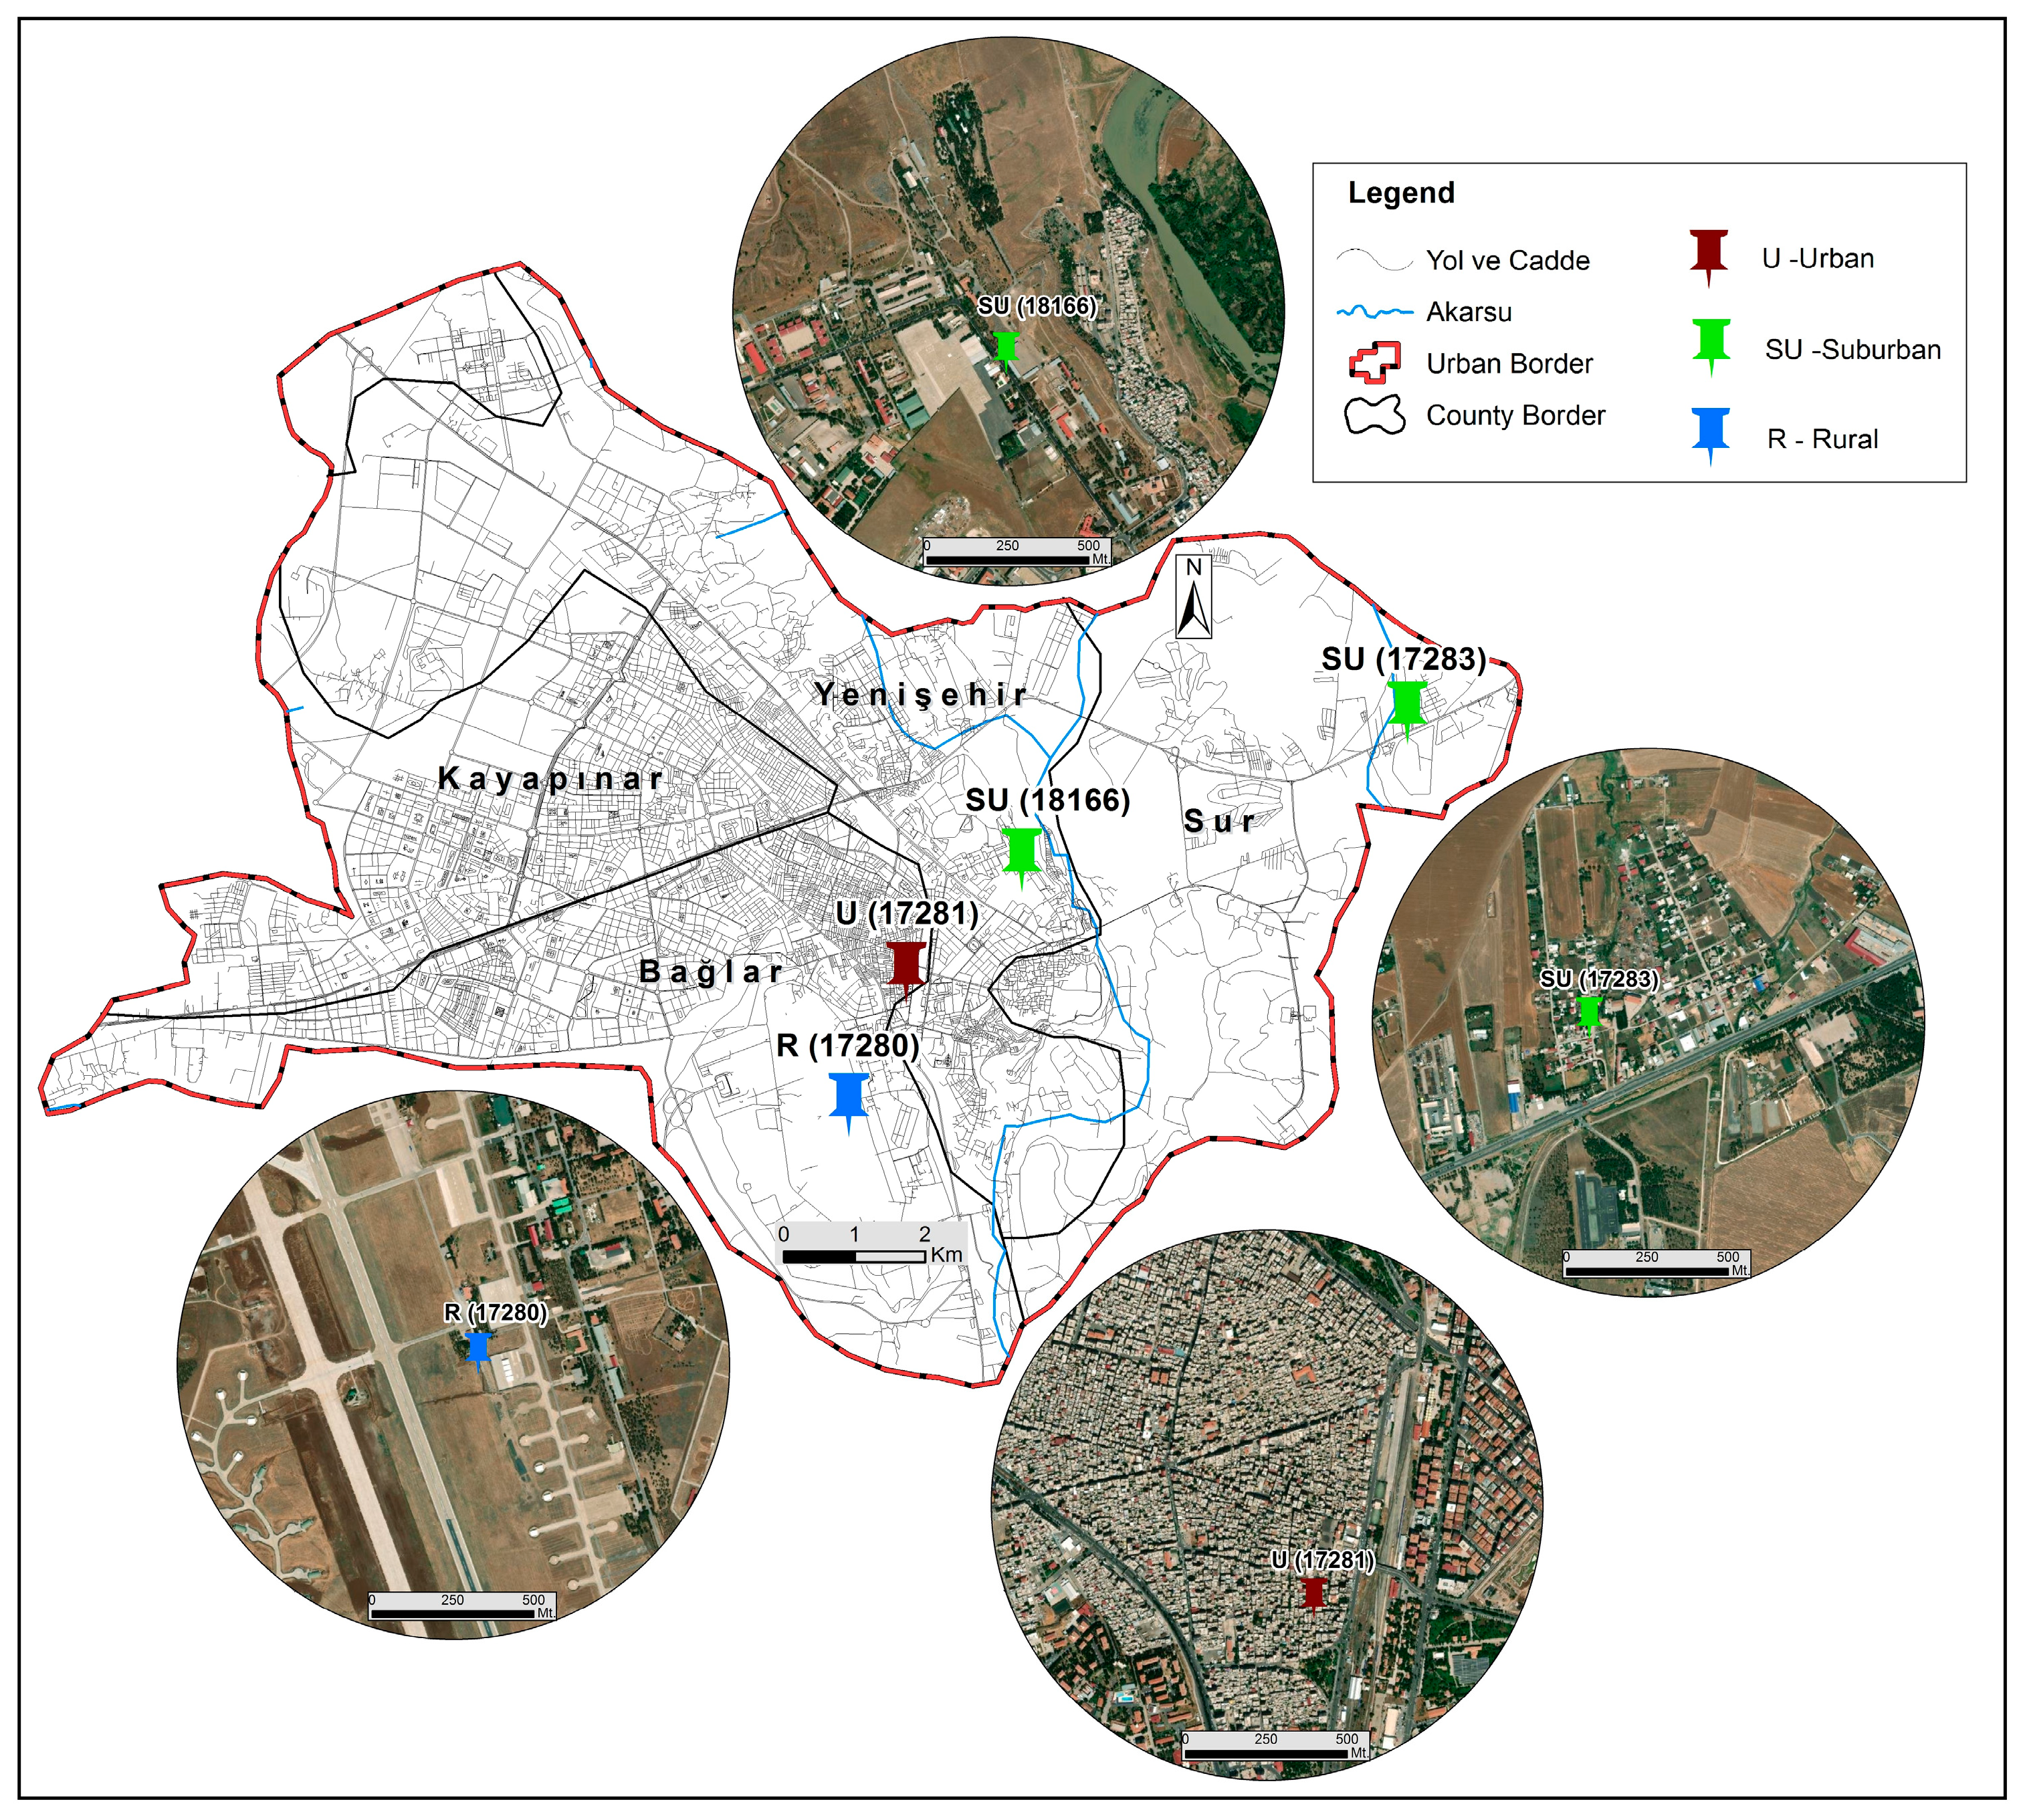
In the study, the measurement data from four meteorological stations with different terrain characteristics in the city between 2015 and 2021 (7 years) were used to determine the current thermal comfort conditions. Measurement data from the following stations were used: Diyarbakır Regional Meteorology Station with national code 17281 represented the urban area; Sur/Ünal Erkan Heliport with national code 17283 and Eşref Bitlis Heliport with national code 18166 represented the semiurban area; and Diyarbakır Airport meteorology station with national code 17280 represented the rural area (Figure 2). Hourly air temperature (°C), relative humidity (%), wind velocity (m/s), and cloud cover (octa) data were used. Monthly averages of all hourly PET values were taken.
The meteorology stations used in the study are located at altitudes close to each other and on different terrains. Some information about the stations is given in Table 2. The land features were determined by considering the building and settlement densities in the area where the stations are located (Figure 2 and Table 2).
The projected data based on the SSP-2 and SSP-5 scenarios were used to determine thermal comfort conditions for the near future (2021–2050) and distant future (2071–2100) projections. Climate projection data were obtained from the Turkish General Directorate of Meteorology. The data for the SSP2 and SSP5 scenarios of the Global Change Assessment Model (GCAM) of CMIP 6 were used. These scenarios are based on five different basic approaches. Among these, SSP-2 is the scenario with moderate challenges for mitigation and adaptation, and SSP-5 is the scenario in which fossil fuel use is at the forefront, with high-level challenges in mitigation and low-level challenges in adaptation. Therefore, these scenarios were used in the study [56]. The daily data used were air temperature (°C), relative humidity (%), wind velocity (m/s), and solar radiation (w/m2). Since there is no cloud cover in the projection data, solar radiation data were used instead.
Thermal comfort conditions were determined according to the PET (physiological equivalent temperature) index using the RayMan model, which is a radiation model and widely used. PET index determines human thermal comfort according to body heat energy balance. The index takes into account all effects of the thermal environment (global radiation, air temperature, relative humidity, and wind speed) and the thermophysiological conditions of the human body (clothing type and activity) [57,58,59]. For this reason and because it is widely used in many studies worldwide, the PET index was preferred in this study. After creating station information (altitude, latitude, longitude, time zone) in RayMan software calculates the short-wave radiation and long-wave radiation according to the day and time of the year. The formula (Equation (1)) developed by Höppe [59] is used to calculate the index.
M + W + Q*(Tmrt,v) + QH(Ta,v) + QL(e,v) + QSW(e,v) + QRe(Ta,e) + S = 0
where M is the metabolic rate (activity), W is mechanical power (type of activity), Q* is radiation budget, QH is change in sensed temperature, QL is change in latent heat (evaporation), QSW is distribution of latent heat through perspiration, QRe heat exchange through respiration (sensible and latent heat exchange temperature), S is storage, Ta (°C) is air temperature, e (hPa) is vapor pressure, v (m/s) is wind velocity, and Tmrt (°C) is mean radiant temperature.
Since thermal comfort can be expressed subjectively, a 35-year-old, 175 cm tall, 75 kg healthy male individual with a clothing load of 0.9 clo and a workload of 80 W is taken into consideration when determining the comfort ranges for the PET index (Table 3).
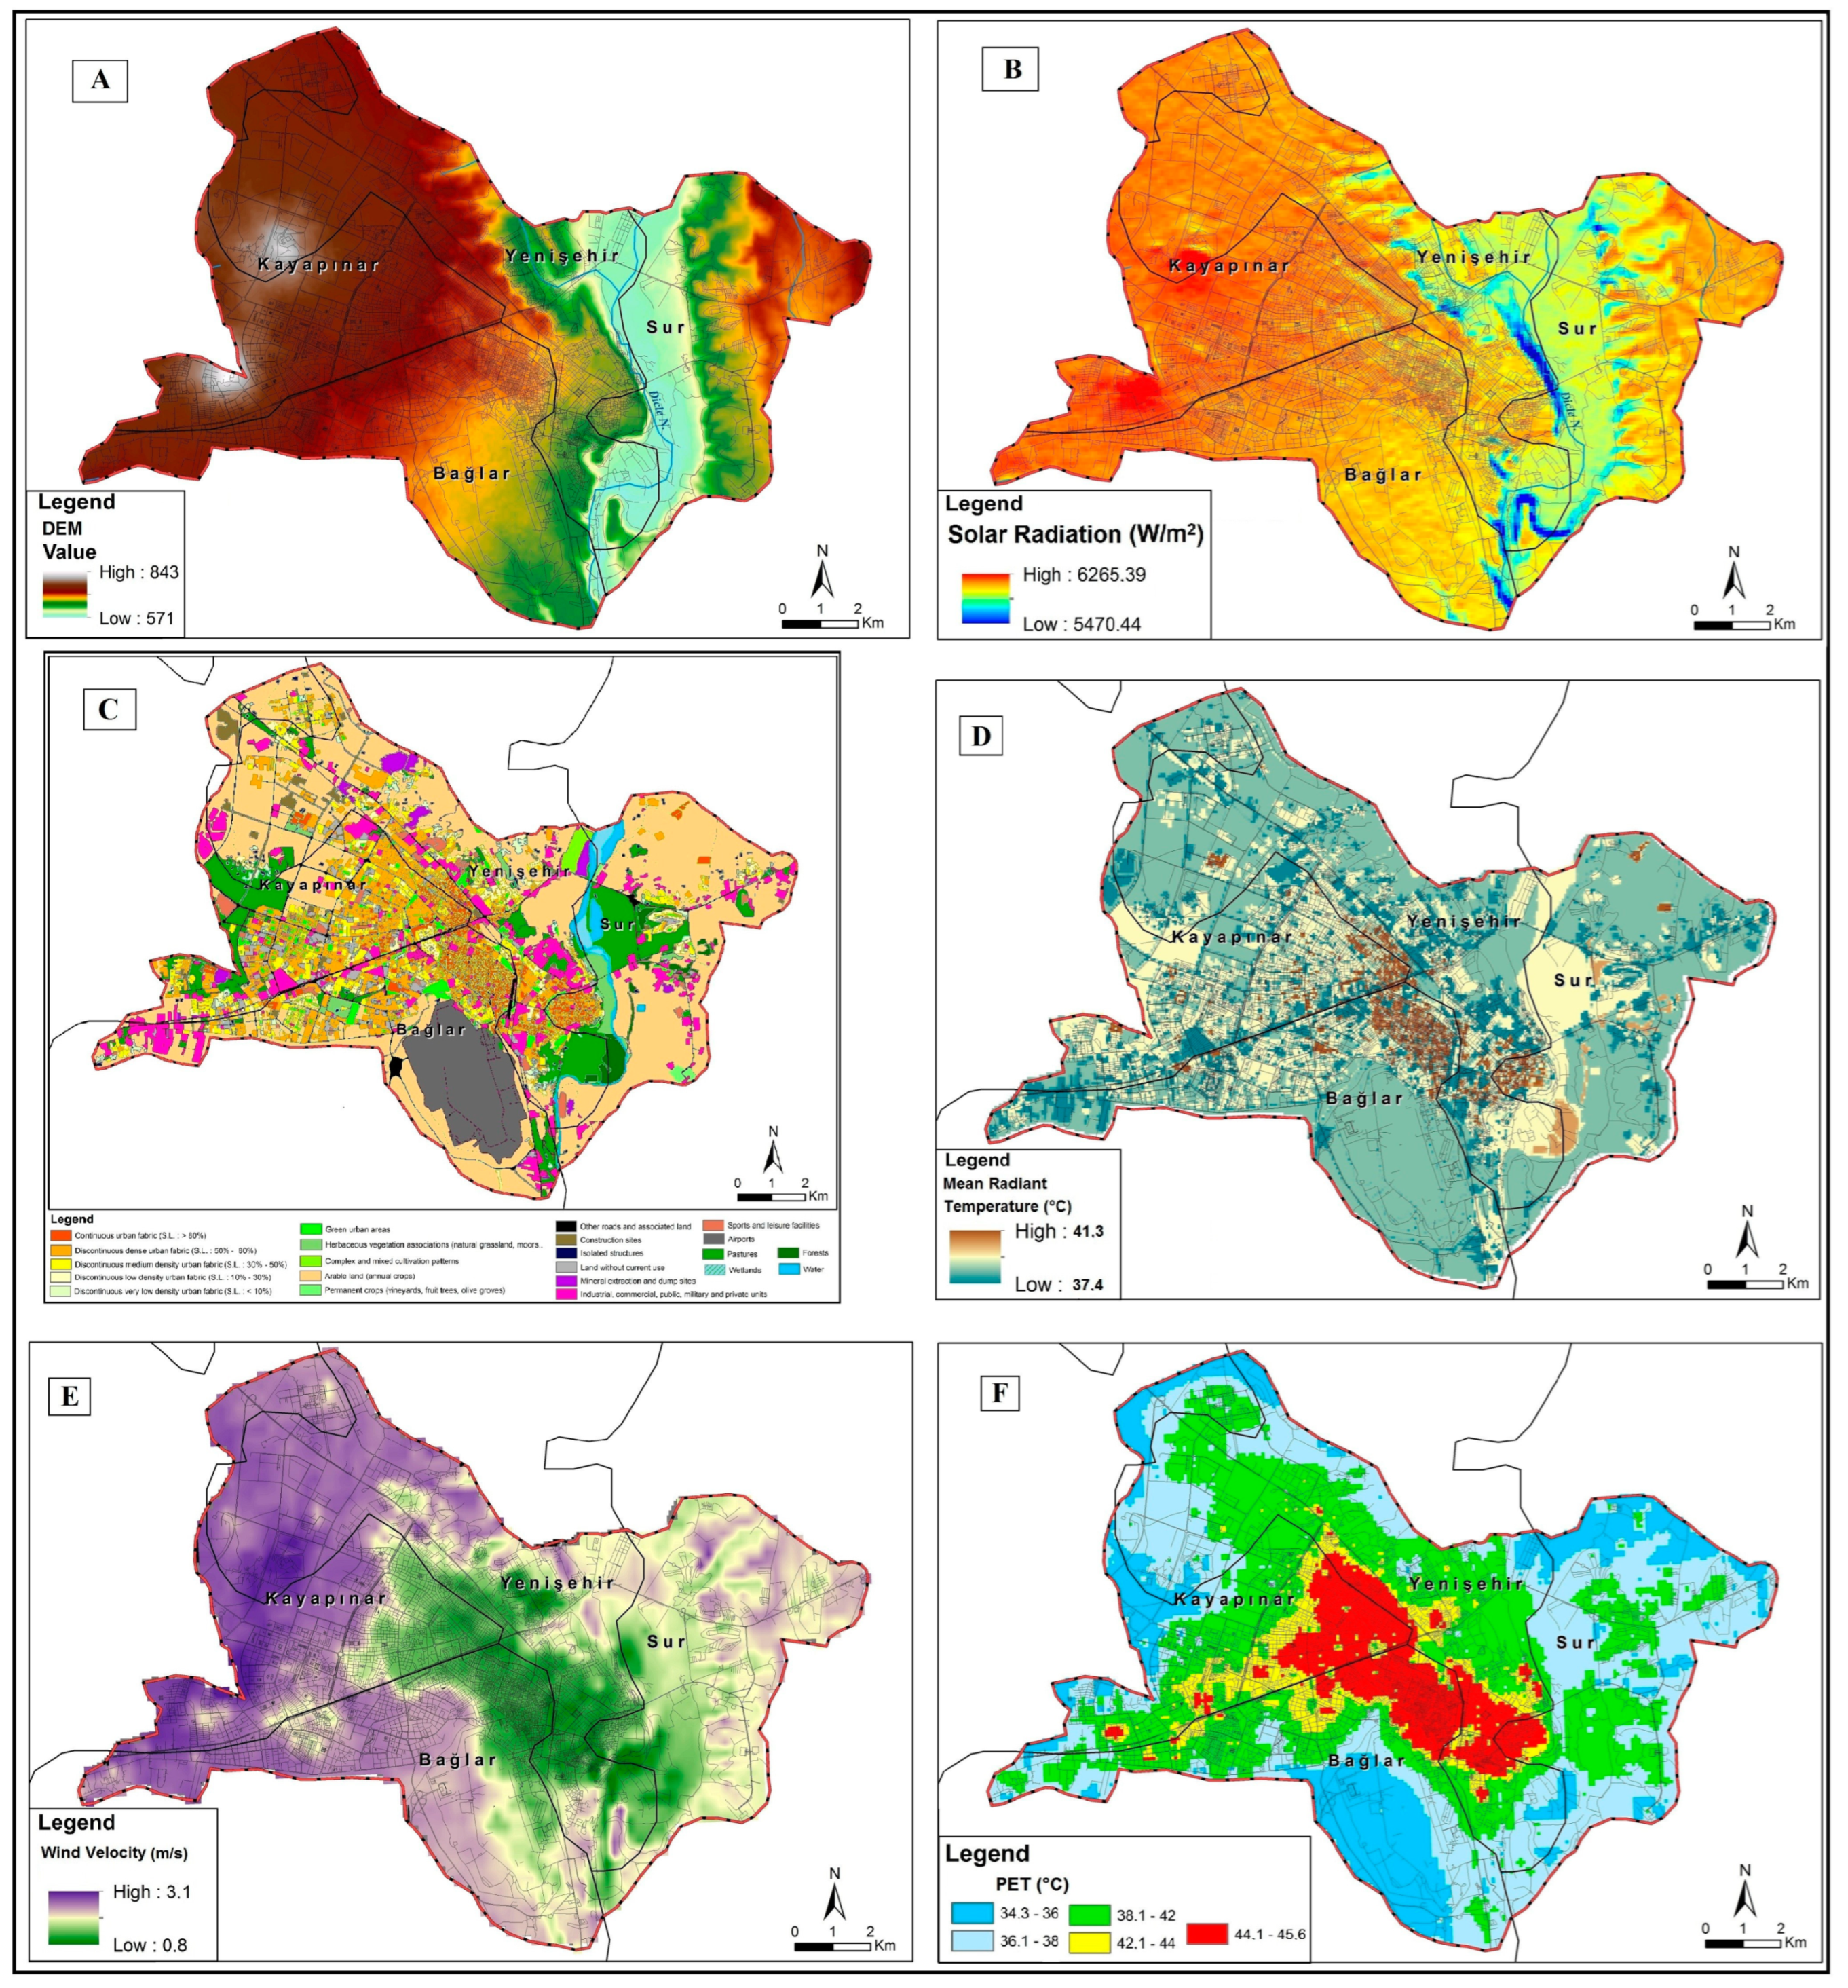
Considering the effects of many variables of the terrain on the PET index in the spatial distribution of thermal comfort conditions, the ArcGIS 10.5 version geographic information system software was utilized. Elevation, land use, solar radiation, and average wind velocity base maps were prepared using the ArcGIS 10.5 program. The land cover map was obtained from the Corine and Urban Atlas data. The distribution of solar radiation in the field was obtained by using the ArcGIS 10.5 program and the digital elevation model according to the day and time of the year. In addition, the mean radiant temperature (MRT) values according to the land cover were calculated according to the land feature using Mr. T software. The software calculates according to the following formula (Equation (2)).
TMRT = [(K*abs + L*abs)/(ε.σ)]^0.25 − 273.15
  • TMRT—mean radiant temperature (°C);
  • K*abs—sum of all absorbed shortwave radiant flux densities (W∙m2);
  • L*abs—sum of all absorbed long wave radiant flux densities (W∙m2);
  • ε—emission power of the human body (0.97);
  • σ—Stefan–Boltzmann constant (5.67 × 10⁻⁸ W∙m2∙K4) [60].
The radiant temperature distribution (MRT) was obtained by using the ArcGIS 10.5 program (Figure 3).
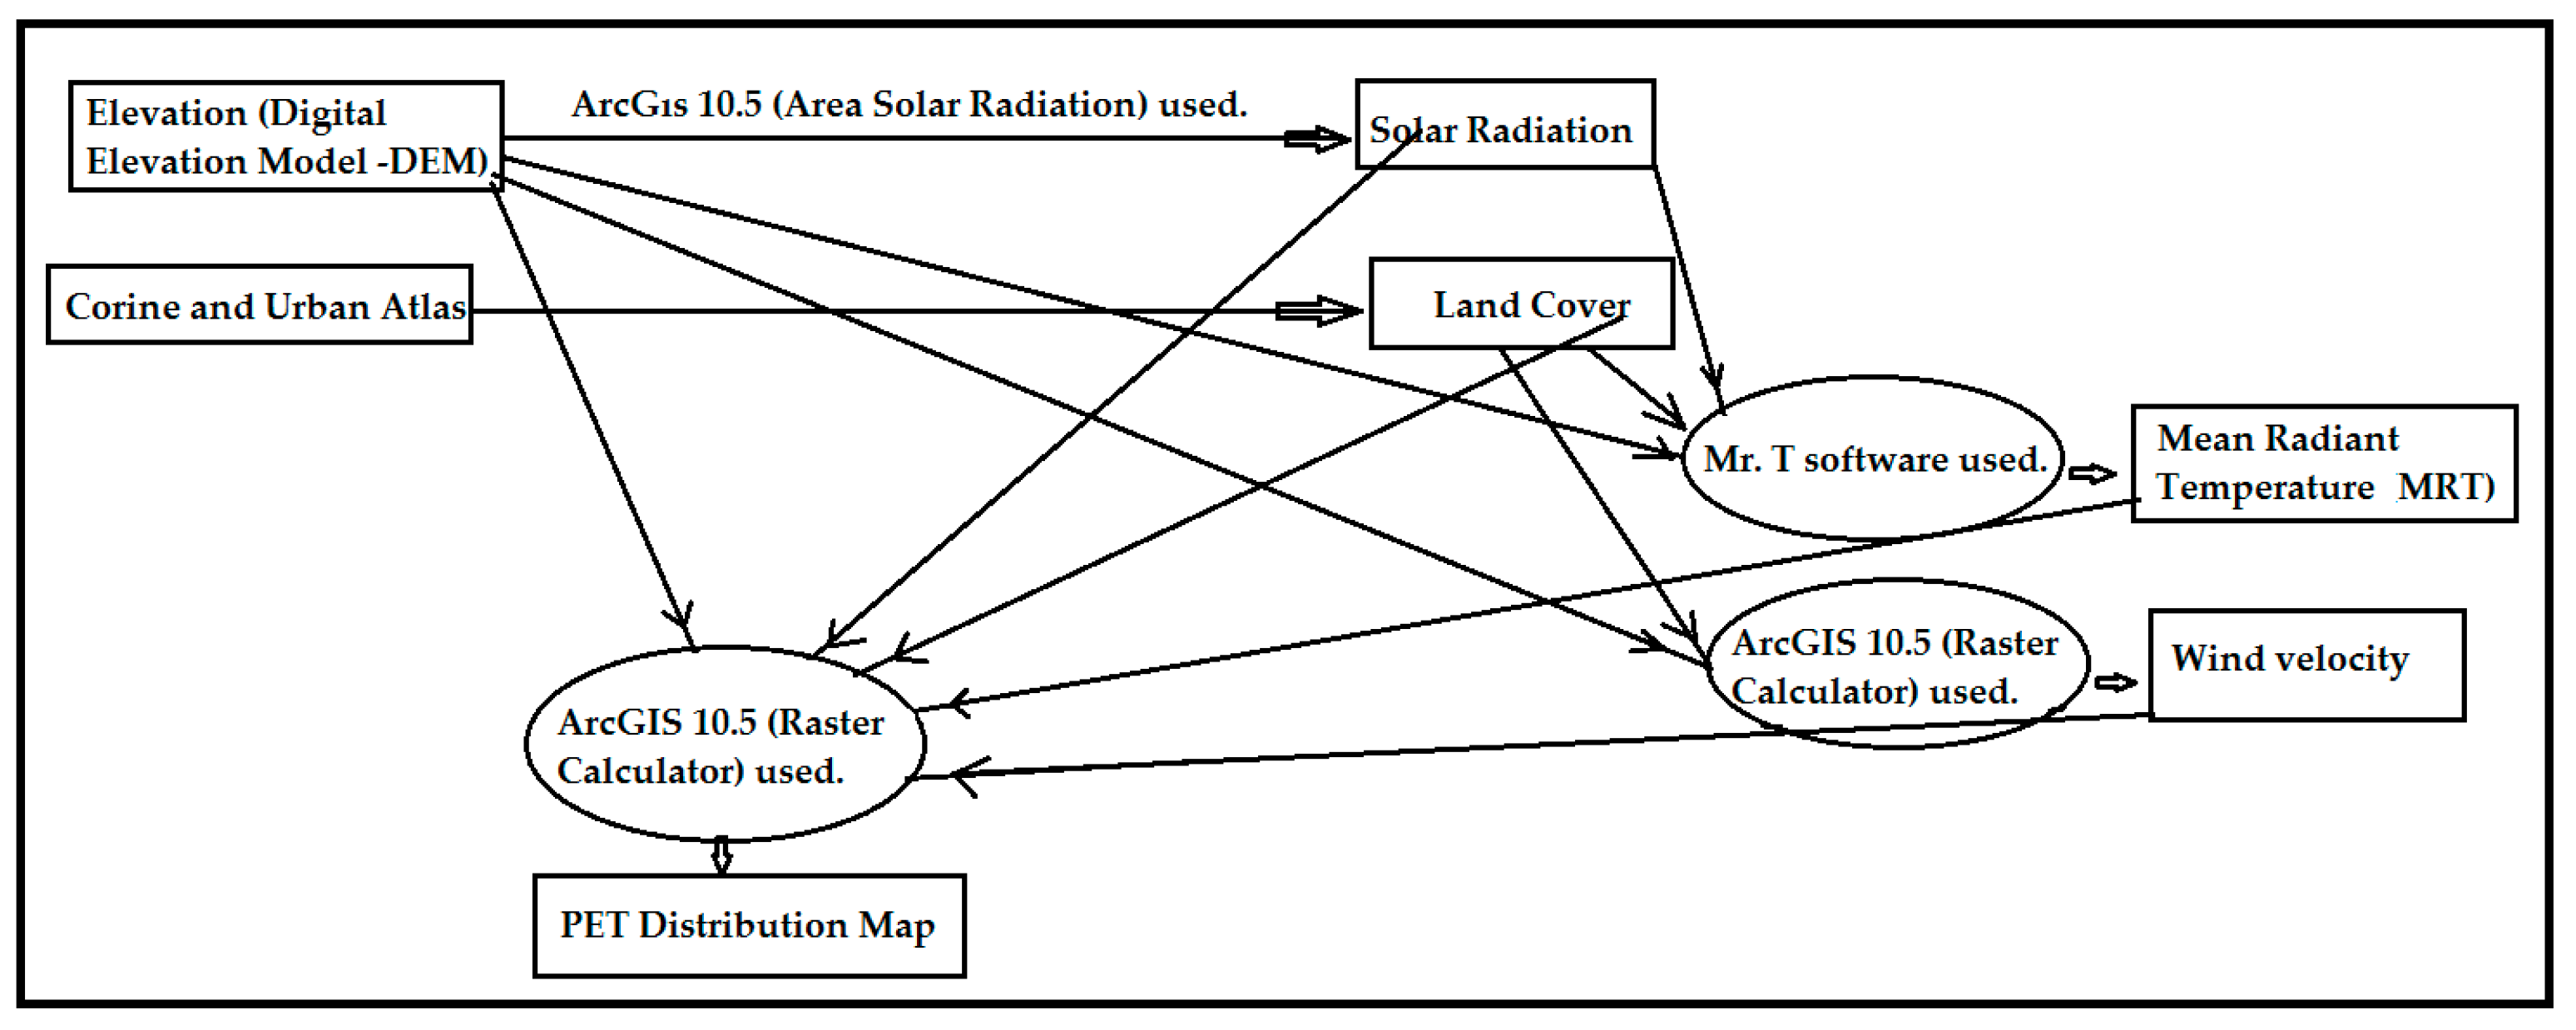
Using all these base maps, the spatial distribution of thermal comfort conditions was prepared by calculating with the Raster Calculator tool in the ArcGIS 10.5 program (Figure 4). This method was tested for three different cities located in different climatic zones and is reported to have an accuracy of over 95%. It has also been used in many studies [19,47,61].
In addition, the ArcGIS 10.5 program was used to calculate how much of the area was covered by thermal gaps. The effects of field variables on the PET index were determined according to the coefficients in Table 4.
An anemometer device, which measures wind velocity at synoptic meteorology stations, makes measurements at 10 m above the ground. Therefore, wind velocity maps are arranged according to 1.1 m, which is the reference level of the human body’s center of gravity [22,39].
The wind velocity data obtained from the synoptic meteorology stations were evaluated according to 1.1 m using the following formula (Equation (3)).
WS1.1 = WSh ∙ (1.1/h)^a
where a = 0.12 · z0 + 0.18; WSh is the wind velocity value measured at altitude (m/s) (at 10 m); h is the height of the station (10 m); and z0 is the surface roughness length, which is an empirical exponent of surface roughness [66].
The roughness length (z0) value was obtained from the European Wind Atlas [66].

3. Results

This section is presented with five subheadings. It provides a concise and precise description of the experimental results, their interpretation, and the experimental conclusions that can be drawn.

3.1. Urbanization, Population Characteristics, and Projections of Diyarbakır City

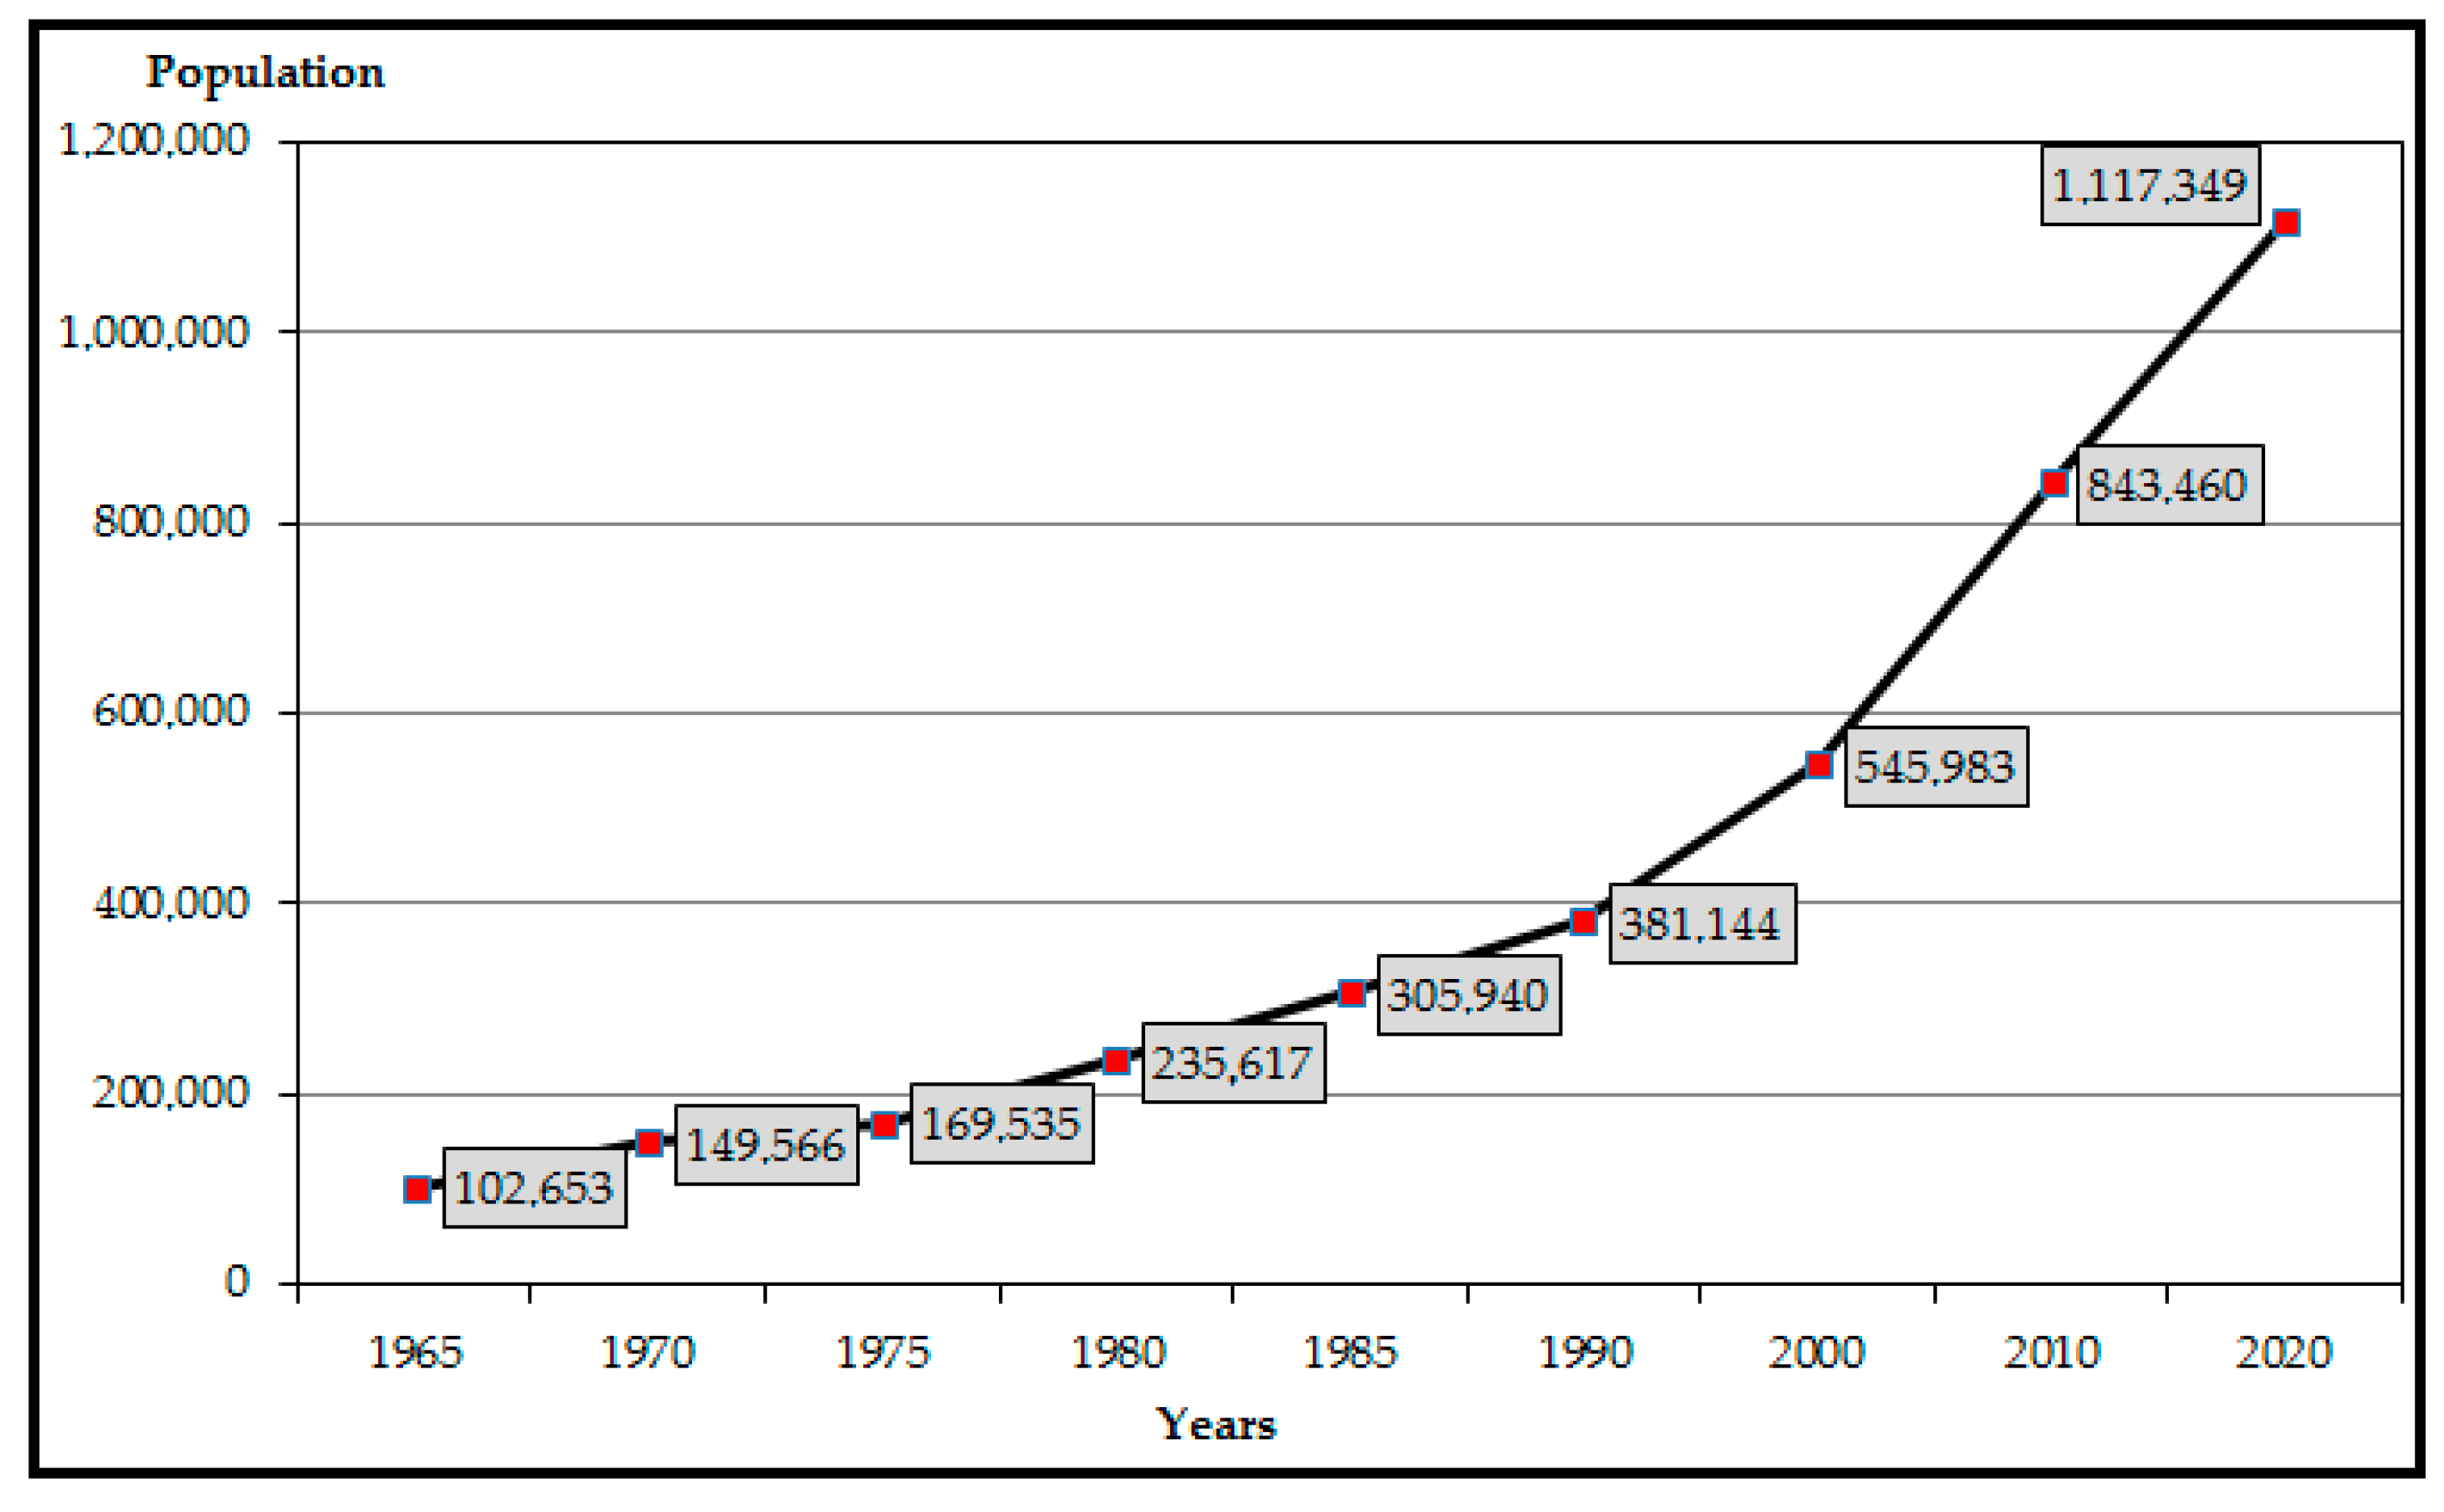
Diyarbakır, one of the oldest settlements of Anatolia, is a city of history, culture, and civilization, located on important trade routes. The population of Diyarbakır was 102,653 in 1965 and 545,983 in 2000. In 2010, the population reached 843,460 people, and in 2020 it reached 1,117,349 people (Figure 5).
After 1990, both migration and the metropolitan status of Diyarbakır in 1994 were effective in the sudden increases in population. After 2000, with Law No. 5216, which entered into force in 2004, the surface area expanded, and with Law No. 6360, dated 12 November 2012, the service area became the provincial border. This situation was reflected in the population [67].
According to 2014 data, the population growth rate of Diyarbakır was determined as 31%. This rate is above the average for Turkey [68]. This situation shows that the population will increase even more in the city in the future. With the increasing population, the need for more housing, infrastructure, etc., will arise. Such reasons support the prediction that concrete and asphalt surfaces will increase and green areas will decrease in urban areas.
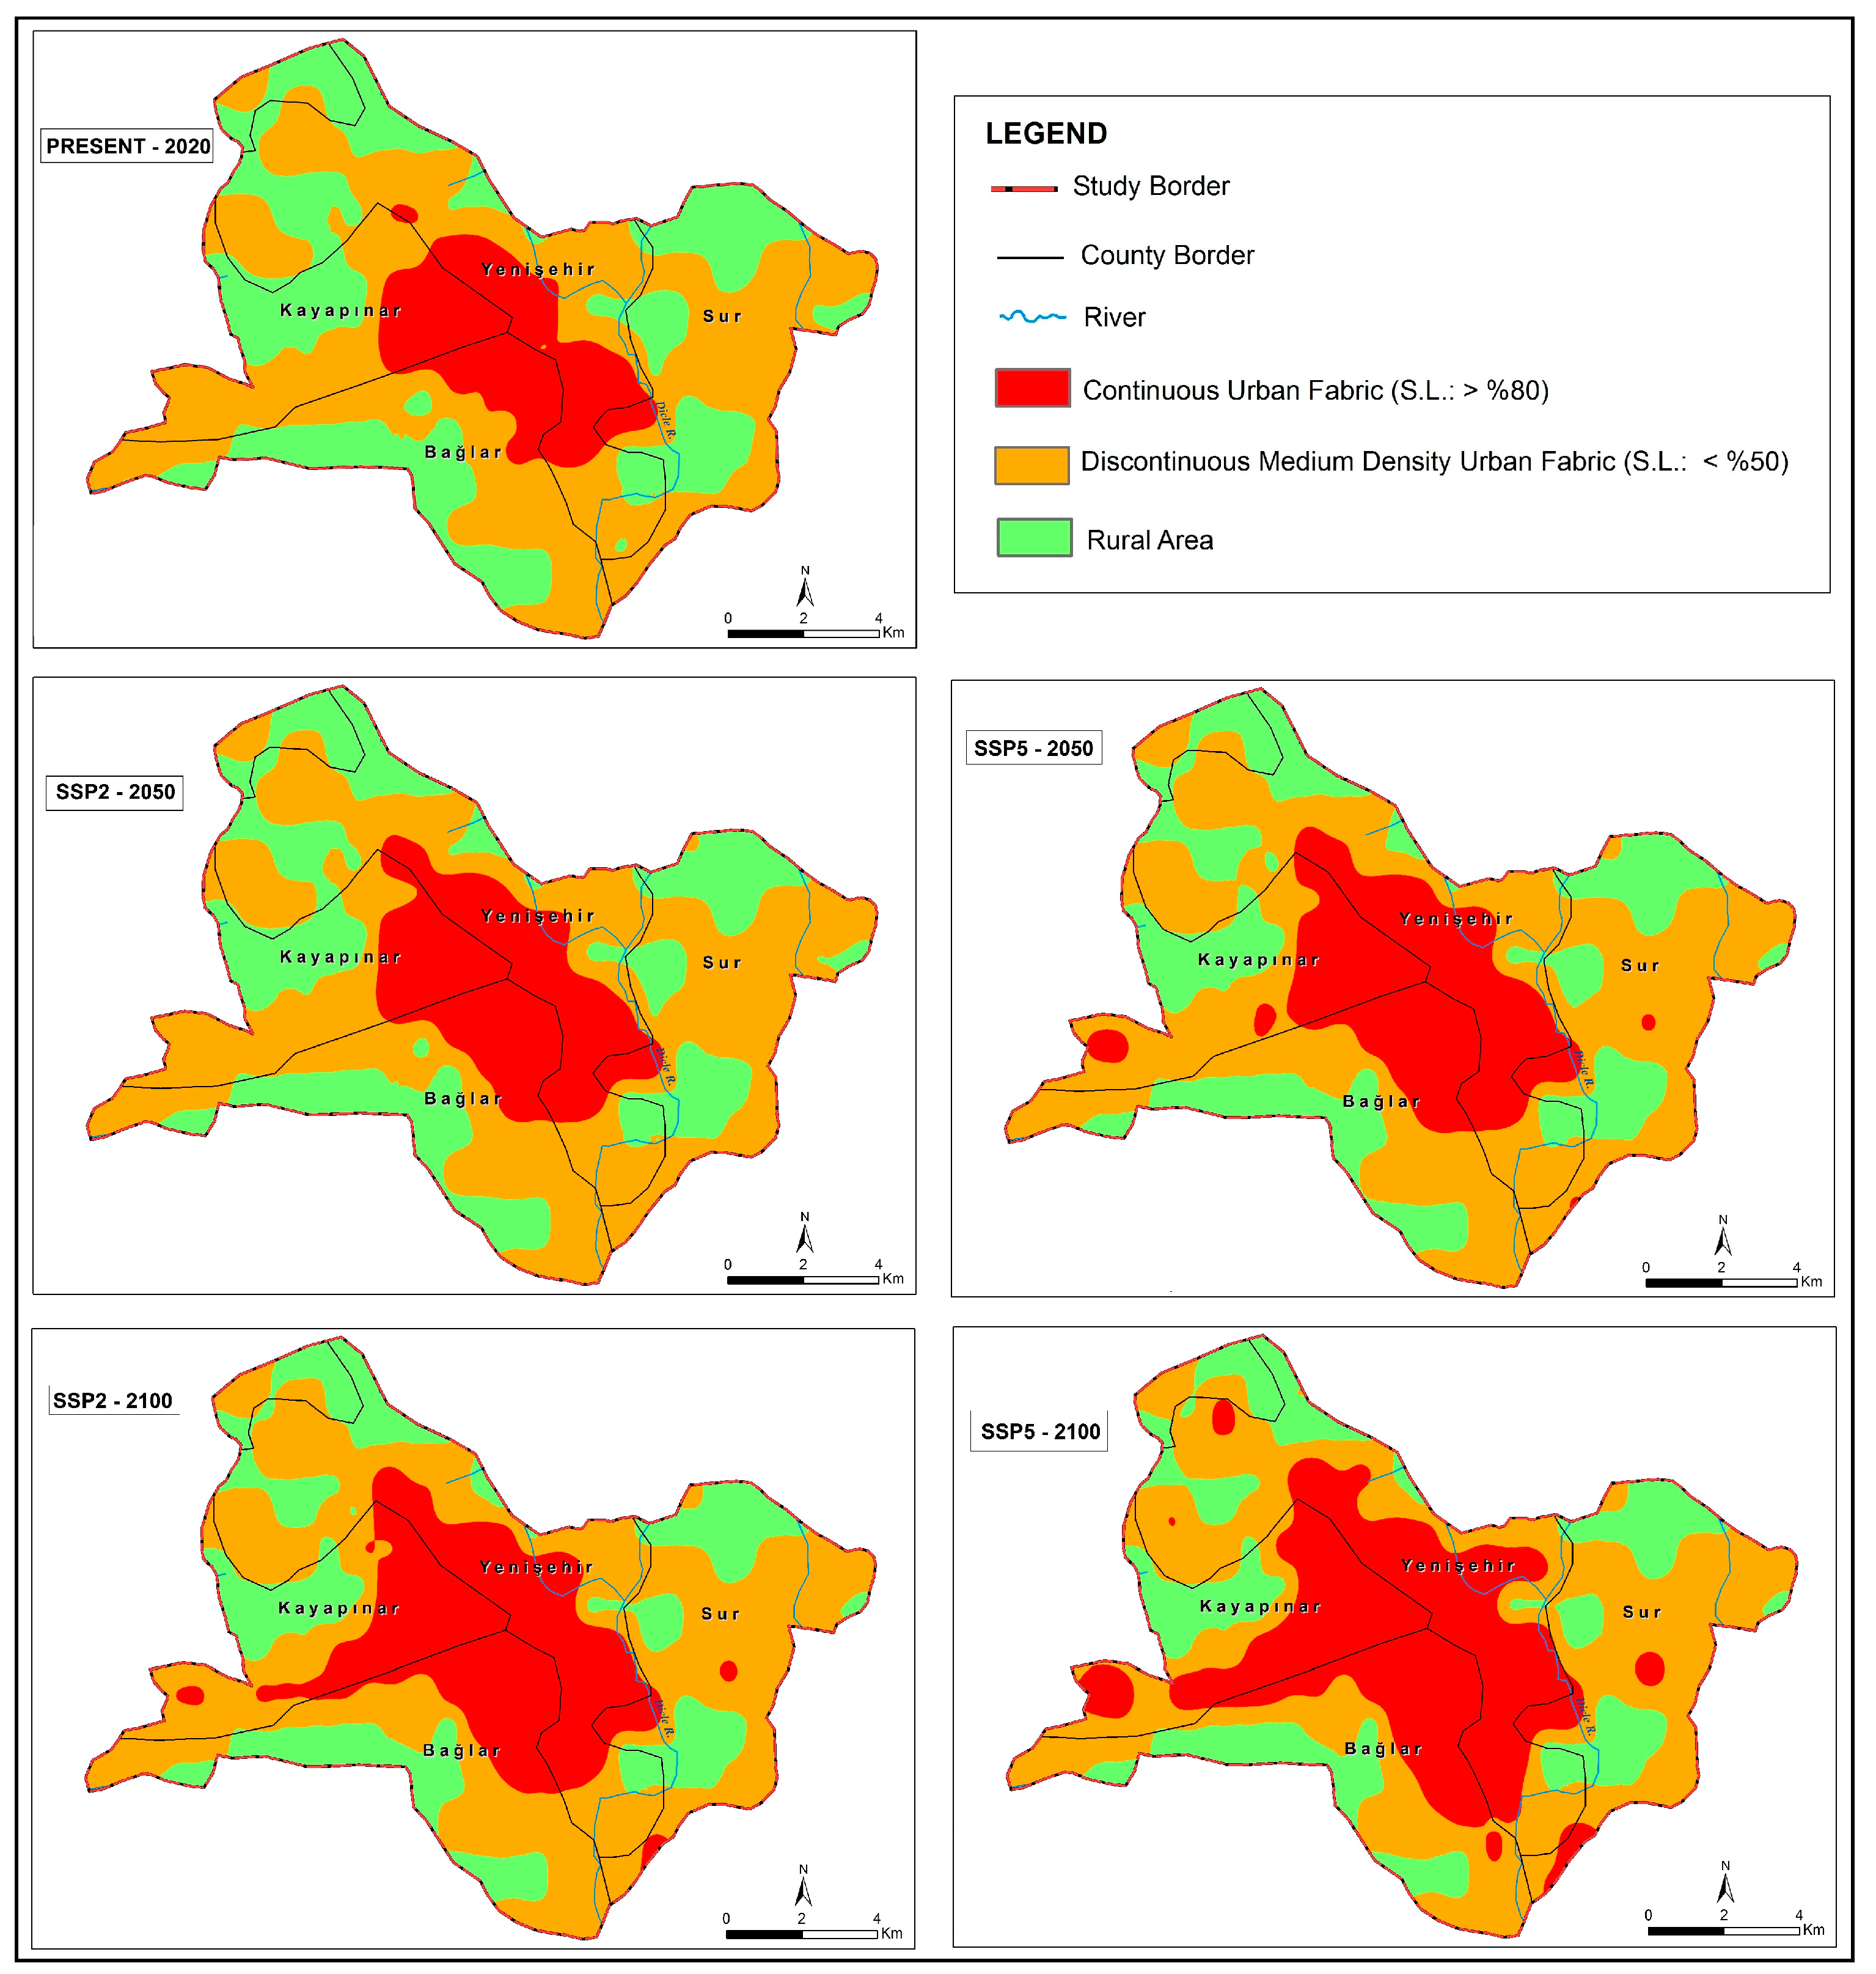
Continuous urban fabric is defined as areas where more than 80% of the area is covered by artificial surfaces (roads, buildings, etc.). The areas where artificial areas are between 30% and 80% of the area are defined as discontinuous urban fabric [69]. From a geographical point of view, continuous urban fabric is expressed as “dense” and discontinuous urban fabric is expressed as “loose” [17]. Since these definitions are used many times in the text, it is necessary to define them.
Today, the urban area in the city of Diyarbakır is concentrated at the junction of the three central districts. Discontinuous urban fabric constitutes 52 percent of the area, rural area 32 percent, and continuous urban fabric 16 percent. According to the near-future (2050) SSP-2 scenario, discontinuous urban fabric will remain at the same rate, rural area will decrease to 29%, and continuous urban fabric will reach 19%, while according to the SSP-5 scenario, discontinuous urban fabric will decrease to 51%, rural area to 26%, and continuous urban fabric to 23%. In the distant future (2100), according to the SSP-2 scenario, discontinuous urban fabric will decrease to 50%, rural area will decrease to 25%, and continuous urban fabric will reach 25%; according to the SSP-5 scenario, discontinuous urban fabric will decrease to 45%, rural area will decrease to 23%, and continuous urban fabric will reach 32% (Table 5 and Figure 6).
According to the projections developed from present to future in the urban area, continuous urban fabric is expected to increase continuously while rural area is expected to decrease continuously. This situation is expected to be realized gradually (discontinuous urban fabric transforms into continuous urban fabric, rural area transforms into discontinuous urban fabric) (Figure 6).

3.2. Current Spatial Distribution of Thermal Comfort Conditions

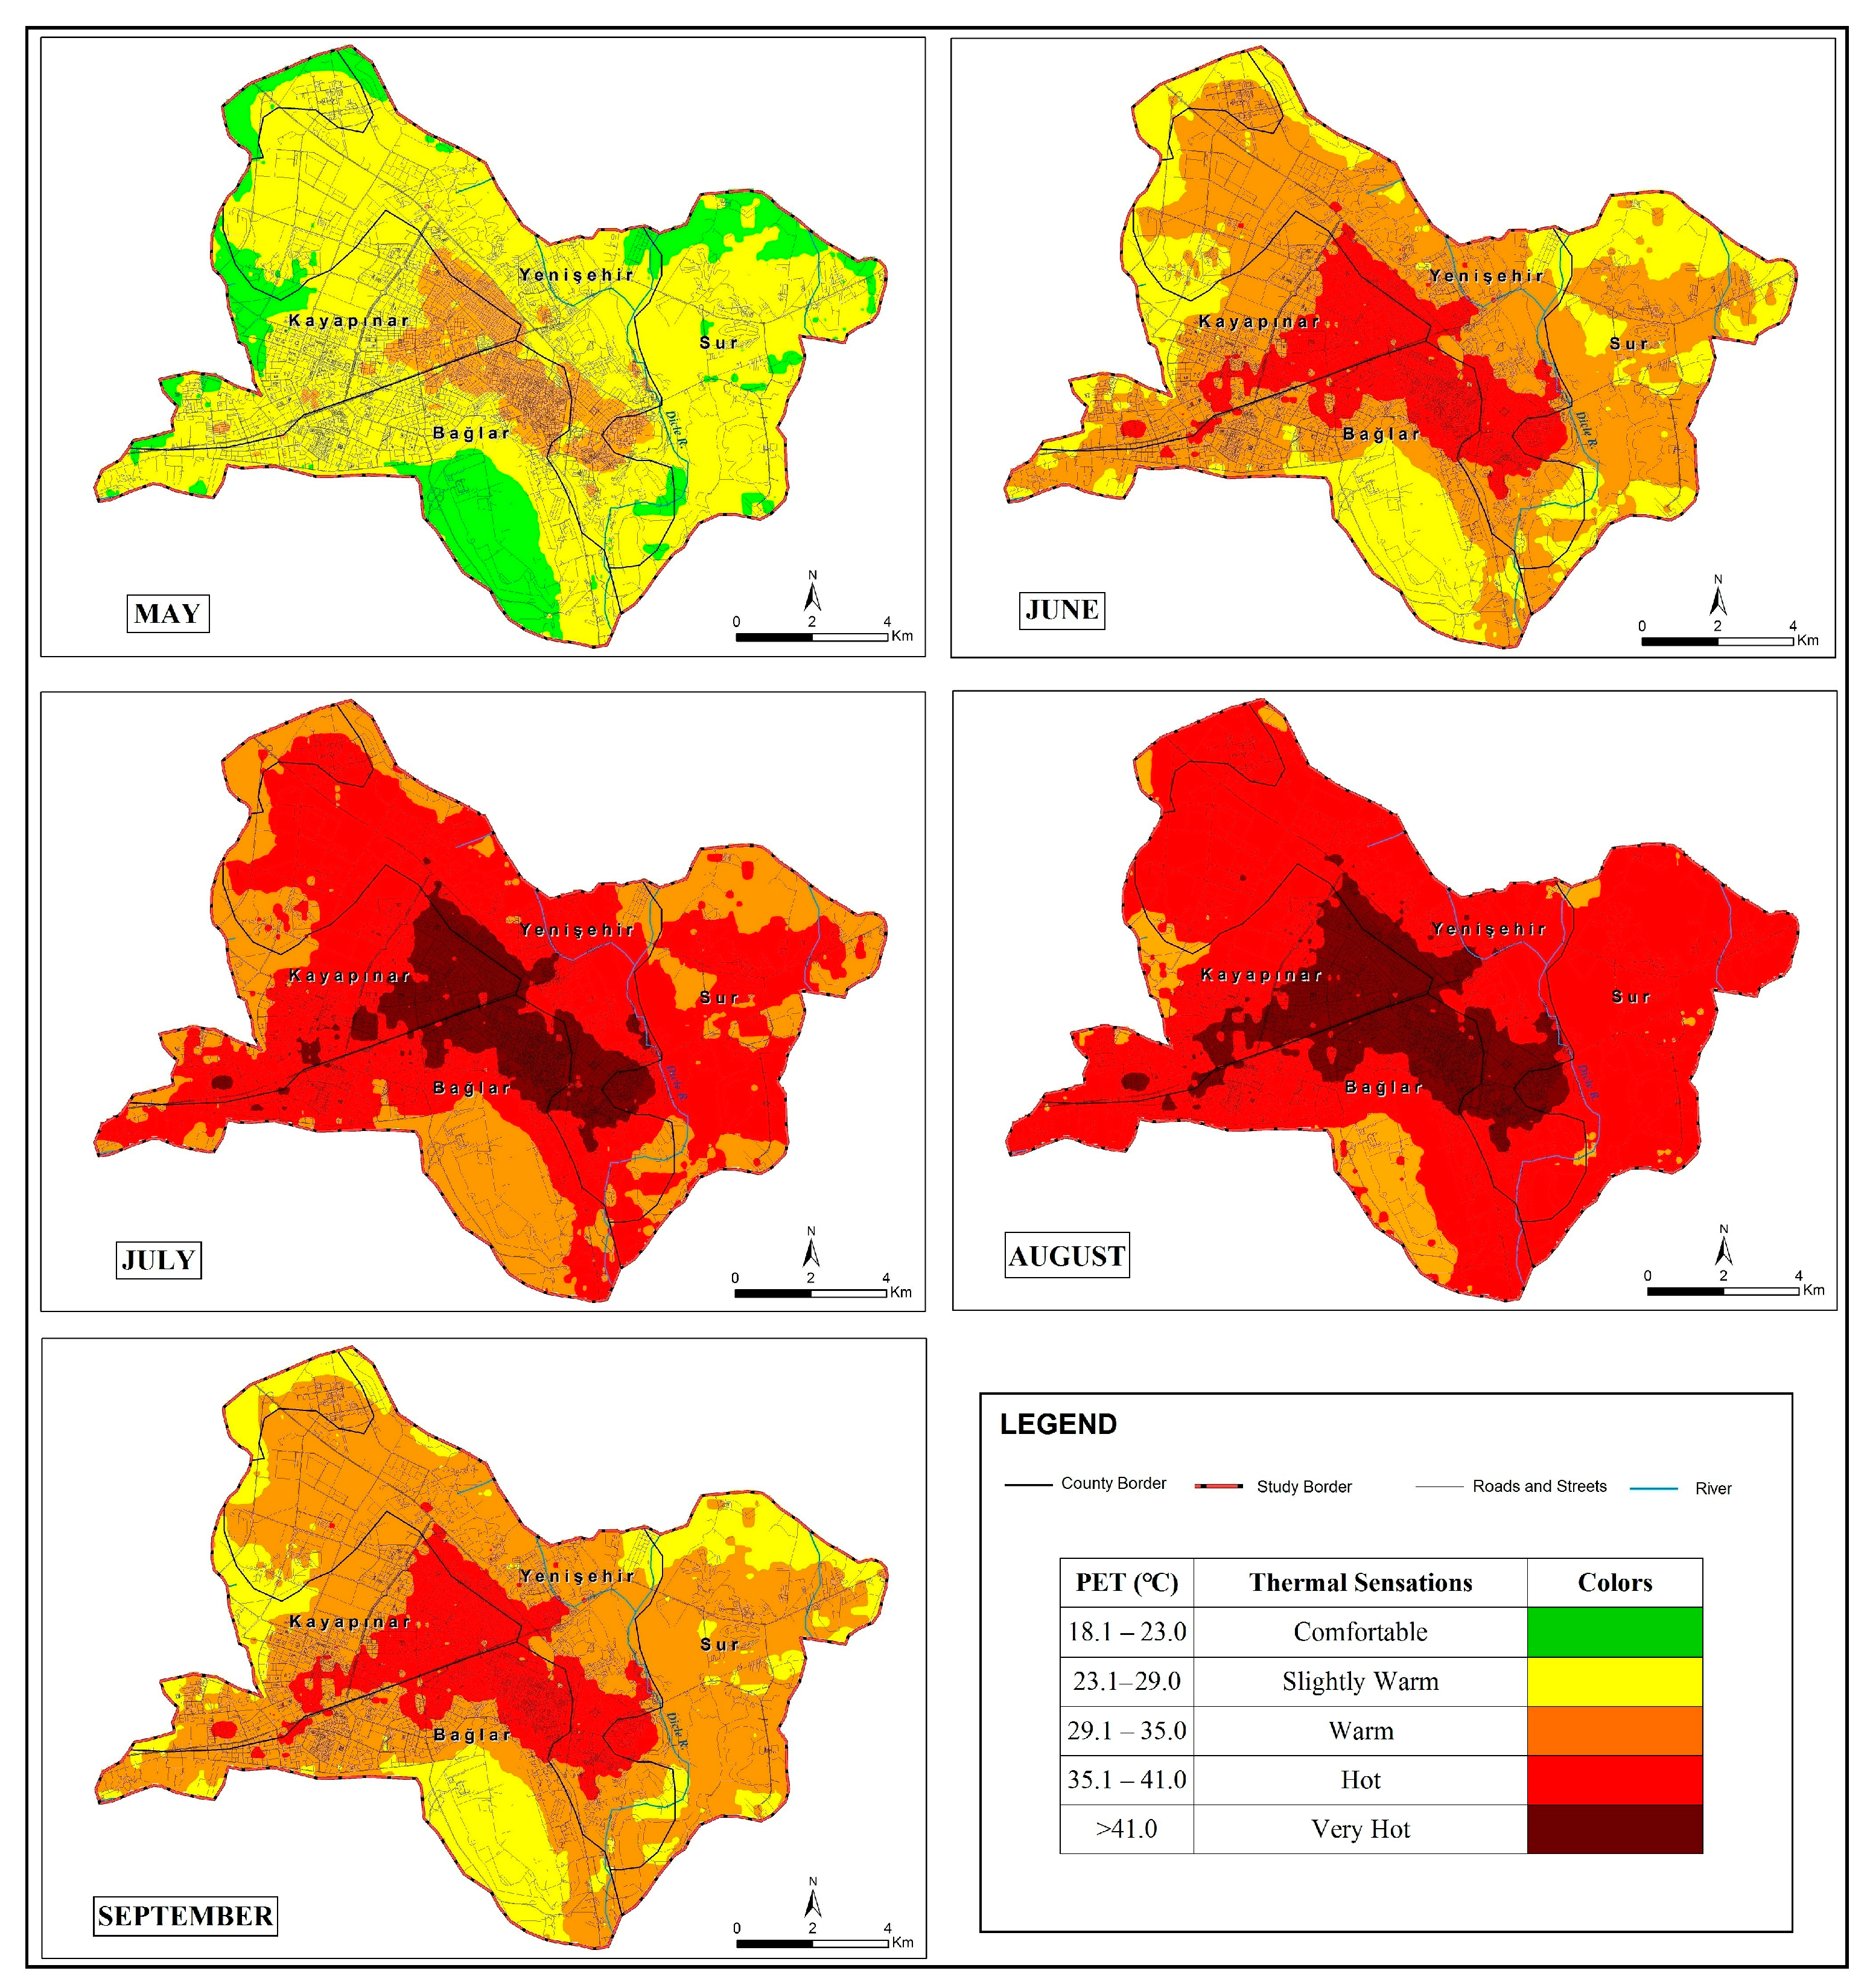
The current thermal comfort conditions in the city of Diyarbakır are explained as spatial distribution with maps from May to September, which is the hot period of the year. In May, “warm” stress is effective in dense urban areas, “slightly warm” stress in low-density residential areas, and “comfortable” conditions in open areas. In June and September, “hot” stress is experienced in densely populated urban areas, “warm” stress in low-density residential areas, and “slightly warm” stress in open rural areas. In July and August, on the other hand, “very hot” stress prevails in densely built-up and high-rise areas, “hot” stress in low-density residential areas, and “warm” stress in open rural areas (Figure 7).

3.3. Projected Thermal Comfort Conditions in the Near Future (2021–2050)

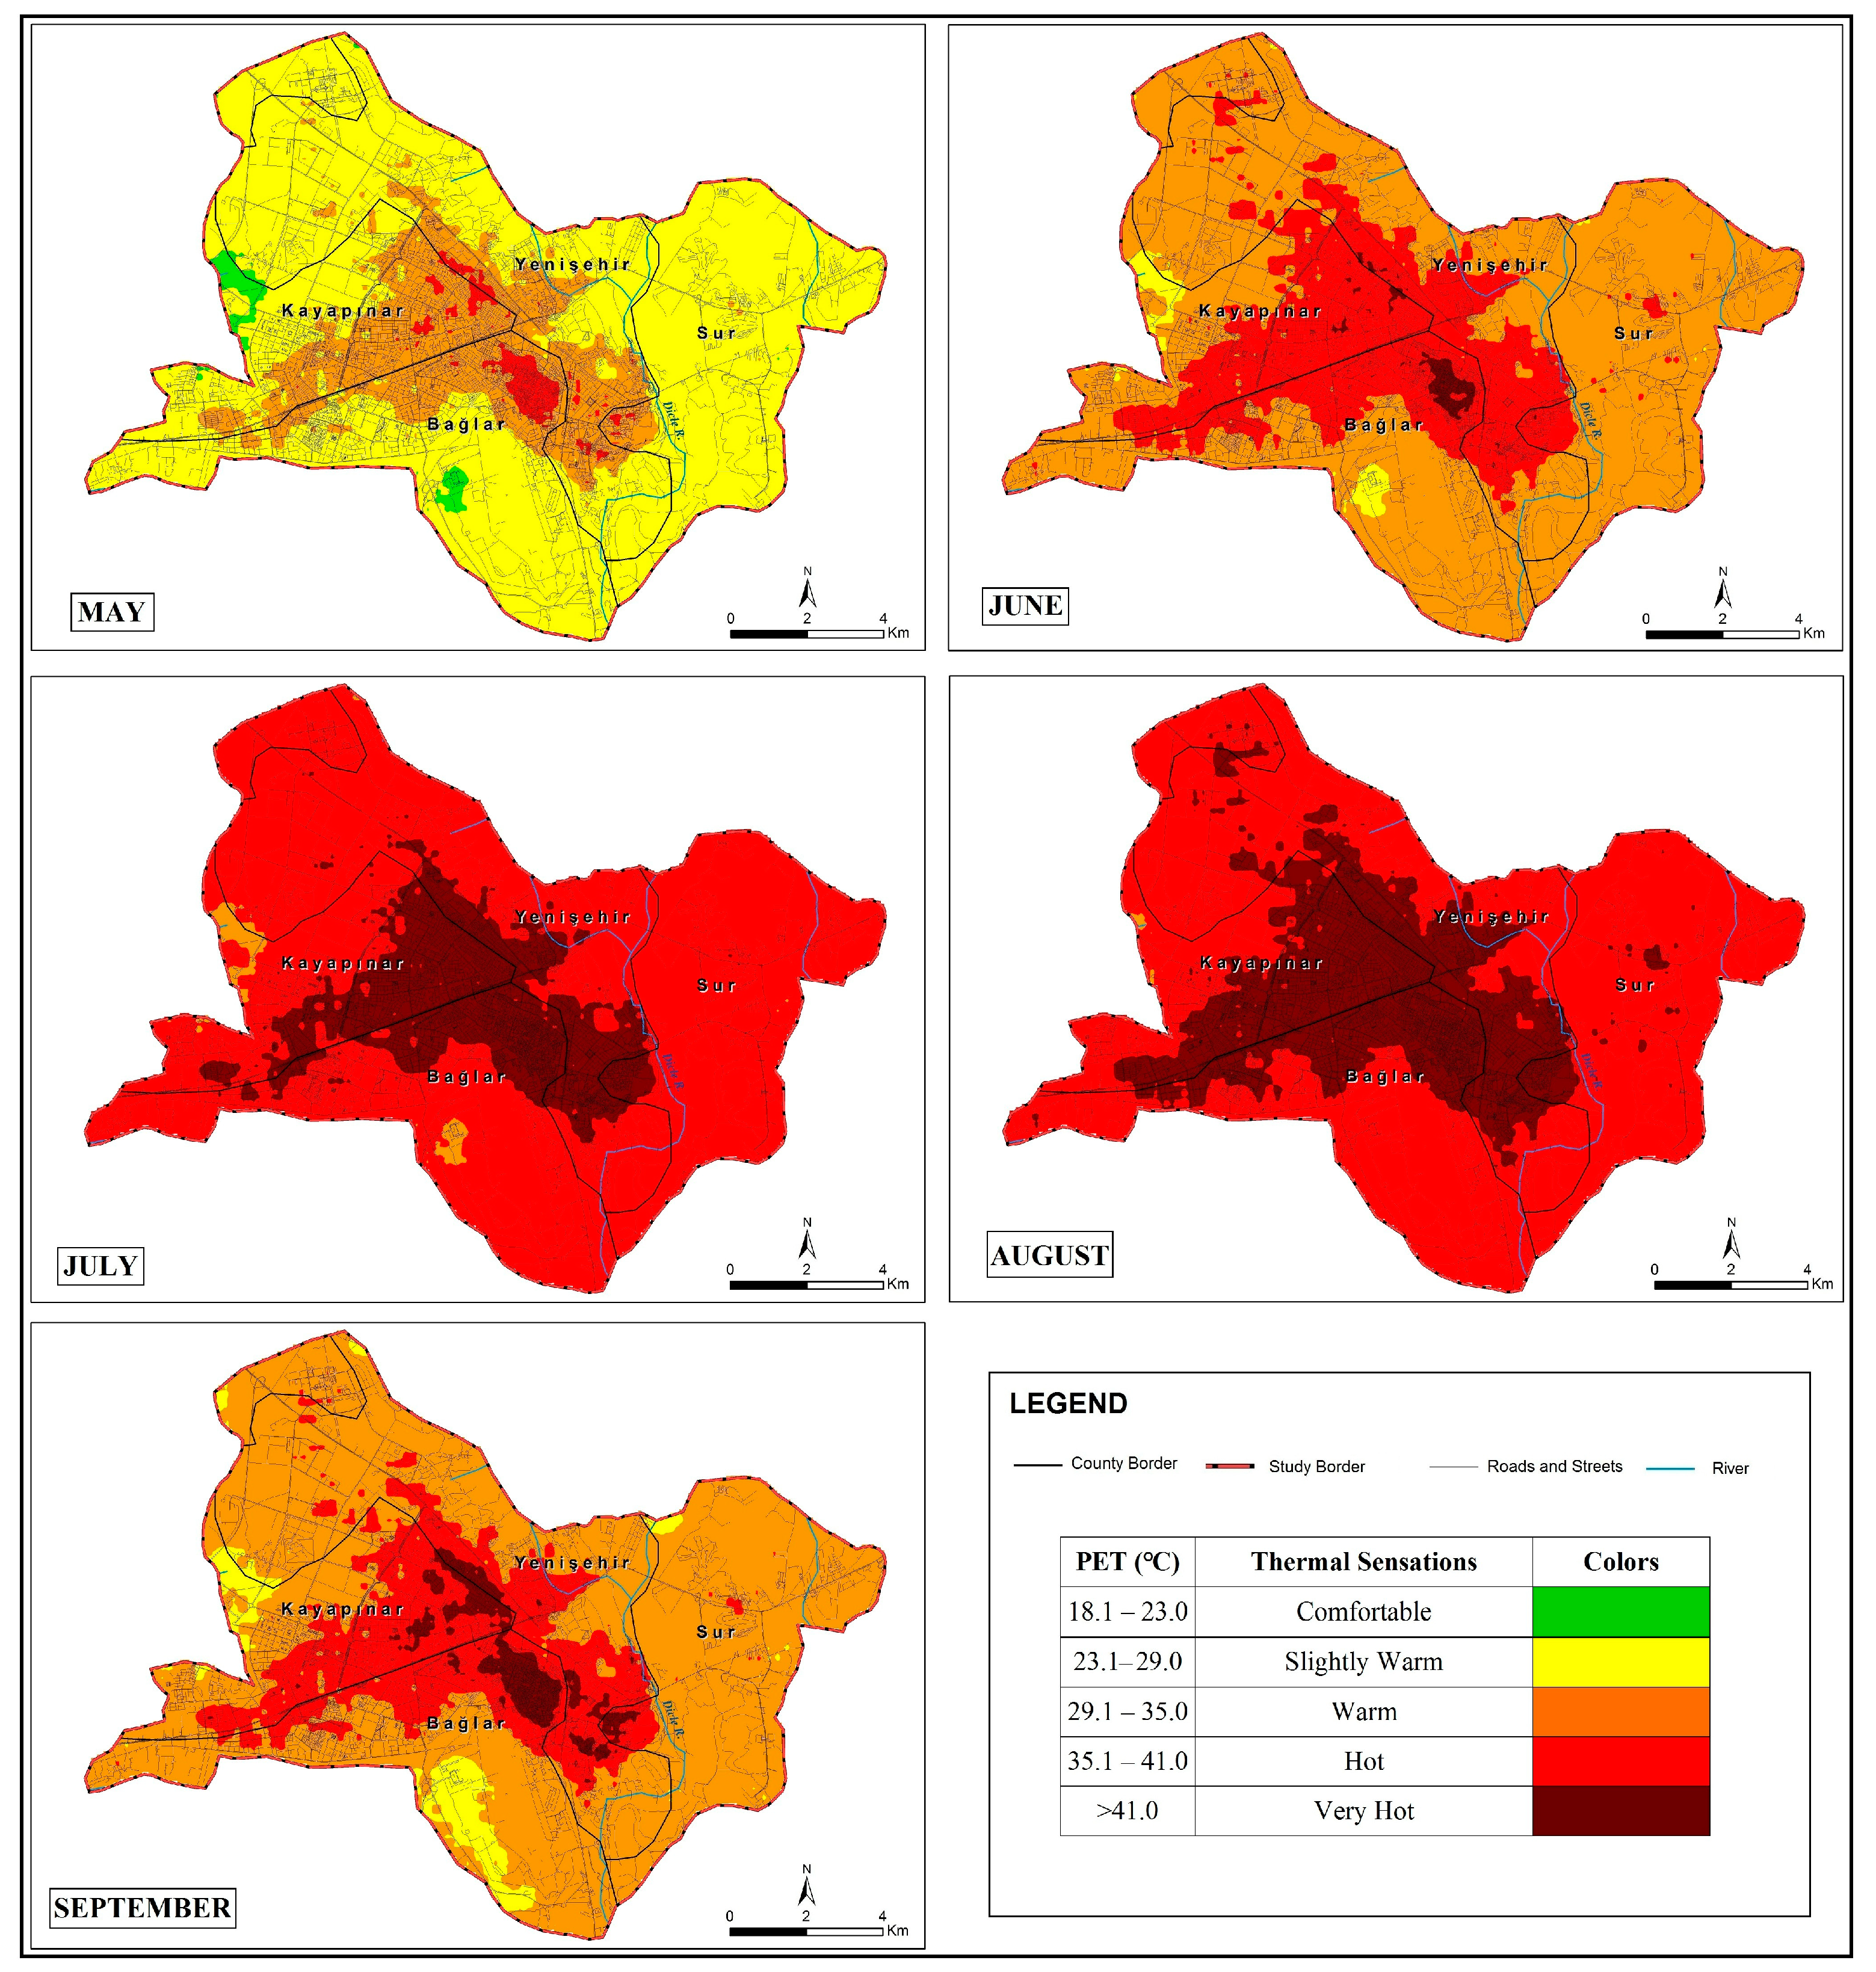
The increase in population and urbanization in the near future will also change the thermal comfort conditions. According to projected climate under the SSP-2 scenario, “warm” stress is expected to affect urban areas with dense settlements, “slightly warm” stress in low density settlements, and “comfortable” conditions in rural areas in Diyarbakır city in May. It is predicted that “hot” stress will occur in June, but it will affect larger areas spatially, while “warm” stress will affect most of the area, and “slightly warm” stress will be observed in a very small area. In July and August, “very hot” and “hot” stresses are expected to affect the city, while in September, “very hot” and “hot” stresses are expected to prevail in dense areas of the city, and “warm” stress is expected to prevail in low-density residential areas (Figure 8).
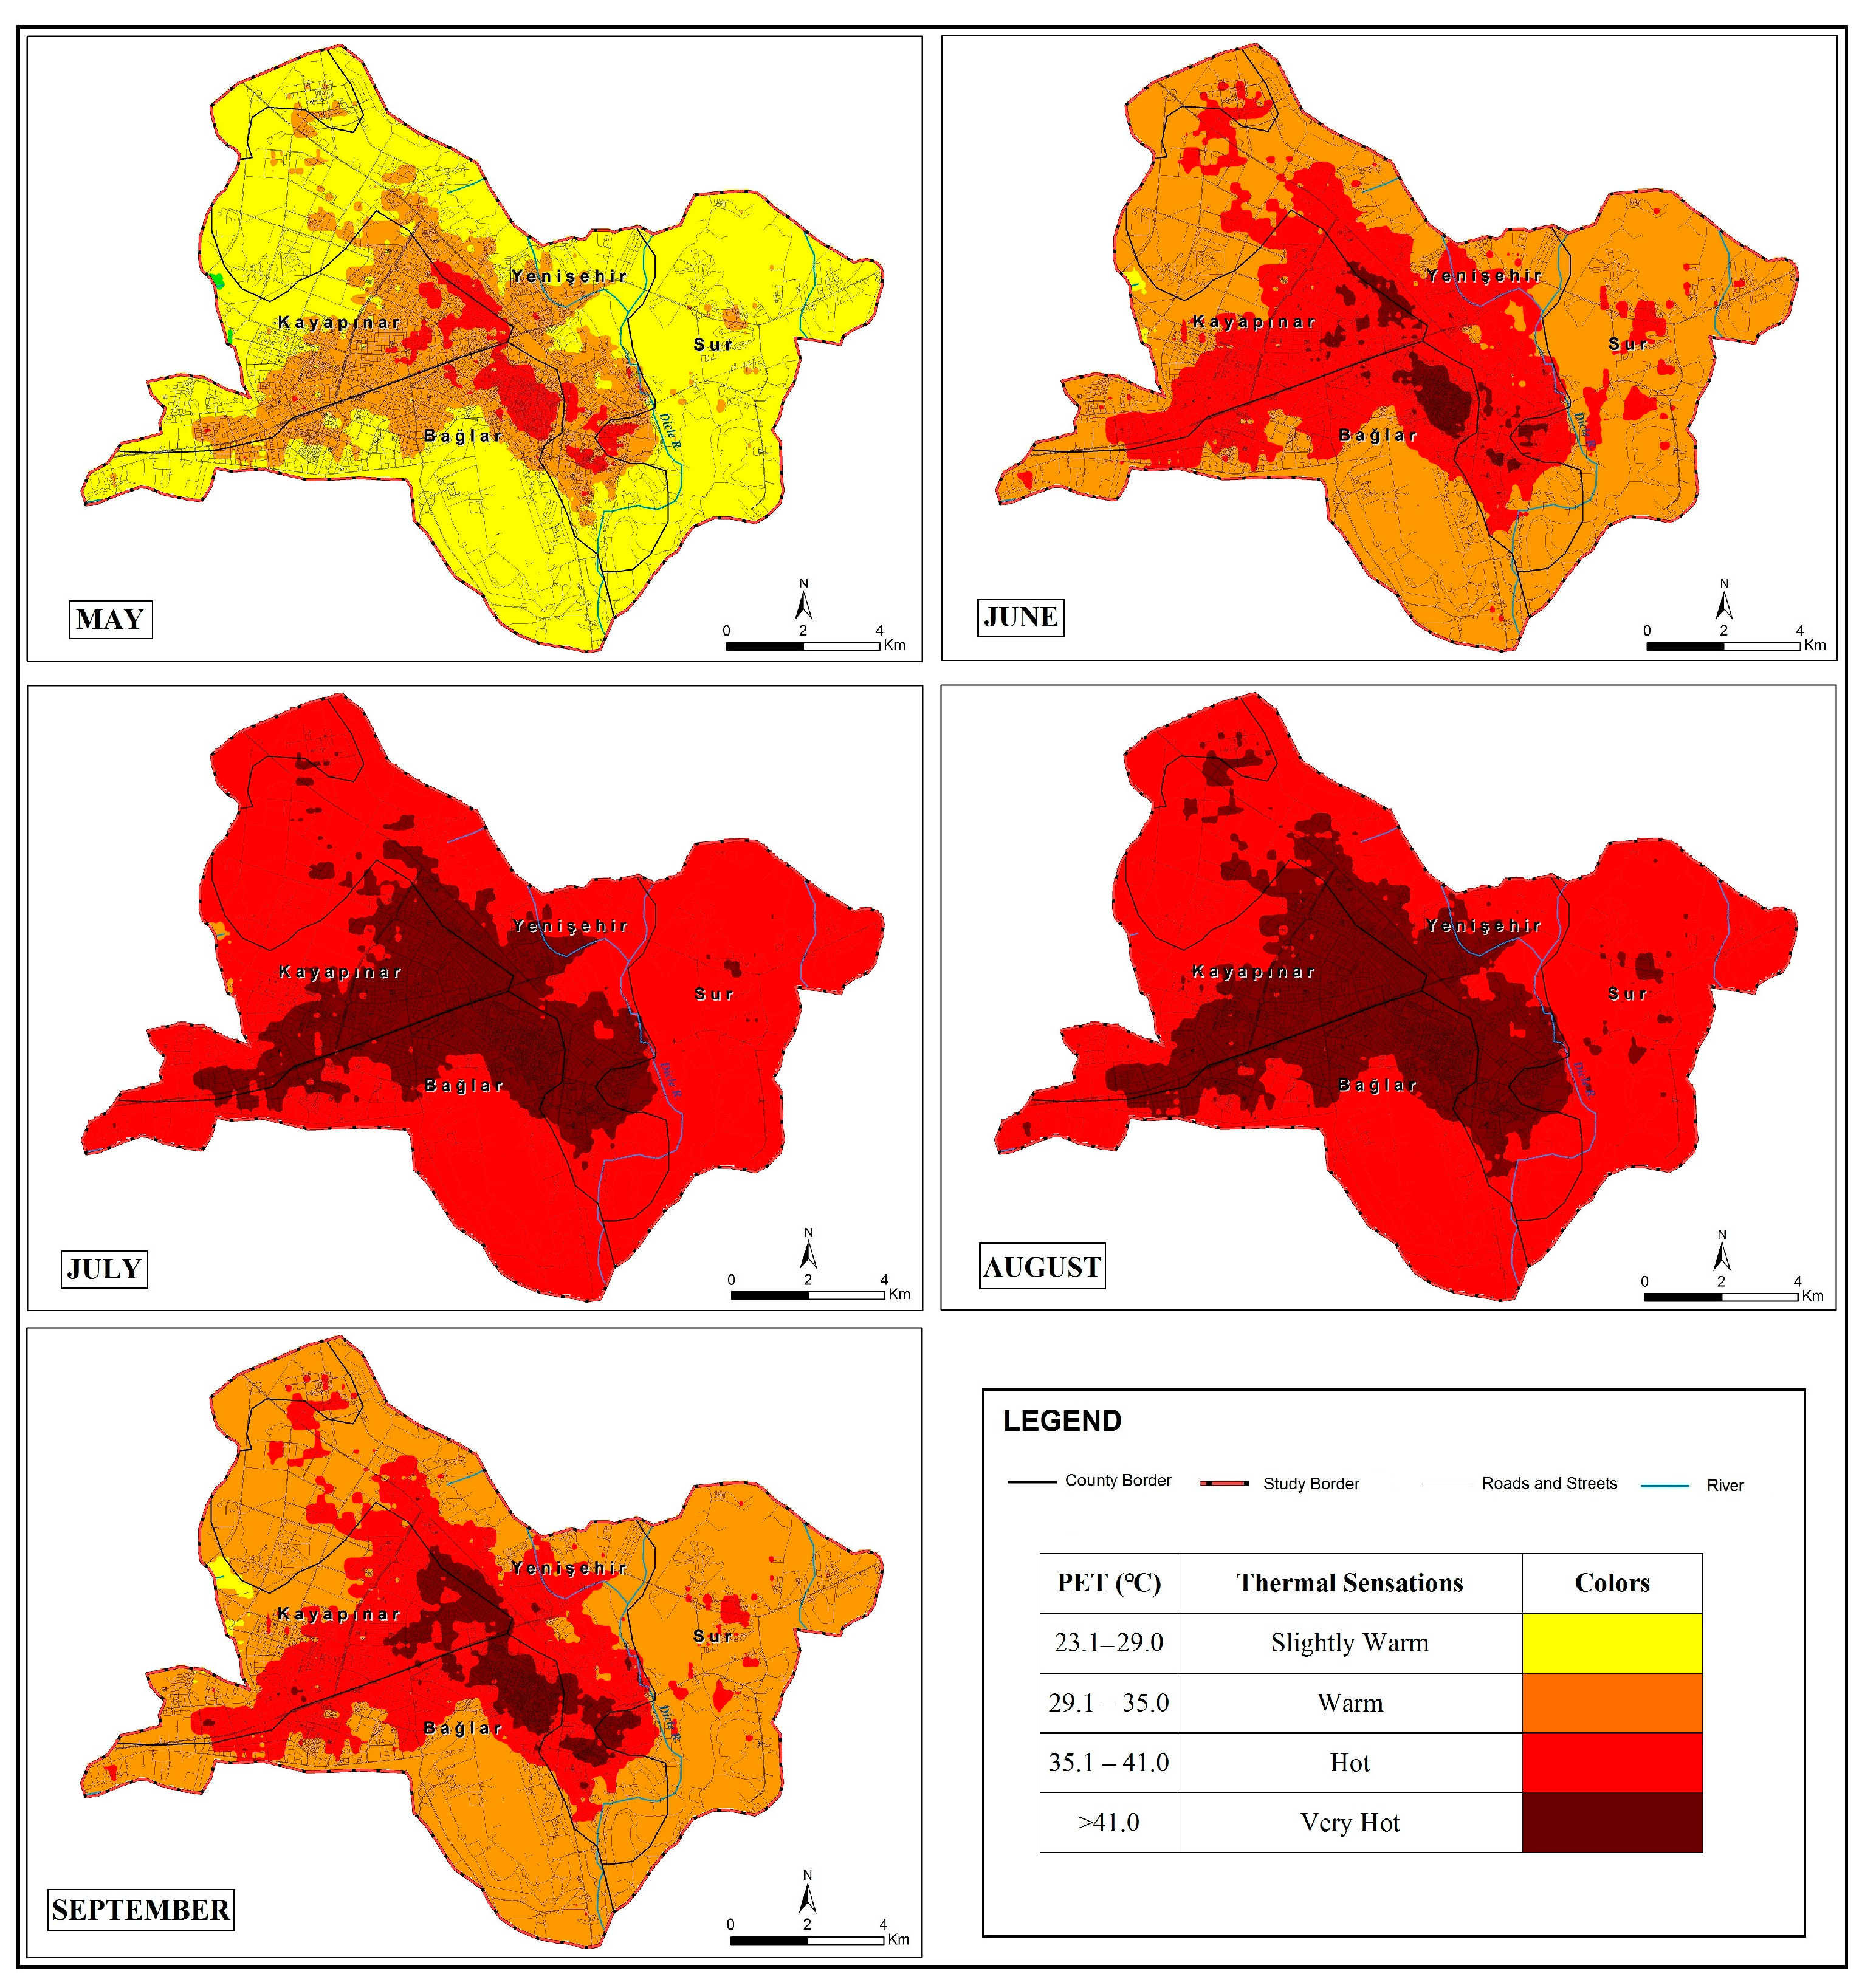
According to projected climate under the SSP-5 scenario, it is predicted that “hot” stressful areas will begin to be experienced in May and “warm” and “slightly warm” stresses will occur in the city. It is determined that “very hot” stressful areas will emerge in June and September and “hot” and “warm” stresses will be dominant. In July and August, “very hot” stressful areas are expected to expand and “very hot” and “hot” stresses are expected to dominate in the field (Figure 9).

3.4. Projected Thermal Comfort Conditions in the Distant Future (2071–2100)

In the distant future, according to both climate scenarios (SSP-2 and SSP-5), it is predicted that there will be no areas with “comfortable” conditions. Again, according to both scenarios, it is expected that “hot” stress areas will be seen in May and “warm” stress and “slightly warm” stress will prevail. In June and September, “very hot” and “hot” stresses are expected to affect larger areas. In July and August, the hottest months of the year, “very hot” and “hot” stresses are expected to dominate at a level that threatens human health (Figure 10 and Figure 11).

3.5. Percentages of Spatial Distribution of Thermal Comfort Conditions

Currently, in May, 17% of the field is under “comfortable” conditions, 73% under “slightly warm” stress, and 10% under “warm” stress. In the near future, according to the SSP-2 scenario, 9% is expected to experience “comfortable” conditions, 75% “slightly warm” stress, 16% “warm” stress, and according to the SSP-5 scenario, 1% “comfortable” conditions, 76% “slightly warm” stress, 2% “warm” stress, and 2% “hot” stress. In the distant future, according to both scenarios, there will be no “comfortable” conditions; 70% will experience “slightly warm” stress, 25% will experience “warm” stress, and 5% will experience “hot” stress according to the SSP-2 scenario, and 61% will experience “slightly warm” stress, 34% will experience “warm” stress, and 6% will experience “hot” stress according to the SSP-5 scenario.
The “slightly warm” stress, which is experienced currently in 30% of the area in June, will be experienced in 8% (SSP-2) and 2% (SSP-5) of the area in the near future and will not be experienced in the distant future. The “warm” stress, which was experienced in 55% of the area in June, is predicted to be experienced in 70% of the area according to both scenarios in the near future and to affect 63% (SSP-2) and 46% (SSP-5) of the area in the distant future. “Hot” stress, which affects 15% of the area, is expected to affect between 22% (SSP-2) and 27% (SSP-5) of the area in the near future and between 34% (SSP-2) and 49% (SSP-5) in the distant future. In addition, it is determined that “hot” stress, which is not experienced in June today, will be experienced in 1% of the area according to the SSP-5 scenario in the near future and between 3% (SSP-2) and 6% (SSP-5) in the distant future.
“Slightly warm” stress, which is currently experienced in 30% of the area in July, is predicted to affect 7% (SSP-2) to 1% (SSP-5) of the area in the near future and no longer in the distant future. “Hot” stress is effective in 57 percent of the area today; it is predicted to affect 75 percent (SSP-2) to 79 percent (SSP-5) of the area in the near future and 74 percent (SSP-2) to 67 percent (SSP-5) of the area in the distant future. While “very hot” stress affects 13% of the area today, it will affect between 18% (SSP-2) and 20% (SSP-5) in the near future and between 26% (SSP-2) and 33% (SSP-5) in the distant future.
The “warm” stress, which affects 7% of the area in August, will not affect 1% of the area in the near future according to the SSP-2 scenario, and will not be effective at all in the far future according to the SSP-5 scenario. “Hot” stress, which affects 76% of the area, is expected to affect between 75% (SSP-2) and 72% (SSP-5) in the near future and between 68% (SSP-2) and 57% (SSP-5) in the distant future. “Very hot” stress is currently affecting 17% of the site, but is predicted to affect between 23% (SSP-2) and 28% (SSP-5) in the near future and between 32% (SSP-2) and 43% (SSP-5) in the far future.
In September, “slightly warm” stress, which affects 23% of the area today, will decrease to 12% (SSP-2) to 5% (SSP-5) in the near future and 1% (SSP-2) in the distant future. “Warm” stress is currently experienced in 61% of the site, in the near future between 68% (SSP-2) and 70% (SSP-5), and in the distant future between 66% (SSP-2) and 51% (SSP-5). “Hot” stress is currently experienced by 16% of the area, while it is predicted to be experienced by 17 % (SSP-2) to 21 % (SSP-5) in the near future and 26 % (SSP-2) to 40 % (SSP-5) in the distant future. While there are no “very hot” stress areas today, they are expected to occur in between 3% (SSP-2) and 4% (SSP-5) of the area in the near future and between 7% (SSP-2) and 10% (SSP-5) in the distant future (Table 6).
In summary, it is predicted that as we move away from the present day, climatically comfortable areas will decrease or not remain at all, while uncomfortable areas will expand and uncomfortable intervals will shift toward the uncomfortable interval on the next step.

4. Discussion

Thermal comfort conditions directly and indirectly affect many activities of people particularly living in the cities. Although the ideal range in terms of thermal conditions is “comfortable”, “slightly warm” stress can be tolerated by many people. However, “hot” and “very hot” stresses are effective enough to threaten human health. Therefore, this study was conducted between May and September, which is the hot period of the year. Changing climatic conditions adversely affect many regions and sectors. Cities are one of the human systems that will be affected by projected climatic changes in the future. Cities are also home to most of the population and generate the most gross domestic product (GDP). Cities are under climatic risks such as heat waves, urban floods due to heavy rainfall events and thunderstorms, and sweltering urban heat islands. By determining the spatial distribution of thermal comfort conditions in the urban area, which is the state of feeling the common effect of all climatic conditions by people, is of great importance for the measures and plans that can be taken to develop projections for the future.
The population of Diyarbakır, a socioeconomically important and historical city in the southeastern Turkey, is constantly increasing. This rate of increase is higher than both Turkey’s and the world’s growth rates. This situation indicates that the density of buildings, traffic, and population will increase in the urban area with future increase in population (Figure 6).
As for the land use pattern in the city of Diyarbakır, dense urban areas will cover more land in the future, while low-density residential areas and rural areas will gradually decrease (Table 5).
In the city of Diyarbakır today, more uncomfortable conditions affect densely built-up areas in urban areas, while slightly more moderate conditions affect semirural and rural areas. When this result is compared with studies reported in the literature that examine the current thermal comfort conditions in cities, it is explained that suburbs are more comfortable than the city center in US cities [31,70]; higher air temperatures are felt in areas where population and settlements are concentrated in European and North American cities [30]; and it is stated that urban areas have a higher air temperature than rural areas in Poland [32]. In a study conducted in Italy, it was concluded that areas with trees within the city are more comfortable [33]. Similar results were found for Hungarian cities [34,71], Swedish cities [72] and Cuba [35]. In the studies conducted in Turkey, similar results were obtained in Erzurum [36], which has harsh continental climate conditions; in Ankara [37] and Eskişehir [17], both of which have a semiarid continental steppe climate; and Samsun [19] on the humid–temperate Black Sea coastal climate zone. These results are similar to the findings concerning the distribution of current thermal comfort conditions in this study.
In terms of thermal comfort conditions, it is predicted that the comfortable areas seen currently in May will not remain in the future and the uncomfortable areas will gradually increase. Especially in July and August, “hot” and “very hot” stresses that threaten human health are expected to affect the entire study area. In addition, it has been determined that “very hot” stress, which is effective only for two months of the year currently, will be effective for four months in the future. It is observed that uncomfortable areas will increase daily and uncomfortable conditions tend to shift toward even more advanced uncomfortable ranges.
Studies examining the effect of climate change on the thermal comfort conditions in cities or developing projections for the future have remained limited in the literature. When these results are compared with the findings of a few studies, it is stated that uncomfortable conditions will increase in the future in Hong Kong, China [40], hot stressful days will increase in Freiburg, Germany [41], and comfortable periods will change and comfortable days will decrease in terms of tourism in Athens, Greece [42]. In studies conducted in Turkey, it has been explained that comfortable periods and days will decrease in terms of tourism in Antalya and its surroundings where Mediterranean climate characteristics are experienced [44,45]. Studies on the effect of climate change on thermal comfort conditions in cities and projections for the future were limited to Amasya and Bolu, two cities in the Black Sea region where humid–temperate climatic conditions are effective. In these studies, it has been determined that uncomfortable conditions will gradually increase in urban areas in the future. In this study, these findings reveal that changes will be more severe in the city of Diyarbakır, which is located in a hot and semiarid climate zone. The findings of the study are mostly similar to other studies.
It is predicted that more uncomfortable conditions will occur with increasing human pressure and the effects of global climate change with the increase in population in urban areas.

5. Conclusions

Currently, it is clearly seen that cities have more unfavorable thermal comfort conditions than their surrounding rural and semirural areas. In addition, the increasing uncomfortable conditions due to climate change together with the urban heat island (UHI) effect experienced due to microclimate conditions in urban areas cause urban residents to be exposed to uncomfortable conditions twice. In order to reduce the climatic risks of cities, urban planners and administrative authorities should take into account the studies revealing the temporal and spatial dimensions of thermal comfort conditions. Heat action plans should be made and implemented to reduce or adapt to the effects of heat waves to be experienced during the hot period of the year. In addition, expert researchers should be included in heat action plans.
In order to reduce both heat stresses and air pollution in the urban area, air circulation should be realized at a sufficient level. For this purpose, climate elements should be taken into consideration in the design of streets and avenues of the city. The amount of green areas that will create local wind (breeze) effect in the city should be increased and these green areas should be distributed evenly in the city. Appropriate plant species should be selected for afforestation of streets and avenues. In addition, water surfaces, such as pools, ponds, etc., create a cool environment and should be designed in accordance with the landscape in the city. Hevsel Gardens, formerly famous in Diyarbakır, nourished the city and minimized the adverse climatic conditions in the city. Designs such as these should be developed in accordance with the traditions of the region.
For climate-resilient, healthy, and comfortable cities, urban design and planning should be carried out with a holistic perspective that takes into account the human, biotic, and physical environmental conditions.

Author Contributions

Data collection, analyses, preparation of maps, and writing of the manuscript were carried out by S.Ç. The design and finalization of the study were carried out by M.T. All authors have read and agreed to the published version of the manuscript.

Funding

This research received no external funding.

Institutional Review Board Statement

Not applicable.

Informed Consent Statement

Not applicable.

Data Availability Statement

The data and methods used in the study can be obtained from the corresponding author (S.Ç.).

Conflicts of Interest

The authors declare no conflict of interest.

References

  1. Bonacina, L.C.W. Landscape meteorology and its reflection in art and literature. Q. J. R. Meteorol. Soc. 1939, 65, 485–498. [Google Scholar] [CrossRef]
  2. Neuberger, H. Climate in art. Weather 1970, 25, 46–56. [Google Scholar] [CrossRef]
  3. Charalampopoulos, I.; Matzarakis, A. Thoughts about the thermal environment and the development of human civilisation. Atmosphere 2022, 13, 1925. [Google Scholar] [CrossRef]
  4. Türkes, M. What does the intergovernmental panel on climate change (IPCC)’s newly released climate change impacts; adaptation and vulnerability report tell us? J. Resil. 2022, 6, 197–207. [Google Scholar]
  5. Schlegel, I.; Muthers, S.; Mücke, H.; Matzarakis, A. Comparison of respiratory and ischemic heart mortalities and their relationship to the thermal environment. Atmosphere 2020, 11, 826. [Google Scholar] [CrossRef]
  6. Yi, C.; Yang, H. Heat Exposure information at screen level for an impact-based forecasting and warning service for heat-wave disasters. Atmosphere 2020, 11, 920. [Google Scholar] [CrossRef]
  7. Ruuhela, R.; Votsis, A.; Kukkonen, J.; Jylhä, K.; Kankaanpää, S.; Perrels, A. Temperature-related mortality in helsinki compared to its surrounding region over two decades, with special emphasis on intensive heatwaves. Atmosphere 2021, 12, 46. [Google Scholar] [CrossRef]
  8. Matzarakis, A.; Cheval, S.; Lin, T.-P.; Potchter, O. Challenges in applied human biometeorology. Atmosphere 2021, 12, 296. [Google Scholar] [CrossRef]
  9. Çağlak, S.; Matzarakis, A. Evaluation of the relationship between thermal comfort conditions and respiratory diseases in Amasya City, Turkey. J. Public Health 2023. online version. [Google Scholar] [CrossRef]
  10. IPCC. Climate Change: Impacts, adaptation and vulnerability. Contribution of working group II to the sixth assessment report of the intergovernmental panel on climate change. In Summary for Policymaker; Pörtner, H., Ed.; Cambridge University Press: Cambridge, UK, 2022. [Google Scholar]
  11. IPCC. Climate Change: Mitigation of climate change. Contribution of working group II to the sixth assessment report of the ıntergovernmental panel on climate change. In Summary for Policymaker; Skea, A., Ed.; Cambridge University Press: Cambridge, UK, 2022. [Google Scholar]
  12. Türkes, M. Climate diplomacy and political economy of climate change. Sci. Utop. 2022, 332, 31–45. [Google Scholar]
  13. Lerner, D. The Passing of Traditional Society Modernizing the Middle East; Free Press: New York, NY, USA, 1964; 466p. [Google Scholar]
  14. Mayer, H. Urban bioclimatology. Experientia 1993, 49, 957–963. [Google Scholar] [CrossRef] [PubMed]
  15. Unger, J. Urban–rural air humidity differences in Szeged, Hungary. Int. J. Climatol. 1999, 19, 1509–15015. [Google Scholar] [CrossRef]
  16. Charalampopoulos, I.; Tsiros, I.; Sereli, A.; Matzarakis, A. Analysis of thermal bioclimate in various urban configurations in Athens, Greece. Urban Ecosyst. 2013, 16, 217–233. [Google Scholar] [CrossRef]
  17. Toy, S.; Çağlak, S.; Esringü, A. Assessment of bioclimatic sensitive spatial planning in a Turkish city, Eskisehir. Atmosfera 2021, 35, 719–735. [Google Scholar] [CrossRef]
  18. Olgyay, V. Design with Climate, Bioclimatic Approach to Architectural Regionalism; Princeton University Press: Princeton, NJ, USA, 1973; 224p. [Google Scholar]
  19. Çağlak, S. The Effects and Possible Consequences of Climate Change on Bioclimatic Comfort Conditions. Ph.D. Thesis, Ondokuz Mayıs University, Samsun, Turkey, 2021. [Google Scholar]
  20. Nastos, P.T.; Giaouzaki, K.N.; Kampanis, N.A.; Matzarakis, A. Acute coronary syndromes related to bio-climate in a Mediterranean area. The Case of Ierathıra, Crete Island, Greece. Int. J. Environ. Health Res. 2013, 23, 76–90. [Google Scholar] [CrossRef] [PubMed]
  21. Nastos, P.T.; Matzarakis, A. The effect of air temperature and human thermal indices on mortality in Athens, Greece. Theor. Appl. Climatol. 2011, 3, 591–599. [Google Scholar] [CrossRef]
  22. Scherber, K.; Langner, M.; Endlicher, W. Spatial analysis of hospital admissions for respiratory diseases during summer months in Berlin taking bioclimatic and socio-economic aspects into account. J. Geogr. Soc. Berl. 2014, 144, 217–237. [Google Scholar]
  23. Huang, F.; Zhao, A.; Chen, R.J.; Kan, H.D.; Kuang, X.Y. Ambient temperature and outpatient visits for acute exacerbation of chronic bronchitis in Shanghai: A time series analysis. Biomed. Envorn. Sci. 2015, 28, 76–79. [Google Scholar]
  24. Blazejczyk, K.; Baranowski, J.; Blazejczyk, A. Climate related diseases. Current regional variability and projections to the year 2100. Quaest. Geogr. 2018, 37, 23–36. [Google Scholar] [CrossRef] [Green Version]
  25. Aboubakri, O.; Kahnjani, N.; Jahani, Y.; Bakhtiari, B. Thermal comfort and mortality in a dry region of Iran, Kerman; a 12-year time series analysis. Theor. Appl. Climatol. 2020, 139, 403–413. [Google Scholar] [CrossRef]
  26. Tabari, H. Climate change impact on flood and extreme precipitation increases with water availability. Sci. Rep. 2020, 10, 137–168. [Google Scholar] [CrossRef] [PubMed]
  27. Trenberth, K.; Dai, A.; van der Schrier, G.; Jones, P.D.; Barichivich, J.; Brifta, K.R.; Sheffield, J. Global warming and changes in drought. Nat. Clim. Change 2014, 4, 17–22. [Google Scholar] [CrossRef]
  28. Rossiello, M.R.; Szema, A. Health effects of climate change-induced wildfires and heatwaves. Cureus 2019, 11, e4771. [Google Scholar] [CrossRef] [Green Version]
  29. Sweileh, W.M. Bibliometric analysis of peer-reviewed literature on climate change and human health with an emphasis on infectious diseases. Glob. Health 2020, 16, 44–58. [Google Scholar] [CrossRef]
  30. Oke, T.R. City size and the urban heat island. Atmos. Environ. 1973, 7, 769–779. [Google Scholar] [CrossRef]
  31. Karl, T.R.; Diaz, H.H.; Kukla, G. Urbanization: Its detection and effect in the United States climate record. J. Clim. 1988, 1, 1099–1123. [Google Scholar] [CrossRef]
  32. Fortuniak, K.; Kłysik, K.; Wibig, J. Urban—Rural contrasts of meteorological parameters in Łódź. Theor. Appl. Climatol. 2006, 84, 91–101. [Google Scholar] [CrossRef]
  33. Bonacquisti, V.; Casale, G.R.; Palmieri, S.; Siani, A.M. A canopy layer model and its application to Rome. Sci. Total Environ. 2006, 364, 1–13. [Google Scholar] [CrossRef] [PubMed]
  34. Gulyás, Á.; Matzarakis, A.; Unger, J. Comparison of the urban-rural comfort sensation in a city with warm continental climate. Ber. Meteorol. Inst. Albert-Ludwigs-Univ. Freibg. 2010, 20, 473–478. [Google Scholar]
  35. Algeciras, J.R.; Tablada, A.; Matzarakis, A. Effect of asymmetrical street canyons on pedestrian thermal comfort in warm-humid climate of Cuba. Theor. Appl. Climatol. 2018, 133, 663–679. [Google Scholar] [CrossRef]
  36. Bulut, Y.; Toy, S.; Irmak, M.A.; Yılmaz, H.; Yılmaz, S. Urban-rural climate differences during the 2-year period in Erzurum province. Atmosfera 2008, 21, 121–133. [Google Scholar]
  37. Çalışkan, O.; Türkoğlu, N. The trend of thermal comfort conditions and the effect of urbanization on thermal comfort conditions in Ankara. J. Geogr. Sci. 2014, 12, 119–132. [Google Scholar]
  38. Brecht, B.M.; Schadler, G.; Schipper, J.W. UTCI climatology and its future change in Germany—An RCM ensemble approach. Meteorol. Z. 2020, 29, 97–116. [Google Scholar] [CrossRef]
  39. Chen, G.; Li, X.; Liu, X.; Chen, Y.; Liang, X.; Leng, J.; Xu, X.; Liao, W.; Qiu, Y.; Wu, Q.; et al. Global projections of future urban land expansion under shared socioeconomic pathways. Nat. Commun. 2020, 11, 537. [Google Scholar] [CrossRef] [PubMed] [Green Version]
  40. Cheung, C.S.C.; Hart, M.A. Climate change and thermal comfort in Hongkong. Int. J. Biometeorol. 2014, 58, 137–148. [Google Scholar] [CrossRef]
  41. Matzarakis, A.; Endler, C. Climate change and thermal bioclimate in cities: Impacts and options for adaptation in Freiburg, Germany. Int. J. Biometeorol. 2010, 54, 479–483. [Google Scholar] [CrossRef]
  42. Nastos, P.T.; Matzarakis, A. Present and future climate—Tourism conditions in Milos Island, Greece. Atmosphere 2019, 10, 97–107. [Google Scholar] [CrossRef] [Green Version]
  43. Larsen, S.F.; Filippín, C.; Barea, G. Impact of climate change on energy use and bioclimatic design of residential buildings in the 21st century in Argentina. Energy Build. 2019, 184, 216–229. [Google Scholar] [CrossRef]
  44. Şensoy, S.; Türkoğlu, N.; Çiçek, İ.; Matzarakis, A. Thermal comfort features of Antalya, future projections using climate model data and its effects on tourism. Turk. J. Geogr. Sci. 2020, 18, 124–160. [Google Scholar]
  45. Kum, G.; Gönençgil, B. Tourism climate comfort of Turkey’s Southwestern Seasides. Gaziantep Univ. J. Soc. Sci. 2018, 17, 70–87. [Google Scholar] [CrossRef] [Green Version]
  46. Çağlak, S. Spatial distribution of bioclimatic comfort conditions of Amasya city and future projections. Mavi Atlas 2022, 10, 182–197. [Google Scholar] [CrossRef]
  47. Çağlak, S.; Türkeş, M. Analysis of spatial distribution of thermal comfort conditions in current and future climate conditions with a new approach; Bolu city example. Turk. J. Geogr. Sci. 2022, 20, 338–358. [Google Scholar]
  48. Öztürk, T.; Turp, M.T.; Türkeş, M.; Kurnaz, M.L. Future projections of temperature and precipitation climatology for CORDEX-MENA domain using RegCM4.4. Atmos. Res. 2018, 206, 87–107. [Google Scholar] [CrossRef]
  49. Erlat, E.; Türkeş, M. Observed changes and trends in numbers of summer and tropical days, and the 2010 hot summer in Turkey. Int. J. Climatol. 2013, 33, 1898–1908. [Google Scholar] [CrossRef]
  50. Bekleyen, A.; Dalkiliç, N. The influence of climate and privacy on indigenous courtyard houses in Diyarbakır, Turkey. Sci. Res. Essays 2011, 6, 908–922. [Google Scholar]
  51. Karadoğan, S.; Drahor, M.G.; Kuzucuoğlu, C. Using geophysical techniques in geomorphological problems: A case study from Kavs Flat in Dicle Valley (South of Diyarbakır). J. Geogr. 2020, 40, 307–322. [Google Scholar]
  52. Yılmaz, E.; Çiçek, İ. Detailed Köppen-Geiger climate regions of Turkey. Int. J. Hum. Sci. 2018, 15, 225–242. [Google Scholar]
  53. Buchhorn, M.; Smets, B.; Bertels, L.; De Roo, B.; Lesiv, M.; Tsendbazar, N.E.; Linlin, L.; Tarko, A. Copernicus Global Land Service; Land Cover 100 m, Version 3 Globe 2015–2019, Product User Manual; Zenodo: Geneve, Switzerland, 2020; 44p. [Google Scholar]
  54. Gao, J.; Pesaresi, M. Downscaling SSP-consistent Global Spatial Urban Land Projections from 1/8-degree to 1-km Resolution 2000–2100. Sci. Data 2021, 8, 281. [Google Scholar] [CrossRef]
  55. O’Neill, B.C.; Tebaldi, C.; Van Vuuren, D.; Eyring, V.; Friedlingstein, P.; Hurtt, G.; Knutti, R.; Kriegler, E.; Lamarque, J.F.; Lowe, J.; et al. The scenario model intercomparison project (ScenarioMIP) for CMIP6. Geosci. Model Dev. 2016, 9, 3461–3482. [Google Scholar] [CrossRef] [Green Version]
  56. Höppe, P. The Physiological Equivalent Temperature—A Universal Index for The biometeorological assessment of the thermal environment. Int. J. Biometeorol. 1999, 43, 71–75. [Google Scholar] [CrossRef]
  57. Matzarakis, A.; Mayer, H.; Iziomon, M.G. Applications of a Universal Thermal Index: Physiological Equivalent Temperature. Int. J. Biometeorol. 1999, 43, 76–84. [Google Scholar] [CrossRef]
  58. Gulyas, A.; Unger, J.; Matzarakis, A. Assessment of the micro climatic and human comfort conditions in a complex urban environment: Modelling and measurements. Build. Environ. 2006, 4, 1713–1722. [Google Scholar] [CrossRef]
  59. Höppe, P. Die Energiebilanz des Menschen; Meteorologisches Institut, Universität München: München, Germany, 1984; 49. [Google Scholar]
  60. Cohen, S.; Palatchi, Y.; Palatchi, D.P.; Bar, L.S.; Lukyanov, V.; Yaakov, Y.; Matzarakis, A.; Tanny, J.; Potcher, O. Mean radiant temperature in urban canyons from solar calculations, climate and surface properties—Theory, validation and ‘Mr.T’ software. Build. Environ. 2020, 178, 106927. [Google Scholar] [CrossRef]
  61. Çağlak, S.; Bahadir, M.; Toy, S. Monitoring the Past and Future Trends of Urban Thermal Comfort Conditions through a New Methodology. Glob. Soc. Welf. 2023. online version. [Google Scholar] [CrossRef]
  62. Steeneveld, G.J.; Koopmans, S.; Heusinkveld, B.G.; Hove, L.W.A.; Holstlag, A.A.M. Quantifying urban heat ısland effects and human comfort for cities of variable size and urban morphology in the Netherlands. J. Geophys. Res. 2020, 116, 1–14. [Google Scholar] [CrossRef]
  63. Koopmans, S.; Ronda, R.; Steeneveld, G.J.; Holstlag, A.A.M.; Tank, A.M.G. Quantifying the effect of different urban planning strategies on heat stress for current and future climates in the agglomeration of the Hague (The Netherlands). Atmosphere 2018, 9, 353. [Google Scholar] [CrossRef] [Green Version]
  64. Perkhurova, A.A.; Konstantinov, P.I.; Varentsov, M.I.; Shartova, N.I.; Samsonov, T.E.; Krainov, V.N. Real-time microscale modeling of thermal comfort conditions in Moscow Region. IOP Conf. Ser. Earth Environ. Sci. 2019, 386, 012046. [Google Scholar] [CrossRef]
  65. Koopmans, S.; Heusinkveld, B.G.; Steeneveld, G.J. A Standardized Physical Equivalent Temperature Urban heat map at 1-m spatial resolution to facilitate climate stress tests in the Netherlands. Build. Environ. 2020, 181, 012046. [Google Scholar] [CrossRef]
  66. Troen, I.; Petersen, E. European Wind Atlas; National Laboratory: Roskilde, Denmark, 1989; 656p. [Google Scholar]
  67. Arslaner, H.; Yavan, S. Local Public Service Delivery Differences Brought by Law No. 6360. Anadolu Univ. J. Soc. Sci. 2016, 2016, 277–290. [Google Scholar]
  68. Aksu, R.; Değerliyurt, M. Planning a model of settlement areas in order to provide a sustainable urban development: Diyarbakir case. In Proceedings of the Tucaum viii. Geography Symposium, Ankara, Turkey, 23–24 October 2014. [Google Scholar]
  69. Kosztra, B.; Büttner, G.; Hazeu, G.; Arnold, S. Updated CLC Illustrated Nomenclature Guidelines; European Enviroment Agency: Wien, Austria, 2019; 126p. [Google Scholar]
  70. Clarke, J.F.; Bach, W. Comparison of the comfort conditions in different urban and suburban microenvironments. Int. J. Biometeorol. 1971, 15, 41–54. [Google Scholar] [CrossRef]
  71. Vitt, R.; Gulyas, A.; Matzarakis, A. Temporal differences of urban-rural human biometeorological factors for planning and tourism in Szeged, Hungary. Adv. Meteorol. 2015, 2015, 987576. [Google Scholar] [CrossRef] [Green Version]
  72. Svensson, M.K.; Eliasson, I. Diurnal air temperatures in built-up areas in relation to urban planning. Landsc. Urban Plan. 2002, 61, 37–54. [Google Scholar] [CrossRef]
Figure 1. Location map of Diyarbakır city.
Sustainability 15 10473 g001
Figure 2. Meteorological stations from which observational data were used in this study.
Sustainability 15 10473 g002
Figure 3. Base maps containing the terrain variables used in the spatial distribution of thermal comfort conditions: (A)—elevation, (B)—solar radiation, (C)—mean radiant temperature, (D)—wind velocity, (E)—land cover, (F)—distribution of PET values by station.
Sustainability 15 10473 g003
Figure 4. Workflow chart for calculating the spatial distribution of PET values.
Sustainability 15 10473 g004
Figure 5. Interannual variation in population of Diyarbakır.
Sustainability 15 10473 g005
Figure 6. Land characteristics and future projections of the city of Diyarbakır.
Sustainability 15 10473 g006
Figure 7. Temporal and spatial distribution of today’s thermal comfort conditions in Diyarbakır city during the hot period of the year.
Sustainability 15 10473 g007
Figure 8. Temporal and spatial distribution of thermal comfort conditions in Diyarbakır city in the hot season of the year in the near future (2021–2050) according to the SSP-2 scenario.
Sustainability 15 10473 g008
Figure 9. Temporal and spatial distribution of thermal comfort conditions in Diyarbakır city in the hot season of the year in the near future (2021–2050) according to projected climate under the SSP-5 scenario.
Sustainability 15 10473 g009
Figure 10. Temporal and spatial distribution of thermal comfort conditions in Diyarbakır city in the hot period of the year in the far future (2071–2100) according to projected climate under the SSP-2 scenario.
Sustainability 15 10473 g010
Figure 11. Temporal and spatial distribution of thermal comfort conditions in Diyarbakır city in the hot period of the year in the far future (2071–2100) according to projected climate under the SSP-5 scenario.
Sustainability 15 10473 g011
Table 1. Long-term average and extreme meteorological values for Diyarbakır city (1929–2022).
ParametersValueDate/Period
Mean air temperature15.9 °CAnnual
Maximum air temperature38.4 °CJuly
Minimum air temperature−2.2 °CJanuary
Relative humidity%55.2Annual
Wind velocity1.1 m/sAnnual
Total precipitation494.4 mmAnnual
Number of rainy days93.9 daysAnnual
Extreme high temperature46.2 °C27 July 1937
Extreme low temperature−24.2 °C11 March 1933
Highest rainfall in a day71.6 mm26 March 1976
Highest snow thickness65 cm16 January 1973
Extreme wind35 m/s1 June 1987
Table 2. Altitude and terrain characteristics of meteorology stations used in this study.
Represented AreaCodeLocationAltitude (m)Surface
U1728137°54′33.01″ N; 40°12′52.89″ E680Dense structured
SU1816637°55′27.48″ N; 40°13′58.43″ E679Loosely structured
SU1728337°56′19.57″ N; 40°17′48.37″ E701Loosely structured
R1728037°54′0.49″ N; 40°12′21.16″ E674No structure
Table 3. Human thermal sensation and stress ranges for PET [59].
PET (°C)Thermal SensationLevel of Thermal Stress
<4.0Very coldExtreme cold stress
4.1–8.0ColdStrong cold stress
8.1–13.0CoolModerate cold stress
13.1–18.0Slightly coolSlightly cold stress
18.1–23.0ComfortableNo thermal stress
23.1–29.0Slightly warmSlightly heat stress
29.1–35.0WarmModerate heat stress
35.1–41.0HotStrong heat stress
>41.0Very HotExtreme heat stress
Table 4. Variables affecting the spatial distribution of the PET index [62,63,64,65].
VariablesAlterationPET (°C)
Wind velocity1 (m/s)2.50
Mean radiant temperature (MRT)1 °C0.6
Elevation100 (m)0.5
Solar radiation (14:00 p.m.)100 (w/m2)0.4
Solar radiation (07:00 a.m.)100 (w/m2)1.2
Table 5. Percentage distribution of land use characteristics of Diyarbakır city according to present and future projections. (S.L.: surface of land).
Urban Land CoverPresent (2020)Near Future (2050)Distant Future
SSP-2SSP-5SSP-2SSP-5
Continuous urban fabric (S.L.: >80%)16%19%23%25%32%
Discontinuous urban fabric (S.L.: 50%)52%52%51%50%45%
Rural area32%29%26%25%23%
Table 6. Percentages of spatial distribution of present and projected future thermal comfort conditions in Diyarbakır city.
Months/RangesPresent (2015–2021)Near Future (2021–2050)Distant Future (2071–2100)
SSP-2SSP-5SSP-2SSP-5
ComfortableSlightly WarmWarmHotVery HotComfortableSlightly WarmWarmHotVery HotComfortableSlightly WarmWarmHotVery HotSlightly WarmWarmHotVery HotSlightly WarmWarmHotVery Hot
M177310 97516 176202 70255 61346
J 305515 87022 270271 63343 46496
J 305713 77518 17920 7426 6733
A 77617 17523 7228 6832 5743
S 236116 1268173 370214166267 504010
Disclaimer/Publisher’s Note: The statements, opinions and data contained in all publications are solely those of the individual author(s) and contributor(s) and not of MDPI and/or the editor(s). MDPI and/or the editor(s) disclaim responsibility for any injury to people or property resulting from any ideas, methods, instructions or products referred to in the content.