Article

Decoupling Analysis of Water Consumption and Economic Growth in Tourism in Arid Areas: Case of Xinjiang, China

1
School of Geography and Ocean Science, Nanjing University, Nanjing 210093, China
2
School of Business Administration, Nanjing University of Finance and Economics, Nanjing 210003, China
3
School of Management, Fudan University, Shanghai 200437, China
4
School of Economics and Management, Shandong Agricultural University, Taian 271002, China
*
Author to whom correspondence should be addressed.
Sustainability 2023, 15(13), 10379; https://doi.org/10.3390/su151310379
Submission received: 19 May 2023 / Revised: 16 June 2023 / Accepted: 20 June 2023 / Published: 30 June 2023

Abstract

:
In recent years, the rapid development of tourism in China’s arid areas has led to a continuous increase in water consumption, heightening the tension between water supply and demand in the region. For this reason, drought-type tourist destinations require a method for estimating the tourism water demand and analyzing the sustainable state of water resources. Existing studies focus on the impact of tourism development on the water resources and environment of tourist destinations. However, few scholars have paid attention to whether tourism development is decoupled from the tourism water footprint. Using an analysis of the tourism water footprint based on the TWF-LCA model and Tapio decoupling theory, this study investigates the relationship between the tourism water footprint and tourism economic growth in Xinjiang from 2003 to 2021. The results show that from 2003 to 2021, the water consumption footprint of the tourism industry in Xinjiang was generally on the rise, and the virtual water consumption of tourists was 3.5 times that of direct water consumption. S-WF is the largest contributor to the total TWF, accounting for 46.13% on average, followed by C-WF, V-WF, Tr-WF, and finally, A-WF, which has the smallest share (less than 5%). The decoupling model shows that, in most years, the tourism water consumption and economy have been in a weak decoupling state, and the growth rate of the tourism water footprint is smaller than the growth rate of the tourism economy. However, in 2007 and 2016, the two were in an expansionary negative decoupling state, that is, the growth rate of the tourism water footprint was greater than the growth rate of the tourism economy. In 2008 and 2019, they were in a weak negative decoupling state, that is, the decline rate of the tourism water footprint was less than the tourism economic recession rate. In 2013, the growth rate of the tourism economy and tourism water footprint declined. Our analysis enriches the literature on tourists’ WF and the impact of tourism activities on water resources, providing a reference for estimating the WF of drought-type tourism and analyzing the sustainability of tourism water resources.

1. Introduction

In recent years, tourism has become an important pillar of economic growth in China’s western regions. Due to its deeply nationalistic historical culture, wonderful natural landscape, and Western development strategies, western China has witnessed rapid tourism growth, attracting extensive attention from academia [1,2,3,4]. Over the past decade, the average number of tourists in western China has increased nearly four-fold, whilst average tourism revenues in western China have increased nearly ten-fold. The average tourism revenues in western China in 2017 reached nearly CNY 4.3 trillion (USD 625.65G), accounting for 29.78% of the average regional GDP [5].
Whilst promoting the development of the regional social economy, tourism aggravates the tension between the supply and demand of local water resources because of its high water consumption [6]. Due to its special geographical structure, the northwest region is one of the most drought-prone areas in China. Local water scarcity issues have been very serious. The water consumption of hotels in some arid tourist destinations has been decreasing [7], while the demand generated by tourist activities still exerts tremendous pressure on the water environment [8]. The limited water resources of the tourism industry in arid areas have resulted in significant spatial transformations and increased consumption of other natural resources [9]. The increasing shortage of water resources has greatly hindered the sustainable development of tourism in arid areas. Understanding the actual consumption of tourism water resources and its relationship with the tourism economy is crucial in addressing the water scarcity problem in arid areas [10,11].
However, a complete research system pertaining to TWF is currently unavailable, as few scholars have studied the tourism water consumption in arid areas [12]. The majority of previous work in this area lacks comprehensiveness and fails to determine a list of tourist WF analyses, resulting in a lack of significant TWF measurements [13,14,15]. Moreover, previous studies have rarely involved or applied WF methods to analyze the impact of tourist activities on water resources and environments.
This study proposes a new conceptual model for estimating water consumption in drought-prone tourist destinations. It also aspires to improve the efficiency of the tourism water use and promote the sustainable development of tourism in arid areas. The researchers’ basis for this endeavor will be the revised TWF model [16,17] and life-cycle analysis of the tourist WF (TWF-LCA) analysis method. These methods comprehensively assess direct and indirect tourism-related water consumption in Xinjiang. At the core area of the new Silk Road Economic Belt, Xinjiang has been developing rapidly under the impetus of “The Belt and Road Initiative”. It has rich tourism resources (including 395 tourist attractions), such as Kanerjing, Tianshan, and Putaogou, which are very attractive to tourists [18]. In the past five years, the annual average number of inbound tourists has been about 1.82 million, and the annual number of domestic tourists has been about 70 million, creating an annual average of nearly CNY 111.5 billion in tourism revenue (National Bureau of Statistics). However, water scarcity issues in Xinjiang are critical [19,20] due to less annual rainfall, abundant sunshine, and a dry climate. The average annual rainfall in Xinjiang is only 0.17 m, which is equivalent to 26.4% of China’s national average annual rainfall (China Statistical Yearbook on Environment). In addition, the per capita daily water consumption of residents is only 11.8 cubic meters. Tourism development is an important factor affecting local water consumption. In order to help these arid regions eliminate poverty, ensure the stability of ethnic areas, and promote regional economic development, tourism must be vigorously developed [21], although this will also intensify the tension between the supply and demand of regional water resources.
The remainder of this article is structured as follows. The next section reviews the recent literature on the tourism WF. The succeeding section introduces the methodological framework and data set for TWF estimates in Xinjiang. Specifically, it assesses the tourism-related demand for physical water and virtual water based on the total tourism-related elements of “food, housing, transportation, travel, shopping and entertainment” and builds a model to analyze the relationship between the demand for water for tourism and economic growth. The following section presents the calculation results pertaining to six elements of tourism in Xinjiang. A decoupling model-based analysis is then carried out to illustrate the increasing demand for water pertaining to tourism growth. This section also discusses possible measures for the sustainable development of tourism in Xinjiang or other arid areas. The last section puts forward several suggestions for sustainable tourism development in arid areas in accordance with these research results. This study enriches research into the tourism water footprint in arid areas and reflects the coordination between the water resources of local tourism and the tourism economy. This is conducive to improving the efficiency of the tourism water use, realizing the coordinated development of the tourism water resources and tourism economy in the region, and providing a basis for decision-making with respect to the development of regional tourism and water resource management policies.

2. Literature Review

2.1. Tourism Water Consumption and Economic Development

The concept of WF was first proposed by Hoekstra [22], who used the concept to measure the industrial, agricultural, and household consumption of freshwater in a certain region or country. Previous studies on WF focused solely on water consumption of agricultural and industrial products [23,24]. However, few academic theses estimated the WF of tertiary industries, especially tourism as a pillar.
Tourism has led to a sharp decline in the quality of drinking water for tourists and local residents [25], and freshwater resources are the basis of tourism development. The early literature regarding tourism and water resources focused primarily on the eco-environmental impact of tourism development, including the impact of tourism on the water environment of tourist destinations [26] and the carrying capacity of tourism resources [27,28,29].
Recent literature increasingly paid attention to the WF (WF) of tourism and was mainly conducted at the national level. Gössling et al. [30] proposed a conceptual model of the tourism WF and analyzed the relationship between tourism and water resource use. Hadjikakou, Chenoweth, and Miller [31] appraised the direct and indirect water use of tourism in the eastern Mediterranean with five illustrative examples of different forms of travel, accommodation, and tourist activities. They then comprehensively assessed and compared the water use and economic impact of different tourist types on a Mediterranean island in 2015 [32]. Cazcarro et al. [33,34] estimated the WF of tourism in Spain by combining the process analysis with input–output (IO) analysis.
The global tourism WF has grown steadily over the past few decades because of the increasing development of tourism. WF has become an important tool for quantitative assessment of the eco-environmental impact of tourism. In terms of the type of research area, the review of former studies on the tourism WF revealed that the main research area is abundant in water. For example, Huang [14] and Liu [15] separately assessed tourism-related direct and indirect water consumption in Sanya and Wuhan. Li [10] assessed tourism-related water consumption, including catering, transport, accommodation, and tourism activities, under four tourism scenarios in China’s Beijing–Tianjin–Hebei region. On research methods, Wang et al. [35] proposed a methodological framework for calculating Huangshan’s tourism-related water consumption based on four elements of tourism, namely, catering, transport, accommodation, and entertainment. Sun et al. [36] presented the decomposition framework of TWF to analyze the reasons for its changes based on an environmentally extended input–output model. He et al. [37] established a water demand calculation model for the tourism industry to calculate the evaluation level of water supply and demand adaptability in arid areas.
Research on the impact of tourism development on water resources is also gradually underway. In many water-stressed areas, tourism is an important factor in local water use; Rico A. [7] outlined the relationship between the change in hotel scale and water-saving measures. Tourism has increased the overall per capita water consumption (especially in arid areas and during the dry season) [30]. Tourism puts greater pressure on the water supply at the regional level and is often a major water consumer in tourist hotspots. Hadjikakou M. et al. [32] proposed that in the foreseeable future, “water use” will become an important parameter for evaluating sustainable tourism, and the quality, quantity, and availability of water resources will have an important impact on the development of tourism. Domestic scholars focus on studying the impact of tourism on the water environment of the destination from the micro-perspective of scenic spots [38,39]. Based on the demand for the sustainable development of tourist spots, they put forward a measurement method for the water resource carrying capacity of tourist destinations [28,29,40,41,42]. Huang Zhenfang et al. [43] took the water resource supply capacity and water body area as important evaluation indicators of the environmental carrying capacity. Skrimizea E. and Parra C. [44] introduced the tourism environment into the ecological framework of the social ecosystem and carried out a qualitative analysis of the water resources pressure in tourism destinations to explore the driving force of pressure changes.
In general, these studies only account for part of the total elements of tourism, resulting in an incomplete accounting framework and small measurement results. The study of the tourism WF is basically in its infancy, lacking correlational studies about the tourism WF in arid areas and a comprehensive measurement framework [11]. Furthermore, the literature rarely studied the relationship between tourism water efficiency and tourism economic growth. However, quantitative analysis of the relationship between economic growth and industrial water consumption is important in alleviating the contradiction between the supply and demand of regional industrial water resources [45]. For industry and agriculture, an ‘inverted U’ relationship exists between water use per capita and GDP per capita [46,47]. Future studies should identify whether the relationship between tourism water use and tourism economic growth is coordinated, especially in arid areas. This subject is of great significance to the sustainable development of tourism and the analysis of the pressure of water resources in tourism.
Considering the significance of the balance between tourism economic growth and eco-environment in arid areas, the structure and trend of water demand for local tourism development must be studied. Currently, to the researchers’ knowledge, no previous discussion attempted to evaluate the demand of tourism water resources and the coordination with the development of local tourism economy in drought-type tourist destinations. To address these issues and promote the development of sustainable tourism in arid areas, the current work attempts to assess the tourism WF in arid areas from the perspective of total elements and then analyze the relationship between tourism water consumption and tourism economic growth using a decoupling model.

2.2. Research Review

Existing studies have proposed a basic model for the calculation of tourism water footprint from the two aspects of direct and indirect water consumption generated by tourism activities, and some scholars have built a water footprint calculation model for tourism destinations based on different factors such as accommodation, catering, transportation, entertainment, and ecology. Scholars have explored and studied the water footprint of islands and Fengshui cities (scenic spots). However, studies on the tourism water footprint of arid and economically backward inland areas are relatively lacking, and there is still a lack of physical and virtual water measurement models to study the tourism water footprint from the perspective of all tourism elements such as food, housing, transportation, tourism, shopping and entertainment in arid areas, resulting in inaccurate estimation of tourism water demand in arid areas. Based on this, this study explores physical water and virtual water among tourism development factors from the perspective of climate characteristics in arid areas, so as to more accurately assess the water demand for tourism development.
From the aspect of tourism water footprint and tourism development, existing studies pay more attention to the water consumption of tourism places and the impact of tourism development on the water resources and water environment of tourism places, and some scholars have calculated the water footprint of tourism places based on the carrying capacity of water resources based on different indicators. However, few scholars have paid attention to whether tourism development and the tourism water footprint are decoupled, so this study constructs a decoupling model of the tourism water footprint and tourism development based on the tourism water footprint in arid areas and explores whether efficient and sustainable development can be achieved between water resources and environment.

3. Study Regional Profiles and Methods

3.1. Study Regional Profiles

Xinjiang is an arid and semi-arid region in northwest China, with low vegetation coverage and most of the land being bare land. Xinjiang is divided into two parts, northern Xinjiang and southern Xinjiang, including 14 prefectures and cities as well as a number of autonomous counties and county-level municipalities, with a total area of 1.66 million km2 and a cultivated land area of 412.46 km2, with a permanent population of 24.45 million at the end of 2017.

3.2. TWF-LCA Method and Decoupling Theory

Tourism is a comprehensive industry centered on tourist consumption activities, including food, housing, transportation, travel, shopping, entertainment, and another six elements. Each tourist consumes a large quantity of the water resources in each link of tourism consumption activities. Therefore, Life Cycle Analysis of Tourist Water Footprint based on the elements of tourism activities (TWF-LCA) is used to identify and analyze the amount of resources, energy, and water resources consumed by tourists and the impact on the environment in the “eating, living, travelling, touring, shopping and entertainment” during a complete journey from the destination to the destination. In other words, based on the analysis of the life cycle system, the water resources consumption of tourism activities is quantified through the whole life cycle process, and the impact is analyzed [48].
The TWF-LCA method is employed to assess tourism-related water resource consumption based on six elements of tourism in Xinjiang, China. From two perspectives of direct water and virtual water, this study established the conceptual model of TWF based on the previous research works by Gössling [15,16]. Figure 1 provides a general description of the framework employed in estimating TWF. Considering that few recreational items for tourism exist in arid areas, this study revised the conceptual model of TWF, as detailed in Equation (1):
T W F = W F c a t e r + W F a c c o m + W F t r a f f + W F v i s i t + W F s h o p
where T W F stands for total tourist water footprint, W F c a t e r stands for dining water footprint, W F a c c o m stands for accommodation water footprint, W F t r a f f stands for traffic water footprint, W F v i s i t for visit water footprint, and W F s h o p for shopping water footprint. See below for specific calculations.
Tourism has faced the uncoordinated development of the economy and environment, especially the relationship between water resource utilization and economic growth in arid areas. Previous literature has shown that many methods can evaluate the relationship between environmental resources and economic growth, such as correlation analysis [49], the Pedori panel cointegration test [50], and the VAR model [51]. Such methods failed to consider the real-time dynamic changes in previous years. A decoupling model can make up for this defect. ‘Decoupling’ was first used by Carter [52] to describe the relationship between energy consumption and economic growth. Decoupling theory essentially reflects the asynchronous change of economic growth, resource consumption, and environmental pressure. Based on previous literature, decoupling theory was widely used in assessing the relationship between economic growth and energy carbon emissions [53,54] or environmental pollution [55]. For example, Pan [56] found that the coordinated relationship between water consumption and economic growth was gradually weakened in Hubei Province. Li et al. [57] measured the change in the water footprint in the Yellow River basin from the structural perspective, and on this basis, analyzed the decoupling state of the water footprint and economic growth.
As far as tourism is concerned, water consumption of all elements of tourism will change due to developments in the infrastructure, management policies, and water-saving awareness of tourists. This change and economic development do not have a linear relationship. It may also be a departure from the trend. Therefore, analyzing the relationship between tourism water resource utilization and tourism economic growth by using decoupling theory is reasonable. Based on previous studies and the index system proposed by the Organization for Economic Cooperation and Development (OCDE), which measures the decoupling relationship between economic growth and environmental pressure, the present study established the decoupling evaluation model of tourism economic growth and water resource pressure in arid areas. Examples of previous studies are Yi et al. [58], who studied the sustainable development of geoparks by using decoupling analysis between the economic growth of tourism and the pressure of eco-environment, and Zhang et al. [59], who proposed the decoupling relationship between the ecological carrying capacity and economic growth. The decoupling model of tourism expressed below is based on the decoupling elasticity coefficient change of Tapio [60]:
E t = Δ T W F Δ T R = ( T W F t T W F t 1 ) / T W F t 1 ( T R t T R t 1 ) / T R t 1
where E t is the decoupling elasticity index in year t.
Δ T W F , Δ T R indicate the change rate of the tourism WF and the tourism revenue, respectively.
T W F t , T W F t 1 refer to the tourism WF in year t and year t − 1, respectively.
T R t , T R t 1 refer to the tourism revenue in year t and year t − 1, respectively.
The data of Xinjiang’s annual total tourism WF and tourism revenue are obtained from calculations based on Equation (1) and the Xinjiang Statistical Yearbook, respectively. The revised standards of decoupling degrees are based on previous studies such as Tapio [60], as shown in Table 1.

3.3. Estimating Tourist’s WF

3.3.1. Date

Basic data: including the number of domestic tourists, number and type of hotels, the number of hotel beds, occupancy rate, number of employees, average length of stay of tourists, per capita shopping consumption, etc., mainly from 2003 to 2021 Xinjiang Statistical Yearbook, China Tourism Statistical Yearbook, and Tourism Sample Survey data.
Standard data: including all kinds of food unit virtual water content, all kinds of water quotas, star hotel energy usage, all kinds of transportation vehicle energy usage, crude oil unit virtual water content, etc., mainly from the “Xinjiang Uygur Autonomous Region domestic water quota”, “Building water supply and drainage design Code (GB50015-2003) [61]”, “surface water environmental quality standards (GB3838-2002) [62], “China Energy Statistical Yearbook”, “China Water Resources Bulletin”, “Xinjiang Water Resources Bulletin” and other official statistical reports and related research documents and standards.
Other data: including the average travel distance, green watering frequency, etc., from the relevant official website, other individual data sources will be marked in the corresponding part of the article.

3.3.2. Catering WF (C-WF)

Food is an indispensable part of people’s lives. Hence, the estimation of C-WF is critical in understanding the water demand for tourism. The direct water consumption related to catering includes water for drinking, washing, and cooking. By contrast, the indirect water consumption consists of food-consumption-related WF and energy-related WF. According to the survey and the related information [24], the consumption rate of healthy drinking water in an arid area is 2000 mL per day. The estimation of the total direct WF for catering is calculated as follows:
D W F cater = 0.002 i m N i T i + 3 q j i m N i T i
where N i and T i refer to the total number and the average stay days of the group i, respectively, and q j refers to water consumption per meal of J-type catering required for a restaurant to be run (e.g., the water for washing and cooking). In the above formula, 0.002 i m N i T i indicates the amount of drinking water for the total number of people involved in the tour, and 3 q j i m N i T i represents the water used for washing and cooking. Tourists and catering staff consume the standard of three meals a day [63]. According to Xinjiang’s household water consumption standard, the average water consumption per meal for dinner is 30 L/person/meal.
The estimation of the total indirect WF for catering follows from multiplying the consumption of different types of food and energy related to catering with its unit virtual water content.
I W F cater = i = 1 m N i T i ( j = 1 n C j V j + t = 1 p E t V t )
where C i and V i refer to the consumption and the unit virtual water content of the food j, respectively, and E t and V t refer to the consumption and the unit virtual water content of the energy t (with reference to the standard consumption of local dwellers), respectively.
The data on the number of tourists and the number of stay days in Equations (3) and (4) are from the China Tourism Statistical Yearbook. Unit food consumption refers to the food consumption of local residents, while unit energy consumption refers to Huang [14], that is, 48.7 MJ/person·time. For the unit virtual water content of food and energy, we refer to the papers by Chapagain and Hoekstra [24]; Hoekstra and Hung [22]; and Okadera, Chontanawat, and Gheewala [64]. The estimation of the indirect water related to catering is based on the values in Table 2.

3.3.3. Accommodation-Related WF (A-WF)

The study on A-WF accounts for a large part of tourism research, but few scholars consider accommodation-related virtual water such as toiletries and energy WF. In this study, A-WF consists of the following: (1) domestic water for tourists and hotel staff (e.g., taking a bath and flushing the toilet), (2) water for public use in hotels, and (3) virtual water hidden in toiletries and energy. Considering that Xinjiang is an arid tourism destination with a limited greening area and mostly drought-resistant vegetation, we have not calculated the water consumption for hotel greening. A-WF is estimated based on Equation (5), Equation (6), and Table 3. The data in Table 3 show that the daily water consumption of tourists and employees of different star hotels in Xinjiang is based on Xinjiang’s household water consumption standard. For ease of estimation, our study computed the first part and the second part together.
D W F a c c o m = i = 1 m ( Q a i + Q b i )
I W F accom = 887.63 M + t = 1 p E t V t
where Q a i is the direct water consumption for tourists; Q b i is the direct water consumption of hotel staff; 887.63 [65] is the virtual water coefficient of toiletries (for every USD 10,000 of toiletries, 887.63 m3 of water is consumed); M is the total annual consumption of toiletries, and this paper assumes that the average price of each set of toiletries is CNY 5 (Table 4); E t and V t refer to the annual consumption and the unit virtual water content of the energy t, respectively. The energy consumption standard of accommodation and energy unit virtual water consumption refer to the papers by Fu [66]; Okadera, Chontanawat, and Gheewala [64]; and Huang [14]. Summation is performed by five different types of accommodation.

3.3.4. Traffic-Related WF (Tr-WF)

Tr-WF includes cleaning water and related energy consumption. However, this study does not include cleaning water because each passenger’s cleaning water consumption is small due to the water-saving cleaning methods in arid cities. Visitors choose different means of transport according to the travel distance during the round trip. Domestic visitors are assumed to travel to Xinjiang by private car, railway, and air, whereas foreign tourists only fly to Xinjiang. Considering Xinjiang’s vast territory, tourists choose different means of transportation, such as aircraft, high-speed railway, coach, and private car. These modes of transportation mainly consist of three ways of travelling, namely, self-driving tour, independent travel, and package tour. The Tr-WF of long-distance energy consumption is based on traffic mileage. We choose the average distance from the provincial capital city of the tourist source of each area to Xinjiang as the traffic mileage (Table 5). In this study, the estimation of Tr-WF is the sum of energy virtual water for different means of transport, based on Table 5, Table 6 and Table 7.
I W F t r a f f = i = 1 m N i D i V i C i
where i is the types of vehicles; and N, D, V, and C denote the passenger volume of tourists (Xinjiang Statistical Yearbook), average travel distance of tourists, the unit virtual water content of energy (Table 6), and per capita energy consumption (Table 7), respectively.

3.3.5. Visiting WF (V-WF)

V-WF is a measure of water used in tourist attractions. It consists of three main parts, namely, landscape, public toilet, and energy water use. The landscape types in Xinjiang are mainly divided into outdoor natural and indoor visiting landscapes. The unit water consumption of public toilets in scenic spots is 35 L per person, as computed based on Xinjiang’s household water consumption standard. The direct water consumption related to visiting is estimated as follows:
D W F v i s i t = Q a + Q b
where Q a and Q b indicate water for public toilets and natural landscape greening, respectively. Water consumption of natural landscape greening is the product of green area and water consumption per unit of green space. The data of the above two indicators are, respectively, from the statistical yearbook and Xinjiang’s household water consumption standard.
Only indoor sightseeing involves energy water use, mainly for electrical energy. Therefore, the estimation of the indirect water consumption related to visiting is the product of the following: number of tourists (data from Xinjiang Statistical Yearbook), unit virtual water content of electric energy (Table 4), unit power consumption of indoor scenic spots (C = 0.01 GJ/person) [54,70], and number of per capita visits to interior landscapes (N), whose data based on our survey of tourists:
I W F v i s i t = 0.43 N n C

3.3.6. Shopping WF (S-WF)

S-WF mainly refers to the virtual water consumption implied by the goods themselves when tourists shop. In this study, shopping-related water consumption is mostly estimated by computing the WF in dried fruits, dried beef, and mutton. The researchers believe that this estimate is plausible because Xinjiang is famous for fruits, beef, and mutton. Visitors to Xinjiang usually buy local specialties, such as dried fruits, dried beef, and mutton, to take home with them but seldom buy anything else. Therefore, S-WF is calculated as follows:
I W F s h o p = N i = 1 m M i V i
where N, M i , and V i refer to the total number of tourists (data from Xinjiang Statistical Yearbook), the per capita purchase, and the unit virtual WF of the local specialty I, respectively.
Among them, the unit purchase volume data is based on our survey of tourists whose result is that the amount of dried fruits per capita is 4.3 kg, and the amount of dried beef and mutton per capita is 1.1 kg, while the unit virtual water content of local specialty products is based on Table 2.

4. Results

4.1. The Tourism WF under Different Tourist Elements

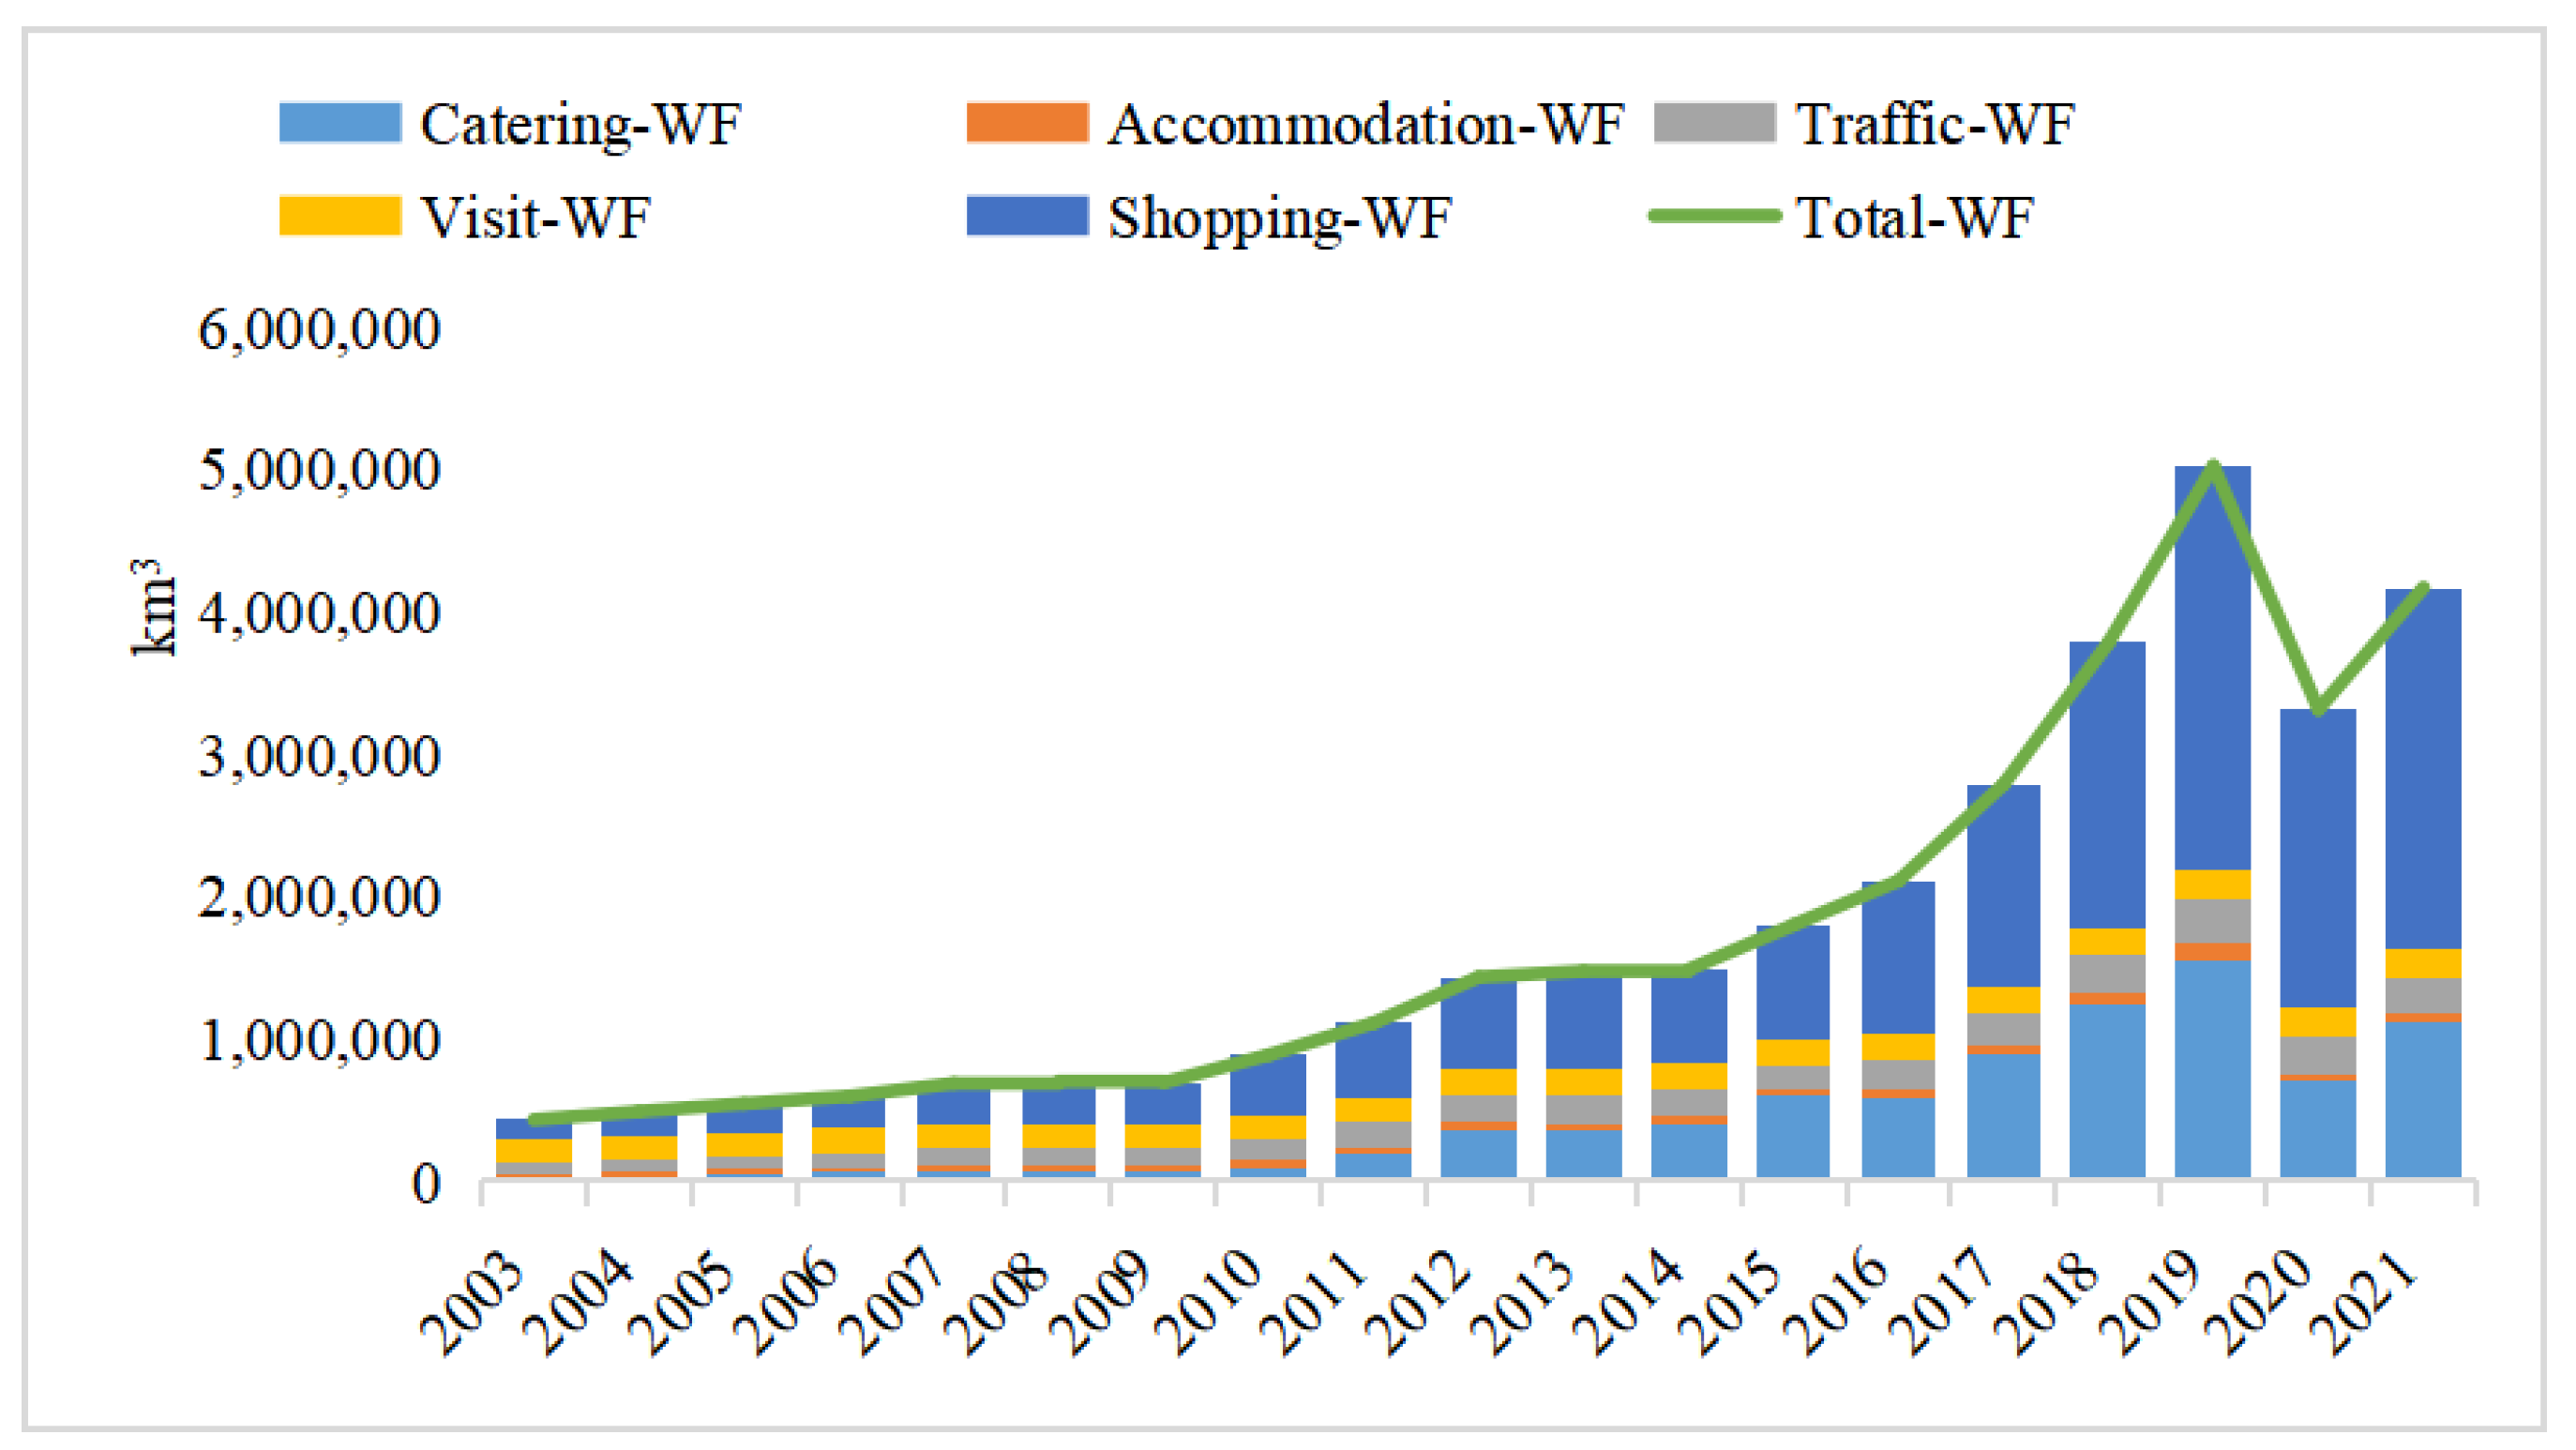
This section presents the results of a case analysis of Xinjiang’s tourist WF from the perspective of five tourist elements. The results of the total tourism WF in Xinjiang are shown in Figure 2. Total TWF provides an effective quantitative confirmation for the increase in global tourism water consumption over time [30]. Beginning in 2010, remarkable growth in C-WF and S-WF is noteworthy compared with other sub-accounts of tourist WF. Figure 3 lists the average share of each sub-account of the tourism WF from 2003 to 2021. S-WF accounts for the largest share 46.13%, whereas A-WF contributes the smallest share (lower than 5%). This finding also reveals that tourists’ virtual water consumption is 3.5 times more than their direct water consumption.
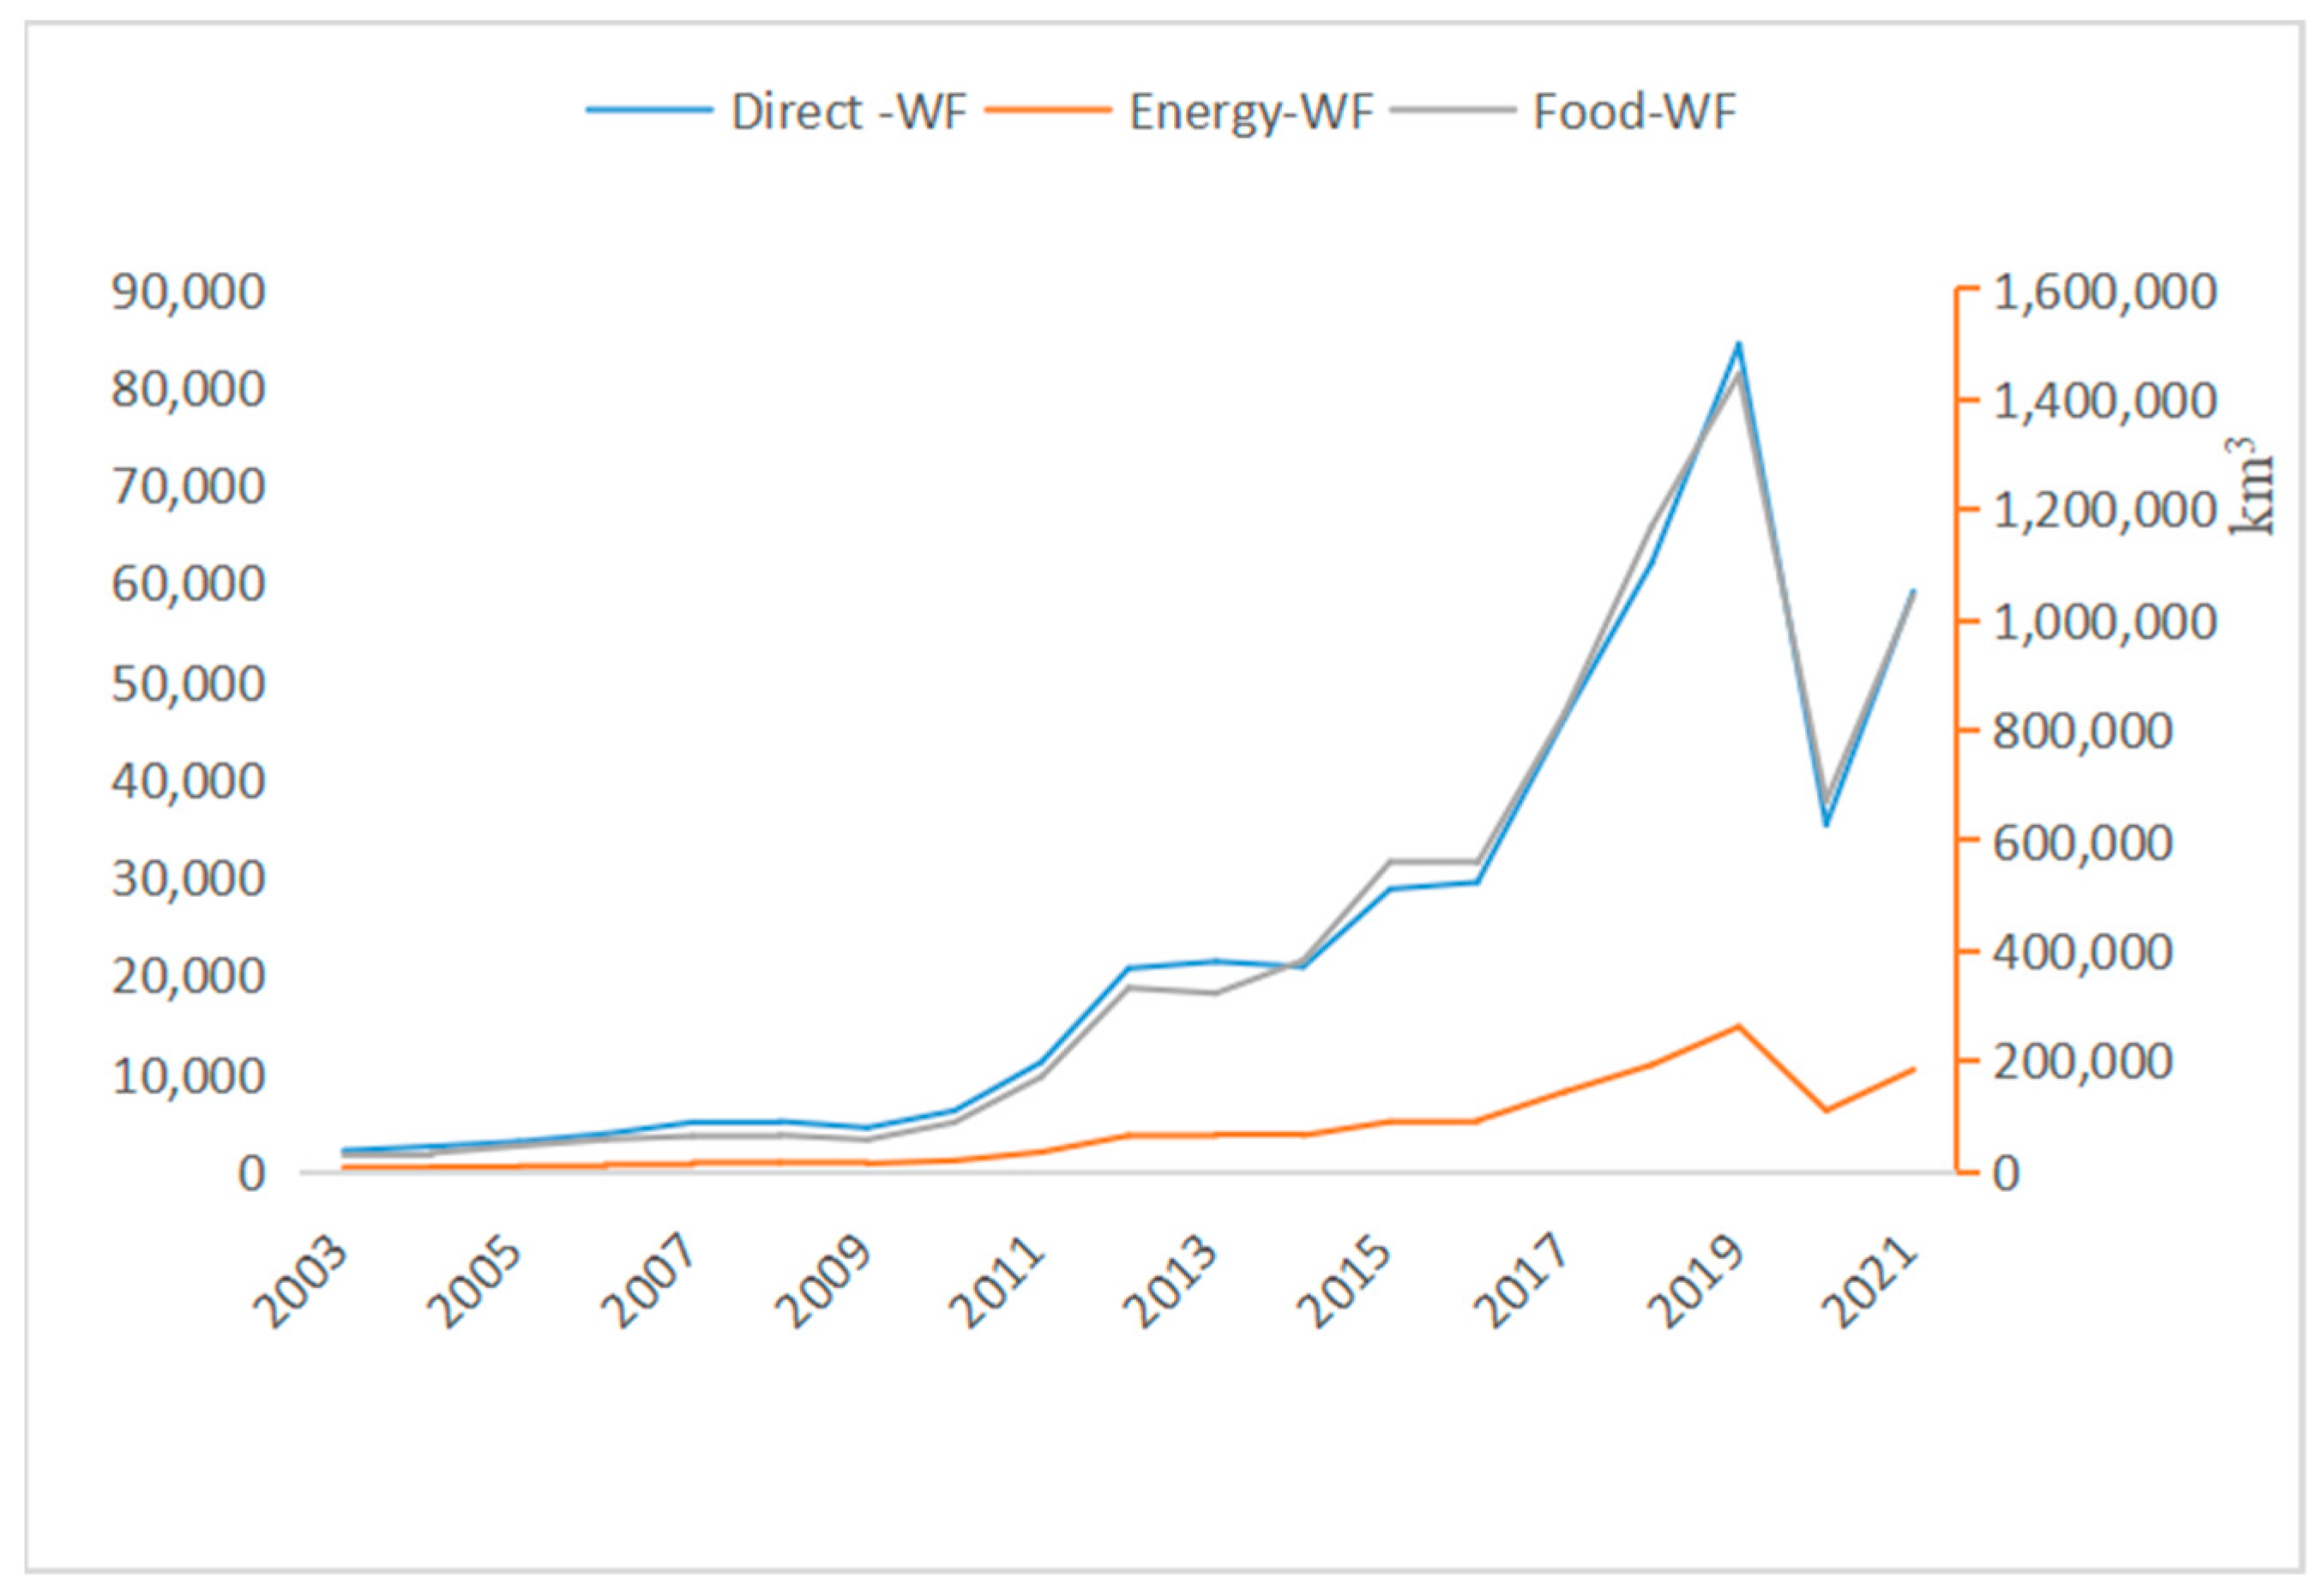
C-WF. Figure 4 shows that C-WF increases rapidly with the development of tourism. F-WF is significantly higher than D-WF and E-WF, which is one of the reasons for the pressure on local tourism water resources.
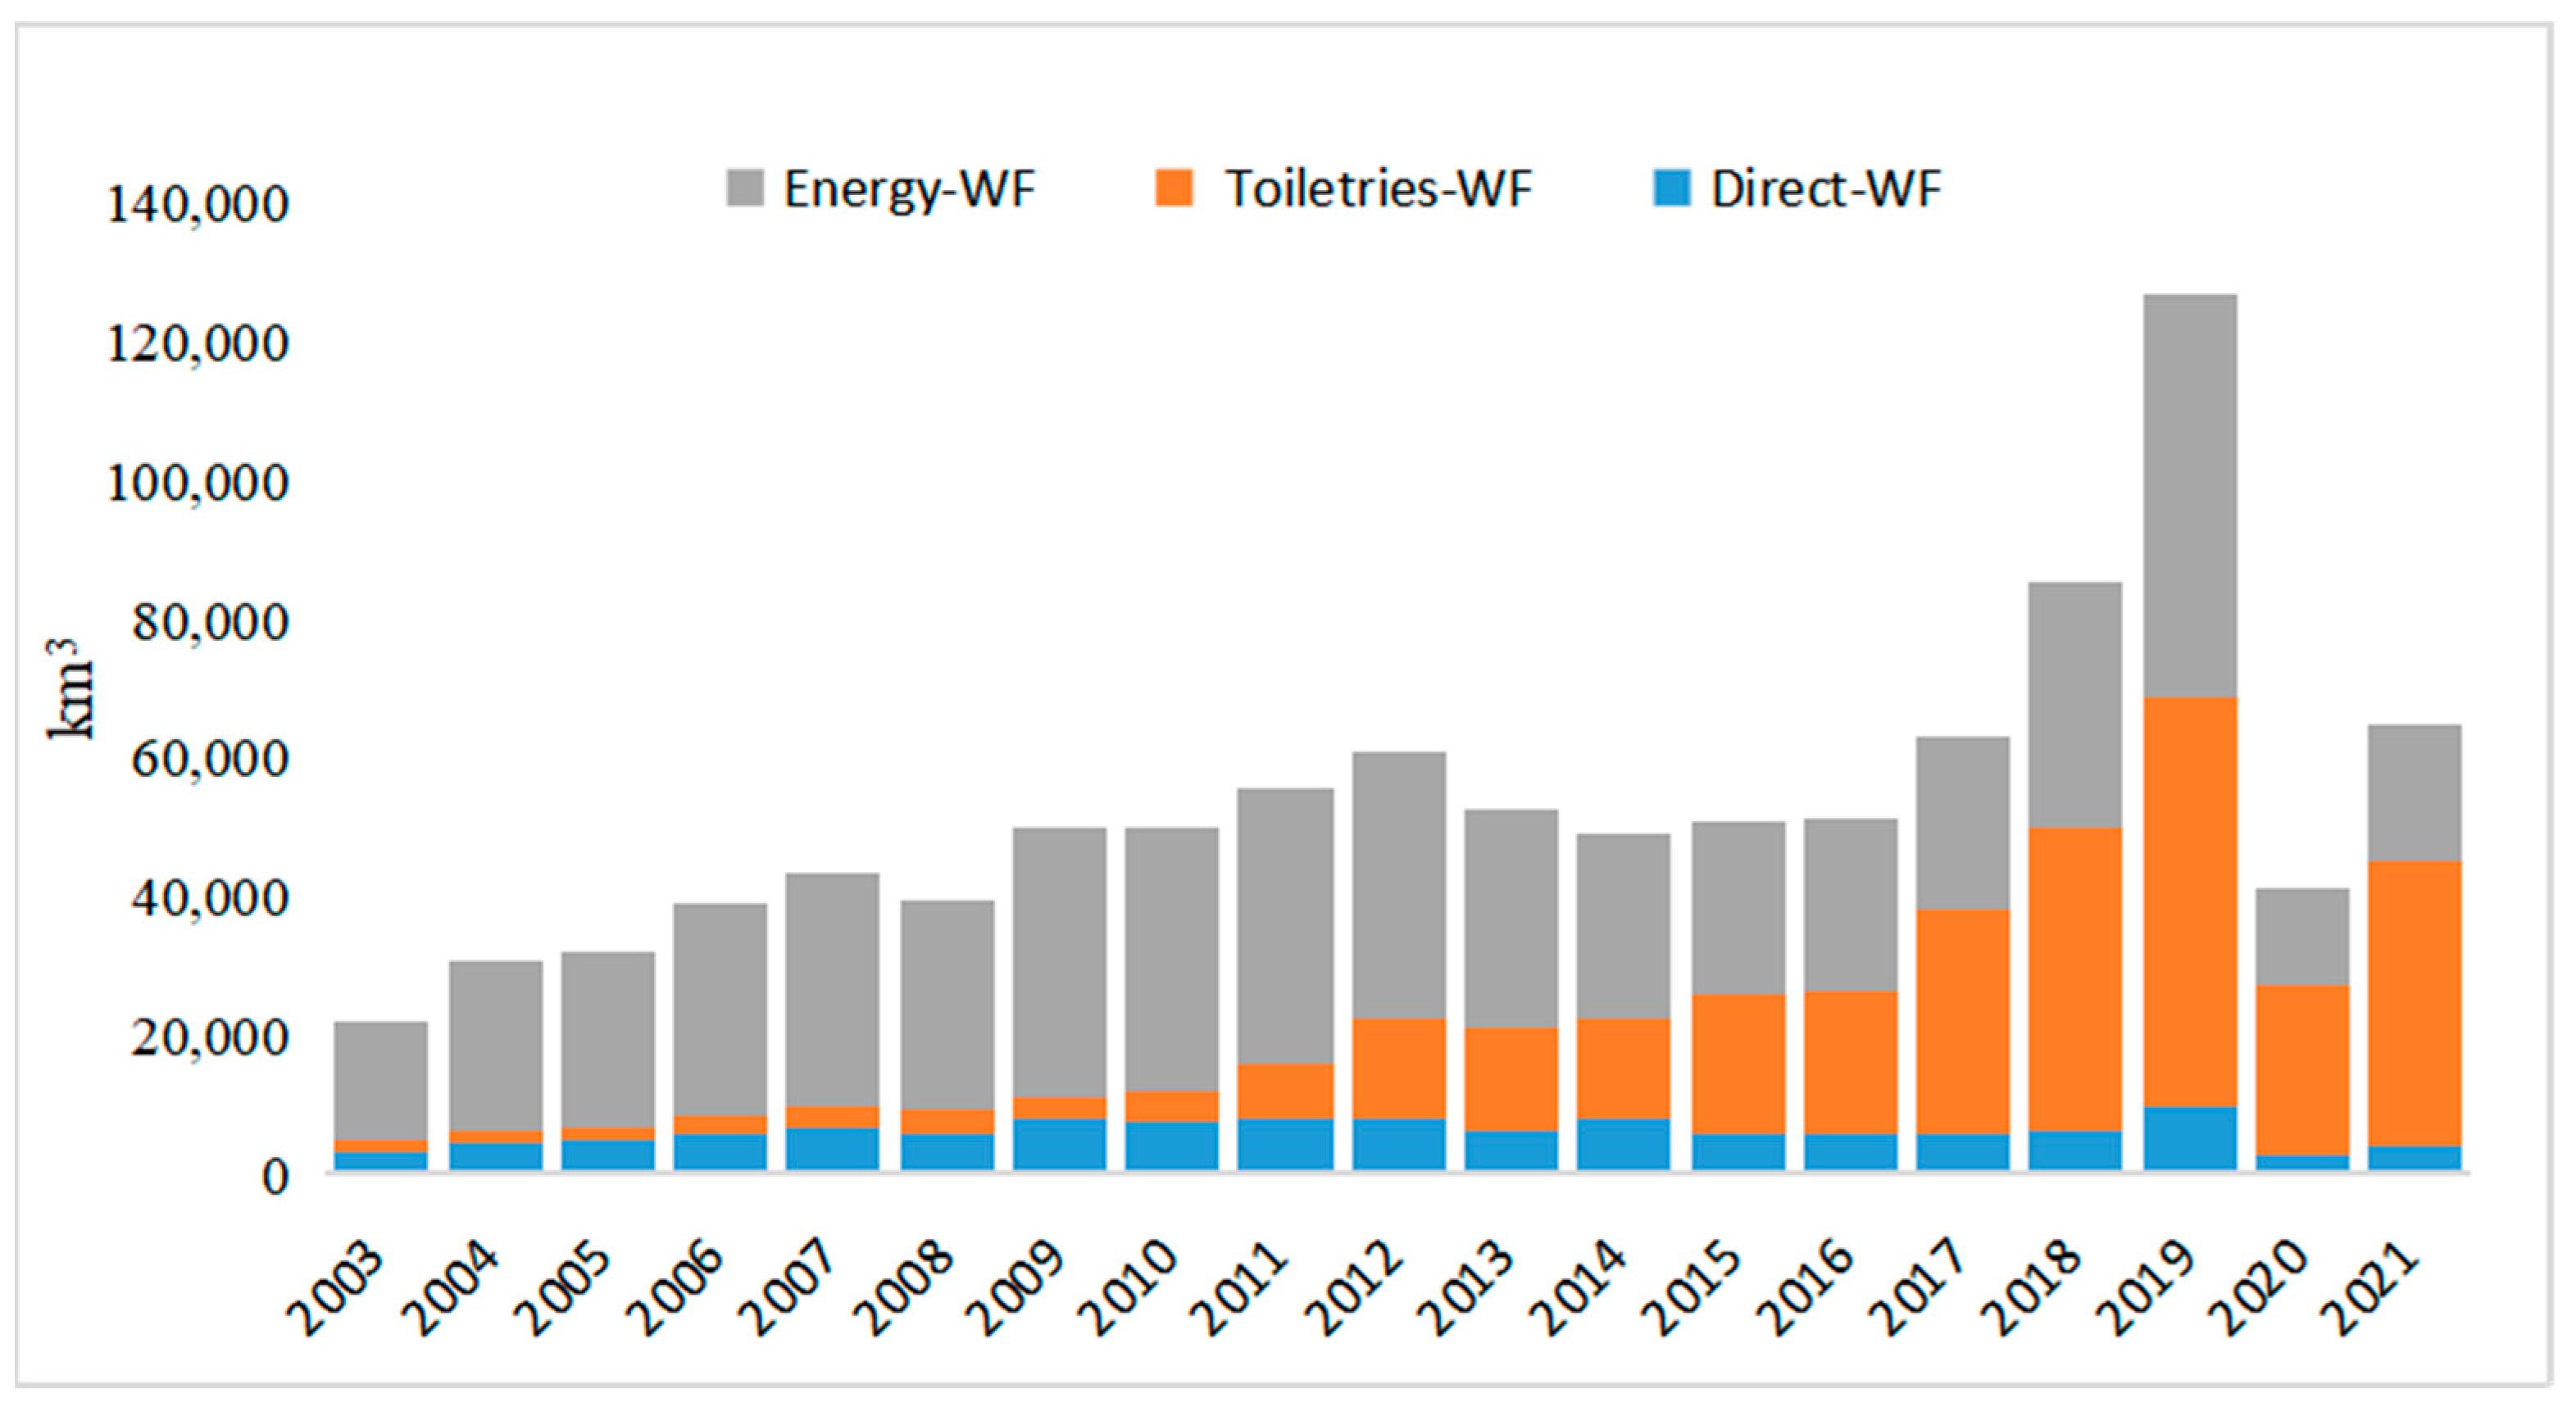
A-WF. A-WF is an important part of TWF because hotels are an important pillar of the tourism industry. This study evaluated A-WF according to Equations (5) and (6), whose results are given in Figure 5. Direct A-WF accounts for 6–16% of the total accommodation-related water use, with virtual water consumption (i.e., energy and toiletries water use) accounting for 84–94%. This result may be due to the water-saving equipment that hotels in arid regions have begun using. Energy consumption, accounting for more than 50%, contributes the largest share of the total A-WF, except for the last three years. By contrast, the share of toiletries consumption soared from 6 to 64%, which was not covered in previous studies [10,14,35]. This finding relates mainly to the increasing number of tourists brought about by the rapid development of tourism.
Tr-WF. Estimation of Tr-WF mainly refers to the energy consumption of different means of transportation chosen by tourists. The number of tourists and their traffic mileage are primarily divided into two parts, that is, (1) external traffic in Xinjiang (Table 8) and (2) inner traffic in Xinjiang (Table 9). Table 10 shows that the unit virtual water consumption of airplanes is significantly more than the other three transport modes, which is 2.12 L per person·km, whereas the coach’s unit virtual water consumption is lowest at only 0.399 L per person·km. However, the results of Tr-WF show that no obvious relationship exists between E-WF and the unit virtual water consumption of transport modes. The importance held by the number of visitors and the choice of transport mode when travelling to and from tourist destinations and in tourist destinations is shown by combining the analysis of WF in Jing-Jin-Ji [10].
V-WF. Considering the drought resistance of vegetation in arid areas, the estimation of water for greening is based on the assumption of once-a-year watering. The results related to visiting WF are shown in Table 11. The virtual water consumption (i.e., E-WF) is much less than the direct water consumption related to visiting, which only accounts for 0.07–1.13%. This finding relates mainly to tourist preferences for outdoor natural landscapes and characteristics of tourism resources in Xinjiang.
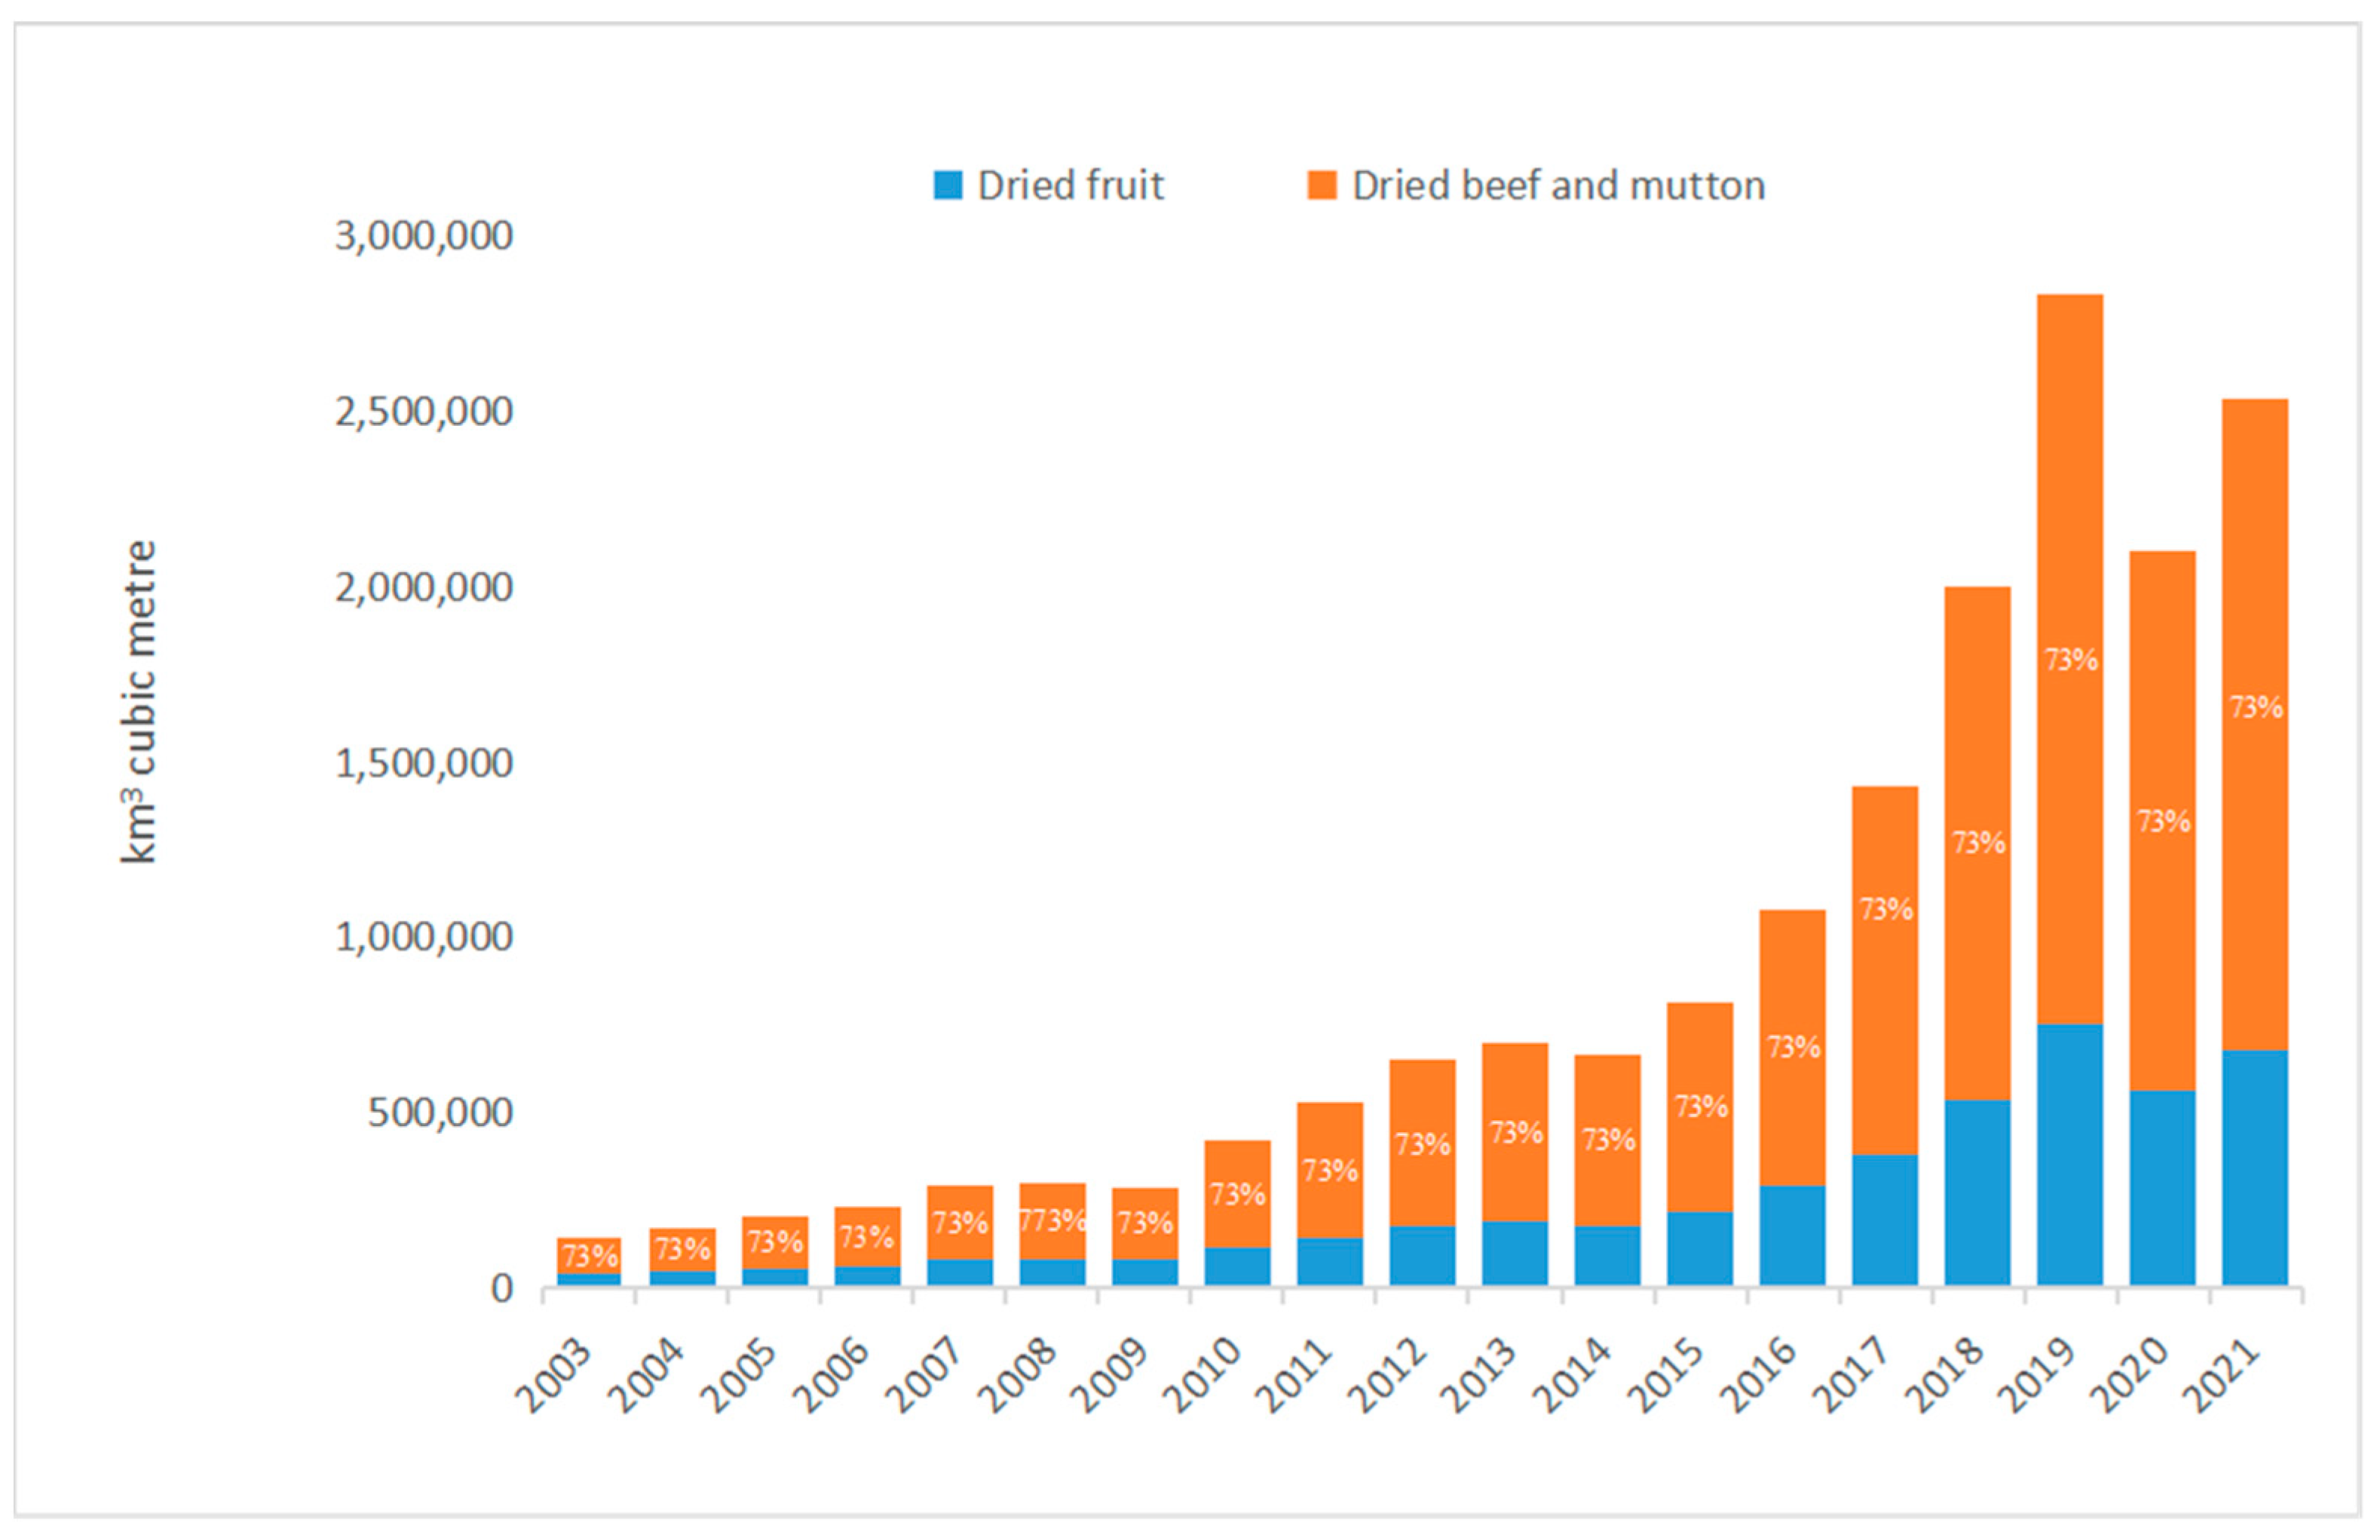
S-WF. Previous studies often ignored S-WF [35], which depended on the number of tourists and the quantity and type of goods purchased by tourists. Figure 6 shows that the WF of purchasing dried beef and mutton far exceeds that of dried fruits, making up 73% of the total shopping water consumption. The impact of the tourist’s choice of commodities is greater than the number of tourists, which is mainly due to the existence of different units of virtual water.

4.2. Decoupling Analysis of Tourism Water Consumption and Tourism Economic Growth

According to the tourism decoupling evaluation index system (Equation (2)) and the decoupling evaluation model constructed above (Table 1), the present research calculated the tourism decoupling index of Xinjiang from 2003 to 2021. Table 12 suggests that the decoupling relationship between tourism water consumption and economic growth in Xinjiang has experienced the following evolution trajectories: weak decoupling → expansive negative decoupling → weak negative decoupling → weak decoupling → strong negative decoupling → weak decoupling → expansive negative decoupling → weak decoupling → weak negative decoupling → weak decoupling. For most of the time in Xinjiang, weak decoupling means that the growth rate of tourism revenue is greater than that of tourism water consumption, with relatively strong sustainability. However, this relationship had different degrees of negative decoupling in 2007–2009, 2013–2014, 2016–2017, and 2019–2020, implying the dissonance between tourism economic growth and tourism water consumption in this period. Especially in 2013–2014, TWF increased by 0.73%, whereas tourism revenue declined by 3.50%. The relationship between tourism water consumption and tourism income is basically in a weak decoupling state, which is still inconsistent and relatively unstable in certain periods. This finding emphasizes the importance of increasing the utilization rate of tourism water resources to reduce the pressure on tourism water resources.

5. Discussion and Conclusions

The primary focus of this study was to deliver a methodological framework, which was used to comprehensively estimate tourism water consumption in arid areas. By employing the TWF-LCA method, this paper proposed a conceptual framework for tourism water use in arid regions which assessed tourist water consumption under five tourist elements. This method is different from the framework system of WF in abundant water areas [14,15]. The results clearly demonstrate that the tourism WF has generally increased in the past 18 years, and tourists’ virtual water consumption far exceeds their direct water consumption. Additionally, this study provides powerful data support for the incomplete framework of previous studies, leading to smaller estimation results. The daily WF at the Qingchenghoushan heritage site is 2.48 m3/person/day [65], whereas the daily WF at Xinjiang is 7.1 m3 person/day. Noticeably, food-related WF (i.e., C-WF and S-WF) is the most water-consuming component of TWF according to the results of the present research and previous research [10,65]. Thus, the water efficiency in the production of all kinds of food must be given attention, in parallel with specific policies that appropriately raise the price of food with high water consumption. In particular, the results of this paper show that the demand for tourism water resources is increasing the pressure on water resources, creating more serious tourism eco-environment problems in arid areas. It made up for the shortcomings mentioned in the research progress of the Chinese tourism footprint family, expanding the scope of empirical analysis [12].
The secondary focus of this study was to analyze the pressure of tourism water resources in arid areas, applying theories and methods of different disciplines to carry out cross-research. In this article, the researchers analyzed the relationship between tourism water consumption and tourism economic growth in Xinjiang based on the revised Tapio decoupling model, which was rarely studied before in the tourism industry. The researchers proposed the decoupling theory of the relationship between tourism water consumption and tourism economic growth. Relative decoupling exists between tourism economic growth and tourism water resource consumption in Xinjiang. By contrast, discord between the two still existed from 2007 to 2008 and from 2016 to 2017. Hence, tourism water use sometimes grows faster than economic growth. Tourism water consumption increased, whereas the tourism economy declined from 2013 to 2015. However, the total water consumption and economic growth in Xinjiang are in a weak decoupling state from 1999 to 2016 [71]. Hence, the water pressure in the tourism industry is particularly serious, which reduces the sustainability of the whole industry including agriculture. No previous study has performed such an in-depth analysis of the sustainable development of water resources for tourism, especially in arid areas. The research results remind people to attach importance to the carrying capacity of tourism water resources whilst developing the tourism industry and promoting the harmonious development of tourism and natural resources.
To alleviate the pressure of local tourism water use and improve the relationship between tourism water consumption and tourism revenue, concurrent economic and educational approaches may be effective. Many kinds of economic means, such as the reformulated ladder water price policy for different tourism sectors, are available. Taxes should be levied on tourists who choose energy-intensive vehicles, such as airplanes and private cars. Considering that many people do not understand virtual water, virtual water should be advocated to be as important as direct water. Therefore, we propose that administrations concerned with various elements of tourism should cooperate with tourism departments to realize the rational distribution of water resources according to local characteristics to improve the efficiency of water use in arid areas.

5.1. Limitations and Future Research Directions

In the process of empirical research, the tourism industry in the case area has obvious seasonal characteristics. However, due to the failure to obtain seasonal data, the minimum time unit chosen in this paper is years, which has a large time scale and cannot reflect the impact of the tourism off-peak season on water resource consumption.
In the calculation process of the tourism water footprint, due to the lack of data on the unit water footprint of local agricultural products and industrial products, as well as the specific consumption amount of tourists, most of the data can only be estimated by using the bottom-up method through the statistical yearbook or the national average data, resulting in certain errors in the calculation results.
Tourism industry links include transportation, accommodation, catering, sightseeing, shopping, entertainment, and other sectors. The consumption of tourism water resources in each sector is different, and the decoupling relationship between tourism water resources and tourism economic growth is not considered in this paper. Further in-depth analysis will be made in subsequent articles.
In view of the shortcomings mentioned above, our future research can focus on the following aspects:
Strengthen large-scale research and narrow the time scale of tourism water footprint research. The water footprint of tourism is studied according to the time scale of quarter or month, so as to understand the consumption of tourism water resources and the pressure of water resources in off-peak and peak seasons, so as to provide more explicit guidance for water resource management.
Strengthen the research on the virtual water footprint of agricultural products, industrial products, and other units. In order to carry out more accurate accounting, field research or a top-down method can be used to obtain more comprehensive data and build a complete basic database.
The follow-up research can focus on the decoupling analysis of the sub-sectors of the tourism industry and compare the decoupling relationship between the consumption of tourism water resources in different sectors and the growth of the tourism economy, which is of more guiding significance for regional tourism water resource management.

5.2. Innovation

This paper enriches the research content of the tourism water footprint and provides a quantitative research case of tourism water footprint in arid areas. Previous studies mostly focused on the relationship between water resources and economic development, and the relationship between tourism carbon emissions and tourism economy, while few studies have examined the relationship between tourism water resources and tourism economy. This study takes the tourism water footprint as the starting point to study the relationship between the tourism water footprint and tourism economic growth, which makes up for the lack of research on tourism water footprint, and can more comprehensively and objectively reflect the relationship between tourism water resources and tourism economy, which has certain innovative significance.

5.3. Managerial Implications and Advice

This paper shows that there is a decoupling relationship between the tourism water footprint and tourism development, so the topic is to achieve sustainable development of hair dyeing tourism by improving water efficiency, reducing the tourism water footprint.
Through the calculation of the water footprint above, it can be found that the indirect water footprint is the largest in the total water footprint of tourism, and the indirect water footprint of Xinjiang is on the rise. The largest indirect water footprint includes the water footprint of dining, sightseeing, and shopping.
Improvements to the public transportation network, optimization of the tourist routes, and achieving the purpose of reducing the tourism water footprint would reduce the indirect water resource consumption of the transport sector [72,73].
In the case of catering and shopping, this part of the indirect water footprint is an important part of the water consumption of tourism. Therefore, the water gap in Xinjiang’s tourism industry can be improved through moderate importation of virtual water, which not only retains Xinjiang’s tourism characteristics but also improves tourists’ satisfaction. In addition, the promotion of “green catering” culture guides tourists to eat economically and encourages tourists to carry out “Disc Action”.
At the same time, when formulating the regional water resource development strategy, the proportion of water used in the primary, secondary, and tertiary industries can be reasonably adjusted according to the local actual situation, and the limited water resources can be more extensively invested in sunrise industries such as tourism, so that water resources can be more rationally used.
As an arid region in the northwest, the development of tourism is affected by water shortage, so in order to achieve sustainable development in the tourism industry, we must adhere to the concept of green, circular, and low-carbon development, promote the integrated development of the tourism industry, and achieve a win–win situation of economic development and environmental protection.

Author Contributions

Writing—original draft, S.C.; conceptualization, methodology, writing—review and editing, Z.H.; conceptualization, methodology, formal analysis, S.W.; software, data curation, J.N. All authors have read and agreed to the published version of the manuscript.

Funding

This research was funded by the National Natural Science Foundation of China (grant number: 42001156), the National Natural Science Foundation of China (grant number: 41920104002).

Institutional Review Board Statement

Not applicable.

Informed Consent Statement

Not applicable.

Data Availability Statement

The data presented in this study are available from the corresponding author.

Conflicts of Interest

The authors declare no conflict of interest.

References

  1. Liu, J.; Feng, T.; Yang, X. The energy requirements and carbon dioxide emissions of tourism industry of Western China: A case of Chengdu city. Renew. Sustain. Energy Rev. 2011, 15, 2887–2894. [Google Scholar] [CrossRef]
  2. Wang, X.; Zhang, H. Establishment and application of regional tourism development potential evaluation system: A case study of western China. J. Arid. Land Resour. Environ. 2013, 27, 203–208. [Google Scholar]
  3. Yang, J.; Wang, J.; Wang, Z. Study on the influencing factors of rural residents’ tourism consumption intention: Based on the micro-data of six western provinces. J. Arid. Land Resour. Environ. 2017, 31, 196–202. [Google Scholar]
  4. Zheng, B.; Ming, Q.; Liu, A.; Zhang, X. A study on the coupling and interactive response between the efficiency of tourism economy and regional economic level in western provinces and regions. World Reg. Stud. 2022, 31, 350–362. [Google Scholar]
  5. National Bureau of Statistics. China Statistical Yearbook; National Bureau of Statistics: Beijing, China, 2018.
  6. Hadjikakou, M. Measuring the Impact of Tourism on Water Resources: Alternative frameworks. Ph.D. Thesis, University of Surrey, Guildford, UK, 2014. Available online: http://epubs.surrey.ac.uk/805395/ (accessed on 19 March 2014).
  7. Rico, A.; Olcina, J.; Baños, C.; Garcia, X.; Sauri, D. Declining water consumption in the hotel industry of mass tourism resorts: Contrasting evidence for Benidorm, Spain. Curr. Issues Tour. 2019, 23, 770–783. [Google Scholar] [CrossRef]
  8. Toth, E.; Bragalli, C.; Neri, M. Assessing the significance of tourism and climate on residential water demand: Panel-data analysis and non-linear modelling of monthly water consumptions. Environ. Model. Softw. 2018, 103, 52–61. [Google Scholar] [CrossRef]
  9. Baños, C.J.; Hernández, M.; Rico, A.M.; Olcina, J. The Hydrosocial Cycle in Coastal Tourist Destinations in Alicante, Spain: Increasing Resilience to Drought. Sustainability 2019, 11, 4494. [Google Scholar] [CrossRef] [Green Version]
  10. Li, J. Scenario analysis of tourism’s water footprint for China’s Beijing–Tianjin–Hebei region in 2020: Implications for water policy. J. Sustain. Tour. 2017, 26, 127–145. [Google Scholar] [CrossRef]
  11. Liu, H.; Jiang, Y.; Zhu, H.; Chen, Y.; Lyu, W.; Luo, W.; Zheng, Q.W. Analysis of water resource management in tourism in China using a coupling degree model. Water Policy 2021, 23, 765–782. [Google Scholar] [CrossRef]
  12. Wang, S.-X.; He, H.; Li, S.; Du, J.-K. Research progress of tourism footprint family in China. J. Nat. Resour. 2019, 34, 424–436. [Google Scholar] [CrossRef]
  13. Yang, M.; Hens, L.; De Wulf, R.; Ou, X. Measuring tourist’s water footprint in a mountain destination of Northwest Yunnan, China. J. Mt. Sci. 2011, 8, 682–693. [Google Scholar] [CrossRef]
  14. Huang, D. Tourism Water Footprint Evaluation and Empirical Study. Master’s Thesis, Hainan University, Haikou, China, 2015. [Google Scholar]
  15. Liu, X. Study on Water Footprint of Tourism Industry—Taking Wuhan as an Example. Master’s Thesis, Central China Normal University, Wuhan, China, 2016. [Google Scholar]
  16. Gössling, S. The consequences of tourism for sustainable water use on a tropical island: Zanzibar, Tanzania. J. Environ. Manag. 2001, 61, 179–191. [Google Scholar] [CrossRef]
  17. Gössling, S. New performance indicators for water management in tourism. Tour. Manag. 2015, 46, 233–244. [Google Scholar] [CrossRef]
  18. Liu, Z.; Wang, A.; Weber, K.; Chan Edwin, H.W.; Shi, W. Categorisation of cultural tourism attractions by tourist preference using location-based social network data: The case of Central, Hong Kong. Tour. Manag. 2022, 90, 104488. [Google Scholar] [CrossRef]
  19. Duan, X.; Luan, F. Evaluation of water resources carrying capacity in Xinjiang based on fuzzy comprehensive evaluation. China Popul. Resour. Environ. 2014, 24, 119–122. [Google Scholar]
  20. Zhou, H.; Zhai, C.; Sun, Z.; Chen, J. Analysis of comprehensive utilization effect and development change of water resources in Xinjiang. J. Arid. Land Resour. Environ. 2016, 30, 95–100. [Google Scholar]
  21. Dong, Y.; Jin, G.; Deng, X.; Wu, F. Multidimensional measurement of poverty and its spatiotemporal dynamics in China from the perspective of development geography. J. Geogr. Sci. 2021, 31, 130–148. [Google Scholar] [CrossRef]
  22. Hoekstra, A.Y.; Hung, P.Q. Globalisation of water resources: International virtual water flows in relation to crop trade. Glob. Environ. Chang. 2005, 15, 45–56. [Google Scholar] [CrossRef]
  23. Wu, M.; Mintz, M.; Wang, M.; Arora, S. Water Consumption in the Production of Ethanol and Petroleum Gasoline. Environ. Manag. 2009, 44, 981–997. [Google Scholar] [CrossRef]
  24. Chapagain, A.K.; Hoekstra, A.Y. Water Footprints of Nations; Value of Water Research Report Series No. 16; UNESCO-IHE Institute for Water Education: Delft, The Netherlands, 2004. [Google Scholar]
  25. Holder, J.S. Pattern and impact of tourism on the environment of the Caribbean. Tour. Manag. 1988, 9, 119–127. [Google Scholar] [CrossRef]
  26. Zhao, M.; Xi, J. Study on tourists’ pollution discharge behavior and water environment disturbance model in tourist areas—A case study of Liupanshan Eco-tourism area. Resour. Sci. 2012, 34, 2418–2426. [Google Scholar]
  27. Shang, T.; Sun, Y.; Li, X.; Xiao, L. Carrying capacity of ecotourism system based on system dynamics. J. Tianjin Univ. (Soc. Sci.) 2009, 11, 277–280. [Google Scholar]
  28. Wang, Q.; Zhang, J.; Yang, X. Analysis on water ecological carrying capacity of Huangshan Scenic Spot. Geogr. Res. 2009, 28, 1105–1114. [Google Scholar]
  29. Jie, Q.; Fu, G.; Liu, M.; Wang, Y.; Xu, J. Research on tourism water resources carrying capacity engineering in Hainan Province. Syst. Eng. Procedia 2011, 1, 384–391. [Google Scholar] [CrossRef] [Green Version]
  30. Gössling, S.; Peeters, P.; Hall, C.M.; Ceron, J.-P.; Dubois, G.; Lehmann, L.V.; Scott, D. Tourism and water use: Supply, demand, and security. An international review. Tour. Manag. 2012, 33, 1–15. [Google Scholar] [CrossRef]
  31. Hadjikakou, M.; Chenoweth, J.; Miller, G. Estimating the direct and indirect water use of tourism in the eastern Mediterranean. J. Environ. Manag. 2012, 114, 548–556. [Google Scholar] [CrossRef]
  32. Hadjikakou, M.; Miller, G.; Chenoweth, J.; Druckman, A.; Zoumides, C. A comprehensive framework for comparing water use intensity across different tourist types. J. Sustain. Tour. 2015, 23, 1445–1467. [Google Scholar] [CrossRef] [Green Version]
  33. Cazcarro, I.; Hoekstra, A.Y.; Sánchez Chóliz, J. The water footprint of tourism in Spain. Tour. Manag. 2013, 40, 90–101. [Google Scholar] [CrossRef]
  34. Cazcarro, I.; Duarte, R.; Sánchez Chóliz, J. Tracking Water Footprints at the Micro and Meso Scale: An Application to Spanish Tourism by Regions and Municipalities. J. Ind. Ecol. 2016, 20, 446–461. [Google Scholar] [CrossRef]
  35. Wang, Q.; Wu, C.; Deng, H.; Yang, X. Water footprint measurement model and empirical analysis of tourist destinations. Sci. Geogr. Sin. 2016, 35, 448–455. [Google Scholar]
  36. Sun, Y.Y.; Hsu, C.-M. The Decomposition Analysis of Tourism Water Footprint in Taiwan: Revealing Decision-Relevant Information. J. Travel Res. 2018, 58, 695–708. [Google Scholar] [CrossRef]
  37. He, Z.; Wang, R. Evaluation model and application of water supply and demand adaptability in tourism industry in arid areas: A case study of Xinjiang, China. J. Nat. Resour. 2021, 36, 3215–3231. [Google Scholar]
  38. Liu, S.; Gao, J. Study on the influence of tourism activities on the water environment of coastal baths. Environ. Monit. China 2013, 29, 1–4. [Google Scholar]
  39. Huang, C.; Jia, T. The influence of tourism activities on water environment of urban forest park—A case study of Gongqing Forest Park in Shanghai. J. Northwest For. Coll. 2010, 25, 192–197. [Google Scholar]
  40. Chang, Y.; Liu, H. Research on water carrying capacity of water resources in arid region of Northwest China based on water footprint theory. J. Shihezi Univ. (Nat. Sci. Ed.) 2015, 1, 116–121. [Google Scholar]
  41. Liang, R. Research on the Carrying Limit of Water Ecology in Idle Tourism Farms: A Case Study of Sichuan Province. China’s Agric. Resour. Zoning 2016, 37, 186–190. [Google Scholar]
  42. Wang, J.; Zhou, H. Carrying capacity of tourism water resources in the northern foothills of the Qinling Mountains in Xi’an. J. Northwestern Univ. (Nat. Sci. Ed.) 2015, 45, 996–1000. [Google Scholar]
  43. Huang, Z.; Yuan, L. Research on Environmental Carrying Capacity Evaluation of Seaside Tourism Sites: A Case Study of Jiangsu Seaside Wetland Ecotourism Sites. Geogr. Sci. 2008, 4, 578–584. [Google Scholar]
  44. Skrimizea, E.; Parra, C. Social-ecological dynamics and water stress in tourist islands: The case of Rhodes, Greece. J. Sustain. Tour. 2019, 27, 1438–1456. [Google Scholar] [CrossRef]
  45. Sun, C.; Liu, L.; Fan, F. Spatial and temporal pattern analysis of China’s industrial water consumption growth quality based on CD-ESDA model. Econ. Geogr. 2020, 30, 1529–1535. [Google Scholar]
  46. Liu, Y.; Du, J.; Zhang, J. Kuznets hypothesis and verification of agricultural water use and economic growth in China. Resour. Environ. Yangtze Basin 2008, 17, 593–597. [Google Scholar]
  47. Zhang, T.; Cheng, S.; Tao, S.; Gao, C.; Zhang, J. Spatio-temporal characteristics of ecological footprint and decoupling effect in Nanjing. Resour. Environ. Yangtze Basin 2017, 26, 350–358. [Google Scholar]
  48. Zhang, R.; Xi, J.; Ge, Q. Tourist Carbon Footprint Analysis Based on Life Cycle Theory: A Measurement Framework and Empirical Research of “Low-carbon Tourism”. Arid. Land Resour. Environ. 2015, 29, 169–175. [Google Scholar]
  49. Koçak, E.; Şarkgüneşi, A. The renewable energy and economic growth nexus in Black Sea and Balkan countries. Energy Policy 2016, 100, 51–57. [Google Scholar] [CrossRef]
  50. Farhani, S.; Solarin, S.A. Financial development and energy demand in the United States: New evidence from combined cointegration and asymmetric causality tests. Energy 2017, 134, 1029–1037. [Google Scholar] [CrossRef]
  51. Qi, Y.; Zhang, Y. Study on the dynamic relationship between the evolution of Beijing’s three industries and PM2.5 emissions. China Population. Resour. Environ. 2015, 25, 15–23. [Google Scholar]
  52. Carter, A.P. The economics of technological change. Sci. Am. 1996, 214, 25–31. [Google Scholar] [CrossRef]
  53. Gai, M.; Cao, G.; Tian, C.; Ke, L. Analysis on the decoupling of energy consumption carbon emission and regional economic growth in Liaoning Coastal Economic Zone. Resour. Sci. 2014, 36, 1267–1277. [Google Scholar]
  54. Lu, N.; Yi, L.; Feng, P. Analysis on the decoupling between water resource utilization and economic development in the capital cities of the five provinces in northwest China. J. Arid. Land Resour. Environ. 2022, 36, 107–112. [Google Scholar]
  55. Xia, Y.; Zhong, M. The relationship between decoupling theory of economic development and environmental pollution and EKC hypothesis. China Popul. Resour. Environ. 2016, 26, 8–16. [Google Scholar]
  56. Pan, A.; Chen, L. An analysis of the decoupling between the utilization of water resources and the coordinated development of economy in Hubei Province—Based on the perspective of water footprint. Resour. Sci. 2014, 36, 328–333. [Google Scholar]
  57. Li, R.; Bai, Y.; Zhou, Y.; Huang, S.; Yan, Z.; Li, Y.; Zhao, H. Decoupling of water resources utilization and economic growth in the Yellow River Basin and decomposition of influencing factors. Sci. Geogr. Sin. 2021, 43, 110–118. [Google Scholar]
  58. Yi, P.; Fang, S.; Ma, C. Evaluation on the decoupling of tourism economic growth and ecological environment pressure in Geopark—A case study of Songshan World Geopark. J. Nat. Resour. 2014, 29, 1282–1296. [Google Scholar]
  59. Zhang, Y.; Pan, B.; Li, J.; Gu, A. Study on the relationship between industrial water use and economic growth in China based on Kuznets Curve. Resour. Sci. 2017, 39, 1117–1126. [Google Scholar]
  60. Tapio, P. Towards a theory of decoupling: Degrees of decoupling in the EU and the case of road traffic in Finland between 1970 and 2001. Transp. Policy 2005, 12, 137–151. [Google Scholar] [CrossRef] [Green Version]
  61. GB50015-2003; Code for design of building water supply and drainage. National Standard of the People’s Republic of China: Beijing, China, 2003.
  62. GB 3838-2002; Environmental quality standards for surface water. National Standard of the People’s Republic of China: Beijing, China, 2002.
  63. The Chinese Dietary Guideinees. Available online: http://dg.en.cnsoc.org/ (accessed on 15 February 2017).
  64. Okadera, T.; Chontanawat, J.; Gheewala, S.H. Water footprint for energy production and supply in Thailand. Energy 2014, 77, 49–56. [Google Scholar] [CrossRef]
  65. Liu, J.; Wu, L.; Li, Y.; Lin, C.; Zhu, H. Study on direct and virtual water consumption of rural tourism in Qingcheng Houshan Heritage Site. Tour. Trib. 2018, 33, 108–116. [Google Scholar]
  66. Fu, G.J. Assessment of ecological footprint of foreign tourists in Hainan Province. Resour. Sci. 2006, 5, 145–151. [Google Scholar]
  67. Kriti, K.; Haresh, K.; Shalini, C.; Samarjit, K. Forecasting foreign tourist arrivals in India using a single time series approach based on rough set theory. Int. J. Comput. Sci. Math. 2022, 16, 340–354. [Google Scholar]
  68. Sharma, H.; Kumar Kumari, K.; Kar, S. Air passengers forecasting for Australian airline based on hybrid rough set approach. J. Appl. Math. Stat. Inform. 2018, 14, 5–18. [Google Scholar] [CrossRef] [Green Version]
  69. Ayres, A. Germany’s water footprint of transport fuels. Appl. Energy 2014, 113, 1746–1751. [Google Scholar] [CrossRef]
  70. Becken, S.; Simmons, D.G. Understanding energy consumption patterns of tourist attractions and activities in New Zealand. Tour. Manag. 2002, 23, 343–354. [Google Scholar] [CrossRef]
  71. Pan, Z.; Xu, C. Analysis on decoupling of water resources utilization and economic growth in China. J. South China Agric. Univ. (Soc. Sci. Ed.) 2019, 18, 97–108. [Google Scholar]
  72. Wang, A.; Zhang, A.; Chan, E.H.W.; Shi, W.; Zhou, X.; Liu, Z. A Review of Human Mobility Research Based on Big Data and Its Implication for Smart City Development. ISPRS Int. J. Geo-Inf. 2020, 10, 13. [Google Scholar] [CrossRef]
  73. Shi, W.; Batty, M.; Goodchild, M.; Li, Q. The digital transformation of cities. Urban Inform. 2022, 1, 1. [Google Scholar] [CrossRef]
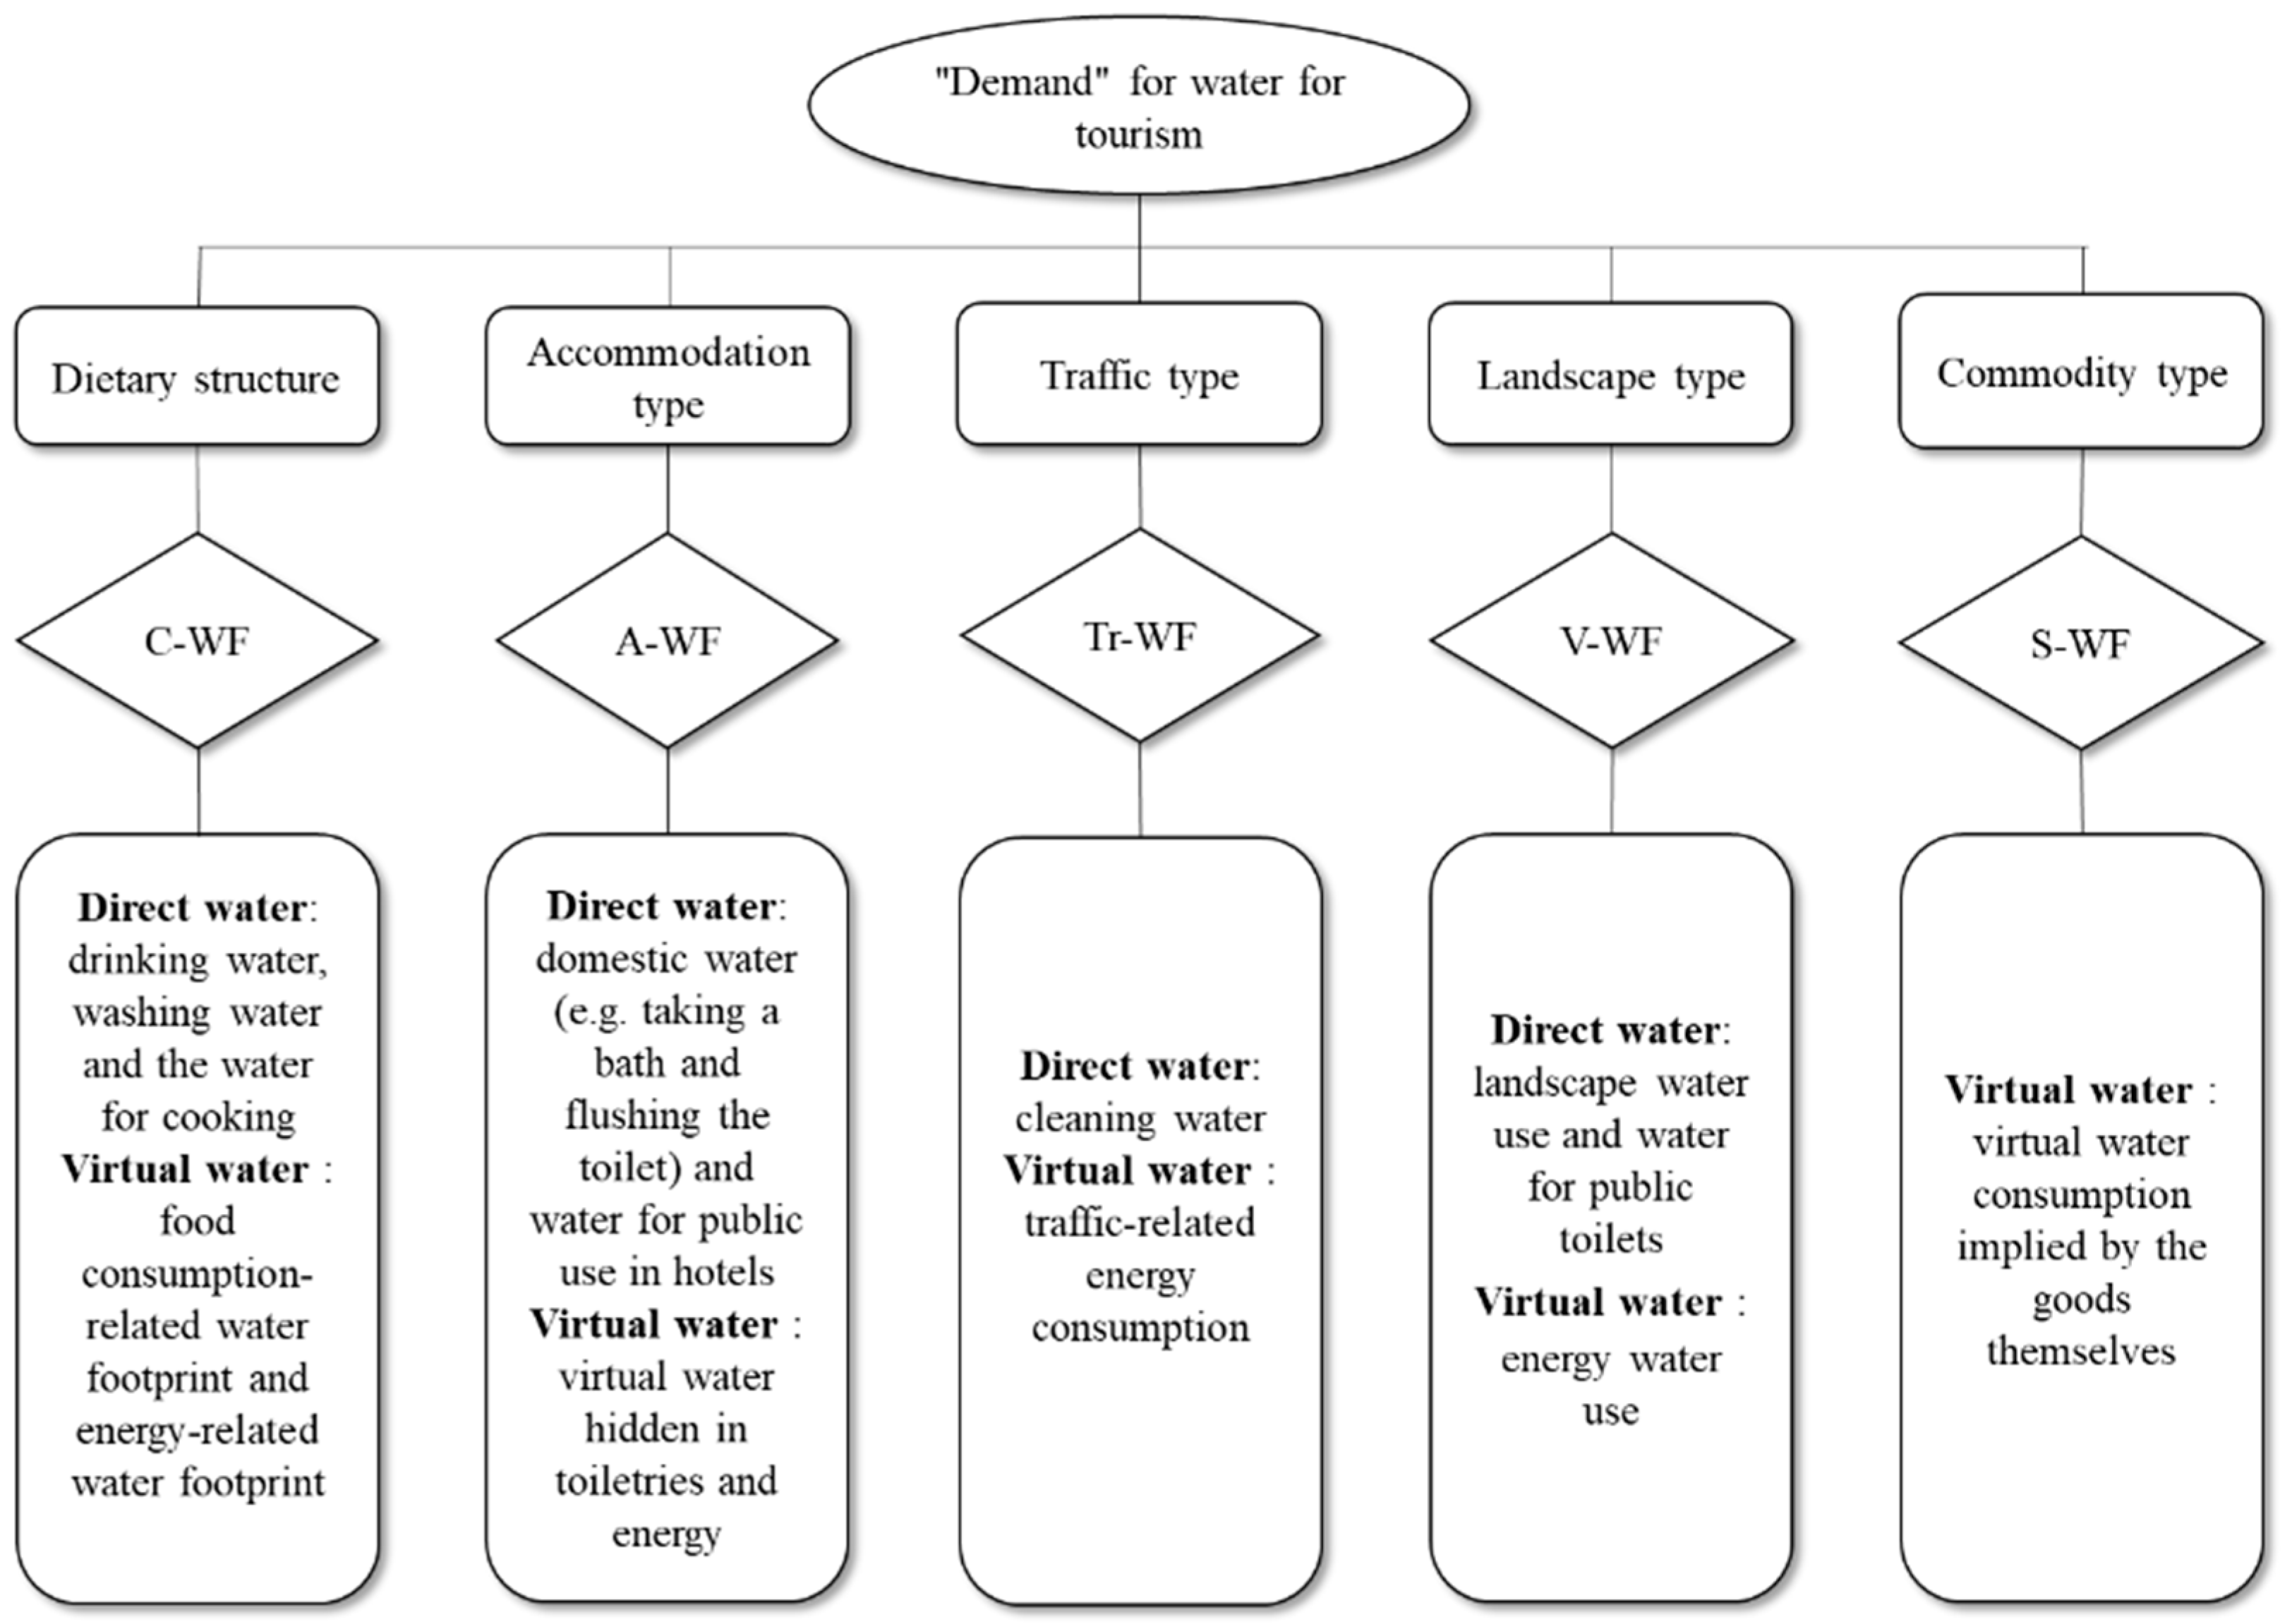
Figure 1. Framework employed in estimating the tourism WF.
Sustainability 15 10379 g001
Figure 2. Changes in total WF and its relationship with sub-accounts.
Sustainability 15 10379 g002
Figure 3. Average share of each sub-account of the tourism WF.
Sustainability 15 10379 g003
Figure 4. Changes in C-WF.
Sustainability 15 10379 g004
Figure 5. Changes in A-WF.
Sustainability 15 10379 g005
Figure 6. Changes in S-WF.
Sustainability 15 10379 g006
Table 1. Revised standards of decoupling degrees.
Decoupling Type Δ T W F Δ T R EtImplication
Strong decoupling<0>0<0Tourism water footprint decline and
Tourism economic growth
Weak decoupling>0>00–0.8Tourism water footprint growth rate <
Tourism economic growth rate
>0>00.8–1
Recessive decoupling<0<01–1.2Tourism water footprint decline rate > Tourism economic recession rate
<0<01.2–2
Critical state>0>0=1Change rate of tourism water footprint = Change rate of tourism economy
<0<0=1
Expansive negative decoupling>0>01–1.2Tourism water footprint growth rate >
Tourism economic growth rate
>0>01.2–2
Weak negative decoupling<0<00–0.8Tourism water footprint decline rate <
Tourism economic recession rate
<0<00.8–1
Strong negative decoupling>0<0<0Tourism water footprint growth and
Tourism economic decline
Data source: Reprinted with permission from Ref. [60], Tapio 2005.
Table 2. Unit virtual water content of different consumption items.
Categories of Catering ConsumptionUnit Virtual Water Content
cereal1.972 (m3/kg)
oil3.26 (m3/kg)
vegetables0.15 (m3/kg)
beef and mutton8.881 (m3/kg)
poultry3.652 (m3/kg)
aquatic product5.00 (m3/kg)
dairy1.00 (m3/kg)
fruit0.82 (m3/kg)
natural gas0.11 (m3/GJ)
Data source: Reprinted with permission from Ref. [24], Chapagain and Hoekstra 2004; with permission from Ref. [22], Hoekstra and Hung, 2005; with permission from Ref. [64], Okadera, Chontanawat, and Gheewala, 2014.
Table 3. Tourist average daily water consumption for accommodation in Xinjiang.
Accommodation TypeAverage Water Consumption L/Bed·Day (Tourist)Average Water Consumption L/Bed·Day (Hotel Staff)
Five-star luxury hotel45080
Four-star high-grade hotel400
Three-star comfortable hotel375
Economy hotel200
Hostel150
Data source: Based on Xinjiang’s household water consumption standard.
Table 4. Unit consumption and virtual water content of unit energy of tourists related to indirect water consumption of accommodation in Xinjiang.
TypeUnit ConsumptionUnit Virtual Water Content
toiletriesCNY 5/person·day-
electric energy3 kwh/bed·day0.43 m3/GJ
natural gas1.96 cubic meter/bed·day0.11 m3/GJ
Data source: Reprinted with permission from Ref. [66], Fu, 2006; with permission from Ref. [64], Okadera, Chontanawat, and Gheewala, 2014; with permission from Ref. [14], Huang, 2015.
Table 5. Average travel distance from tourist’s place of origin to Xinjiang.
Tourist’s OriginAverage Travel Distance to Xinjiang (km) *
Domestic
tourists
(provincial capitals)
East China (Shanghai, Nanjing, Hangzhou, Hefei, Fuzhou, Nanchang, Jinan)3457.43
North China (Beijing, Tianjin, Taiyuan, Shijiazhuang, Hohhot)2602.20
Central China (Wuhan, Changsha, Zhengzhou) 3023.00
South China (Haikou, Nanning, Guangzhou)3898.33
Northeast China (Harbin, Changchun, Shenyang))3532.33
Southwest China (Chengdu, Guiyang, Kunming, Lhasa, Chongqing)2789.00
Northwest China (Xi’an, Lanzhou, Xining, Yinchuan)1826.75
Foreign
Tourists
(capital city)
Japan, South Korea, Malaysia, Philippines,
Singapore, Thailand, U.S.A, Canada, Britain, France, Germany, Russia, and Australia
6331.60
* Distance from tourist’s departing place (e.g., provincial capital city used as a proxy) to Xinjiang. For visitors coming from overseas, the capital cities are selected as proxy cities. Data source: Reprinted with permission from Ref. [67], Kriti et al., 2002; with permission from Ref. [68], Sharma, Kumar and Kar, 2018.
Table 6. Unit virtual water content of different energy sources.
Energy TypesUnit Virtual Water Content (m3/GJ)
Aviation kerosene1.06
Gasoline and diesel0.575
Electric energy0.43
Data source: Reprinted with permission from Ref. [69], Ayres 2014; with permission from Ref. [64], Okadera, Chontanawat, and Gheewala, 2014.
Table 7. Unit energy consumption of different transport modes.
Transport ModesUnit energy Consumption (GJ/Person·km)
Air0.002
Railway0.001
Private car0.0018
Coach0.0007
Data source: Reprinted with permission from Ref. [30], Gössling et al., 2012.
Table 8. Energy consumption of external traffic in Xinjiang.
Tourist’s OriginInternational VisitorsDomestic Visitors
E–WF of Different Means of Transportation (km3)
YearAir (International)Air (Domestic)RailwayPrivate Car
20032289.13766.7 760.7 4467.9
20044253.5 4622.8 933.6 5483.4
20054444.6 5452.8 1101.2 6467.9
20064865.5 6182.3 1248.6 7333.2
20075884.7 7913.0 1598.1 9386.2
20084874.3 8169.9 1650.0 9690.8
20094763.4 7808.8 1577.1 9262.6
201014,298.0 11,307.5 2283.7 13,412.6
201117,784.1 14,251.7 2878.2 16,904.9
201220,106.6 17,534.5 3541.2 20,798.9
201321,036.2 18,792.5 3795.3 22,291.1
201420,155.8 17,876.9 3610.4 21,205.0
201522,596.7 22,067.9 4456.8 26,176.3
201626,911.4 29,407.8 5939.1 34,882.6
201731,517.2 39,047.8 7886.0 46,317.3
201835,246.3 54,944.6 11,096.5 65,173.6
201922,804.0 78,613.0 15,876.6 93,248.3
2020817.1 161,299.4 11,880.6 19,750.5
20210.0 70,930.8 14,325.1 84,135.8
Table 9. Energy consumption of inner traffic in Xinjiang.
YearEnergy Consumption of Different Means of Transportation (km3)
AirRailwayPrivate CarCoach
20031665.7 1992.8 3344.8 57,214.5
20042180.5 2310.3 4104.9 62,745.4
20052642.8 2548.5 4842.0 69,831.4
20062768.1 2856.2 5489.8 71,990.4
20072808.4 4250.6 7026.6 78,801.3
20082922.3 2875.8 7254.7 88,315.2
20093323.1 3035.2 6934.1 91,226.9
20102476.3 3272.1 10,040.9 95,921.7
20112117.2 4324.4 12,655.2 102,822.8
20122864.5 4589.0 15,570.3 111,742.3
20133061.0 4920.4 16,687.4 119,218.8
20143562.5 5044.9 15,874.3 112,333.4
20152991.4 5848.4 19,595.9 63,939.5
201625,388.6 6632.5 26,113.5 53,229.1
201725,892.0 7089.2 34,673.7 36,732.8
201826,907.5 7183.0 48,789.7 15,832.6
201928,258.8 7981.5 69,806.8 1823.3
202011,600.2 2581.3 52,236.9 4063.2
202119,851.3 3311.4 62,985.1 2293.5
Table 10. Unit virtual water consumption of different transport modes.
Transport ModesUnit Virtual Water Consumption (L/Person·km)
Air2.120
Railway0.430
Private car 1.026
Coach0.399
Table 11. Changes in V-WF.
YearDirect Water (km3)Virtual Water (km3)
Water for Public ToiletsWater for GreeningEnergy Consumption
20031800.8 164,824.8 110.6
20042229.0 164,824.8 136.9
20052621.7 164,824.8 161.0
20062970.2 164,824.8 182.5
20073797.2 164,824.8 233.3
20083904.8 164,824.8 239.9
20093733.6 164,824.8 229.4
20105502.9 164,824.8 338.0
20116932.6 164,824.8 425.9
20128506.4 164,824.8 522.5
20139110.0 164,824.8 559.6
20148668.0 164,824.8 532.5
201510,670.4 164,824.8 655.5
201614,177.6 164,824.8 870.9
201718,770.2 164,824.8 1153.0
201826,293.6 164,824.8 1615.2
201937,258.7 164,824.8 2288.7
202027,670.0 164,824.8 1699.7
202133,349.8 164,824.8 2048.6
Table 12. Relationship between tourism water consumption and tourism economic growth.
Period Δ T W F Δ T R EtDecoupling Type
2003–2004>0>00.52 Weak decoupling
2004–2005>0>00.59 Weak decoupling
2005–2006>0>00.64 Weak decoupling
2006–2007>0>00.53 Weak decoupling
2007–2008>0>01.99 Expansive negative decoupling
2008–2009<0<00.13 Weak negative decoupling
2009–2010>0>00.43 Weak decoupling
2010–2011>0>00.57 Weak decoupling
2011–2012>0>00.94 Weak decoupling
2012–2013>0>00.18 Weak decoupling
2013–2014>0<0−0.21 Strong negative decoupling
2014–2015>0>00.37 Weak decoupling
2015–2016>0>00.47 Weak decoupling
2016–2017>0>01.06 Expansive negative decoupling
2017–2018>0>00.86 Weak decoupling
2018–2019>0>00.53 Weak decoupling
2019–2020<0<00.45 Weak negative decoupling
2020–2021>0>00.60 Weak decoupling
Data source: Calculation results based on Equation (1) and Xinjiang Statistical Yearbook, multiple-year data.
Disclaimer/Publisher’s Note: The statements, opinions and data contained in all publications are solely those of the individual author(s) and contributor(s) and not of MDPI and/or the editor(s). MDPI and/or the editor(s) disclaim responsibility for any injury to people or property resulting from any ideas, methods, instructions or products referred to in the content.