Article

Bivariate-Logit-Based Severity Analysis for Motorcycle Crashes in Texas, 2017–2021

1
School of Civil and Environmental Engineering and Construction Management, University of Texas at San Antonio, San Antonio, TX 78249, USA
2
Department of Civil and Environmental Engineering, University of Texas at San Antonio, San Antonio, TX 78249, USA
*
Author to whom correspondence should be addressed.
Sustainability 2023, 15(13), 10377; https://doi.org/10.3390/su151310377
Submission received: 1 April 2023 / Revised: 22 June 2023 / Accepted: 28 June 2023 / Published: 30 June 2023

Abstract

:
Due to the number of severe traffic collisions involving motorcycles, a comprehensive investigation is required to determine their causes. This study analyzed Texas crash data from 2017 to 2021 to determine who was at fault and how various factors affect the frequency and severity of motorcycle collisions. Moreover, the study tried to identify high-risk sites for motorcycle crashes. Utilizing bivariate analysis and logistic regression models, the study investigated the individual and combined effects of several variables. Heat maps and hotspot analyses were used to identify locations with a high incidence of both minor and severe motorcycle crashes. The survey showed that dangerous speed, inattention, lane departure, and failing to surrender the right-of-way at a stop sign or during a left turn were the leading causes of motorcycle crashes. When a motorcyclist was at fault, the likelihood of severe collisions was much higher. The study revealed numerous elements as strong predictors of catastrophic motorcycle crashes, including higher speed limits, poor illumination, darkness during the weekend, dividers or designated lanes as the principal road traffic control, an increased age of the primary crash victim, and the lack of a helmet. The concentration of motorcycle collisions was found to be relatively high in city cores, whereas clusters of severe motorcycle collisions were detected on road segments beyond city limits. This study recommends implementing reduced speed limits on high-risk segments, mandating helmet use, prioritizing resource allocation to high-risk locations, launching educational campaigns to promote safer driving practices and the use of protective gear, and inspecting existing conditions as well as the road geometry of high-risk locations to reduce the incidence and severity of motorcycle crashes.

1. Introduction

In the United States, a substantial portion of the total traffic-crash-associated cost comes from motorcycle crashes, representing the total monetary value of fatalities, injuries, property damages, and vehicle damages [1]. Motorcycle riders are typically less protected and exposed to the environment (cold, heat, and adverse weather conditions) than other involved motor vehicle drivers, putting them at a higher risk of fatal or incapacitating injuries. Motorcyclist injuries are overrepresented in overall crashes for several reasons. Motorcycles are more difficult to operate than other motor vehicles because they require balance on two wheels, as well as sharp awareness, traction management, and the coordination of actions and senses. The National Highway Traffic Safety Administration (NHTSA) includes two- and three-wheel motorcycles, minibikes, off-road motorcycles, motor scooters, mopeds, and pocket bikes in the motorcycle category.
In 2020, a total of 5579 motorcyclists were killed (11% increase from 2019) in the United States, accounting for about 14% of all fatalities on roadways, while about 82,528 motorcyclists were injured (2% decrease from 2019). About 3% of all registered vehicles in the United States are motorcycles, and about 0.6% of all vehicle miles driven in 2020 were on motorcycles [2]. Almost 28 times as many people died on motorcycles as in passenger cars [2]. Alcohol impairment contributed to about 27% of all fatal motorcycle crashes, and the number of fatal crashes caused by alcohol impairment was higher at night (roughly three times higher than during the day). Motorcyclists aged 45 to 49 years had the highest alcohol impairment (35%). In 2020, approximately 34% of all fatal motorcycle riders were speeding, with motorcyclists aged 25–29 years having the highest speeding involvement (45%). Given the relatively susceptible nature of motorcyclists toward severe injuries in traffic crashes, the effects of different crash characteristics and driver-behavior-related variables on motorcycle crashes in Texas need to be thoroughly analyzed.

1.1. Literature Review

As per previous research, motorcycle crash frequency and the associated injury severity of involved persons could be substantially dependent on different variables (e.g., crash-, roadway-, weather-, and driver-related variables). One prior study in Texas used 2003–2008 data from the Crash Records Information System and concluded that alcohol use, lighting condition, gender, and curved alignment (both horizontal and vertical) significantly increased motorcyclist-injury-severity likelihood in urban areas. In addition to the aforementioned factors, the age of motorcyclists, single-vehicle and angular crashes, and divided highways are significantly affecting motorcyclists’ crash severity in rural areas [3]. Another study in Wyoming used binary logistic regression and classification tree models to identify the most significant contributing factors and found that the posted speed limit, highway class, age, and speed compliance were common predictors between the models [4]. The motorcycle crash risk increases during the night, especially during merging or diverging on expressways and turning at intersections [5]. Alcohol use and speeding were the most common factors associated with motorcyclists, while left turns and failure to yield were common factors associated with drivers of other vehicles involved in motorcycle crashes [6]. One study in Calgary, Canada, adopted the heterogeneous choice model, ordered logit model, and partially constrained generalized ordered logit model and identified that the type of street (loop or lollypop type), crash type (right-angle and left-turn-across-path), speeding, alcohol use, and collision with a truck increased the likelihood of injury severity for involved motorcyclists [7]. A multivariate probit model was adopted by one study in Ohio, which used police-reported crash data for the 2006–2010 period and concluded that younger motorcyclists, motorcyclists under the influence of alcohol, motorcyclists without helmets, and motorcyclists without insurance were more likely to be the party at fault in a motorcycle crash [8]. Another study adopted machine learning methods (multilayer perceptions, rule induction, and classification and regression trees), and the results implied that the location type, time of the crash occurrence, settlement type, and collision type are the most significant factors in predicting severe motorcycle crashes [9].
One study used a logistic regression model to look at crash data from the Kansas Department of Transportation database (2012–2015) and found that lighting, alcohol use, and crash location were significant predictors of fatal crashes, while roadway speed limit, age, and average annual daily traffic (AADT) were significant predictors of injury crashes [10]. Another study in Tanzania used a Bayesian multinomial logit model and found that speeding, the weekend, off-peak hours, and head-on collisions made the injuries from motorcycle crashes worse [11]. As the number of people living in Texas grows, it is likely that the number of motorcycle crashes and deaths will also rise. Using data from the Fatality Analysis Reporting System (FARS) database in the U.S. from 2000 to 2016, one study found that the number of motorcycle deaths per 100,000 people has been increasing [12].
The information on 30,379 horizontal curves in Ohio (which included 225 motorcycle crashes during the 2002–2008 period) was used in a study that found the radius and length of horizontal curves, shoulder width, AADT, and the location of the road segment to be the most significant factors affecting motorcycle crash frequency [13]. Another matched case–control study used a total of 1601 crashes (with 16,010 matched controls) over the 2005–2015 period to evaluate the risk of single-motorcycle crashes associated with horizontal curve type and radius and suggested that the sharp non-reverse curves (radius ≤ 1500 ft) had the highest risk of single-motorcycle crashes, followed by sharp reverse curves (radius ≤ 1500 ft) and moderate reverse curves (1500 ft  <  radius ≤ 3000 ft) [14]. At four-legged signalized intersections, the presence of a wide median and uncontrolled left-turn lanes increased the likelihood of motorcycle crashes, whereas uncontrolled left-turn lanes and exclusive right-turn lanes increased the likelihood of motorcycle crashes at signalized T-intersections [15].
Age and length of riding experience have an impact on how motorcyclists perceive the state of roads and how they drive. One study in Florida looked at police reports from 2016 and found that the age of the motorcyclists had a major effect on how safe they thought they were and how well they could spot dangerous situations [16]. It was found that the risk of a motorcycle crash increases when the rider has less experience and when the road conditions encourage speeding and passing [17]. The type of motorcycle a motorcyclist drove had a major effect on how they behaved (such as drinking and speeding) and how often they died in motorcycle crashes. For instance, the death rate of riders of supersport motorcycles was about four times higher than that of standard motorcycles [18]. One study used hospital data from the 2011–2014 period to compare motorcycle and moped crashes and suggested that the mortality rate was similar for both moped and motorcycle riders [19].
The type of injury sustained by a motorcyclist is highly correlated with the severity of the injury, and some injury types are more prevalent than others. A study that used logistic regression models on hospital data from the Yorkshire region of the U.K. from 1993 to 1999 found that head injuries had the highest likelihood of resulting from a serious crash, with chest and abdominal trauma coming in second and third, respectively [20]. When comparing single-vehicle collisions to multiple-vehicle collisions, the risk of lower extremity injuries was higher in multiple-vehicle collisions. For motorcyclists, the risk of lower-extremity injuries was highest in broadside collisions [21]. Thoracic spine injuries were the most frequent type of spinal injury, with lumber spine and cervical spine injuries coming in second and third, respectively, according to one study that compared 1121 motorcycle crash records [22]. Another study analyzed the severity and nature of disablement resulting from traffic and non-traffic motorcycle crashes using a randomly selected sample of 250 victims (from a total sample of 1510 victims) and concluded that “skeletal”, “disfiguring”, and “generalized” impairments were the most commonly occurring impairments [23]. When compared to the “no helmet” motorcyclist group, motorcyclists who wore helmets had a lower risk of cervical spine injury and motorcycle fatality [24]. One study analyzed immediate fatal crashes using data for the 2007–2016 period in Michigan and found that traumatic brain injury and rib fracture were the most common injury types associated with these crashes. Furthermore, about 63% of all fatally injured motorcyclists did not wear helmets [25].
Bicycle and motorcycle crashes have many similarities, and for the majority of bicycle and motorcycle crashes, the drivers of other vehicles involved in the crashes were at fault [26]. There are strict laws about driving under the influence (DUI) and wearing a helmet, and these laws are enforced. This has been shown to reduce the number of motorcycle crashes and the severity of injuries. The death rate of motorcyclists was lower when there were administrative license-revocation laws and laws that made driving with a blood alcohol level of more than 0.08 g/dL a crime [27]. FARS data for the 1999–2015 period were used in a study to evaluate the effect of helmet laws on motorcycle fatality rates (for motorcyclists aged ≥16 years), and results suggested a 36–45% decline in mortality rate across all age groups [28]. One study used the matched-pair method to evaluate the association of fatal motorcycle crashes with the use of helmets and concluded that the relative risk of fatality was reduced by about 40% when motorcyclists used helmets [29]. In July 2000, Florida changed its universal helmet law to exclude riders who were 21 or older and had at least USD 10,000 in insurance coverage. One study in 2006 compared 1998–1999 crash data with 2001–2002 crash data and concluded that the change in the law increased the likelihood of fatalities by 25% and that an estimated 117 deaths (of motorcyclists) could have been avoided in 2001–2002 [30]. The use of helmets by motorcyclists reduces fatal crash rates, decreases lethal head-injury incidents, and reduces the severity of non-lethal head injuries [31].
Overweight and obesity among motorcycle taxi drivers were linked with an increased likelihood of overall crash risk and injury crash risk, as concluded by a study in Vietnam, which used random effect binary logistic regression [32]. Another Vietnam-based study that used a multiple logistic regression model found that unlicensed drivers and crashes during the nighttime were significantly associated with severe motorcycle injuries [33]. A study from Taiwan focused on junior college students observed that motorcycle crash risk decreased with increasing age, experience, and the licensing of drivers [34]. Another Taiwan-based study that analyzed motorcycle crashes in a university neighborhood using multivariate analysis concluded that female gender, rider age over 45 years, driving under the influence of alcohol, single-motorcycle crashes, and early-morning driving increased the likelihood of severe injury [35]. Male motorcyclists were far more likely to drive under the influence of alcohol compared to female motorcyclists, as observed in a Thailand-based study analyzing 969 randomly sampled collisions [36]. One study in Malaysia concluded that factors related to human behavior had the highest contribution to motorcycle crashes, while environmental factors had the lowest [37]. Another study in Malaysia analyzed 9167 fatal motorcycle crashes using multinomial and mixed models and concluded that the severity of motorcycle crashes was significantly dependent on the number of vehicles involved in the crash [38]. When only single-motorcycle crashes were considered, collisions with fixed objects or trees, running off the road, inclement weather conditions, and urban areas increased the risk of fatal injuries, as found by a study in India using an ordered logit model [39]. Human-related factors such as alcohol impairment and not wearing a helmet were found to increase motorcycle crash severity in a study conducted in Dhaka, Bangladesh, using a binary logistic model [40].
Several studies have studied and rated the safety techniques that are available for motorcyclists to understand how well they work. One study examined how well the autonomous emergency braking (AEB) systems of motorcycles reduced the severity of head injuries in helmeted motorcyclists. It found that AEB systems could reduce head impact velocity by 10–18%, which in turn reduced the severity of head injuries [41]. The presence of an antilock braking system (ABS) was found to be about 37% more effective in reducing motorcycle fatalities compared to non-ABS in a study that used 2003–2008 motorcycle-fatality data [42]. One study evaluated the effectiveness of three technologies that help drivers avoid crashes: lane maintenance, frontal crash prevention, and blind-spot detection. It was found that frontal crash prevention was the best way to keep two motorcycles from colliding [43]. Another study in Florida studied motorcycle crash data on curves from 2005 to 2015 and found that dynamic speed feedback signs might help motorcyclists pay more attention and slow down on curves [44].

1.2. Economic Impact and Study Area

The proportion of fatalities and incapacitating injuries sustained by motorcyclists is substantially greater compared to drivers of other motor vehicles, and these crashes are often associated with high medical treatment costs and other associated costs. The fatalities or injuries may also have long-term consequences, such as morbidity, for those involved. In 2013, the total cost of medical bills and lost wages due to fatal crashes in Texas was USD 4.89 billion, with fatal motorcycle crashes accounting for approximately USD 665 million [45]. In 2018, the total monetary loss associated with fatal motorcycle crashes slightly reduced to USD 658 million, representing approximately 12% of the total monetary loss resulting from all fatal traffic crashes. [45]. Motorcycle crashes constitute a small proportion of overall crashes, but fatal-crash-related costs associated with motorcycle crashes constitute more than half of the total cost associated with other motor vehicles [45]. The costs of a motorcycle crash would be much higher if the economic loss of those involved was considered over their lifetimes. About half of all motorcycle crash victims had personal health insurance, and the government pays a significant portion of uninsured patients’ medical costs [46]. One study in Ontario, Canada, found that for each motorcycle crash, the public health-care system had to pay about six times the cost of each automobile crash [47]. Given the substantial costs associated with motorcycle crashes in addition to the loss of lives, diligent efforts are required to reduce motorcycle crash frequency as well as the resulting fatalities and injuries.
Texas is the chart leader for pedestrian, bicycle, and overall motor vehicle crashes and one of the chart leaders for motorcycle crashes in the United States. The proportion of motorcycle crashes that result in fatality is substantially higher than the proportion of motorcycles in the overall number of operational motor vehicles in Texas [1]. The number of registered motorcycles in Texas has been increasing over the last few decades, and when the number of registered motorcycles in 2000 and 2014 are compared, the number of registered motorcycles almost doubled in 14 years. The counties with relatively more population (e.g., Bexar, Dallas, Harris, El Paso, Collin, Denton, and Travis) have relatively more registered motorcycles [1]. Texas had the third highest number of motorcycle fatalities (483 fatalities) in the United States in 2020, and about 48% of all motorcyclists killed in traffic crashes did not wear helmets, according to FARS data. In 2020, the BAC of fatal motorcycle crashes in Texas was equal to or greater than 0.01 g/dL for 38% of motorcyclists, 0.08 g/dL for 31% of motorcyclists, and 0.15 g/dL for 18% of motorcyclists [2]. One study in Texas used data from 2012 to 2017 and found that the collision type, functional system, and driving under the influence of alcohol were the most prominent factors affecting fatal crashes [48]. Another Texas-based study concluded that the absence of helmets, DUI, dark unlit roads, curved roads, and inclement weather conditions increased the likelihood of fatal motorcycle crashes [49]. Single-motorcycle crashes resulted in relatively fewer severe crashes in rural areas. However, single-vehicle crashes were more likely to result in fatalities when they occurred in urban areas in Texas [3].

1.3. Scope of Study

The main goals of this study are to investigate and evaluate the causes and risk factors of motorcycle crashes in detail, to look at how motorcycle crashes are related to other factors, and to find out what the main causes of motorcycle crashes in Texas are. The research team developed heat maps of motorcycle crashes occurring in Texas; calculated the total, fatal-, serious-, possible-, and no-injury crash counts for each class of all variables; and identified the locations with substantially high motorcycle crash concentrations. Additionally, this study also assessed the variables related to riders’ and primary persons’ behaviors. The research team conducted discussions to determine ways to address crash-hotspot-associated safety issues and suggested relevant recommendations involving existing technologies.

2. Materials and Methods

The Crash Records Information System (CRIS) database of the Texas Department of Transportation (TxDOT) was mined for crash statistics between January 2017 and December 2021. According to Texas Transportation Code Section 550.062, a report on a crash must be forwarded to TxDOT by the officer in charge by the 10th day after the crash’s occurrence if any involved person is injured or killed. Furthermore, if a crash results in property damage of USD 1000 or more, it must be reported to CRIS after an investigation. The CRIS data include the geographical coordinates, crash occurrence time, and other crash-associated information (e.g., environmental, vehicle, and driver characteristics).
Factors that contributed to traffic crashes were used in the selection of motorcyclist-at-fault crashes. The police officer in charge could report up to three contributing factors after analyzing any crash, and the first contributing factor is considered the most relevant one. This study divided the injuries sustained by the motorcyclists into two categories: KA (i.e., fatal or incapacitating) injuries and KAB (i.e., fatal, incapacitating, or non-incapacitating) injuries. In short, severe injuries are denoted by KA injury and any confirmed injury (severe/non-severe) is denoted by KAB injury. In addition to the dataset for all motorcyclist-related crashes, subsets of the dataset were prepared based on the party at fault.
Motorcycle crashes with available coordinates were used to prepare a heat map that represents the motorcycle crash density over the study area. A heat map includes a color scheme that incorporates a smoothly varying color set and helps to represent crash occurrences [50]. The kernel density method provides a continuous surface and was adopted during density calculation as it offered suitability in the visualization process of crash data [51]. This method takes the summation of all the crashes for a location during the density estimation process and the highest value of the density is observed at the center. The magnitude of the density decreases gradually away from the center [52,53]. The kernel density estimation employs this quartic formula:
P 2 x = 3 π 1 1 x T x 2                                 i f   x T x < 1 0                                                                                       o t h e r w i s e
where P 2 x is the kernel function for 2-dimensional x . Generally, P is the radially symmetric unimodal probability density function.
The predicted density at a x , y location is determined by the following formula:
D e n s i t y = 1 r a d i u s 2 i = 1 n 3 π · p o p i 1 d i s t a n c e i r a d i u s 2 2 F o r   d i s t a n c e i < r a d i u s
where i   = 1 , , n are input points or point crashes; p o p i is the population field value of point i ; and d i s t a n c e i is the distance between point i and the x ,   y location.
This study used hotspot analysis (Getis-Ord Gi*) to identify spatial clusters containing statistically significant high values (i.e., hotspots) and low values (i.e., cold spots). In this process, an output feature is produced containing a z-score, a p-value, and a confidence level bin for each of the input features. This study assumed complete spatial randomness (CSR) of the features (or the associated values) as the underlying null hypothesis. The null hypothesis could be rejected if statistically significant clustering or dispersion (based on the z-score and p-value) of the associated features occur. In this method, the probability of randomness in clustering is expressed by the p-value, while the z-score stands for standard deviation. The combination of a very small p-value with a relatively high/low z-score suggests that the probability of a cluster resulting from the random distribution is very low. The false discovery rate (FDR) correction was used to accommodate the spatial dependence of data. When the search bandwidth is set too high, the resultant pattern becomes too smooth, making the differentiation between local hotspot locations difficult. Contrarily, a spiky density pattern that highlights individual hotspot locations results from setting a narrow search bandwidth. Such outcomes could result in false conclusions, and hence the “trial and error” method was adopted in this study as recommended by previous studies [54,55,56].
The crash-density-based heat maps do not show where serious motorcycle crashes are likely to happen, and the identification of hot/cold spots requires a weight to be attached to each motorcycle crash. The value of this weight is determined based on the severity of the crash. One of the most popular approaches in determining the weight is the compromise approach (greater weight for more severe crashes); however, these is no standard for the weighting system [57]. A New South Wales-based study performed by the Roads and Traffic Authority used 3.0, 1.8, 1.3, and 1.0 as the respective weights for fatal, serious-injury, other-injury, and property-damage-only crashes [58]. Another study classified injury severities into three categories and used 5.0, 3.0, and 1.0 as the weights for fatal, serious, and light-injury crashes, respectively [59]. This study attempted to identify the high-risk locations associated with motorcycle crashes by providing relatively higher weights to severe motorcycle crashes, and the following equation was used in computing the severity index ( S I ) of a location:
S I = 5.0 × X 1 + 3 × X 2 + 1.8 × X 3 + 1.3 × X 4 + X 5
where the total number of fatal crashes is represented by X1, the total number of serious-injury crashes is represented by X2, the total number of non-serious-injury crashes is represented by X3, the total number of possible-injury crashes is represented by X4, and the total number of no-injury or property-damage-only crashes is represented by X5.
A thorough literature review was performed to identify the most relevant crash-associated variables (Table 1) to analyze how these variables affect the severity of motorcycle crashes. To obtain an initial impression about how the selected variables individually affected the severity and frequency of motorcycle crashes, the numbers and percentages of each class within a variable were calculated. This study adopted bivariate analysis, an exploratory tool which could be used to test the association between two variables (one dependent, one independent), to explore how the standalone variables associated with motorcycle crashes were related to crash severity. This study used a chi-square test in the distribution of a categorical variable to analyze the statistical significance in the differences of two or more groups. In the process of the chi-square test, the possible confounding factors are not controlled, and the established causal relationship in this process could not be definite. To further explore the relationship between the severity of motorcycle crashes and crash-associated variables (lighting condition, weather condition, road alignment, road class, surface condition, speed limit, period of the week, time of the day, month, traffic control, and intersection presence), as well as primary-person-characteristics-related variables (age and gender of primary person, helmet status, and ethnicity), logistic regression models were developed. The logistic regression model offers a few advantages over the bivariate analysis as the effect of a predictor on the severity of motorcycle crashes could be determined in this method while controlling for other predictors.
This study used RStudio (Version 1.3.1073) for performing logistic regression analysis [60], and the evaluation of the overall performance of each prepared model was performed based on the deviance values (null and residual) along with their respective degrees of freedom. The null deviance indicates the efficiency of the model to predict the response using only an intercept. On the other hand, the residual deviance shows how effective the model is for response prediction when other predictors are included. In short, the deviance reduction by the inclusion of the predictor variables in the null model is represented by the difference between the null and the residual deviance. The logit was taken as the natural logarithm of the odds where the response variable Y was severe (Y = 1) versus non-severe (Y = 0), as shown by Equation (4):
Logit (Q) = In (Q/1 − Q) = β0 + β1*Z1 +…. + βi*Zi
where Zi is the independent variable, βi is the model coefficient which directly determines the odds ratio, and Q is the probability of severe crashes.

3. Results and Discussion

3.1. Spatial Analysis

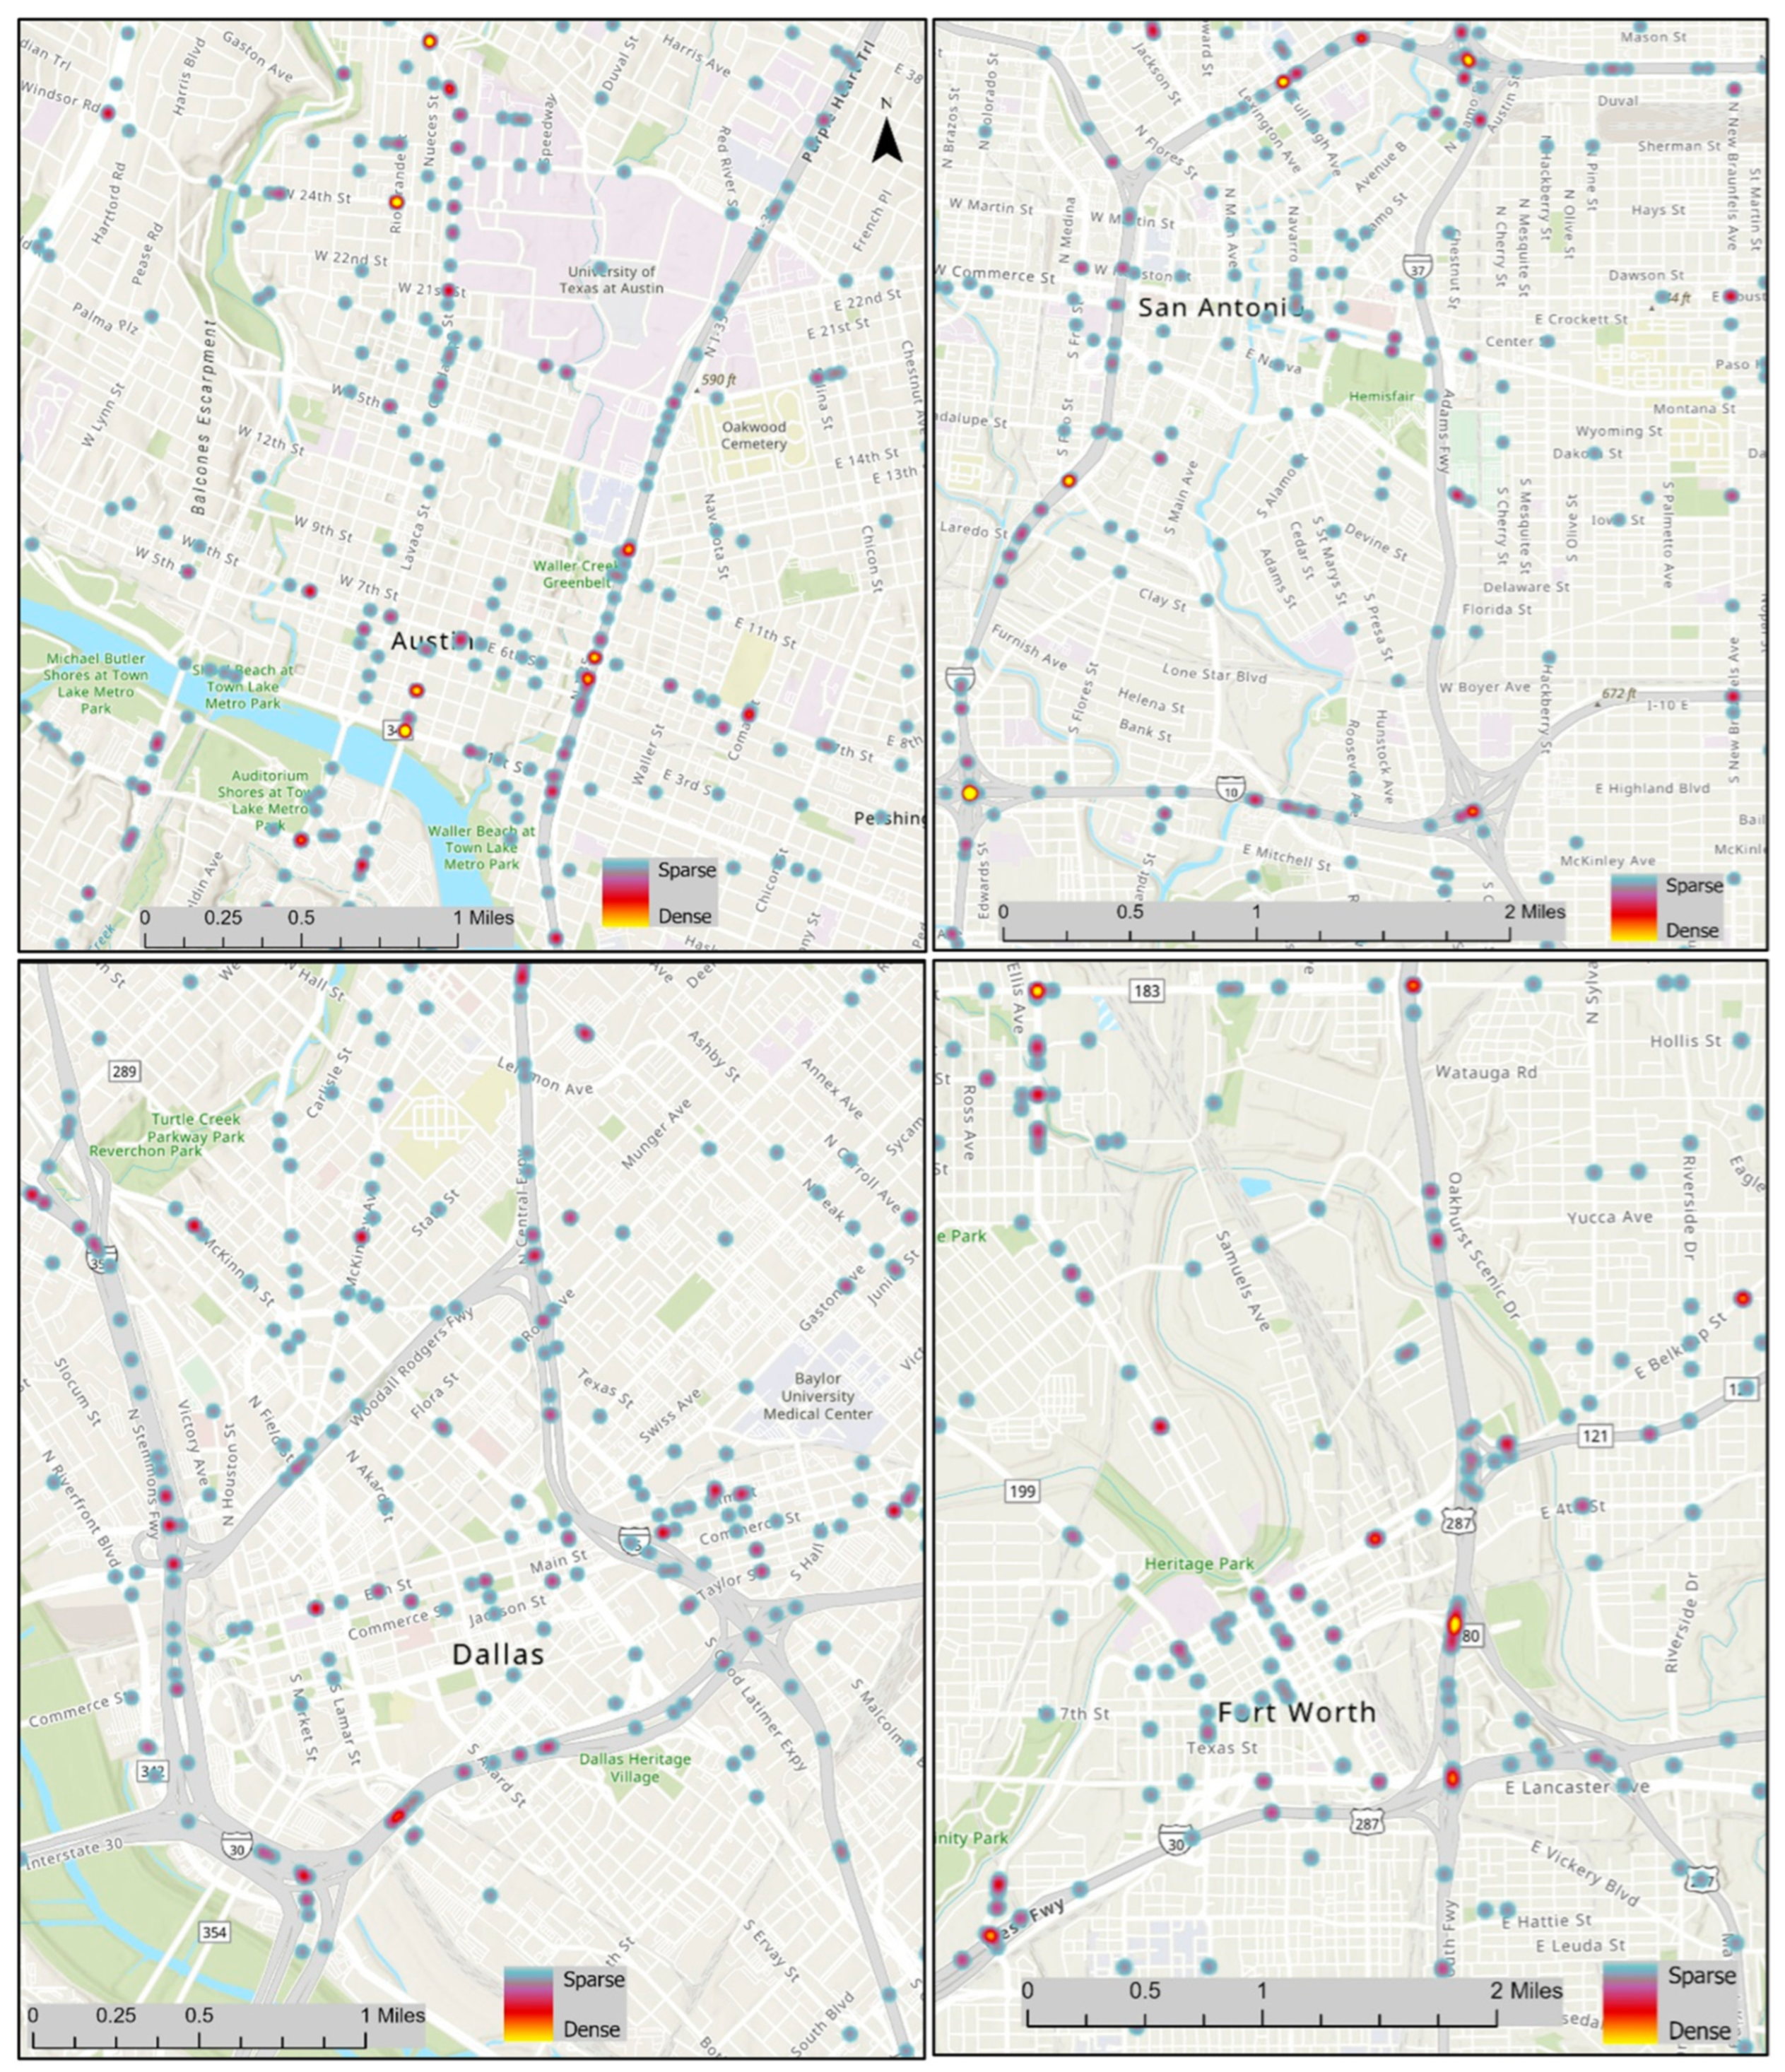
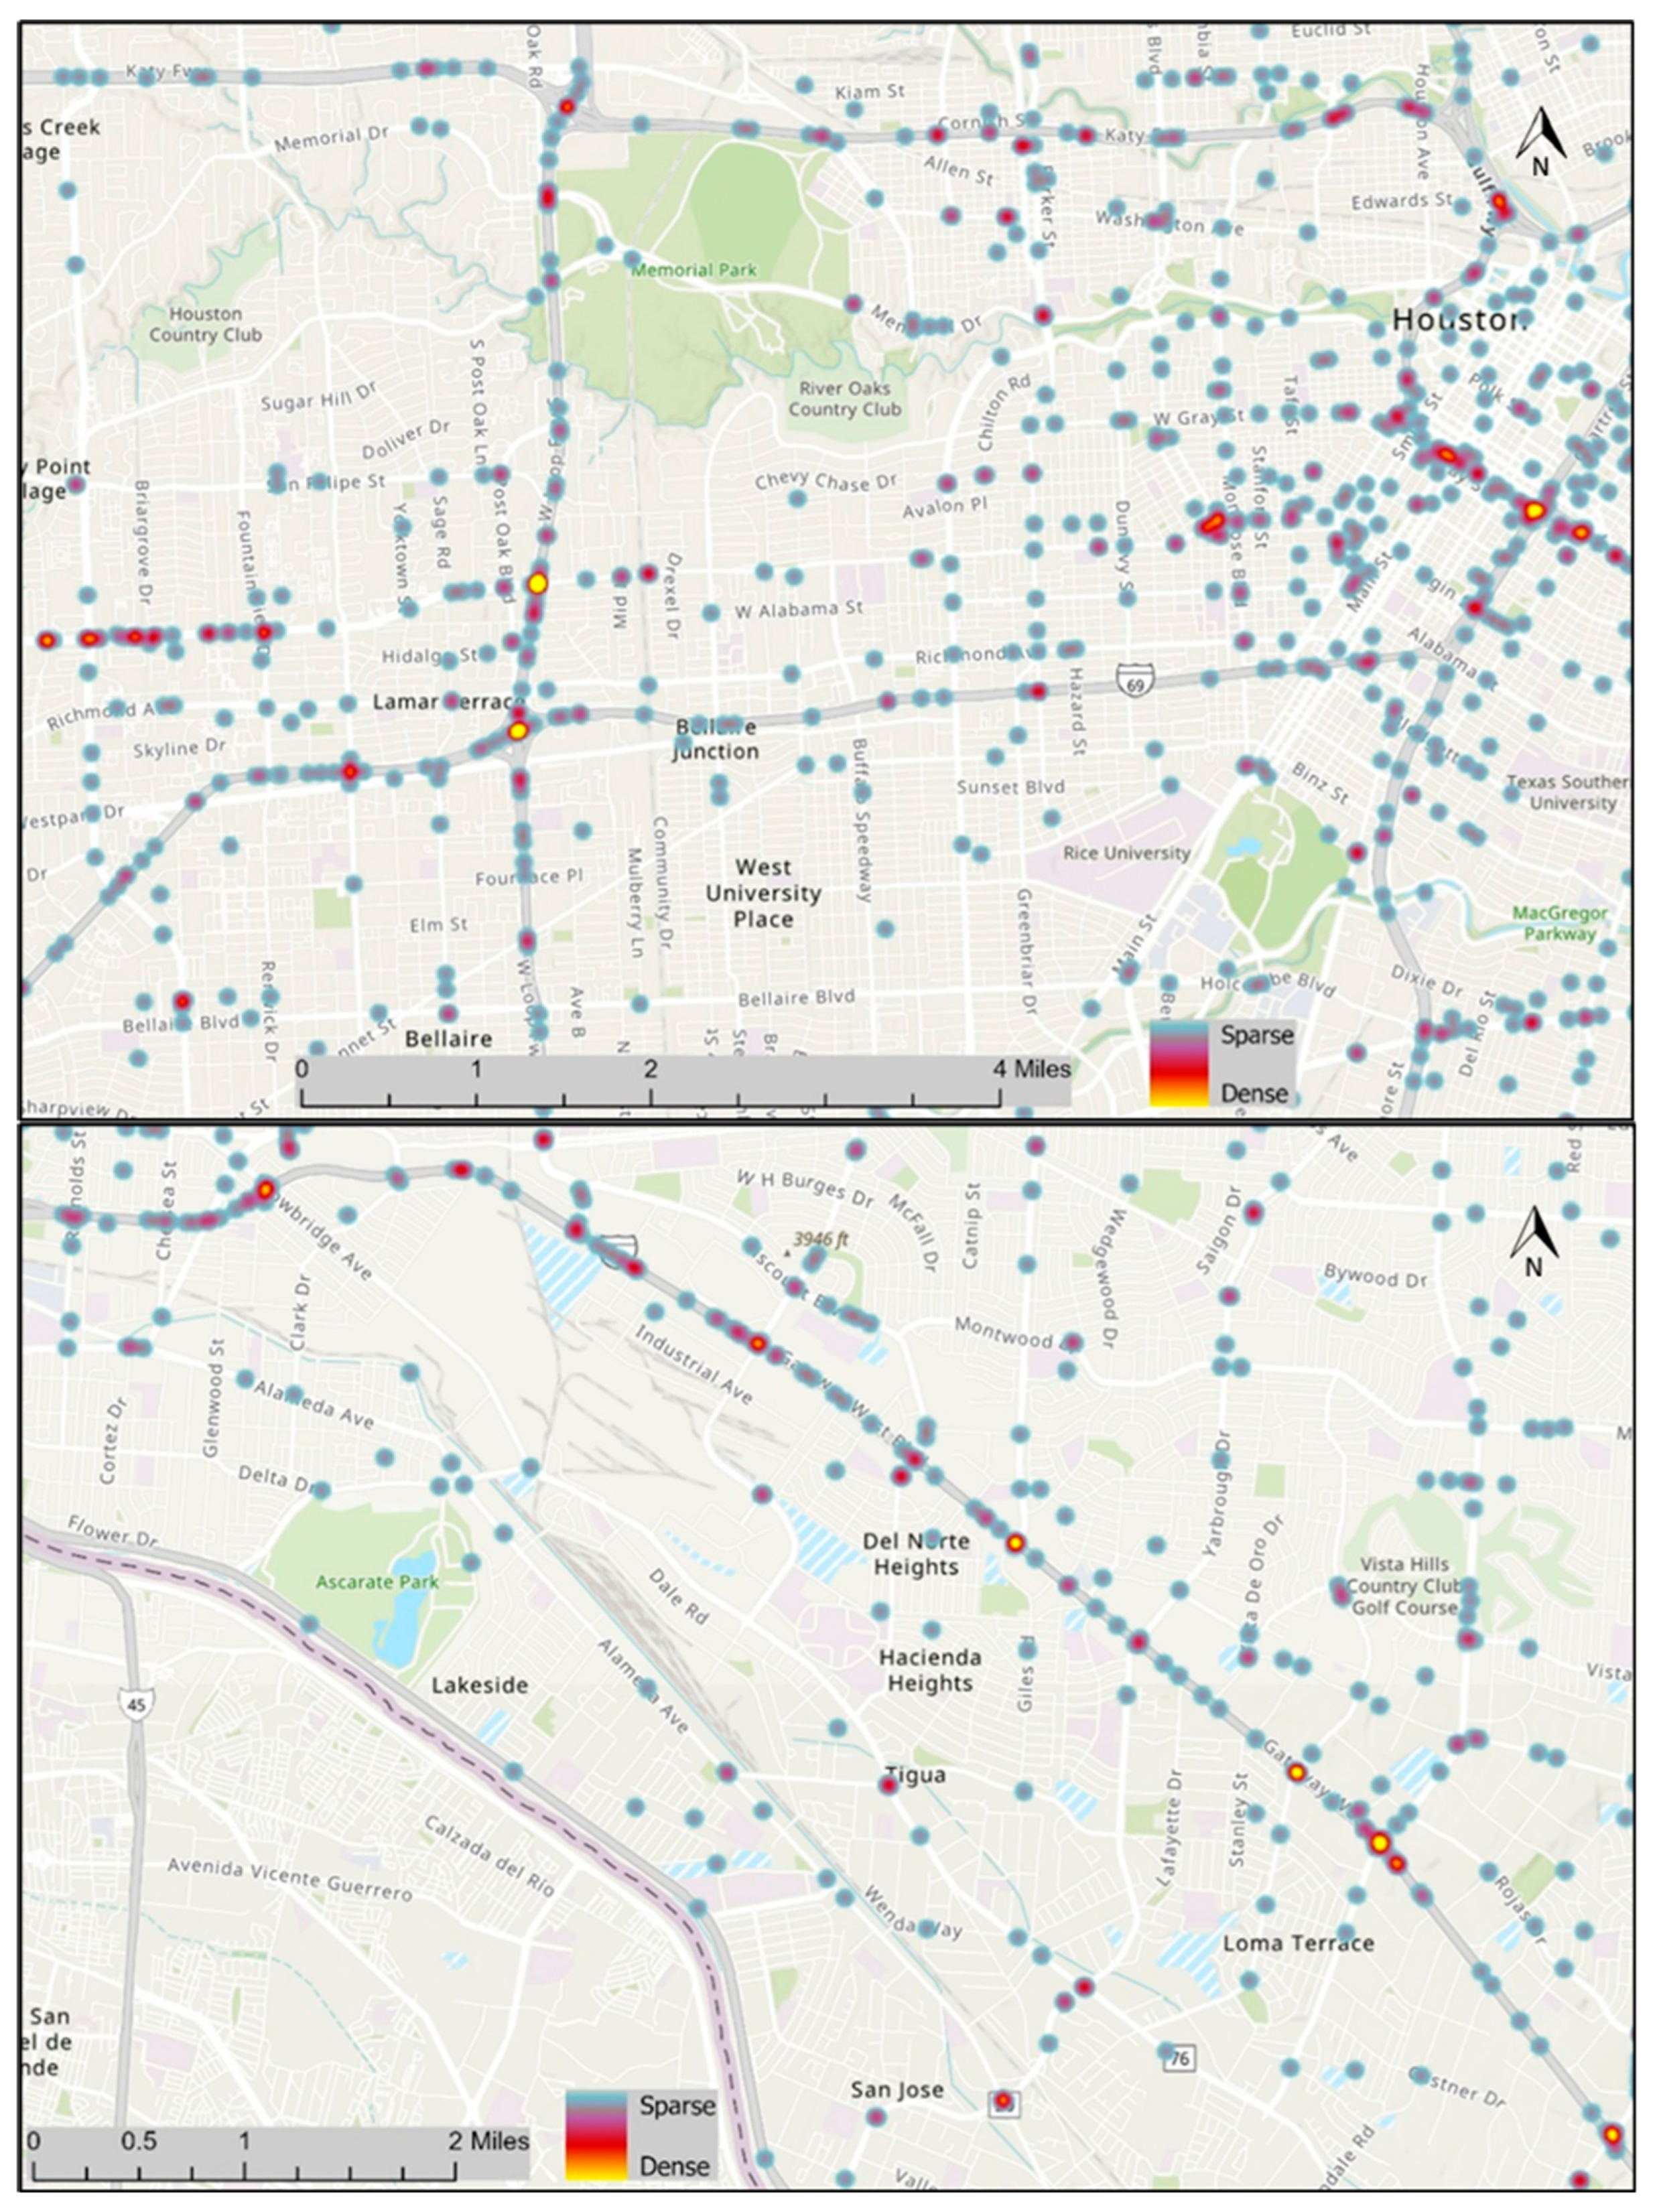
The spatial distribution of motorcycle crashes was evaluated using a heat map and hotspot analysis (Figure 1, Figure 2, Figure 3, Figure 4 and Figure 5). The heat map helps identify zones with high concentrations of crashes, whereas the hotspot analysis helps identify zones with clusters of statistically significant severe crashes. The geographic coordinate system used was the World Geodetic System (WGS 1984, EPSG 4326) in the spatial analysis, with the World Street Map as the base map. The major roads and intersections around the downtown areas of the major cities (Houston, Dallas, Fort Worth, San Antonio, Austin, and El Paso) had the highest motorcycle crash density due to the relatively higher volume of motorcycle activity in those areas. In Houston, the intersections at Interstate 610 and Interstate 69, Interstate 610 and Westheimer Rd., Interstate 69 and Interstate 45, highway 1093 between Manis Rd. and Fountain View Dr., and Interstate 45 between Interstate 8 and Parker Rd. had relatively high motorcycle crash frequencies. Motorcycle crashes were common in San Antonio near the intersections of Interstate 10 and Interstate 35, Interstate 37 and Interstate 35, Interstate 35 and McCullough Ave., and Interstate 10 and SH 536. In Austin, the intersections at SH 343 and Congress Ave., W 24th St. and Rio Grande St., W 29th St. and Guadalupe St., and Interstate 35 between 5th St. and 12th St. had high densities of motorcycle crashes. For Dallas, segments of Elm St., Main St., Commerce St., and Canton St. at the center and eastside of the downtown area and the segment of Interstate 35 between Interstate 30 and State Highway Spur 366 had a high concentration of motorcycle crashes. For the Fort Worth area, the intersections of major roads (notably State Highway 183 and U.S. 287, Interstate 35 and State Highway 280, and Forest Park Blvd. and West Fwy.), a segment of N Main St. between State Highway 183 and Northside Dr., and Main St. in the city center had a high concentration of motorcycle crashes. For El Paso, road segments on Interstate 10 and Gateway Blvd. near the intersections at Interstate 10 and Lee Trevino Dr., Interstate 10 and Lomaland Dr., Interstate 10 and McRae Blvd., Interstate 10 and Hawkins Blvd., and Interstate 10 and Trowbridge Dr. had relatively high motorcycle crash concentrations.
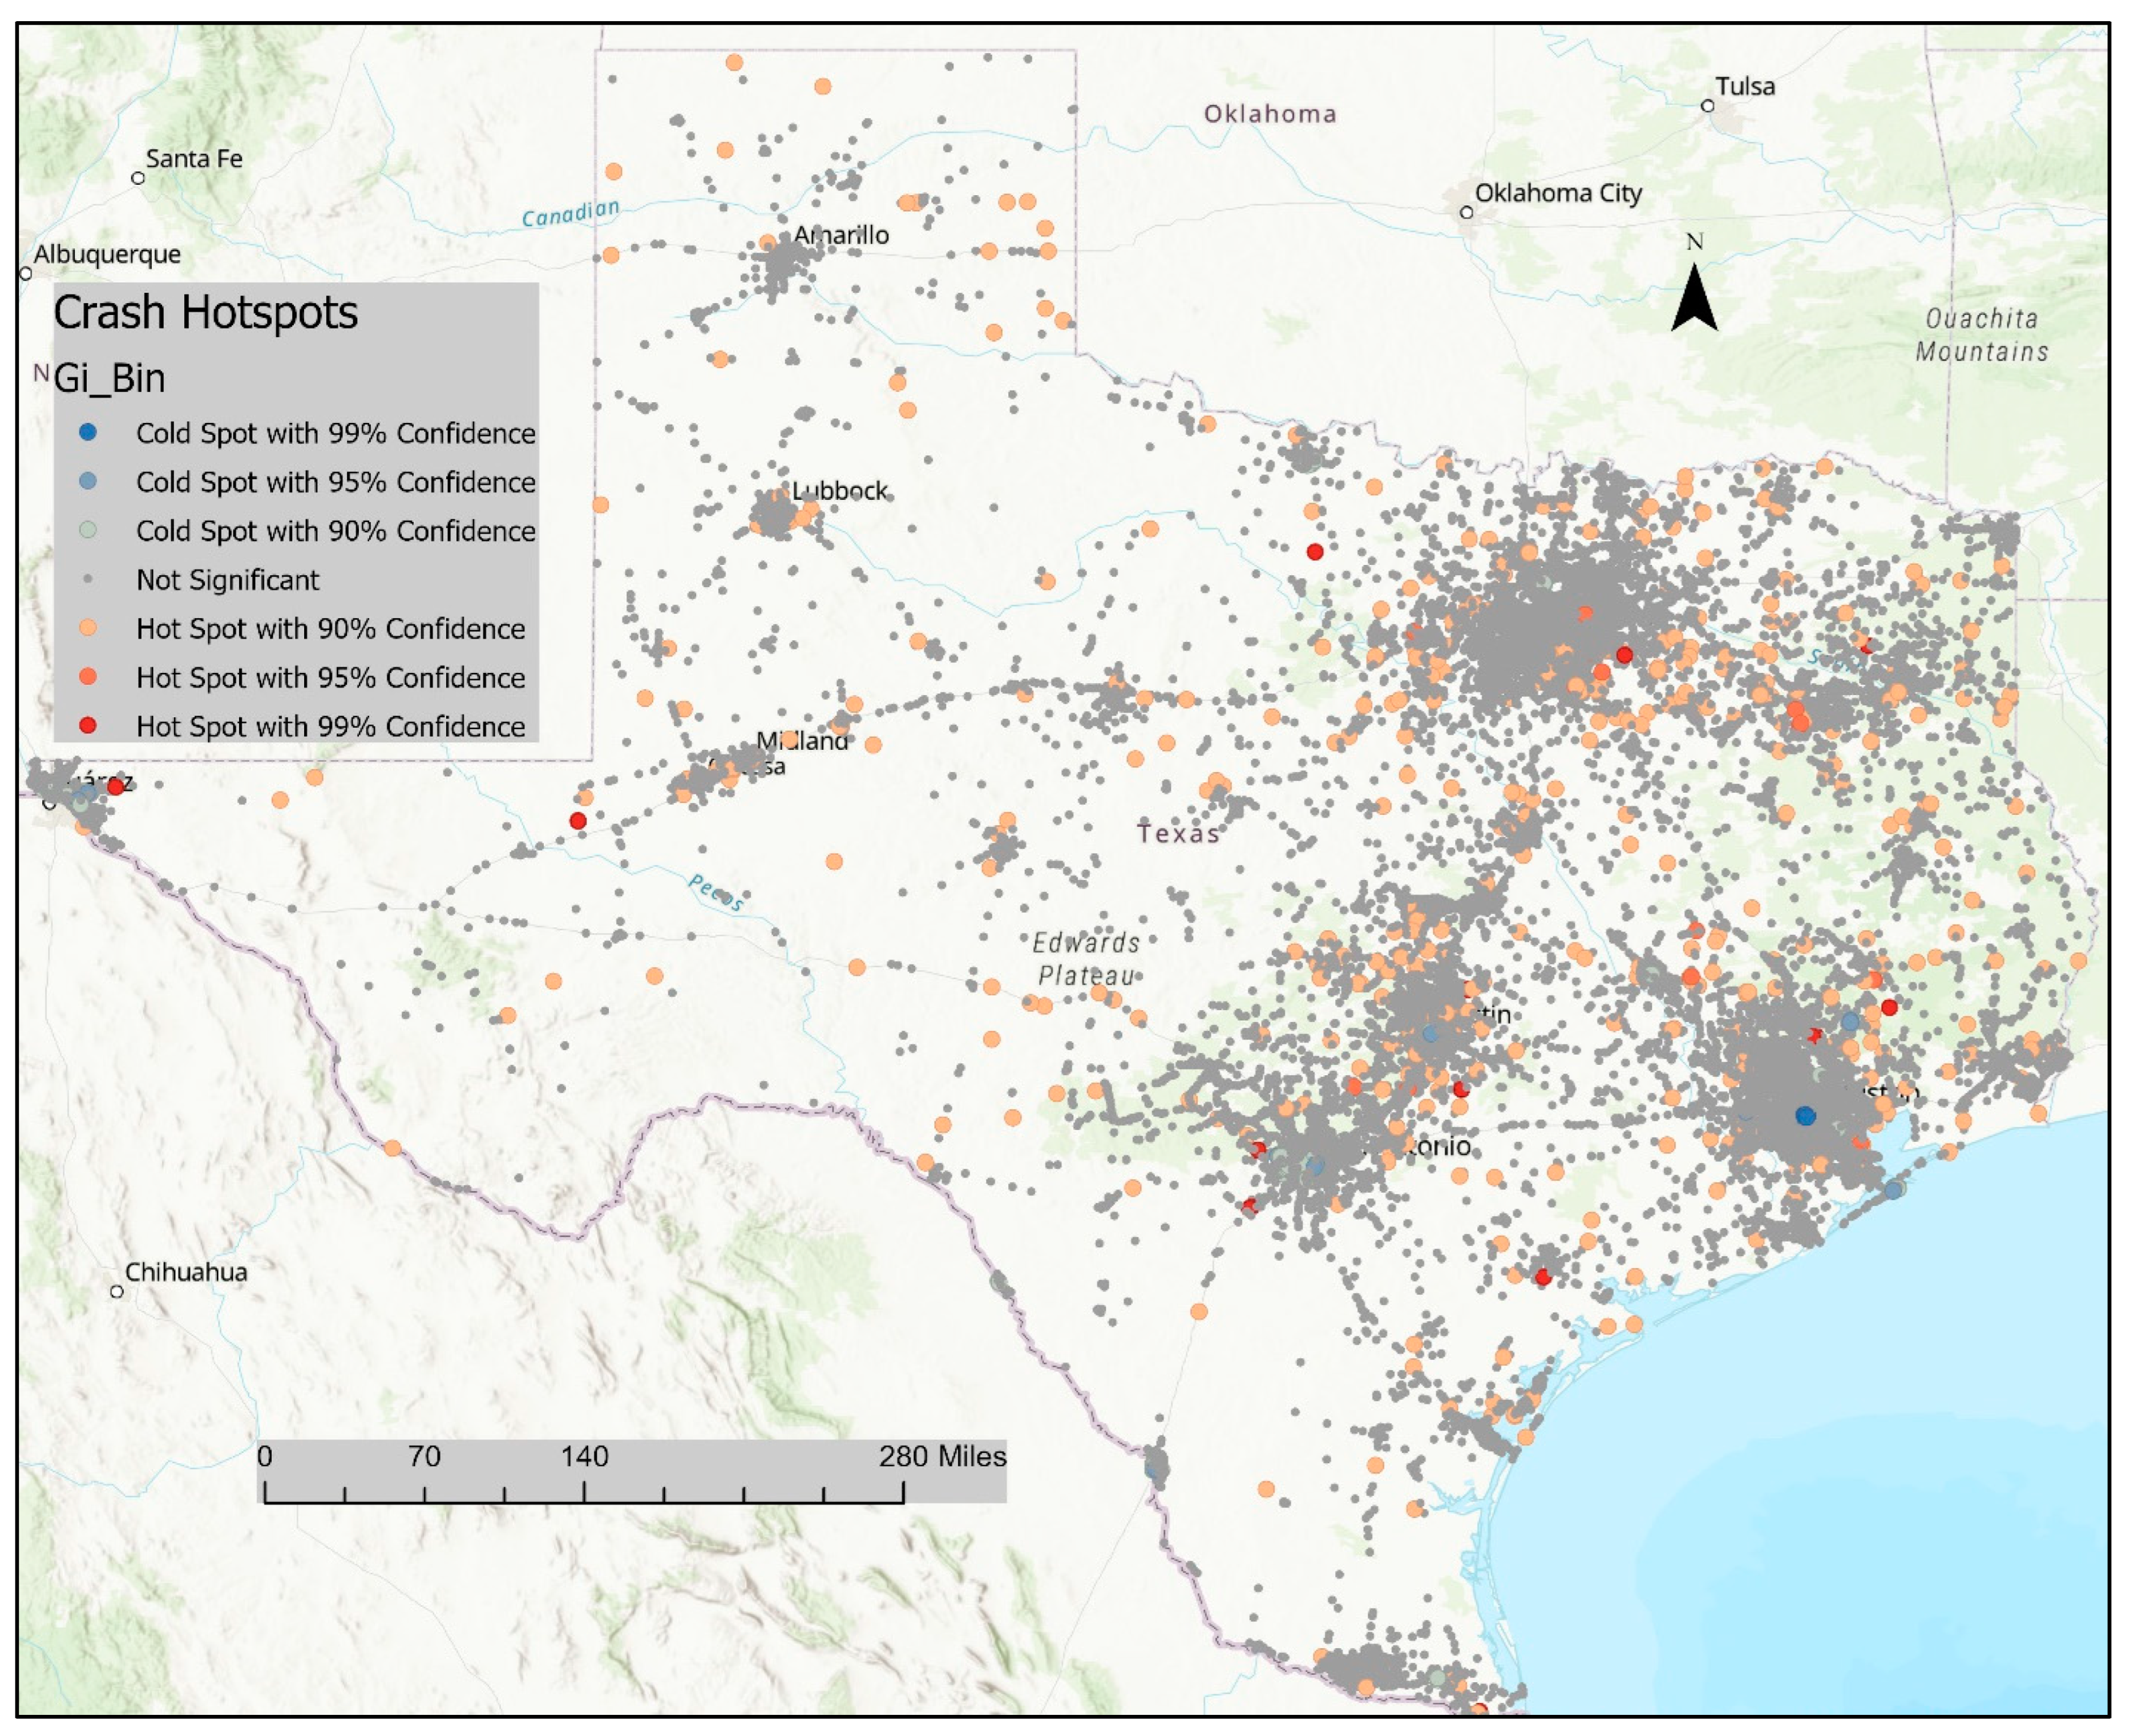
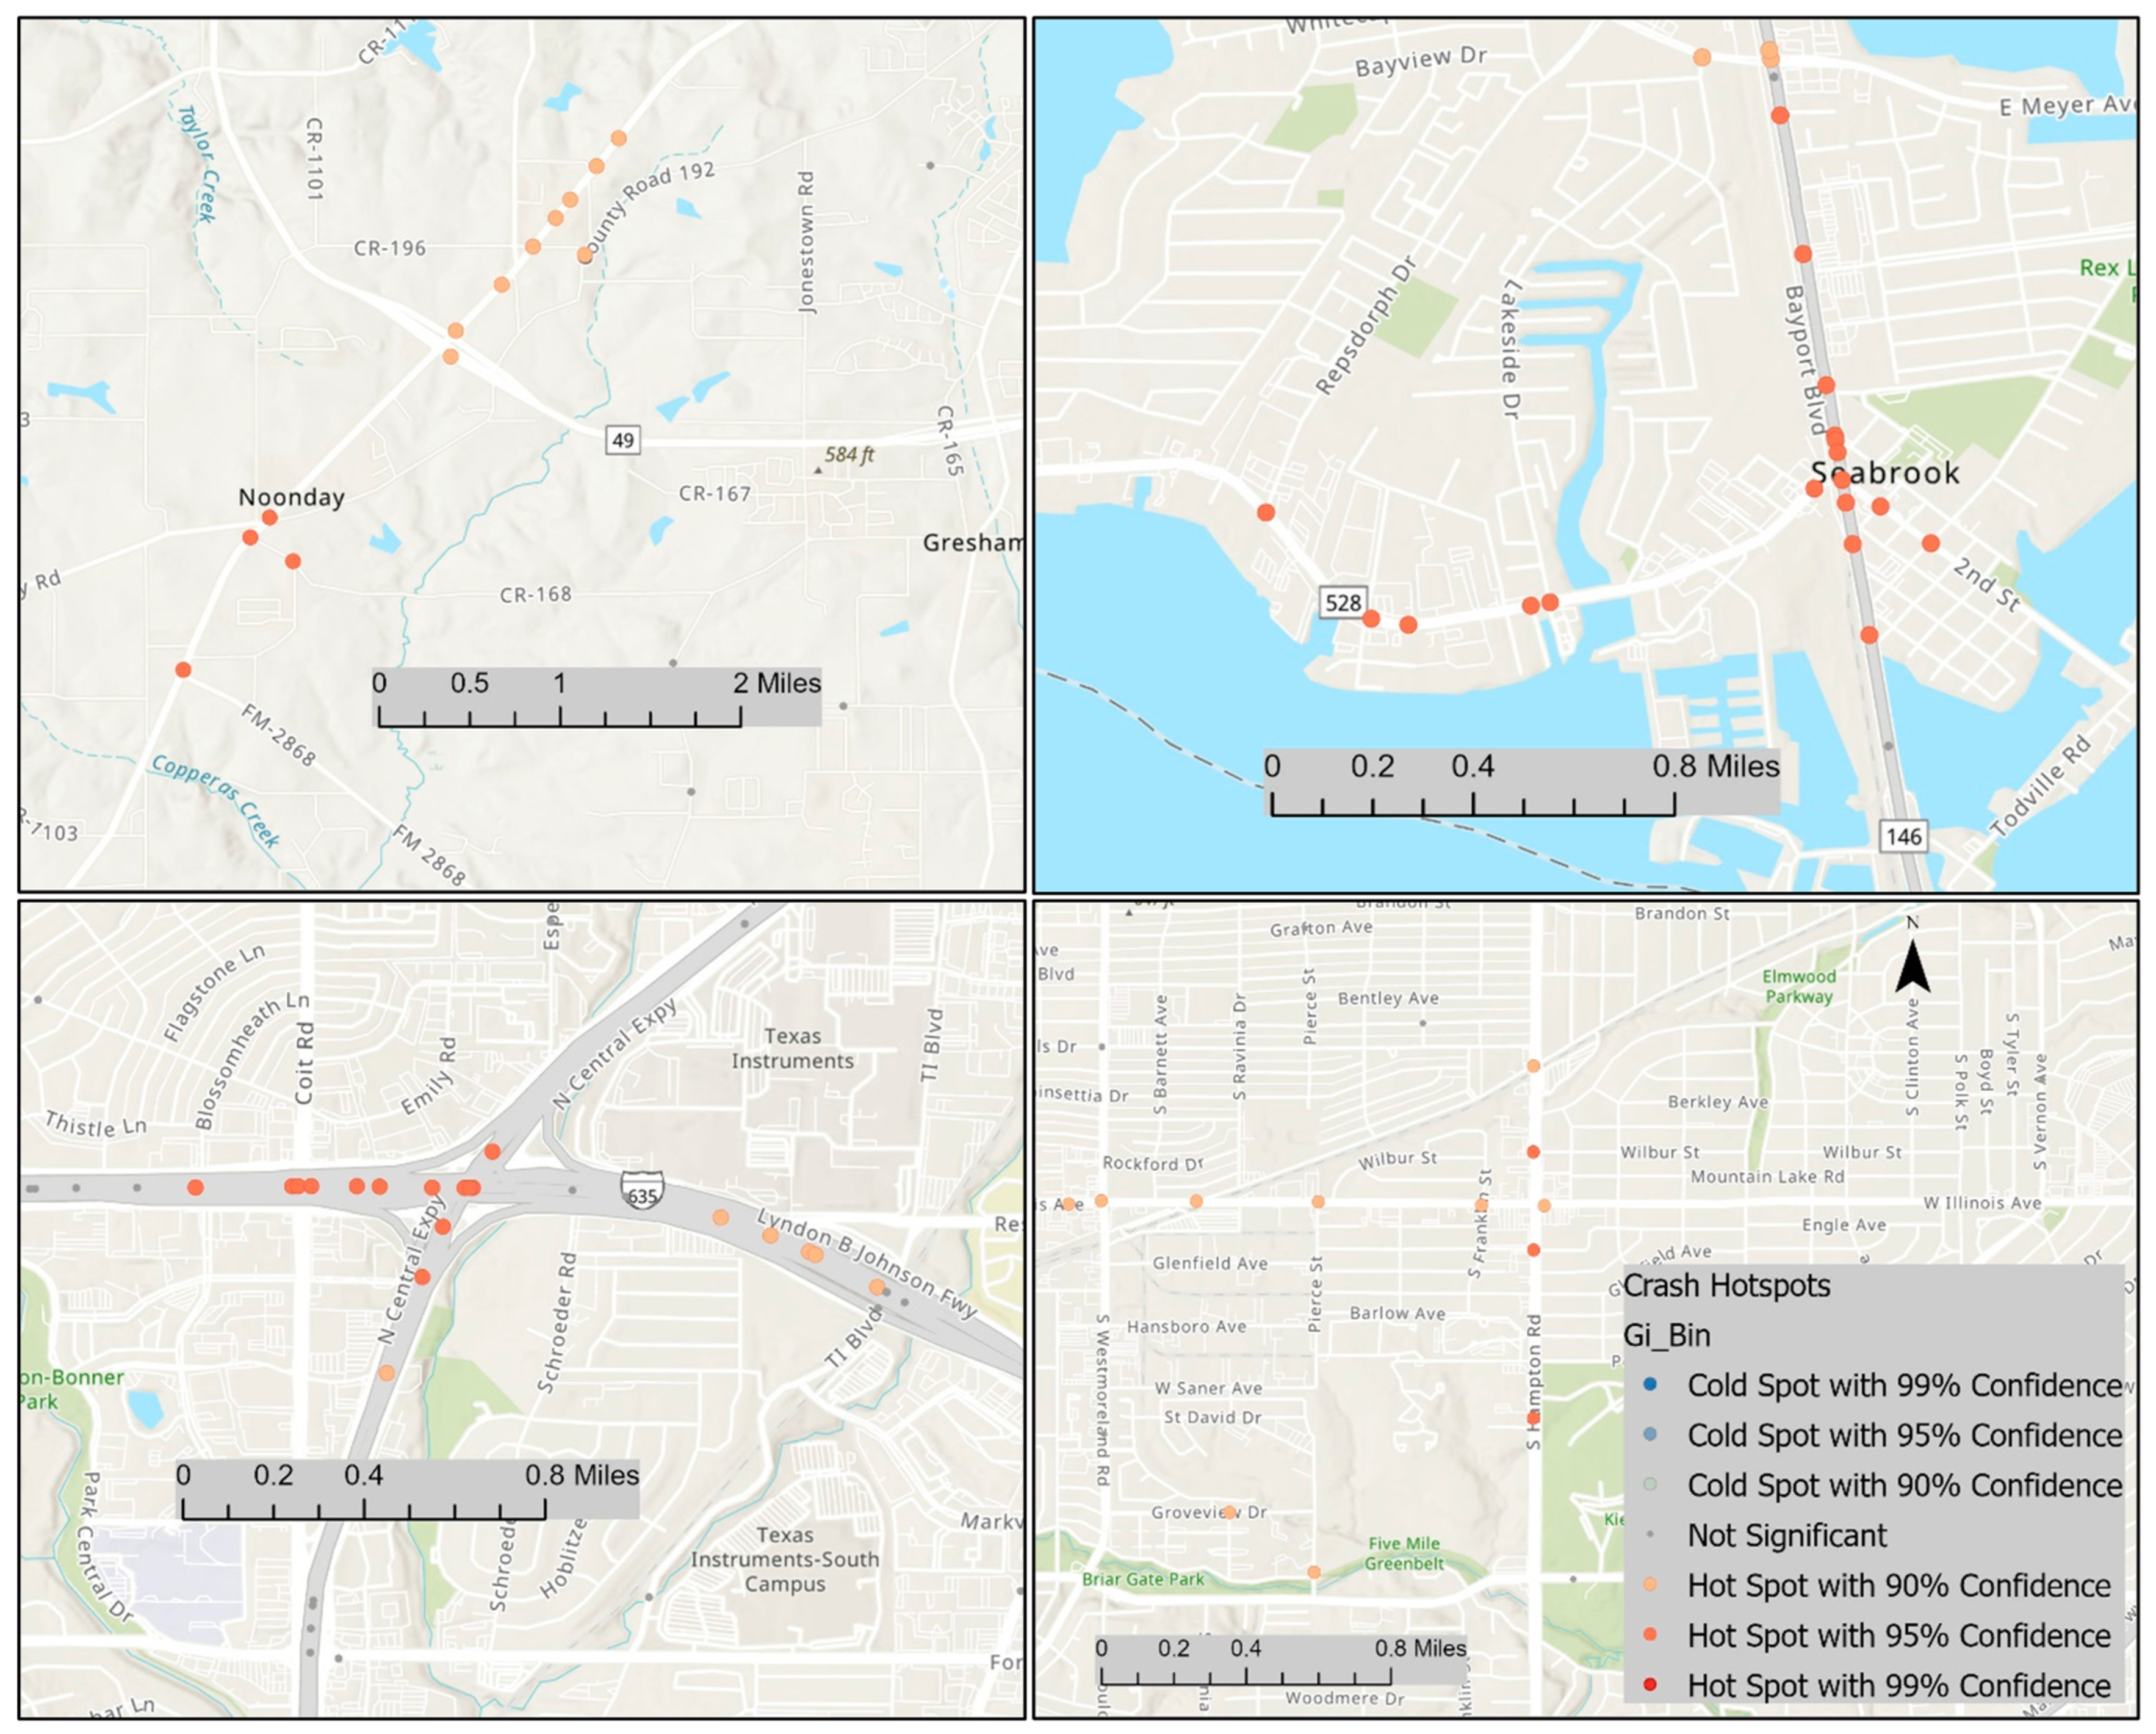
Figure 4 shows the places where there is a statistically significant high or low risk of serious motorcycle crashes. The locations with a high density of motorcycle crashes and the locations with statistically significant clusters of severe motorcycle crashes were very different. Cold spots were mostly found in major cities’ downtown areas. The frequency of motorcycle crashes is relatively high at the city center, and the road speed limits are relatively low, which might result in clusters of non-severe crashes. Hotspots were primarily observed outside the city limits of Dallas, San Antonio, Houston, Austin, and Tyler (Figure 5), and they are mostly segments of state highways or city streets. However, some high-risk segments were also on interstate roads. A segment of State Highway 155 near the intersection of State Highway 155 and State Highway 49 southwest of Tyler, a segment of State Highway 146 near Seabrook (located in southeast Houston), segments of Interstate 75 and Interstate 635 in Dallas around their intersection, and segments of S Hampton Rd. and W Illinois Ave. in Dallas around their intersection are some of the notable high-risk severe motorcycle crash zones.
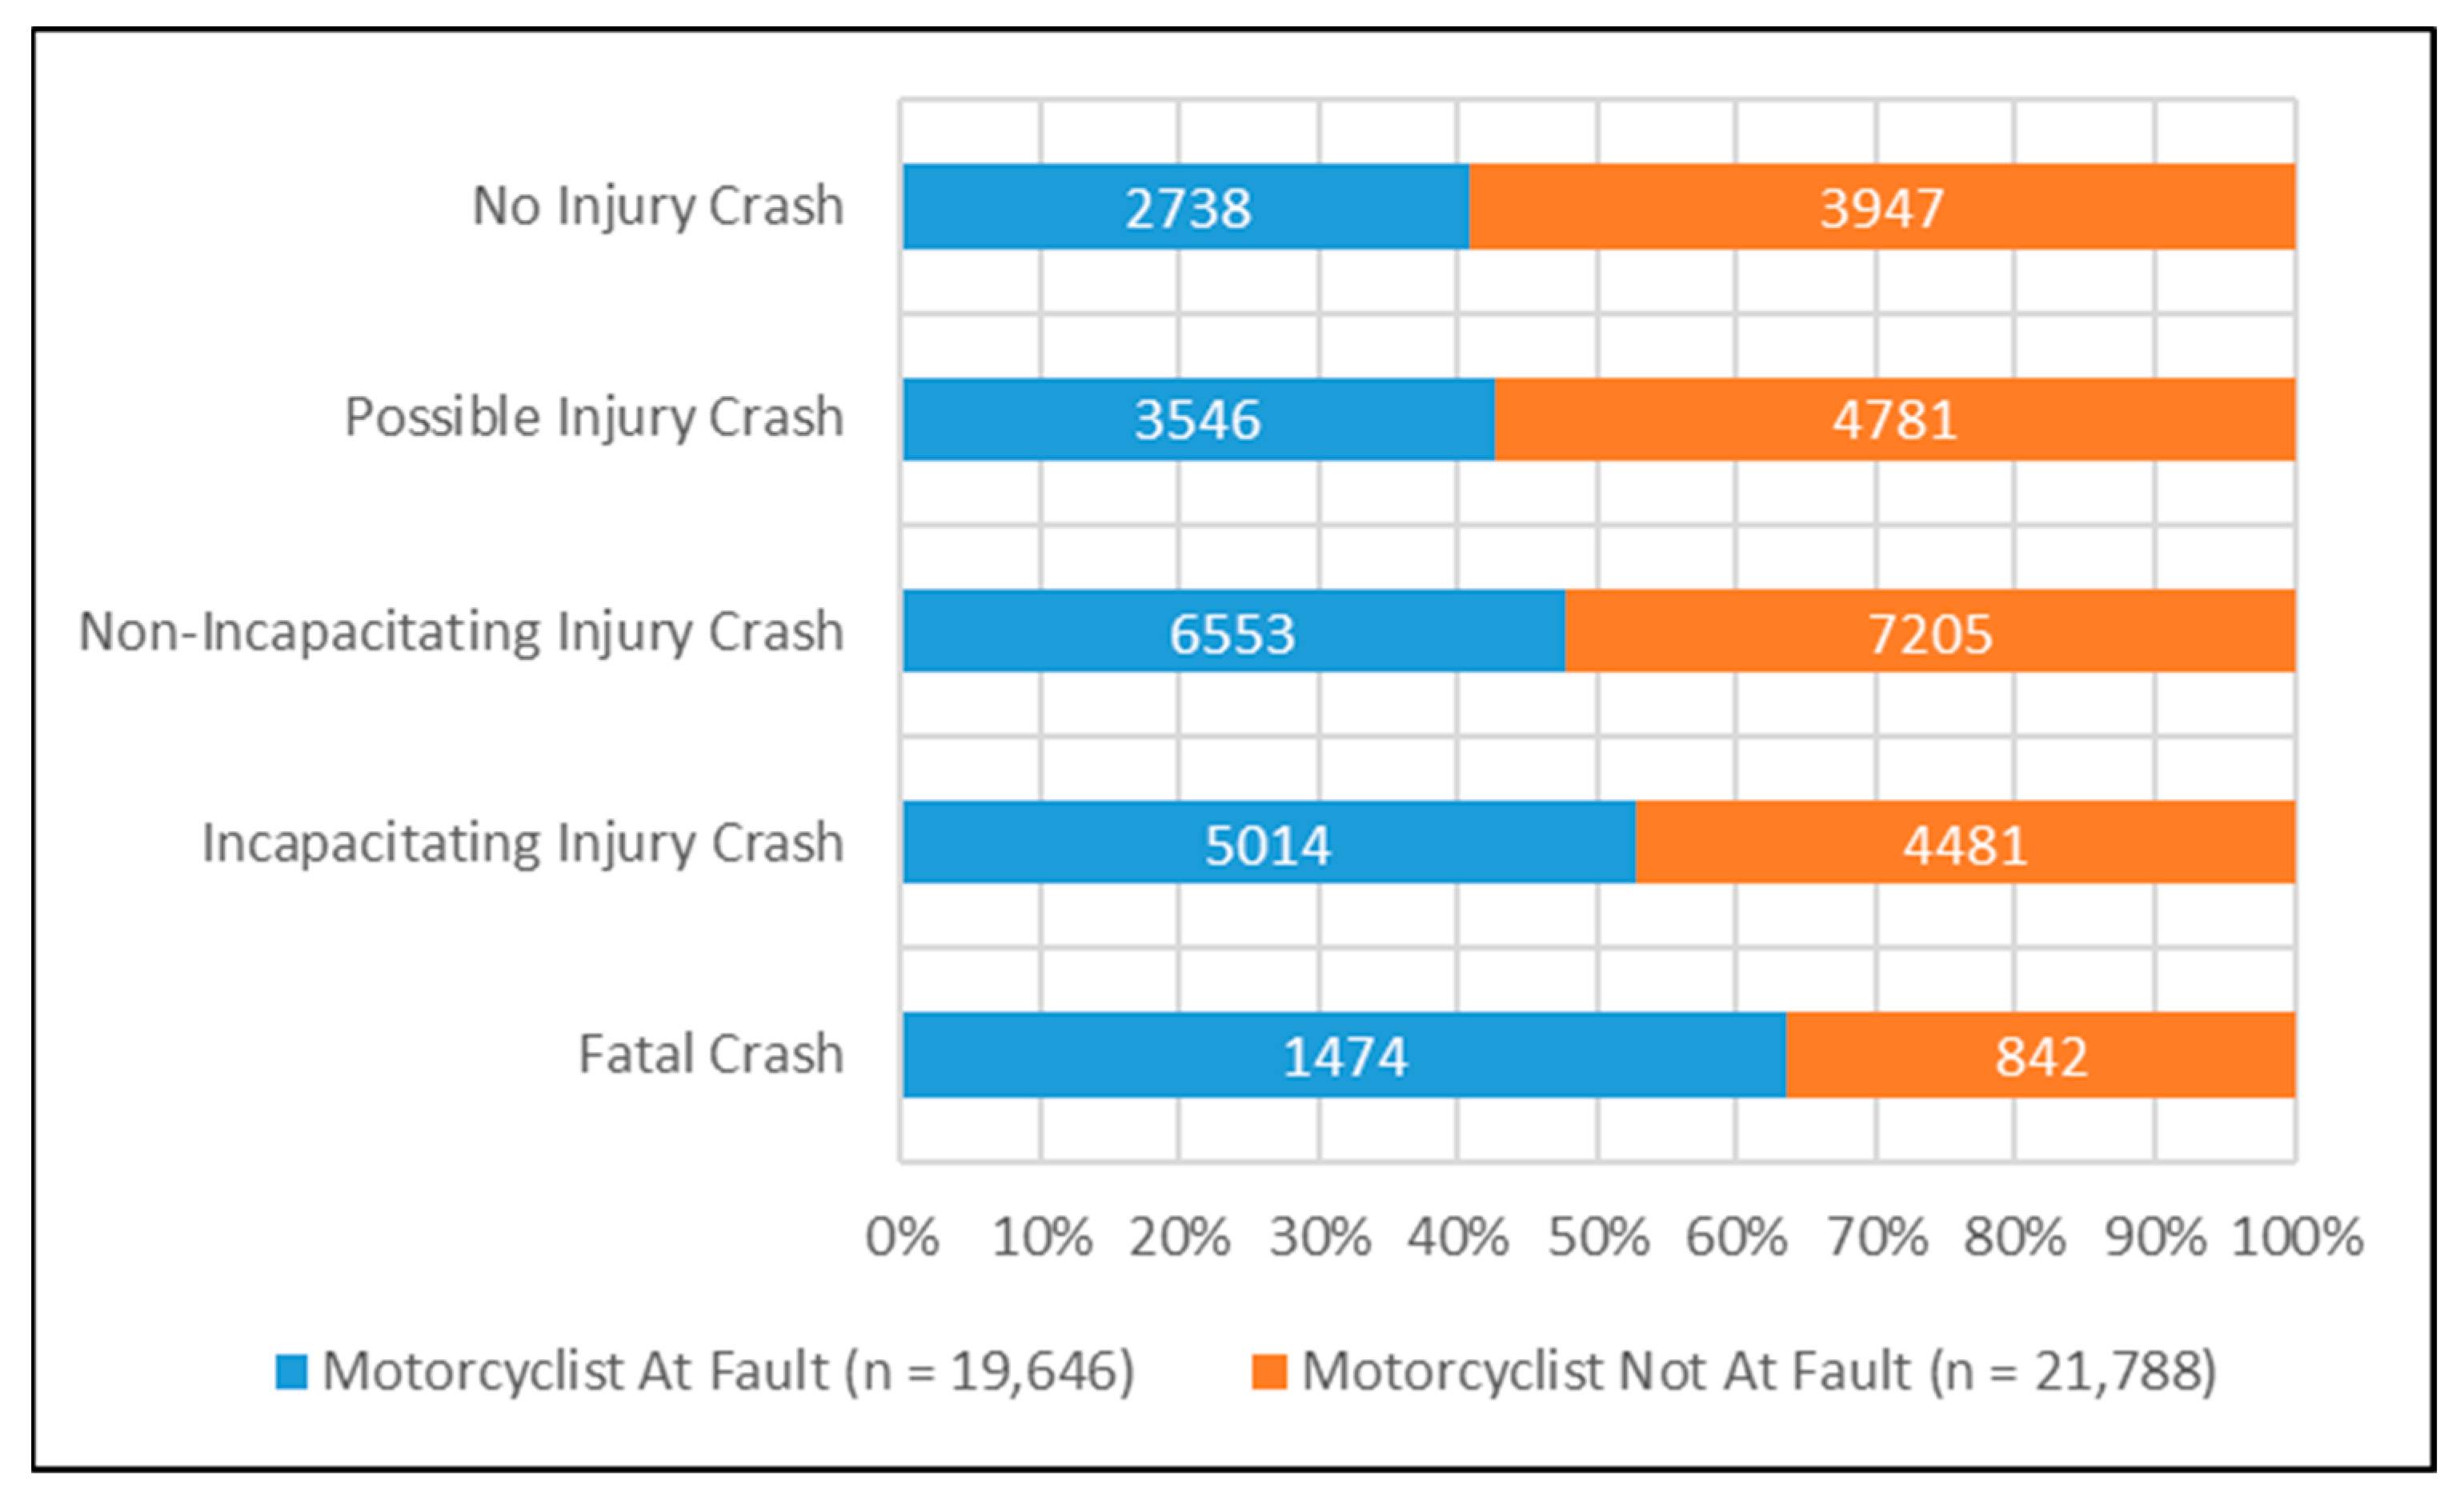
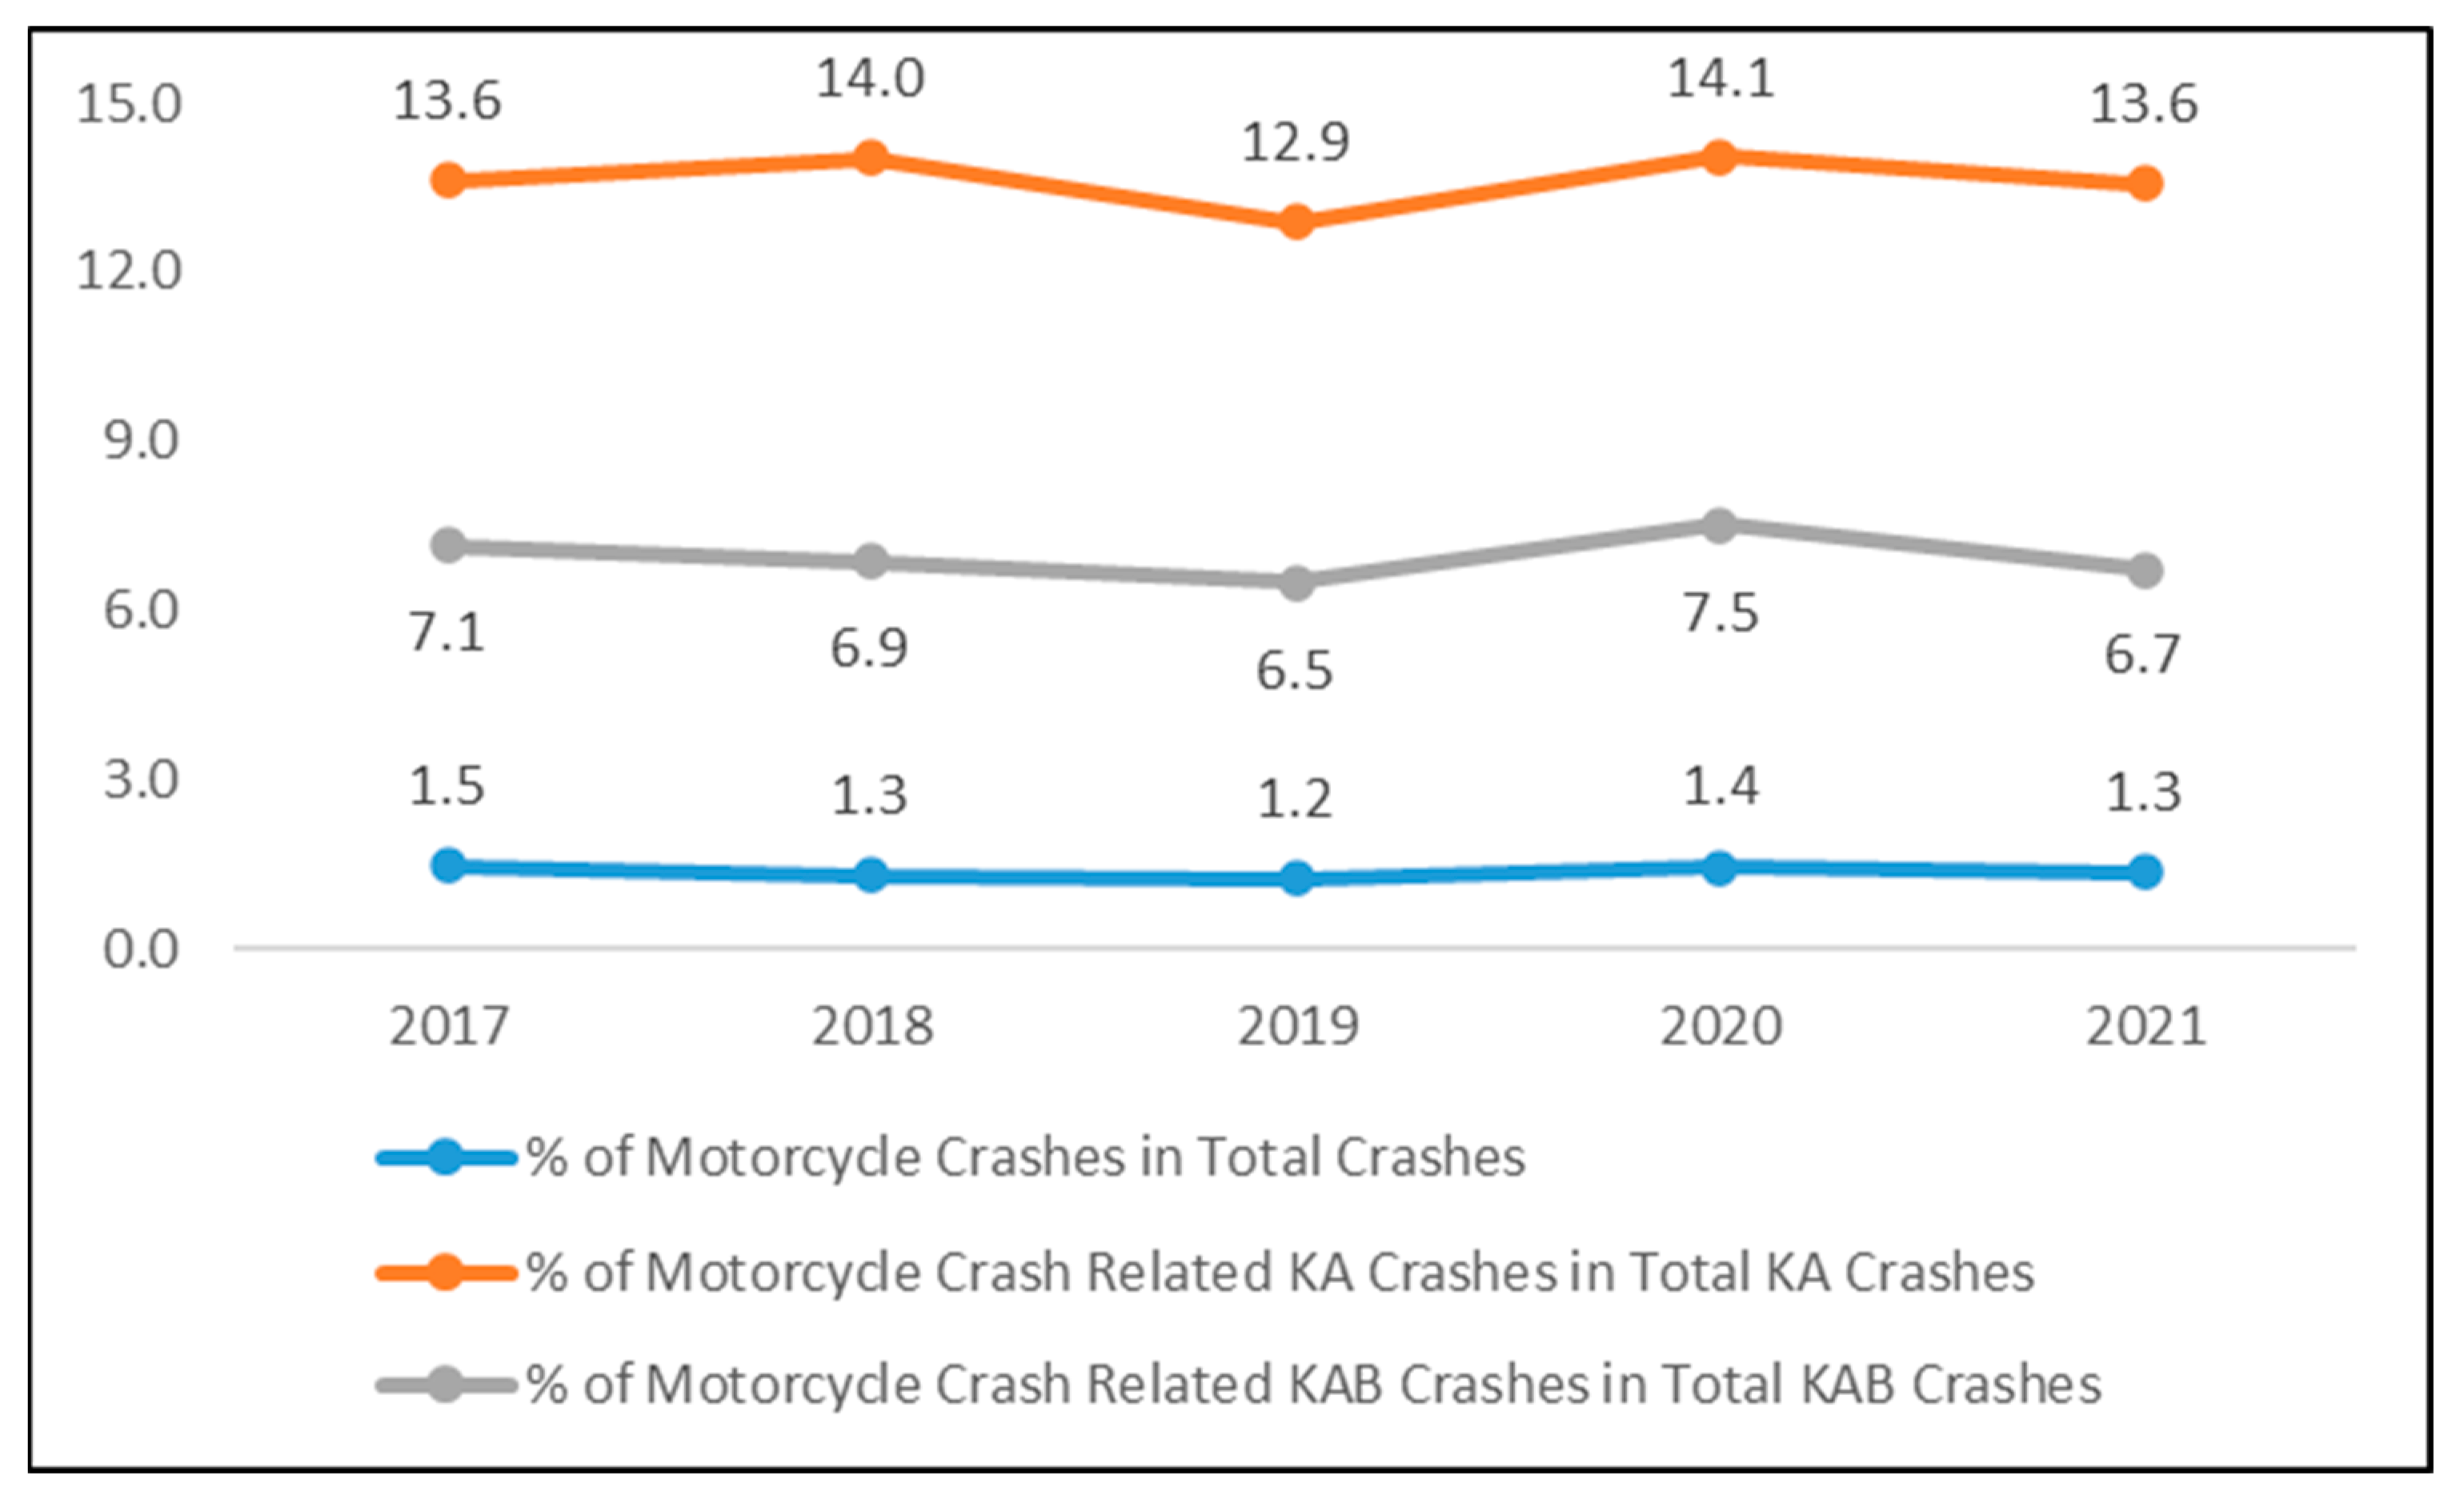
Motorcycle crashes accounted for a total of 41,434 crashes (involving 68,408 motorcyclists) from 2017 to 2021, or 1.35% of the total crashes in Texas during this period, and were responsible for 13.1% of all fatal crashes (2316), 13.8% of all incapacitating-injury crashes (9495), and 4.9% of all non-incapacitating-injury crashes (13,758). The proportions of different types of motorcycle injury crashes caused by the party at fault are shown in Figure 6. Motorcyclists were at fault for 19,646 crashes (47.4%). Crashes in which motorcyclists were at fault resulted in a substantially higher proportion of fatalities and incapacitating injuries. Motorcyclists are relatively less protected than other motor vehicle drivers in traffic crashes, and faulty maneuvering behaviors from motorcyclists might give other motor vehicle drivers less time to react, thereby increasing the chance of severe collisions. Figure 7 shows the annual proportions of motorcycle crashes and the associated KA and KAB injury proportions over the study period. The extreme vulnerability of motorcyclists to severe crashes is evident from the proportions.

3.2. Bivariate Analysis

The frequencies and proportions of motorcycle crashes for different crash severity levels and for different crash-associated variables (Table 2, Table 3 and Table 4) provide a preliminary idea of how the crash-associated variables might be related to the different levels of motorcycle crash severity and crash frequency. The following variables have the greatest association with motorcycle crashes resulting in any type of confirmed injury: “dark, not lighted” lighting condition, clear/cloudy weather condition, dry surface condition, FM roads, a higher speed limit, the weekend period, nighttime, curved road alignment, “no passing zone” as a traffic control, male and white primary persons, and absence of helmet use. For almost all crash-associated variables, the risk of severe injury related to motorcycle crashes was substantially higher when the motorcyclists were at fault. Less striking differences in proportions among the classes of variables based on the party at fault were observed for non-severe injury.
Table 5, Table 6 and Table 7 contain the results from the chi-square tests along with the respective odds ratio (OR) values for all motorcyclist, motorcyclist-at-fault, and motorcyclist-not-at-fault crashes, respectively. Modifications were performed for a few variable classes (compared to Table 2, Table 3 and Table 4) during the preparation of these tables to obtain a better grasp of their effects on different levels of crash severity. For instance, “dark, lighted” and “dark, not lighted” classes were combined and labeled as “dark” after modification. Some of the inclement weather conditions (snow, fog, and hail) had very few observations and were excluded from the chi-square test. Interstate roads, FM roads, and U.S./state highways were combined into one group (Highway/FM Road), and the rest were labeled as Other Roads. The road alignment variable was regrouped into two new classes: Straight/Curve (Level) and Straight/Curve (Grade/Hillcrest). The primary person’s ethnicity was regrouped into two classes: Hispanic and non-Hispanic.

3.2.1. Environmental and Temporal Characteristics

The effects of some of the motorcycle-crash-associated variables on crash severity are intuitively apparent. Dark lighting conditions reduce visibility and increase the reaction time of the driver, often resulting in more lethal collisions. The effect of dark lighting conditions is more prominent in severe motorcycle crashes and crashes where motorcyclists were at fault. Similar effects under dark lighting conditions were observed for pedestrian and bicycle crashes in previous studies [61,62]. Although inclement weather conditions and wet road surfaces make vehicle maneuvering difficult, severe motorcycle crashes substantially reduced under these conditions, probably due to more focused driving and less speeding by the motorcyclists. The likelihood of a severe motorcycle crash almost halved in rainy weather conditions when motorcyclists were at fault in crashes. These observations suggest relatively safer maneuvering practices among motorcyclists in inclement conditions and increased faulty driving behaviors among drivers of other motor vehicles in rainy weather conditions.
Reduced visibility and relatively higher proportions of speeding, distraction, and driving under the influence (DUI) crashes during the nighttime (8 p.m.–6 a.m.) might be the factors responsible for an increased likelihood of severe motorcycle crashes during this period. About 27.1% of all motorcycle crashes occurred during the night and were responsible for 34.5% of all severe motorcycle crashes. Motorcyclists exhibited slightly more faulty driving behavior during the night compared to other vehicle drivers (28.9% vs. 25.6%) in severe motorcycle crashes. In general, the proportion of drunk drivers is relatively higher during the weekend period [63,64]. About 36.1% of all motorcycle crashes occurred during the weekend, resulting in a substantially higher proportion of severe motorcycle crashes, especially when the motorcyclists were at fault. The winter season (December–February) was associated with a substantially lower proportion of motorcycle crashes (probably due to relatively lower motorcycling practice in cold temperatures) and relatively lesser proportions of severe and non-severe crashes (probably due to relatively safer clothing practices and helmet use).

3.2.2. Road Characteristics

A higher posted speed limit of the road increased the risk of serious injury for motorcyclists, especially when they were not at fault. The posted speed limit of the road had a greater impact on severe crashes than non-severe crashes. The odds of a severe or a non-severe crash on roads with a higher posted speed limit were 2.39 and 2.31, respectively, when motorcyclists were not at fault and 1.54 and 1.30, respectively, when motorcyclists were at fault. Although higher posted road speed limits generally increased severe crash risk, FM roads had the highest probability of severe crashes among all road classes. The effect of the road class on motorcycle crash severity differed substantially based on the party at fault. When motorcyclists were at fault, the differences in crash-severity odds were minuscule between high-speed roads (interstate roads, U.S. and state highways, and FM roads) and low-speed roads (city streets, non-trafficways), as observed from the chi-square test (Table 6). However, when motorcyclists were not at fault, low-speed roads were associated with substantially lower crash odds (OR 0.81 for severe crashes and OR 0.85 for non-severe crashes) compared to high-speed roads.
Intersections are the converging locations for vehicles and other road users, and vehicle maneuvering at intersections requires greater focus and attention from drivers. About 27.7% of all motorcycle crashes occurred at intersections, slightly less compared to other motor vehicles in Texas [65]. Overall, the severe and non-severe motorcycle crash risks at intersections were slightly lower compared to non-intersection crashes. However, severe crash risk at intersections increased (OR 1.16) when motorcyclists were not at fault in crashes (Table 7). When compared to straight road alignment and level road alignment, curved road alignment and graded/hillcrest road alignment had a higher risk of severe crashes. This observation is intuitive, as maneuvering a motorcycle becomes relatively difficult at curved road segments, and grade or hillcrest alignment might contribute to over-speeding, thus resulting in more severe crashes. When the motorcyclists were at fault, crashes at curved alignments (both level and grade/hillcrest) resulted in a substantially higher proportion of severe crashes. The risk of a severe motorcycle crash was the highest when “no passing zones” were the primary road traffic control. With the “no passing zone” as the primary traffic control measure, about 50% of all motorcycle crashes resulted in severe injury, and about 80% of all motorcycle crashes resulted in any type of injury. With “dividers”, “center stripes”, or “marked lanes” as the primary traffic control, the proportions of severe crashes were also noticeably higher. When the traffic was primarily controlled by a warning or stop sign, motorcyclist-at-fault crashes resulted in a substantially higher proportion of severe crashes (44.3%) compared to motorcyclist-not-at-fault crashes (18.3%).

3.2.3. Motorcyclist Characteristics

According to crash proportions and chi-square test results, motorcyclist helmet status and the gender of the primary persons involved were strongly associated with severe motorcycle crashes. Male motorcyclists were the predominant victims in motorcycle crashes, which is consistent with the higher proportion of male motorcyclists on roadways [66]. The probability of severe and non-severe motorcycle injuries quadrupled and tripled, respectively, when the crash-associated primary person was male. This substantial difference might be indicative of relatively safer driving and less risk-taking practices by female motorcyclists, as well as the difference in purpose of motorcycling. Male riders were slightly more likely to be involved in motorcycle-at-fault crashes compared to female drivers. About 59.3% of all motorcycle crashes involved riders wearing helmets, and the proportion of severe injuries was substantially higher for motorcyclists who did not wear helmets. The practice of wearing a helmet was less common among motorcyclists who were at fault in crashes (57.2% vs. 61.3%). The use of a helmet was more effective in preventing severe injuries compared to non-severe ones, especially when the motorcyclist was at fault in a crash.
White motorcyclists outnumbered Hispanic (24.7%) and Black (14.5%) motorcyclists in the overall crash sample (56.7%). White motorcyclists had the highest probability of sustaining a severe or non-severe injury, while Asian motorcyclists had the lowest. The proportion of faulty driving practices was slightly higher among white motorcyclists and lowest among Hispanic motorcyclists. When all the motorcyclists were grouped into two classes (Hispanic and non-Hispanic), Hispanic motorcyclists were slightly more likely to suffer from a severe or non-severe injury. The young (age 19 years) and older (age >64 years) motorcyclists showed relatively less faulty driving behavior. However, the older motorcyclists had the highest likelihood of sustaining a severe injury, irrespective of the party at fault.

3.3. Logistic Regression Results

For each combination of crash severity level and dataset (either a subset of data based on who was at fault or all the data), two logit models were made. One model included factors related to human characteristics and the other included other factors. The coefficient estimate, significance, odds ratio, standard error, and respective reference category has been shown for each variable category in Table 8 and Table 9. The coefficient estimates associated with the categorical variables express their effects on motorcycle crash severity, and a negative estimate coefficient indicates a decrease in the odds of a severe crash. Contrarily, the odds of a severe motorcycle crash increase when the estimate coefficient is positive. For example, as shown in Table 8, the daylight lighting condition is associated with a negative coefficient estimate (−0.23) when all motorcycle crashes are considered. This implies a decrease in the log-odds of a severe motorcycle crash (by 0.23) when the lighting changes from the reference condition (dark lighting) to daylight lighting. The associated asterisks are indicative of the significance of the variables and, in this case, indicate a significant reduction in severe motorcycle crashes under daylight lighting conditions. Likewise, when the associated coefficient is positive (e.g., the coefficient for the weekend period for all motorcycle crashes is 0.20), higher odds of a severe crash are expected (i.e., a greater likelihood of a severe crash during the weekend), and the associated asterisks suggest a statistically significant association between the weekend period and severe motorcycle crashes. The regression coefficient estimate could be used to determine the odds ratio value. The odds ratio is representative of the strength of association of a severe or non-severe motorcycle crash with the predictor variable. For instance, for crashes on roads with a speed limit greater than 25 mph, the odds of a severe motorcyclist-at-fault crash (OR 1.38) were lower compared to the odds of a severe motorcyclist-not-at-fault crash (OR 1.80).
Although the statistical significance of different crash-related variables and their respective strengths of association with motorcycle crash severity observed from the logistic regression model and the bivariate analysis were different, the selected variables and associated motorcycle crash severity mostly provided similar relationship directions (i.e., positive or negative) for both models, irrespective of the level of crash severity and the party at fault. The ethnicity and helmet status of the motorcyclist, the road traffic control, the road alignment, the time of the day, the period of the week, and the road speed limit were strong predictors of motorcycle crashes, irrespective of injury severity. The presence of an intersection, lighting conditions, and the age and gender of the motorcyclist have a greater association with severe motorcycle crashes, while the weather condition and the crash season have a stronger association with non-severe motorcycle crashes. Except for the road speed limit, the factors that affect the reaction time of the motorcyclist (e.g., lighting condition, road alignment, road traffic control) were generally strong predictors of motorcyclist-at-fault crashes resulting in severe injuries. On the other hand, road-environment-related factors (e.g., road type, intersection presence, road speed limit, and road alignment) were strong predictors of motorcyclist-not-at-fault crashes resulting in severe injuries.
The road speed limit was the predictor with the highest odds of a severe motorcycle crash, especially when the motorcyclist was not at fault. Due to the relatively less protected nature of motorcyclists on roadways, the speeds of crash-involved vehicles have a significant impact on the severity of injuries sustained by those involved. When the motorcyclists are not at fault in a high-speed crash, they usually have a lesser reaction time, and the perpendicular collisions resulting from the fault of the drivers of other vehicles make the crashes deadlier. The presence of an intersection was a significant predictor in determining non-severe motorcycle crashes in the bivariate analysis as a stand-alone variable and decreased the likelihood of non-severe crashes (OR 0.86). However, for the logistic regression model, while acting in conjunction with other variables, the presence of an intersection turned out to be a significant predictor for severe motorcycle crashes and increased the likelihood of severe crashes (OR 1.18). In the case of KAB motorcycle crashes, the road traffic control, the weekend period, road alignment, and the helmet status and ethnicity of motorcyclists were significant predictors regardless of the party at fault.
Adverse weather conditions (rain) reduced the likelihood of both severe and non-severe motorcycle crashes. Wet surface conditions reduced the likelihood of severe motorcycle crashes. Reduced vehicle speed, combined with increased focus while driving, may reduce the crash severity risk for rainy weather and wet surfaces. Overall, the likelihood of severe motorcycle crashes was largely dependent on vehicle speed and maneuvering-related variables (higher road speed limit, highways, grade/hillcrest road alignment, divider/marked lane as traffic control, intersection presence), visibility and temporal variables (8 p.m.–6 a.m. period, dark lighting condition, weekend period), and primary person characteristics (age, gender, ethnicity, helmet use practice). Wearing a helmet significantly reduced the likelihood of both severe and non-severe motorcycle crashes, regardless of who was at fault. Male and older primary persons have higher odds of severe injury, while female primary persons are more likely to sustain non-severe injuries.

4. Conclusions

Motorcycle riders are the most susceptible to severe injuries among all road users. Using Texas five-year crash data (including geographical coordinates, chronological information, environmental and road parameters, and other pertinent information), this study evaluated the complicated correlations between motorcycle-crash-related elements and associated crash severity. After splitting the motorcycle collisions into two subgroups based on the party at fault, bivariate and logistic regression analyses were conducted to determine the correlations between the severity of injuries and temporal, human, road, and environmental factors.
The day of the week, time of day, speed limit, road alignment, road traffic control, ethnicity, and helmet use were significant predictors of motorcycle collisions resulting in injuries, regardless of severity. Yet only the principal person’s age and gender were significant predictors of serious collisions. When warning or yield signs were the principal traffic control on a road, the percentage of motorcyclist-at-fault collisions was much greater than the percentage of motorcyclist-not-at-fault collisions. Much more serious motorcycle crashes occurred in no-passing zones compared to other road traffic measures. Campaigns emphasizing the necessity of correctly respecting road signs, the installation of additional road signs in no-passing zones, and an increase in police patrol in these areas could minimize road-traffic-control-related serious motorcycle crashes. As noted in the section on the literature review, helmets have been found to reduce both severe and minor injuries. In Texas, however, motorcyclists over the age of 21 who have completed a safety course and have USD 10,000 in insurance are not obliged to wear a helmet. Several localities in Texas have passed ordinances requiring helmet use, but there is currently no statewide helmet law. The implementation of a statewide helmet law or helmet-use ordinances in all major cities is strongly advocated.
Although adverse weather conditions and wet surfaces reduced the likelihood of severe motorcycle crashes (due to slower vehicle speeds), the proportion of faulty motorcyclists increased significantly under these conditions, suggesting that motorcyclists may be less willing to engage in safer maneuvers in these conditions. Motorcyclists are substantially less likely to be at fault in junction collisions, and when they are not at fault, the chance of severe injuries is significantly increased. Compared to other motor vehicles, it is easier to miss a motorcycle approaching a crossroads, and the negligence of other motorists frequently puts motorcyclists at risk, especially during left turns [67,68]. Reduced speed limits near unsignalized intersections, the installation of a “stop and go” signal at unsignalized intersections, the introduction of dedicated left-turn-only lanes at high-risk intersections, and the installation of advanced intersection conflict warning systems may all contribute to the reduction in motorcycle collisions at intersections [69].
On city and county highways, motorcyclists were less likely to commit traffic violations. In addition, on routes with greater speed restrictions, the chance of severe injury was significantly higher when the motorcyclist was not at fault, perhaps due to the motorcyclist’s relatively shorter reaction time and the unpredictability of a collision. During the day (6 a.m.–8 p.m.), motorcyclists were found to exhibit somewhat erratic conduct, but other motor vehicle drivers were more likely to exhibit erratic behavior at night. The use of speed cameras, educational campaigns, and awareness initiatives directed at drivers of other motor vehicles so that they can safely use city roadways, particularly at night, could aid in the reduction in serious motorcycle crashes on city streets. It is highly likely that the level of law enforcement inside cities and on highways is different, and ensuring a sufficient level of law enforcement for both cities and highways might help to reduce law violations and severe crashes. Drunk drivers account for a significant proportion of negligent nighttime drivers; hence, increasing the use of ridesharing services after alcohol intake and implementing anti-drunk-driving technologies (e.g., breathalyzers or touch sensors) are advocated. Curved road segments are more difficult to navigate, especially if they have a steep slope. To increase friction and skid resistance, high-friction road treatments could be applied on curved segments with steep downward gradients, signalized and stop-controlled crossings with frequent motorcycle collisions, and intersection approaches [70]. Due to the substantially higher use of protective gear (e.g., leather gloves, coats, and pants) by motorcyclists during the winter season, which minimizes soft tissue injury [21], the probability of a non-severe motorcycle crash is significantly reduced during the winter season. While the busier roads and intersections in and around the city centers of Texas’s major cities had significantly higher motorcycle crash densities, these roads and intersections were frequently observed to have cold spots, while most of the hotspots were located outside the city limits of some of the major cities.
This research has a few drawbacks. The severity of crash-related injuries was determined by the on-duty police officer based on the officer’s discretion (which was subject to error) and was not cross-verified with hospital data or other external data sources. The police indicated that contributing variables were considered when determining who was responsible in a collision, and the reporting was subject to subjective fault. Because crashes involving principal persons may not be representative of the broader road-user population, bias in sample selection is frequently linked with crash data analysis, and the findings from this study are no exception. Due to the unavailability of reliable statewide AADT data, this study could not incorporate AADT data during the analysis. Almost one-fourth of the crashes lacked coordinates, hence the heat map analysis and hotspot analysis were conducted using only the crashes with locations. When the seriousness of a collision was unable to be determined (e.g., hit-and-run, abandoning the scene), it was listed as unknown. The findings of this study could assist the city of San Antonio in attaining its goal of minimizing traffic-related fatalities [71]. Using the results of spatial and statistical analysis, the stakeholders may make an informed decision by assuring the effective prioritization of resources for the modification of current facilities and the deployment of new facilities. Knowing how diverse variables influence severe motorcycle collisions, particularly the at-fault party, could aid in the organization of effective awareness programs and the formulation of laws.

Author Contributions

H.O.S. and S.D. guided this research, significantly contributed to preparing the manuscript for publication, and contributed to developing the research methodology. K.B. processed the data, developed the scripts used in the analysis, and performed the analysis. K.B. prepared the first draft. H.O.S. and S.D. performed the final overall proofreading of the manuscript. All authors have read and agreed to the published version of the manuscript.

Funding

The financial support of the Transportation Consortium of South-Central States (Tran-SET) is greatly appreciated (Tran-SET Project 22SAUTSA66 and Grant Number 69A3551747106).

Institutional Review Board Statement

Not applicable.

Informed Consent Statement

Not applicable.

Data Availability Statement

Publicly available datasets were analyzed in this study. The data can be found here: https://cris.txdot.gov/ (accessed on 25 May 2022).

Conflicts of Interest

The authors declare no conflict of interest.

References

  1. Shipp, E.M.; Wunderlich, R.; Perez, M.; Ko, M.; Pant, A.; Martin, M.; Chigoy, B.; Trueblood, A. Comprehensive Analysis of Motorcycle Crashes in Texas: A Multi-Year Snapshot; Texas A&M Transportation Institute: College Station, TX, USA, 2016. [Google Scholar]
  2. NHTSA. Motorcycle Safety. Available online: https://www.nhtsa.gov/road-safety/motorcycles (accessed on 22 June 2022).
  3. Geedipally, S.R.; Turner, P.A.; Patil, S. Analysis of Motorcycle Crashes in Texas with Multinomial Logit Model. Transp. Res. Rec. 2011, 2265, 62–69. [Google Scholar] [CrossRef]
  4. Rezapour, M.; Molan, A.M.; Ksaibati, K. Analyzing injury severity of motorcycle at-fault crashes using decision tree and logistic regression methods. Int. J. Transp. Sci. Technol. 2020, 9, 89–99. [Google Scholar] [CrossRef]
  5. Haque, M.M.; Chin, H.C.; Debnath, A.K. An investigation on multi-vehicle motorcycle crashes using log-linear models. Saf. Sci. 2012, 50, 352–362. [Google Scholar] [CrossRef] [Green Version]
  6. Preusser, D.F.; Williams, A.F.; Ulmer, R.G. Analysis of fatal motorcycle crashes: Crash typing. Accid. Anal. Prev. 1995, 27, 845–851. [Google Scholar] [CrossRef]
  7. Rifaat, S.M.; Tay, R.; de Barros, A. Severity of motorcycle crashes in Calgary. Accid. Anal. Prev. 2012, 49, 44–49. [Google Scholar] [CrossRef] [PubMed]
  8. Schneider, W.H.; Savolainen, P.T.; Van Boxel, D.; Beverley, R. Examination of factors determining fault in two-vehicle motorcycle crashes. Accid. Anal. Prev. 2012, 45, 669–676. [Google Scholar] [CrossRef] [PubMed]
  9. Wahab, L.; Jiang, H. Severity prediction of motorcycle crashes with machine learning methods. Int. J. Crashworth. 2020, 25, 485–492. [Google Scholar] [CrossRef]
  10. Cunningham, J.R.; Fitzsimmons, E.J.; Dissanayake, S. An Investigation of Factors Associated with Motorcycle Crashes on Kansas’s State Highway System. In Proceedings of the Transportation Research Board 97th Annual Meeting Transportation Research Board, Washington, DC, USA, 7–11 January 2018; (No. 18–04516). Article 18–04516. Available online: https://trid.trb.org/view/1496252 (accessed on 4 June 2022).
  11. Kitali, A.E.; Kidando, E.; Alluri, P.; Sando, T.; Salum, J.H. Modeling severity of motorcycle crashes with Dirichlet process priors. J. Transp. Saf. Secur. 2022, 14, 24–45. [Google Scholar] [CrossRef]
  12. Chaudhuri, U.; Ratnapradipa, K.L.; Shen, S.; Rice, T.M.; Smith, G.A.; Zhu, M. Trends and patterns in fatal US motorcycle crashes, 2000–2016. Traffic Inj. Prev. 2019, 20, 641–647. [Google Scholar] [CrossRef]
  13. Schneider, W.H.; Savolainen, P.T.; Moore, D.N. Effects of Horizontal Curvature on Single-Vehicle Motorcycle Crashes along Rural Two-Lane Highways. Transp. Res. Rec. 2010, 2194, 91–98. [Google Scholar] [CrossRef]
  14. Xin, C.; Wang, Z.; Lee, C.; Lin, P.-S.; Chen, T.; Guo, R.; Lu, Q. Development of crash modification factors of horizontal curve design features for single-motorcycle crashes on rural two-lane highways: A matched case-control study. Accid. Anal. Prev. 2019, 123, 51–59. [Google Scholar] [CrossRef] [PubMed]
  15. Haque, M.M.; Chin, H.C.; Huang, H. Applying Bayesian hierarchical models to examine motorcycle crashes at signalized intersections. Accid. Anal. Prev. 2010, 42, 203–212. [Google Scholar] [CrossRef] [Green Version]
  16. Islam, M. The effect of motorcyclists’ age on injury severities in single-motorcycle crashes with unobserved heterogeneity. J. Saf. Res. 2021, 77, 125–138. [Google Scholar] [CrossRef] [PubMed]
  17. Jimenez, A.; Bocarejo, J.P.; Zarama, R.; Yerpez, J. A case study analysis to examine motorcycle crashes in Bogota, Colombia. J. Saf. Res. 2015, 52, 29–38. [Google Scholar] [CrossRef]
  18. Teoh, E.R.; Campbell, M. Role of motorcycle type in fatal motorcycle crashes. J. Saf. Res. 2010, 41, 507–512. [Google Scholar] [CrossRef] [PubMed]
  19. Weaver, J.L.; Miller, K.R.; Benns, M.; Harbrecht, B.G. Moped Crashes are Just as Dangerous as Motorcycle Crashes. Am. Surg. 2018, 84, 826–830. [Google Scholar] [CrossRef] [PubMed]
  20. Ankarath, S.; Giannoudis, P.V.; Barlow, I.; Bellamy, M.C.; Matthews, S.J.; Smith, R.M. Injury patterns associated with mortality following motorcycle crashes. Injury 2002, 33, 473–477. [Google Scholar] [CrossRef]
  21. Peek, C.; Braver, E.R.; Shen, H.; Kraus, J.F. Lower extremity injuries from motorcycle crashes: A common cause of preventable injury. J. Trauma 1994, 37, 358–364. [Google Scholar] [CrossRef]
  22. Robertson, A.; Giannoudis, P.V.; Branfoot, T.; Barlow, I.; Matthews, S.J.; Smith, R.M. Spinal Injuries in Motorcycle Crashes: Patterns and Outcomes. J. Trauma Acute Care Surg. 2002, 53, 5–8. [Google Scholar] [CrossRef]
  23. Clarke, J.A.; Langley, J.D. Disablement resulting from motorcycle crashes. Disabil. Rehabil. 1995, 17, 377–385. [Google Scholar] [CrossRef]
  24. Park, G.-J.; Shin, J.; Kim, S.-C.; Na, D.-S.; Lee, H.-J.; Kim, H.; Lee, S.-W.; In, Y.-N. Protective effect of helmet use on cervical injury in motorcycle crashes: A case–control study. Injury 2019, 50, 657–662. [Google Scholar] [CrossRef] [PubMed]
  25. Saunders, R.N.; Dull, M.B.; Witte, A.B.; Regan, J.M.; Davis, A.T.; Koehler, T.J.; Gibson, C.J.; Iskander, G.A.; Rodriguez, C.H.; Cohle, S.D.; et al. The danger zone: Injuries and conditions associated with immediately fatal motorcycle crashes in the state of Michigan. Am. J. Surg. 2019, 217, 552–555. [Google Scholar] [CrossRef] [PubMed]
  26. Haworth, N.; Debnath, A.K. How similar are two-unit bicycle and motorcycle crashes? Accid. Anal. Prev. 2013, 58, 15–25. [Google Scholar] [CrossRef] [Green Version]
  27. Villaveces, A.; Cummings, P.; Koepsell, T.D.; Rivara, F.P.; Lumley, T.; Moffat, J. Association of Alcohol-related Laws with Deaths due to Motor Vehicle and Motorcycle Crashes in the United States, 1980–1997. Am. J. Epidemiol. 2003, 157, 131–140. [Google Scholar] [CrossRef] [Green Version]
  28. Notrica, D.M.; Sayrs, L.W.; Krishna, N.; Davenport, K.P.; Jamshidi, R.; McMahon, L. Impact of helmet laws on motorcycle crash mortality rates. J. Trauma Acute Care Surg. 2020, 89, 962–970. [Google Scholar] [CrossRef]
  29. Norvell, D.C.; Cummings, P. Association of Helmet Use with Death in Motorcycle Crashes: A Matched-Pair Cohort Study. Am. J. Epidemiol. 2002, 156, 483–487. [Google Scholar] [CrossRef] [Green Version]
  30. Kyrychenko, S.Y.; McCartt, A.T. Florida’s Weakened Motorcycle Helmet Law: Effects on Death Rates in Motorcycle Crashes. Traffic Inj. Prev. 2006, 7, 55–60. [Google Scholar] [CrossRef]
  31. MacLeod, J.B.A.; DiGiacomo, J.C.; Tinkoff, G. An Evidence-Based Review: Helmet Efficacy to Reduce Head Injury and Mortality in Motorcycle Crashes: EAST Practice Management Guidelines. J. Trauma Acute Care Surg. 2010, 69, 1101–1111. [Google Scholar] [CrossRef] [PubMed]
  32. Truong, L.T.; Tay, R.; Nguyen, H.T.T. Relationships between Body Mass Index and Self-Reported Motorcycle Crashes in Vietnam. Sustainability 2020, 12, 1382. [Google Scholar] [CrossRef] [Green Version]
  33. Doan, H.T.N.; Hobday, M.B. Characteristics and severity of motorcycle crashes resulting in hospitalization in Ho Chi Minh City, Vietnam. Traffic Inj. Prev. 2019, 20, 732–737. [Google Scholar] [CrossRef]
  34. Jou, R.C.; Chao, M.C. An analysis of the novice motorcyclist crashes in Taiwan. Traffic Inj. Prev. 2022, 23, 140–145. [Google Scholar] [CrossRef]
  35. Lin, H.-Y.; Li, J.-S.; Pai, C.-W.; Chien, W.-C.; Huang, W.-C.; Hsu, C.-W.; Wu, C.-C.; Yu, S.-H.; Chiu, W.-T.; Lam, C. Environmental Factors Associated with Severe Motorcycle Crash Injury in University Neighborhoods: A Multicenter Study in Taiwan. Int. J. Environ. Res. Public Health 2022, 19, 10274. [Google Scholar] [CrossRef] [PubMed]
  36. Kasantikul, V.; Ouellet, J.V.; Smith, T.; Sirathranont, J.; Panichabhongse, V. The role of alcohol in Thailand motorcycle crashes. Accid. Anal. Prev. 2005, 37, 357–366. [Google Scholar] [CrossRef]
  37. Sultan, Z.; Ngadiman, N.I.; Kadir, F.D.A.; Roslan, N.F.; Moeinaddini, M. Factor analysis of motorcycle crashes in Malaysia. Plan. Malays. 2016, 4, 135–146. [Google Scholar] [CrossRef] [Green Version]
  38. Manan, M.M.A.; Várhelyi, A.; Çelik, A.K.; Hashim, H.H. Road characteristics and environment factors associated with motorcycle fatal crashes in Malaysia. IATSS Res. 2018, 42, 207–220. [Google Scholar] [CrossRef]
  39. Sivasankaran, S.K.; Rangam, H.; Balasubramanian, V. Investigation of factors contributing to injury severity in single vehicle motorcycle crashes in India. Int. J. Inj. Control Saf. Promot. 2021, 28, 243–254. [Google Scholar] [CrossRef]
  40. Rahman, M.H.; Zafri, N.M.; Akter, T.; Pervaz, S. Identification of factors influencing severity of motorcycle crashes in Dhaka, Bangladesh using binary logistic regression model. Int. J. Inj. Control Saf. Promot. 2021, 28, 141–152. [Google Scholar] [CrossRef]
  41. Piantini, S.; Bourdet, N.; Savino, G.; Rosalie, S.; Pierini, M.; Deck, C.; Willinger, R. Potential head injury mitigation of M-AEB in real-world motorcycle crashes. Int. J. Crashworth. 2020, 25, 591–602. [Google Scholar] [CrossRef]
  42. Teoh, E.R. Effectiveness of Antilock Braking Systems in Reducing Motorcycle Fatal Crash Rates. Traffic Inj. Prev. 2011, 12, 169–173. [Google Scholar] [CrossRef]
  43. Teoh, E.R. Motorcycle crashes potentially preventable by three crash avoidance technologies on passenger vehicles. Traffic Inj. Prev. 2018, 19, 513–517. [Google Scholar] [CrossRef]
  44. Wang, Z.; Lee, C.; Lin, P.-S.; Guo, R.; Xin, C.; Kolla, R.D.T.N.; Yang, R.; Vasili, A. Study on Motorcycle Safety in Negotiation with Horizontal Curves in Florida and Development of Crash Modification Factors. (No. BDV25-977–21). Article BDV25-977–21. 2018. Available online: https://trid.trb.org/view/1566777 (accessed on 3 June 2022).
  45. Centers for Disease Control and Prevention. Motor Vehicle Crash Deaths: Costly but Preventable. Available online: http://www.cdc.gov/motorvehiclesafety/pdf/statecosts/tx-2015costofcrashdeaths-a.pdf (accessed on 3 June 2022).
  46. Lawrence, B.A.; Max, W.; Miller, T.R. Costs of Injuries Resulting from Motorcycle Crashes: A Literature Review (HS-809 242). Article HS-809 242. 2003. Available online: https://trid.trb.org/view/643543 (accessed on 2 June 2022).
  47. Pincus, D.; Wasserstein, D.; Nathens, A.B.; Bai, Y.Q.; Redelmeier, D.A.; Wodchis, W.P. Direct medical costs of motorcycle crashes in Ontario. Can. Med. Assoc. J. 2017, 189, E1410–E1415. [Google Scholar] [CrossRef] [PubMed] [Green Version]
  48. Salih, H. Identification and Analysis of the Major Factors Contributing to Fatal Crashes in Texas. Ph.D. Thesis, The University of Texas, San Antonio, TX, USA, 2020. [Google Scholar]
  49. Alshatti, F. Analysis of motorcycle crashes and fatalities including the impact of distracted drivers in Texas. Ph.D. Thesis, The University of Texas, San Antonio, TX, USA, 2016. [Google Scholar]
  50. Environmental Systems Research Institute (ESRI). ArcGIS Pro Tool Reference. Density Toolset Concept. 2014. Available online: https://pro.arcgis.com/en/pro-app/tool-reference/spatial-analyst/how-kernel-density-works (accessed on 12 June 2020).
  51. Chainey, S.; Ratcliffe, J. GIS and Crime Mapping; John Wiley & Sons: Hoboken, NJ, USA, 2013. [Google Scholar]
  52. Silverman, B.W. Density Estimation for Statistics and Data Analysis; CRC Press: Boca Raton, FL, USA, 1986. [Google Scholar]
  53. Vemulapalli, S.S. GIS-based spatial and temporal analysis of aging-involved crashes in Florida. Ph.D. Thesis, The Florida State University, Tallahassee, FL, USA, 2015. [Google Scholar]
  54. Harirforoush, H.; Bellalite, L. A new integrated GIS-based analysis to detect hotspots: A case study of the city of Sherbrooke. Accid. Anal. Prev. 2019, 130, 62–74. [Google Scholar] [CrossRef] [PubMed]
  55. Young, J.; Park, P.Y. Hotzone identification with GIS-based post-network screening analysis. J. Transp. Geogr. 2014, 34, 106–120. [Google Scholar] [CrossRef]
  56. Plug, C.; Xia, J.C.; Caulfield, C. Spatial and temporal visualisation techniques for crash analysis. Accid. Anal. Prev. 2011, 43, 1937–1946. [Google Scholar] [CrossRef] [PubMed]
  57. Truong, L.; Somenahalli, S. Using GIS to Identify Pedestrian-Vehicle Crash Hot Spots and Unsafe Bus Stops. J. Public Transp. 2011, 14, 99–114. [Google Scholar] [CrossRef] [Green Version]
  58. RTA. Road Traffic Accidents in NSW—1993; Roads and Traffic Authority of NSW: Sydney, Australia, 1994. [Google Scholar]
  59. Geurts, K.; Wets, G.; Brijs, T.; Vanhoof, K. Identification and ranking of black spots: Sensitivity analysis. Transp. Res. Rec. J. Transp. Res. Board 2004, 1897, 34–42. [Google Scholar] [CrossRef]
  60. RStudio Team. RStudio: Integrated Development Environment for R. RStudio; PBC: Boston, MA, USA, 2020; Available online: http://www.rstudio.com/ (accessed on 12 June 2021).
  61. Billah, K.; Sharif, H.O.; Dessouky, S. Analysis of Pedestrian–Motor Vehicle Crashes in San Antonio, Texas. Sustainability 2021, 13, 6610. [Google Scholar] [CrossRef]
  62. Billah, K.; Sharif, H.O.; Dessouky, S. Analysis of Bicycle-Motor Vehicle Crashes in San Antonio, Texas. Int. J. Environ. Res. Public Health 2021, 18, 9220. [Google Scholar] [CrossRef]
  63. Yu, J.; Shacket, R.W. Drinking-driving and riding with drunk drivers among young adults: An analysis of reciprocal effects. J. Stud. Alcohol 1999, 60, 615–621. [Google Scholar] [CrossRef] [PubMed]
  64. Hezaveh, A.M.; Cherry, C.R. Walking under the influence of the alcohol: A case study of pedestrian crashes in Tennessee. Accid. Anal. Prev. 2018, 121, 64–70. [Google Scholar] [CrossRef]
  65. Billah, K.; Adegbite, Q.; Sharif, H.O.; Dessouky, S.; Simcic, L. Analysis of Intersection Traffic Safety in the City of San Antonio, 2013–2017. Sustainability 2021, 13, 5296. [Google Scholar] [CrossRef]
  66. Billah, K.; Sharif, H.O.; Dessouky, S. How Gender Affects Motor Vehicle Crashes: A Case Study from San Antonio, Texas. Sustainability 2022, 14, 7023. [Google Scholar] [CrossRef]
  67. The Dangers of Intersections for Motorcyclists. Available online: https://www.callahan-law.com/the-dangers-of-intersections-for-motorcyclists/ (accessed on 28 December 2022).
  68. Vargas, F.D. 5 Reasons Motorcycle Accidents Are More Common at Intersections than Other Places. Law Offices of Fernando D. Vargas. Available online: https://www.vargaslawoffice.com/5-reasons-motorcycle-accidents-are-more-common-at-intersections-than-other-places/ (accessed on 28 December 2022).
  69. Scopatz, R.A.; DeFisher, J.; Lyon, C.; United States Federal Highway Administration Office of Safety. Emerging Practices for Addressing Motorcycle Crashes at Intersections (FHWA-SA-18-045). 2018. Available online: https://rosap.ntl.bts.gov/view/dot/49589 (accessed on 29 June 2022).
  70. Federal Highway Administration. Pavement Friction Management—Safety. Available online: https://safety.fhwa.dot.gov/provencountermeasures/pavement-friction.cfm (accessed on 29 June 2022).
  71. City of San Antonio Public Works Department. San Antonio Severe Pedestrian Injury Areas Report 2014–2018; City of San Antonio Public Works Department: San Antonio, TX, USA, 2020. [Google Scholar]
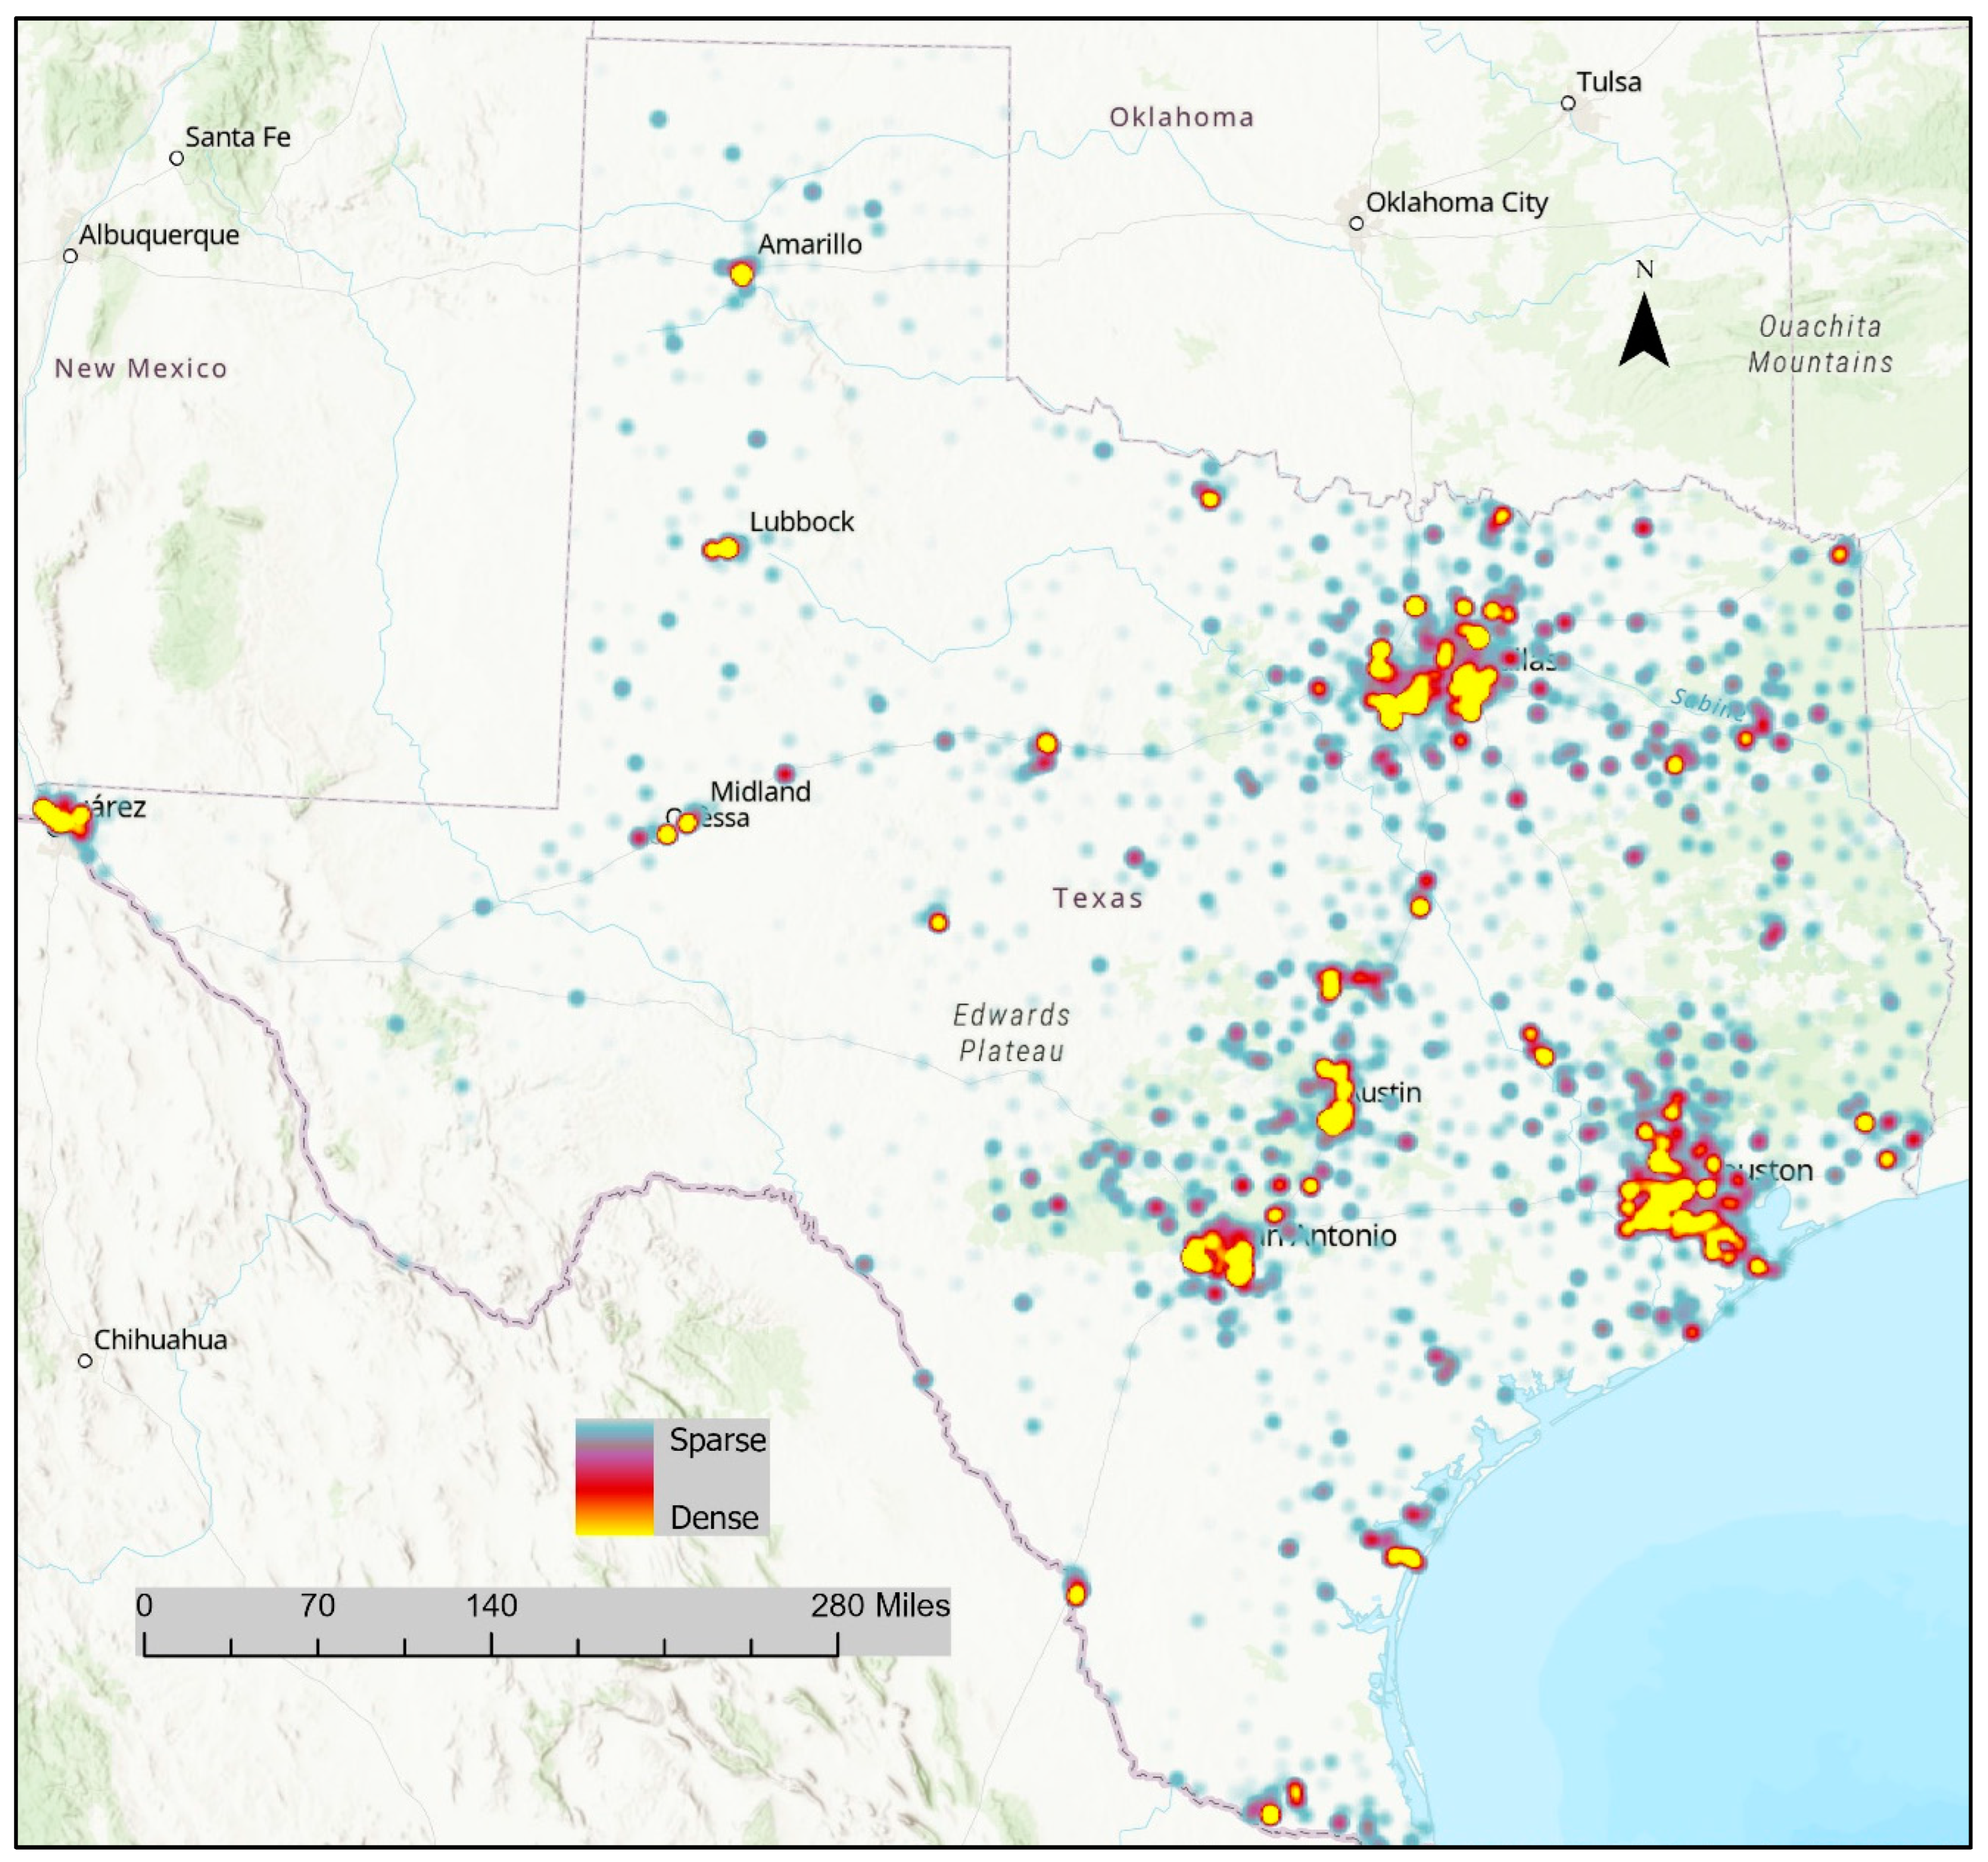
Figure 1. Heat map of motorcycle crashes in Texas.
Sustainability 15 10377 g001
Figure 2. Locations with frequent motorcycle crashes: Austin downtown area (top left), San Antonio downtown area (top right), Dallas downtown area (bottom left), and Fort Worth downtown area (bottom right).
Sustainability 15 10377 g002
Figure 3. Locations with frequent motorcycle crashes: Houston downtown area (top) and El Paso downtown area (bottom).
Sustainability 15 10377 g003
Figure 4. Hotspots of motorcycle crashes in Texas.
Sustainability 15 10377 g004
Figure 5. Locations with statistically significant clusters of motorcycle crashes near the intersections at State Highway 155 near the intersection of SH 155 and SH 49 in Tyler (top left), State Highway 146 near Seabrook (top right), around the intersection of Interstate 75 and Interstate 635 in Dallas (bottom left), and around the intersection of S Hampton Rd. and W Illinois Ave. in Dallas (bottom right).
Sustainability 15 10377 g005
Figure 6. Injury severity in motorcycle crashes by party at fault.
Sustainability 15 10377 g006
Figure 7. Motorcycle crashes and injuries as proportions of the total traffic crashes and injuries.
Sustainability 15 10377 g007
Table 1. Description of the study variables.
Num.DescriptionValuesNum.DescriptionValues
1Day of WeekWeekend9Intersection PresenceYes
WeekdayNo
2Speed limit≤25 mph10Road ClassHighway/Field to Market (FM) Road
>25 mphOther Roads
3Time of Day8 p.m.–6 a.m.11GenderMale
6 a.m.–8 p.m.Female
4Lighting Cond.Daylight12EthnicityHispanic
DarkNon-Hispanic
5Weather ConditionRain13Helmet StatusWorn
Clear/CloudyNot Worn
6Road AlignmentStraight/Curve (Level)14SeasonWinter
Straight/Curve (Grade/Hillcrest)Spring
7Traffic ControlDivider/Marked Lane15Summer
Crosswalk/Stop/Signal/NoneFall
8Surface ConditionWet Age≤18
Dry 19–64
≥65
Table 2. Proportions of motorcycle-related severe-injury (KA) and any-injury (KAB) crashes in Texas from 2017 to 2021 for environmental-, temporal-, and vehicle-related variables.
All MotorcyclistsMotorcyclist at FaultMotorcyclist not at Fault
Variablen = 41,434KA%KAB%n = 19,646KA%KAB%n = 21,788KA%KAB%
Lighting Condition: Daylight26,82725.960.612,60330.065.114,22422.356.6
Dark, not lighted472341.370.4246145.073.1226237.367.4
Dark, lighted852029.260.6398334.966.4453725.355.5
Weather Condition: Clear34,93728.661.716,42933.366.518,50824.557.5
Rain112219.351.657621.756.154616.746.9
Cloudy504429.764.2251034.067.9253425.460.6
Day of Week: Saturday813431.363.6398435.868.1415027.159.3
Sunday680131.964.7355737.369.4324425.959.5
Monday461326.359.7215430.465.0245922.755.1
Tuesday491325.959.9223930.063.6267422.556.7
Wednesday502726.559.2220231.063.7282523.055.7
Thursday540126.761.5255330.465.7284823.357.8
Friday654528.161.2295732.266.1358824.757.1
Time: 8 p.m. to 6 a.m.11,25734.565.0567839.770.0557929.160.0
All other hours30,17726.360.513,96830.364.916,20922.856.7
Season: Winter710827.157.9327132.263.1383722.953.3
Spring11,46128.361.9549333.166.8596823.957.5
Summer11,67529.363.8556033.768.6611525.459.4
Fall11,19028.761.8532232.865.7586825.058.2
Note: The total percentage for a variable might not reach 100% due to the unavailable information for some crashes.
Table 3. Proportions of motorcycle-related severe injury (KA) and any injury (KAB) crashes in Texas from 2017 to 2021 for different road characteristics.
All MotorcyclistsMotorcyclist at FaultMotorcyclist Not at Fault
Variablen = 41,434KA%KAB%n = 19,646KA%KAB%n = 21,788KA%KAB%
Road Class: Interstate531628.561.6283532.866.1248123.656.3
U.S./State Highway10,73431.265.1511933.767.8561528.962.7
FM Roads595237.069.7314440.773.0280832.966.0
City Streets14,70923.758.3615928.262.4855020.555.3
Non-trafficway125611.233.139423.658.18625.621.7
Surface Condition: Dry38,78029.062.118,33633.666.819,11025.558.7
Wet197021.755.6101424.958.789419.153.1
Road Alignment: Straight, Level29,68725.558.512,50828.561.916,08523.956.8
Straight, Grade/Hillcrest417632.867.6200935.671.1203230.865.3
Curve, Level464438.671.5326242.974.6131828.764.3
Curve, Grade/Hillcrest258240.173.9175744.777.677030.766.6
Traffic Control: None802223.956.9383829.663.9364719.652.2
Signal Light489923.154.3185924.757.5283922.552.8
Stop Sign391128.659.8124532.862.7255027.258.8
Warning/Yield Sign84734.766.553144.374.430018.353.7
Divider/Center Stripe356335.768.8184438.271.5166533.465.8
No Passing Zone147048.780.1101249.880.245646.580.0
Marked Lanes17,47428.964.0880032.767.1828925.461.3
Speed Limit: 25 mph or less117815.942.849023.958.868810.231.4
Over 25 mph38,08729.563.018,41133.666.919,67625.659.3
At Intersection: Yes11,47028.559.9415031.762.8732026.758.3
       No29,96428.562.415,49633.467.414,46823.357.1
Note: The total percentage for a variable might not reach 100% due to the unavailable information of some crashes.
Table 4. Proportions of motorcycle-related severe-injury (KA) and any-injury (KAB) crashes in Texas from 2017 to 2021 for human-related variables.
All MotorcyclistsMotorcyclist at FaultMotorcyclist not at Fault
n = 68,408KA%KAB%n = 29,756KA%KAB%n = 38,652KA%KAB%
Gender: Male52,73221.046.123,90225.452.028,83017.341.3
Female12,3455.214.549257.017.874204.012.3
Age: 18 or less242211.131.1104316.342.613797.322.4
19 to 6457,33318.741.625,72322.947.231,61015.237.1
65 or older471614.930.4179018.838.3292612.525.6
Ethnicity: White36,70621.145.816,80925.451.319,89717.641.2
Hispanic15,90614.032.9663918.939.5926710.528.3
Black931314.534.6407217.640.0524112.130.3
Asian138110.125.958213.833.07997.520.7
Other116113.732.349917.236.766211.029.0
Helmet Status: Yes23,04025.459.910,86328.363.012,17722.757.3
Note: The total percentage for a variable might not reach 100% due to the unavailable information of some crashes.
Table 5. Chi-square test results and OR for KA and KAB injury risks (all motorcyclists).
KAKAB
FactordfChi-Square StatisticORChi-Square StatisticOR
Lighting Condition: Daylight1288.7 ***0.6872.2 ***0.82
Dark 1.00 1.00
Weather Condition: Rain147.9 ***0.5950.3 ***0.65
Clear/Cloudy 1.00 1.00
Road Class: Highway/FM Road129.3 ***1.0028.9 ***1.00
Other Roads 0.89 0.89
Speed Limit: ≤25 mph161.2 ***1.0084.4 ***1.00
>25 mph 1.89 1.79
Day of Week: Weekend1111.0 ***1.2763.9 ***1.19
Weekday 1.00 1.00
Intersection Presence: Yes11.00.9841.8 ***0.86
No 1.00 1.00
Season: Winter310.3 *0.9366.1 ***0.85
Spring 0.98 1.01
Summer 1.03 1.10
Fall 1.00 1.00
Time of Day: 8 p.m.–6 a.m.1304.6 ***1.00111.1 ***1.00
All other hours 0.66 0.78
Alignment: Straight/Curve (Level)1188.0 ***0.68220.5 ***0.65
Straight/Curve (Grade/Hillcrest) 1.00 1.00
Surface Condition: Wet145.7 ***0.6929.9 ***0.77
Dry 1.00 1.00
Traffic Control: Divider/Marked Lane1111.1 ***1.00204.5 ***1.00
Crosswalk/Stop/Signal/None 0.78 0.74
Gender: Male1100.7 ***1.26151.5 ***1.28
Female 1.00 1.00
Age: ≤18217.5 ***1.003.81.00
19–64 1.13 1.08
≥65 1.25 1.10
Ethnicity: Non-Hispanic141.5 ***1.1481.6 ***1.18
Hispanic 1.00 1.00
Helmet Status: Worn1292.6 ***0.68185.1 ***0.74
Not Worn 1.00 1.00
Note: *** means p < 0.001; * means p < 0.05.
Table 6. Chi-square test results and OR for KA and KAB injury risks (motorcyclist at fault).
KAKAB
FactordfChi-Square StatisticORChi-Square StatisticOR
Lighting Condition: Daylight1168.5 ***0.6647.2 ***0.79
Dark 1.00 1.00
Weather Condition: Rain134.5 ***0.5529.6 ***0.63
Clear/Cloudy 1.00 1.00
Road Class: Highway/FM Road10.21.006.4 *1.00
Other Roads 0.99 0.96
Speed Limit: ≤25 mph115.8 ***1.007.3 **1.00
>25 mph 1.54 1.30
Day of Week: Weekend167.6 ***1.2932.8 ***1.20
Weekday 1.00 1.00
Intersection Presence: Yes15.1 *0.9235.5 ***0.80
No 1.00 1.00
Season: Winter32.50.9830.6 ***0.90
Spring 1.01 1.05
Summer 1.05 1.15
Fall 1.00 1.00
Time of Day: 8 p.m.–6 a.m.1183.7 ***1.0069.8 ***1.00
All other hours 0.64 0.75
Alignment: Straight/Curve (Level)140.8 ***0.81128.2 ***0.63
Straight/Curve (Grade/Hillcrest) 1.00 1.00
Surface Condition: Wet131.7 ***0.6626.4 ***0.71
Dry 1.00 1.00
Traffic Control: Divider/Marked Lane131.9 ***1.0057.5 ***1.00
Crosswalk/Stop/Signal/None 0.50 0.78
Gender: Male175.5 ***1.35133.0 ***1.45
Female 1.00 1.00
Age: ≤18212.3 **1.005.7 .1.00
19–64 1.27 1.17
≥65 1.31 1.19
Ethnicity: Non-Hispanic15.8 *1.121.7 ***1.15
Hispanic 1.00 1.00
Helmet Status: Worn1209.5 ***0.64132.1 ***0.69
Not Worn 1.00 1.00
Note: *** means p < 0.001; ** means p < 0.01; * means p < 0.05; “.” means p < 0.1.
Table 7. Chi-square test results and OR for KA and KAB injury risks (motorcyclist not at fault).
KAKAB
VariabledfChi-Square StatisticORChi-Square StatisticOR
Lighting Condition: Daylight1113.7 ***0.7027.0 ***0.85
Dark 1.00 1.00
Weather Condition: Rain117.3 ***0.6224.6 ***0.65
Clear/Cloudy 1.00 1.00
Road Class: Highway/FM Road142.7 ***1.0029.6 ***1.00
Other Roads 0.81 0.85
Speed Limit: ≤25 mph147.8 ***1.0093.6 ***1.00
>25 mph 2.39 2.31
Day of Week: Weekend129.0 ***1.2020.2 ***1.14
Weekday 1.00 1.00
Intersection Presence: Yes119.2 ***1.160.10.99
No 1.00 1.00
Season: Winter39.1 *0.8935.8 ***0.83
Spring 0.95 0.98
Summer 1.02 1.06
Fall 1.00 1.00
Time of Day: 8 p.m.–6 a.m.1101.7 ***1.0033.2 ***1.00
All other hours 0.70 0.83
Alignment: Straight/Curve (Level)157.3 ***0.7264.5 ***0.72
Straight/Curve (Grade/Hillcrest) 1.00 1.00
Surface Condition: Wet119.8 ***0.699.5 **0.81
Dry 1.00 1.00
Traffic Control: Divider/Marked Lane143.5 ***1.00113.8 ***1.00
Crosswalk/Stop/Signal/None 0.80 0.73
Gender: Male120.5 ***1.1530.0 ***1.16
Female 1.00 1.00
Age: ≤18223.9 ***1.001.61.00
19–64 1.00 1.02
≥65 1.23 1.07
Ethnicity: Non-Hispanic142.7 ***1.2050.6 ***1.19
Hispanic 1.00 1.00
Helmet Status: Worn173.3 ***0.7649.2 ***0.81
Not Worn 1.00 1.00
Note: *** means p < 0.001; ** means p < 0.01; * means p < 0.05.
Table 8. Logistic regression model results for severe motorcyclist injury (KA).
All MotorcyclistsMotorcyclist at FaultMotorcyclist not at Fault
VariableReferenceEstimatesStd ErrorOREstimatesStd ErrorOREstimatesStd ErrorOR
intercept 1 −0.70 ***0.11 −0.39 **0.14 −1.14 ***0.16
Stop/Signal/
Crosswalk/None
Divider/
Marked Lane
−0.24 ***0.030.79−0.23 ***0.040.80−0.24 ***0.040.79
DaylightDark−0.23 ***0.050.80−0.23 ***0.070.79−0.25 ***0.060.78
RainNo−Rain−0.34 **0.120.71−0.36 *0.160.700.300.190.74
Other RoadsHighway−0.08 **0.030.93−0.0030.041.00−0.15 ***0.040.86
WeekendWeekday0.20 ***0.031.220.19 ***0.041.210.18 ***0.041.20
Speed Limit > 25Speed Limit ≤ 250.45 ***0.091.560.32 *0.131.380.59 ***0.141.80
LevelGrade/Hillcrest−0.33 ***0.030.72−0.32 ***0.040.72−0.27 ***0.050.76
WetDry−0.22 *0.090.80−0.28 *0.120.76−0.210.140.81
6 a.m.−8 p.m.8 p.m.−6 a.m.−0.26 ***0.050.77−0.32 ***0.070.73−0.14 *0.070.87
SpringFall 0.01 0.031.010.0040.051.00−0.010.051.01
SummerFall 0.030.031.040.0040.051.000.070.051.08
WinterFall−0.03 0.040.970.0010.051.00−0.07 0.060.93
Intersection_YesIntersection_No0.17 ***0.031.180.070.051.070.33 ***0.041.39
intercept 2 −1.17 ***0.09 −1.05 ***0.12 −1.37 ***0.14
MaleFemale0.18 ***0.051.200.24 ***0.071.270.13 .0.071.14
Age 19–64Age ≤ 180.25 ***0.071.280.38 ***0.091.460.170.121.19
Age ≥ 65Age ≤ 180.43 ***0.091.540.45 ***0.111.580.48 ***0.131.61
Non−HispanicHispanic0.18 ***0.031.200.10 *0.041.110.25 ***0.041.29
Helmet WornHelmet Not Worn−0.39 ***0.020.68−0.45 ***0.030.64−0.29 ***0.030.75
Note: *** means p < 0.001; ** means p < 0.01; * means p < 0.05; “.” means p < 0.1.
Table 9. Logistic regression Model results for any type of motorcyclist injury (KAB).
All MotorcyclistsMotorcyclist at FaultMotorcyclist not at Fault
VariableReferenceEstimatesStd ErrorOREstimatesStd ErrorOREstimatesStd ErrorOR
intercept 1 0.73 ***0.09 1.20 **0.13 0.25 *0.12
Stop/Signal/
Crosswalk/None
Divider/
Marked Lane
−0.26 ***0.030.77−0.22 ***0.040.81−0.28 ***0.030.75
DaylightDark−0.050.040.95−0.070.070.93−0.050.060.95
RainNo−Rain−0.41 ***0.100.66−0.31 *0.150.73−0.50 ***0.150.60
Other RoadsHighway−0.07 **0.020.94−0.040.040.97−0.09 **0.030.91
WeekendWeekday0.14 ***0.021.150.15 ***0.041.160.12 ***0.031.13
Speed Limit > 25Speed Limit ≤ 250.44 ***0.071.550.170.111.190.66 ***0.101.94
LevelGrade/Hillcrest−0.38 ***0.030.69−0.41 ***0.050.66−0.30 ***0.050.74
WetDry−0.0010.081.00−0.130.110.880.090.121.10
6 a.m.−8 p.m.8 p.m.−6 a.m.−0.22 ***0.050.81−0.30 ***0.070.74−0.10 .0.060.90
SpringFall0.0040.031.000.020.051.02−0.010.040.99
SummerFall0.08 *0.031.080.12 *0.051.130.050.041.05
WinterFall−0.14 ***0.040.87−0.11 *0.050.90−0.18 ***0.050.84
Intersection_YesIntersection_No0.03 *0.031.03−0.050.040.950.13 ***0.041.14
intercept 2 0.62 ***0.08 0.63 ***0.11 0.58 ***0.12
MaleFemale−0.020.050.990.090.071.09−0.100.070.91
Age 19–64Age ≤ 180.080.071.090.23 **0.091.26−0.020.100.98
Age ≥ 65Age ≤ 180.18 *0.081.200.33 **0.111.390.100.121.10
Non−HispanicHispanic0.18 ***0.031.200.17 ***0.041.180.18 ***0.041.20
Helmet WornHelmet Not Worn−0.31 ***0.020.73−0.39 ***0.030.68−0.23 ***0.030.79
Note: *** means p < 0.001; ** means p < 0.01; * means p < 0.05; “.” means p < 0.1.
Disclaimer/Publisher’s Note: The statements, opinions and data contained in all publications are solely those of the individual author(s) and contributor(s) and not of MDPI and/or the editor(s). MDPI and/or the editor(s) disclaim responsibility for any injury to people or property resulting from any ideas, methods, instructions or products referred to in the content.