Article

Organic and Slow-Release Fertilizer Substitution Strategies Improved the Sustainability of Pineapple Production Systems in the Tropics

1
Hainan Key Laboratory for Sustainable Utilization of Tropical Bioresource, College of Tropical Crops, Hainan University, Haikou 570228, China
2
College of Resources and Environment, Southwest University, Chongqing 400716, China
3
Hainan Tian-Di-Ren Ecological Agriculture Incorporated Company, Haikou 570228, China
*
Author to whom correspondence should be addressed.
Sustainability 2023, 15(13), 10353; https://doi.org/10.3390/su151310353
Submission received: 10 April 2023 / Revised: 14 May 2023 / Accepted: 28 June 2023 / Published: 30 June 2023

Abstract

:
The partial substitution of chemical nitrogen fertilizers with organic fertilizer and slow-release fertilizer could improve pineapple yield and nitrogen use efficiency (NUE) and decrease greenhouse gas (GHG) emissions. However, the effect of organic and slow-release fertilizer substitution strategies on the carbon footprint (CF), nitrogen footprint (NF) and net ecosystem economic benefits (NEEB) from pineapple fields in the tropics remains largely unclear. Therefore, we conducted a long-term pineapple field trial (2017–2021) for the first time with five fertilization strategies (CK: no fertilizer; F: conventional fertilization(nitrogen (N) 817 kg ha−1, phosphorus pentoxide (P2O5) 336 kg ha−1, potassium oxide (K2O) 945 kg ha−1); RF: reduction of 41.7% N, 72.0% P2O5 and 33.1% K2O on an F basis; RFO: replacement of 20% N input with organic fertilizer on an RF basis; RFOS: replacement of 15% N input with slow-release fertilizer on an RFO basis) to identify the pineapple fruit yield, NUE, CF, NF and NEEB in the tropics. The results showed that in comparison to the F treatment, the RF, RFO and RFOS treatments improved pineapple yield (7.6%, 12.4% and 26.3%, respectively), NUE (66.4%, 75.5% and 87.7%, respectively, p < 0.05) and partial factor productivity of nitrogen (PFPN) fertilizer (84.8%, 92.8% and 116.7%, respectively, p < 0.05). Additionally, of all the treatments, the RFOS treatment had the highest yield (87.8 t ha−1). N leaching (50.1–69.1%) and ammonia volatilization (21.6–26.2%) were the two primary routes for reactive nitrogen (Nr) loss. The field soils (36.8–45.7%) and N fertilizer production and transportation (21.2–29.5%) dominated the GHG emissions. Compared to the F treatment, the RF, RFO and RFOS treatments showed decreases in Nr losses, NF, GHG emissions and CF of 36.6–41.1%, 43.3–51.9%, 19.0–29.1% and 24.5–41.7%, respectively. Of all the treatments, the RFOS treatment had the lowest CF (191.8 kg CO2eq ha−1 season) and NF (1.9 kg N t−1 season). Additionally, the NEEB of the RF, RFO and RFOS treatments improved by 13.0–39.9% over that of the F treatment. The RFOS treatment (54,880 USD ha−1) resulted in the highest NEEB of all treatments. Therefore, the substitution of conventional inorganic fertilizers with organic and slow-release fertilizers is an effective method for achieving sustainable pineapple production. However, a process for further reducing GHG emissions from farmland soils and Nr losses from organic fertilizer addition still need attention in terms of pineapple production.

1. Introduction

Pineapple (Ananas comosus) is a widely cultivated and popular fruit in tropical regions due to its unique flavour and nutritional value. However, in tropical pineapple production areas, high temperatures and rain, as well as prolonged leaching and high soil nitrification rates, cause significant losses of soil nutrients and greenhouse gas (GHG) emissions [1,2].
To achieve the full yield potential and improve the economic efficiency of pineapple under high temperatures and humid conditions, inorganic nitrogen (N) fertilizer has been overused and has reduced the fertilizer use efficiency and polluted the environment [3,4,5]. China is one of the top ten producers of pineapple, with 99,626 ha planted, and China accounts for 9.5% of the world’s total pineapple production [6]. The use of inorganic N fertilizer in pineapple production in China is as high as 963 kg ha−1, while pineapple yield and nitrogen use efficiency (NUE) is only 58.5 t ha−1 and 10.5%, respectively [7,8]; in addition, a large number of nutrients are not effectively used but instead result in GHG emissions, soil acidification and water eutrophication [9,10,11]. Nevertheless, the environmental costs of pineapple production in the tropics are unclear. Therefore, it is urgent to complete environmental sustainability assessments and explore sustainable nutrient management practices for pineapple production in the tropics to improve pineapple yield and nutrient utilization efficiency and minimize the risk of climate change and environmental deterioration [3,12].
Optimized fertilization strategies are widely used to increase crop yield and NUE while reducing GHG emissions and the risk of environmental changes in crop production [13,14,15]. Previous studies have shown that a 30% reduction in N inputs during the nutritional growth period of a crop can lead to increased crop yield and improved NUE [16]. In pineapple production, reducing N by 50%, phosphorus by 80% and potassium by 25% based on farmers’ conventional fertilizer applications increased pineapple yield by 10.9% and NUE by 103.5% and significantly increased the commercial fruit rate [17]. Currently, organic fertilizers and slow-release fertilizers are also gaining attention. The use of organic fertilizers alone regulates the carbon (C) to N ratio in the soil, enhances the N fixation capacity of the soil, and reduces the loss of N in the field [18,19,20]. Additionally, slow-release fertilizer can minimize nutrient losses and improve fertilizer utilization due to the regulated release of nutrients to meet the needs of crop growth [21]. However, some studies have shown that it is difficult for a single organic fertilizer to meet the needs of growing crops because of its slow nutrient release rate [22], and liquid anaerobic digestate fertilizers, such as fast-release organic fertilizers, only meet crop demand in the short term [23,24]. Additionally, many slow-release fertilizers are not consistent with crop requirements [25]. Therefore, the combined use of chemical fertilizer, organic fertilizer and slow-release fertilizer may be a more desirable option [2,26]. The use of organic fertilizers mixed with inorganic fertilizers can significantly increase vegetable and wheat yields and NUE while reducing ammonia (NH3) volatilization, N leaching and N2O emissions in the field [20,22]. In addition, the partial substitution of conventional chemical fertilizers with organic fertilizer and slow-release fertilizer can also significantly improve pineapple yield and fertilizer use efficiency and decrease soil GHG emissions [2,27,28]. However, the environmental sustainability of different fertilization patterns in pineapple production is also unknown, which severely limits the application and diffusion of optimal fertilization patterns in the context of global climate change.
Recently, life cycle assessment (LCA) approaches have been widely used to quantify and assess the environmental risks of agroecosystems, including assessing the nitrogen footprint (NF) and carbon footprint (CF) of crop production systems [5,29,30]. In agricultural production, NF represents the total reactive nitrogen (Nr) loss due to crop production and is used to assess the risk of environmental degradation of crop production systems [31]. CF is the total direct and indirect GHG emissions from crop production systems and is used for climate change risk assessment [32]. Simultaneously, CF and NF can be directly used to assess the influence of crop production systems on environmental changes [29,33]. Fertilizer production and application in the tropics account for 77% of the total GHG emissions [1]. Thus, LCA is significantly affected by fertilization management patterns. A 30% reduction in N inputs in double-season rice production was shown to reduce GHG emissions from annual field production by 18.7% [15]. Meena et al. [34] found that replacing 25% of N inputs with organic fertilizer increased yields by 15.4% and reduced CF by 15.2%. Combining the application of conventional N fertilizer and controlled-release N fertilizer in wheat production not only increased wheat yield but also reduced NF and CF in the wheat production system and resulted in high ecosystem economic benefits [5]. In addition, LCAs varied significantly in different climatic regions due to environmental impacts [1]. However, current LCA studies on fertilization have mostly focused on cereal and vegetable crops in temperate zones, and there have been no reports on pineapple fertilization in the tropics.
Net ecosystem economic benefits (NEEB) are integrated economic benefits (EB) based on product benefits, agricultural input and environmental damage costs (EDC) and provide a theoretical basis for policy formulation and farmer benefits [35,36]. An EB is a direct factor in farming choosing management strategies. The EDC is the cost of assessing Nr losses and GHG emissions from climate change, water eutrophication and soil acidification [37]. However, to achieve sustainable agricultural development, EB cannot be pursued at the expense of EDC. Currently, some crop fertilization management studies have been conducted to assess EDC and NEEB in crop production systems [38,39]. The combined application of organic and chemical fertilizers showed higher EDC and agricultural input costs (AIC) values but improved NEEB due to significantly higher yields [40]. Replacing 50% of regular N fertilizer application with slow-release N fertilizer increased rice yield and AIC but significantly decreased NEEB [26]. Nevertheless, few research studies have comprehensively assessed the NEEB of pineapple with a long growth period and high input or the fertilization management of pineapple.
Therefore, we hypothesized that organic and slow-release fertilizer substitution would increase pineapple yield and NUE and improve the sustainability of pineapple production systems. A four-year field experiment was conducted in tropical China to measure the effects of different optimized fertilization patterns on pineapple yield, NUE, CF, NF and NEEB. The objectives of this study were to (1) compare crop productivity (pineapple yield, NUE and PFPN) for different fertilization patterns; (2) determine CF and NF for different fertilization patterns; and (3) evaluate the best nutrient management strategies for pineapple production in the tropics to increase NEEB. The results of this study will help identify optimal fertilization strategies for pineapple production in the tropics to achieve clean and sustainable development of the pineapple industry.

2. Materials and Methods

2.1. Site Description

The two-season pineapple field study was established at the Hainan University Ledong Experimental Station (18°39′6″ N, 108°46′22″ E), Ledong County, Hainan Province, China (Figure 1). The experimental site has a typical tropical monsoon climate with a year divided into dry and wet seasons. The average annual precipitation is 1279.1 mm, mainly concentrated in the wet season from April to November, and the average annual temperature is 24–25 °C [2]. The pineapple was planted on 1 December 2017 and 8 December 2019 and harvested on 1 April 2019 and 14 April 2021. The total rainfall for the first and second seasons was 1638.8 mm and 1684.6 mm, respectively, with average daily temperatures of 24.6 °C and 25.3 °C (Figure 1). The soil classification of the study site is Lixisols (FAO classification). The soil characteristics for 0–20 cm were as follows: bulk density 1.66 g cm−3; pH 6.05; soil organic matter 5.60 g kg−1; ammonium N 0.34 mg kg−1; nitrate N 0.76 mg kg−1; available phosphorus 89.17 mg kg−1 and available potassium 92.84 mg kg−1.

2.2. Experimental Design and Data Collection

The field experiment used a randomized block group design with five fertilizer treatments: (1) CK: no fertilization; (2) F: conventional fertilization; (3) RF: reduced fertilization (reduction of 41.7% N, 72.0% phosphorus pentoxide (P2O5) and 33.1% potassium oxide (K2O) on the basis of F); (4) RFO: reduced fertilization + organic fertilizer (replacement of 20% N input with organic fertilizer on an RF basis); and (5) RFOS: reduced fertilization + organic fertilizer + slow-release fertilizer (replacement of 15% N input with slow-release fertilizer on an RFO basis). The fertilization dose was set according to the previous study results of our group [2]. A total of 36% of the total fertilizer application was used as a base fertilizer, and it was uniformly spread and ploughed into the soil at a depth of 0–20 cm. Another 64% of the fertilizer was used as topdressing, and the specific timing and frequency of the topdressing are shown in Table 1. Urea (46% N) and slow-release fertilizer (resin-coated urea, 44% N, and a 6-month slow-release period) were used as inorganic N fertilizers. The organic N fertilizer was sheep manure (N 0.8%; P2O5 0.6%; K2O 0.5%; organic matter, 24%). Slow-release and organic fertilizers were used only as base fertilizers (Table 1). Calcium superphosphate (17% P2O5) and potassium chloride (60% K2O) were used as phosphate and potassium fertilizers in basal and topdressing fertilizers, respectively.
The previous crop of the experimental field was banana. All treatments used the common local pineapple cultivar Tainong 17. The experiment was set up with three replications and a total of 15 plots (15 m long and 6.5 m wide). The spacing between adjacent plots was 1 m to prevent nutrient flow disturbance. Pineapples were cultivated in ridge furrows, and the widths of the furrows and ridges were 0.3 m and 0.9 m, respectively. Pineapples were planted on both sides of the ridge at a spacing of 0.5 m and 0.35 m between rows and plants, respectively. The planting density of pineapple was 33,600 plants ha−1. Weeding and other management practices were based on local agronomic practices in pineapple fields, and postharvest crop residues were not returned to the field.
At pineapple maturity, all pineapples in every plot were harvested and weighed to determine the fresh pineapple yield. In each plot, five representative pineapple plants were selected and then separated into different parts (stems, leaves, fruits, fruit stalks and crown), dried at 105 °C for 30 min and then dried to constant weight at 80 °C to determine their dry weight. Samples of each fraction were ground and passed through a sieve (0.25 mm) and digested with H2SO4 and H2O2, and the N concentration of each fraction was determined by the Kjeldahl procedure to calculate the N uptake of the crop [41]. NUE and PFPN were calculated by Zhang et al. [5] and Liang et al. [42] as follows:
N U E = U N U 0 N i n p u t × 100
P F P N = Y N i n p u t
where UN (kg N ha−1) is the N uptake by the N application treatment; U0 (kg N ha−1) is the N uptake by the treatment without N application; Ninput (kg N ha−1) is the quantity of N input; and Y (kg ha−1) is the pineapple yield.
GHG emissions (N2O, CO2 and CH4) from the soil were monitored throughout the pineapple growing season using the static confinement chamber method [20]. The concentrations of N2O, CO2 and CH4 were measured using a Shimadzu GC-14 gas chromatograph (Japan). Gas sampling and measurements and the calculation of N2O, CO2 and CH4 accumulation emissions are described in detail in Liang et al. [2].

2.3. System Boundaries

In this study, the LCA method was used to assess NF and CF during pineapple production according to ISO standards [43,44] to provide a basis for the environmental improvement of agroecosystems [45]. The system boundary (Figure 2) includes the entire process of agricultural production and transportation, as well as field production. Nr losses and GHG emissions from pineapple production include the following: (1) production, transportation and storage of agricultural inputs (fertilizer, pesticides, mulch, paper bags); (2) irrigation electricity consumption; (3) diesel consumption from agricultural machinery operations (ploughing, starting); (4) the input of labour (planting seedlings, fertilizer application, weeding, harvesting); and (5) GHG emissions and Nr losses from soil. In addition, pineapples are harvested and sold as fresh fruit as a commodity. Therefore, fresh fruit yield (t) and planted area (ha) of pineapple were determined as functional units for this study.

2.4. Nr and NF

The Nr losses and NF of pineapple production in the tropics were quantified from the perspective of LCA, with the following equations involved [5,46]:
Nr   losses = i = 1 n C i × F iNr + N 2 O direct + NO 3 N + NH 3 N
NF = Nr   losses Y
where i is the material input used in agricultural production; Ci indicates the amount of applied agricultural raw material inputs (Table 2); FiNr is the Nr emission factor for agricultural input production and transportation (Table S1); N2Odirect is a direct cumulative N2O emission, which measured by a static chamber method; and NO3-N and NH3-N are the Nr losses as the forms of N leaching and NH3 volatilization, respectively. N leaching and NH3 volatilization were obtained by multiplying the application rates of the various N sources with the coefficients for each N loss pathway (Table S2).

2.5. GHG and CF

The LCA methodology was used to estimate GHG emissions and CF throughout the life cycle of pineapples. GHG emissions are similar to Nr losses and include the production and transportation of agricultural raw materials and the GHG emissions accumulated from the field soils. The following methods were used to determine the GHG emissions and CF of pineapple [2,30]:
GHG   emission = i = 1 n C i × F iGHG + E CO 2 + E CH 4 × 28 + E N 2 O × 265
CF = GHG   emission Y
where FiGHG is the GHG emission factor for the production and transportation of agricultural inputs (Table S1); ECO2, ECH4 and EN2O are field soil cumulative CO2 emissions, CH4 emissions and N2O emissions throughout the pineapple growth season, respectively; the data for ECO2, ECH4 and EN2O are showed in Liang et al. [2]. 28 and 265 are the global warming potential factors for CH4 and N2O over a 100-year period, respectively.

2.6. Economic Benefit

The economic analysis shows the EB and growing costs of the pineapple growing process. The cost of growing pineapples is based on the crop management practices for each treatment, such as ploughing, fertilizers, labour, chemical protection, mulch, paper bags, and harvesting. Total returns were determined by multiplying the pineapple yield of each plot by the local market purchase price. For ease of reading, all expenses and returns are converted to US dollars. According to previous studies, the EB is calculated by Equations (7) and (8) [47]:
NI   $   ha 1 = TR   $   ha 1 AIC   $   ha 1
B : C   ratio = TR   $   ha 1 AIC $   ha 1
where NI and the B:C ratio represent the net income and benefit-to-cost ratio, respectively; TR is the total return obtained by multiplying pineapple production by the purchase price. The local Tainong 17 pineapple purchase price was 0.38 USD kg−1 in April 2019 and 1.1 USD kg−1 in April 2021. AIC is the agricultural input cost. The detailed AIC in the field is shown in Table S3.

2.7. EDC and NEEB

EDC is the environmental damage cost of crop production, which includes: (1) the EDC of soil acidification and water eutrophication due to NH3 volatilization and N leaching from crop production [37] and (2) the environmental cost of climate warming due to GHG emissions. The EDC is calculated using the following formula [48]:
EDC = i = 1 n Nr i × P N + CO 2 i × P CO 2
where Nri is the amount of Nr lost; PN (0.67 USD kg Neq−1) is the EDC per unit of Nr loss [36]; CO2i is total GHG emissions; and PCO2 (42.9 USD t−1) is the EDC per unit of CO2 [36].
The NEEB of the pineapple production system was determined with the following equation [20]:
NEEB = TR AIC EDC  
where TR, AIC and EDC represent total pineapple production returns, agricultural input costs and environmental damage costs, respectively.

2.8. Statistical Analysis

Data were processed using Excel 2019 (Microsoft, Redmond, WA, USA). The normality of the data was tested before the analysis of variance (ANOVA), and the data conformed to the requirements. The ANOVA was performed with SPSS 26.0 (SPSS Inc., Chicago, IL, USA) to estimate yield, N uptake, NUE, PFPN, NF and CF between treatments. The least significant difference (LSD) test was used at the 5% probability level to determine significant differences between treatments. SigmaPlot 14.0 (Systat Software, San Jose, CA, USA) was used to prepare all figures.

3. Results

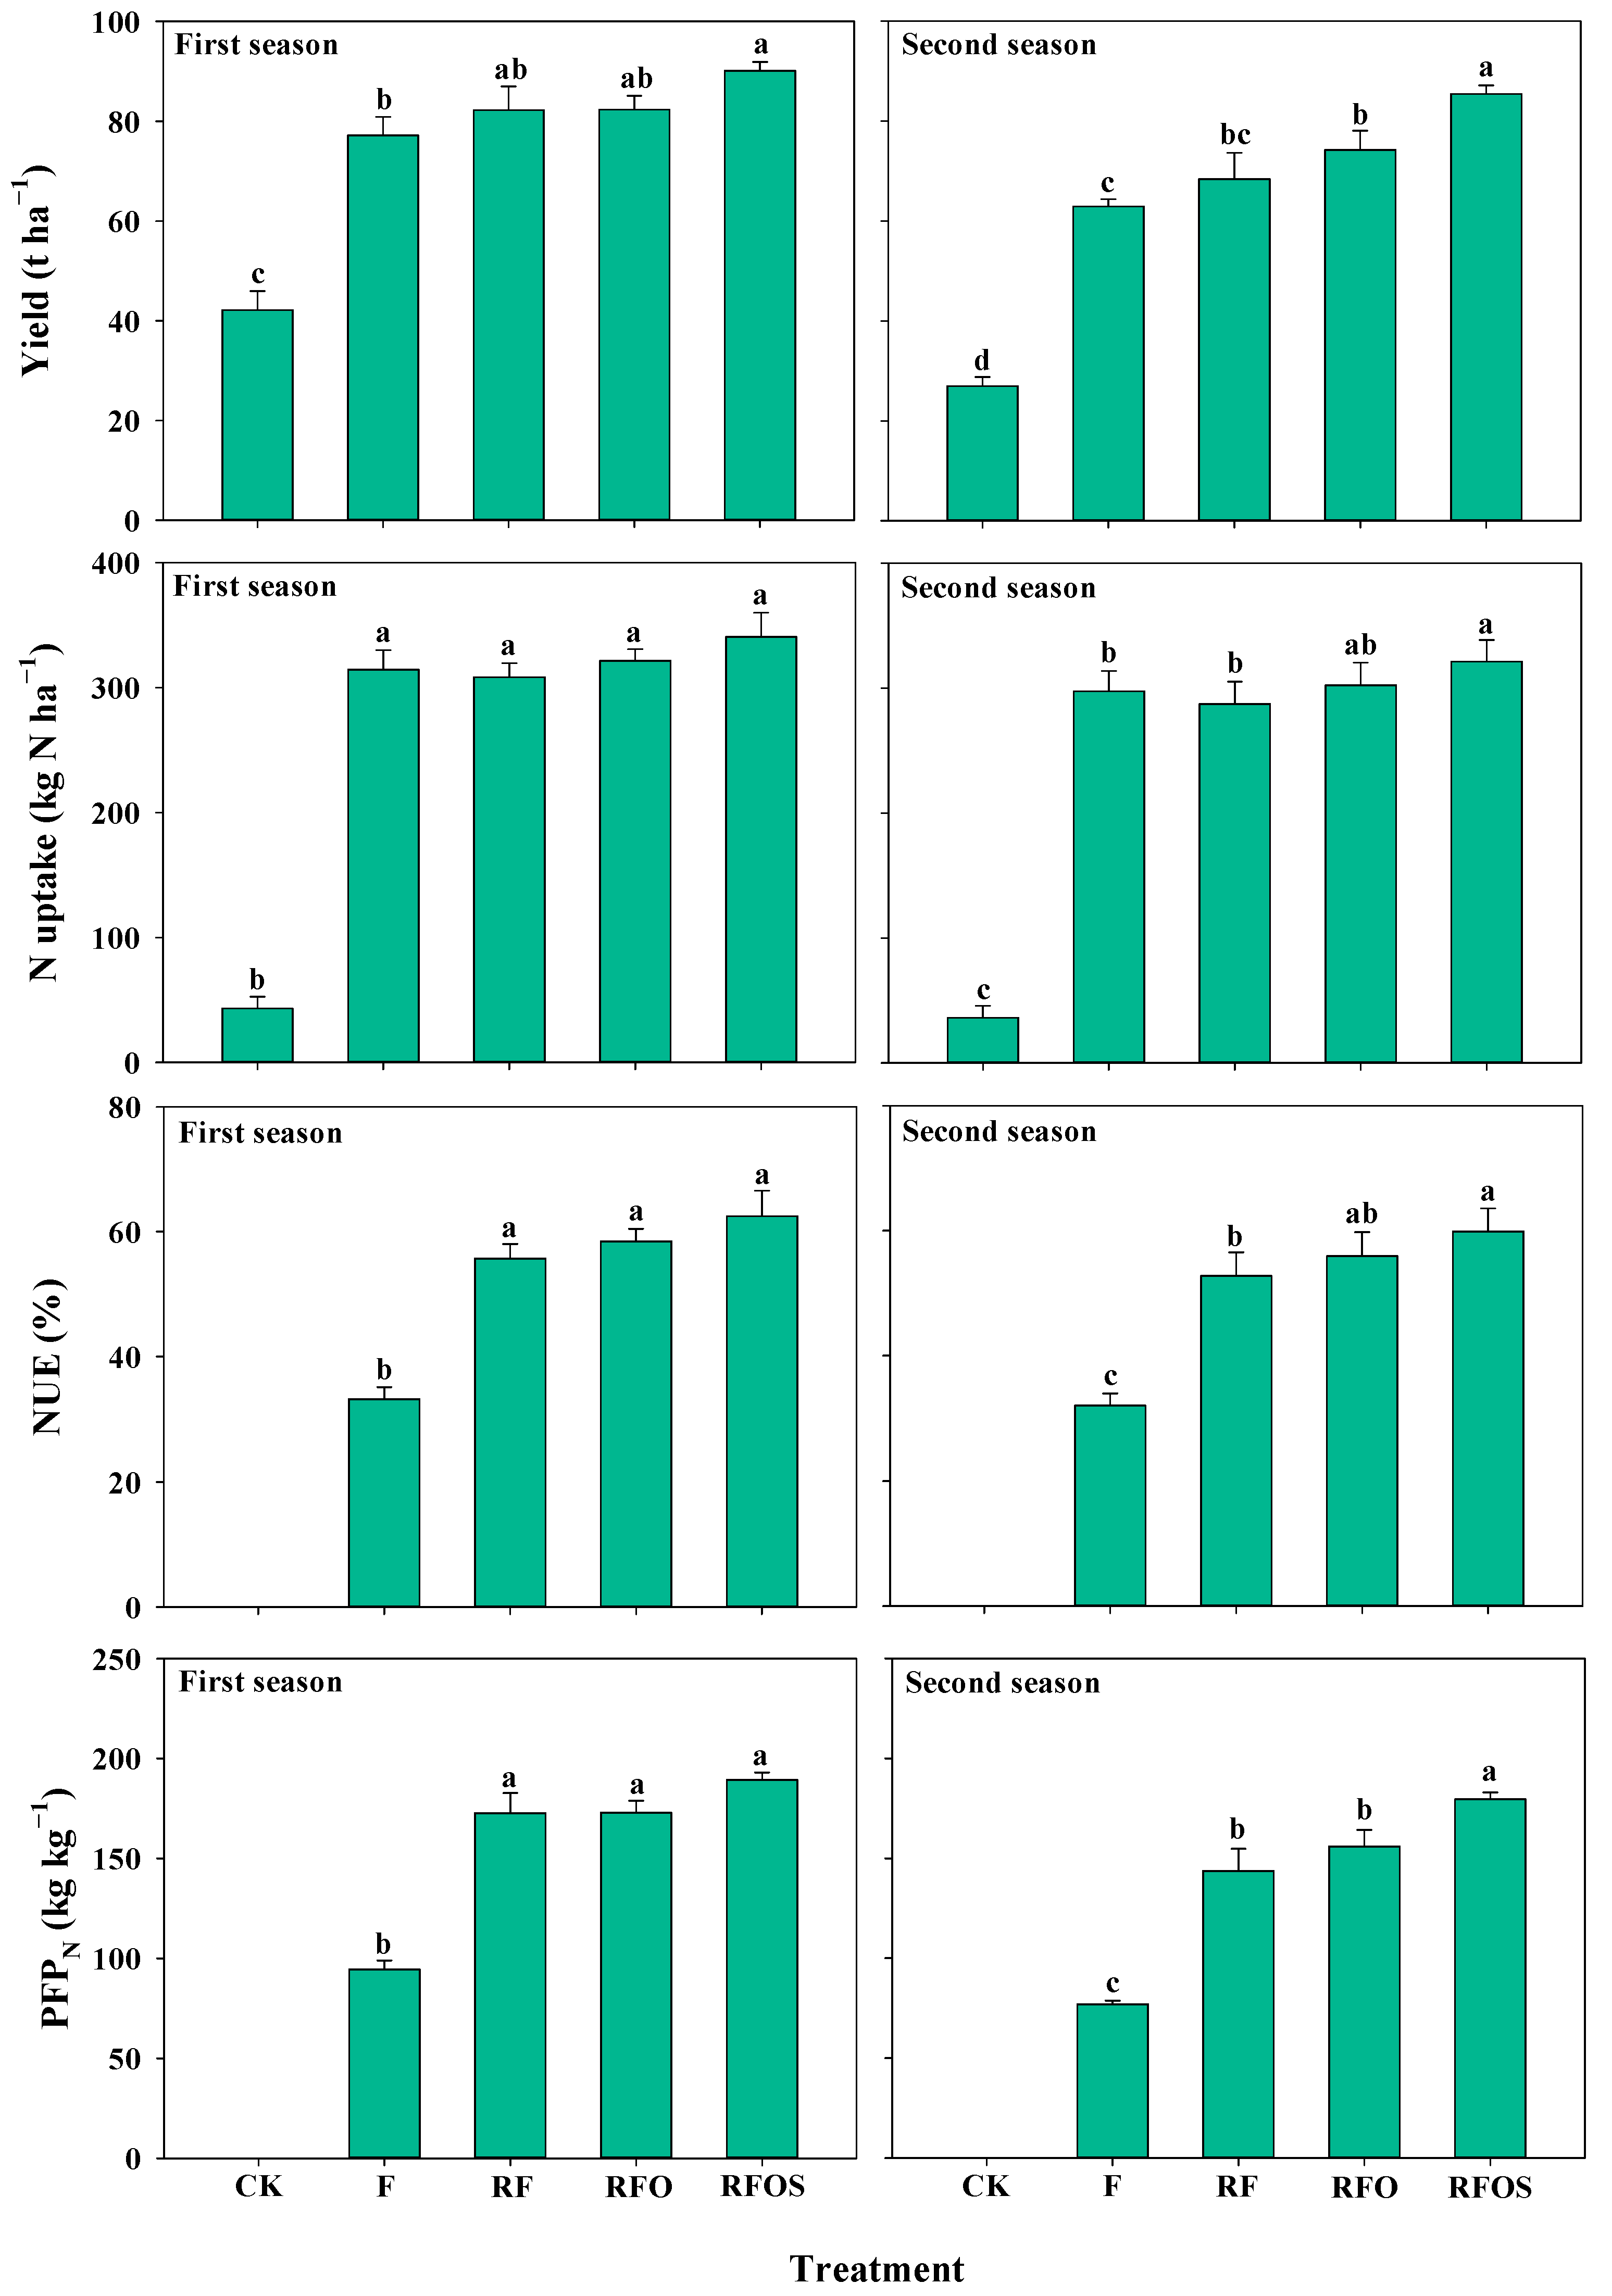
3.1. Pineapple Yield, N Uptake, NUE and PFPN

Pineapple yields and N uptake were significantly higher in the four fertilizer treatments than in the CK treatment in the two pineapple growing seasons (Figure 3, p < 0.05). There was no significant difference in pineapple yield between the RF treatment and FC treatment. The RFO treatment increased pineapple yield by 11.8% on average over two seasons compared to the F treatment, and the difference achieved significance in the second pineapple season (p < 0.05). Among all fertilization treatments, the RFOS treatment had the highest pineapple yield of 90.1 and 85.4 t ha−1 in the first and second seasons, respectively, which was significantly higher than that of the F treatment (p < 0.05). The N uptake of the RFO and RFOS treatments was higher than that of the F treatment in both seasons, but the difference was significant only between the RFOS and F treatments in the second season (p < 0.05). Similarly, NUE and PFPN were significantly improved under the RF, RFO and RFOS treatments compared to F treatment. The RFOS treatment had the highest NUE and PFPN, but its differences from the RF and RFO treatments were not always significant.

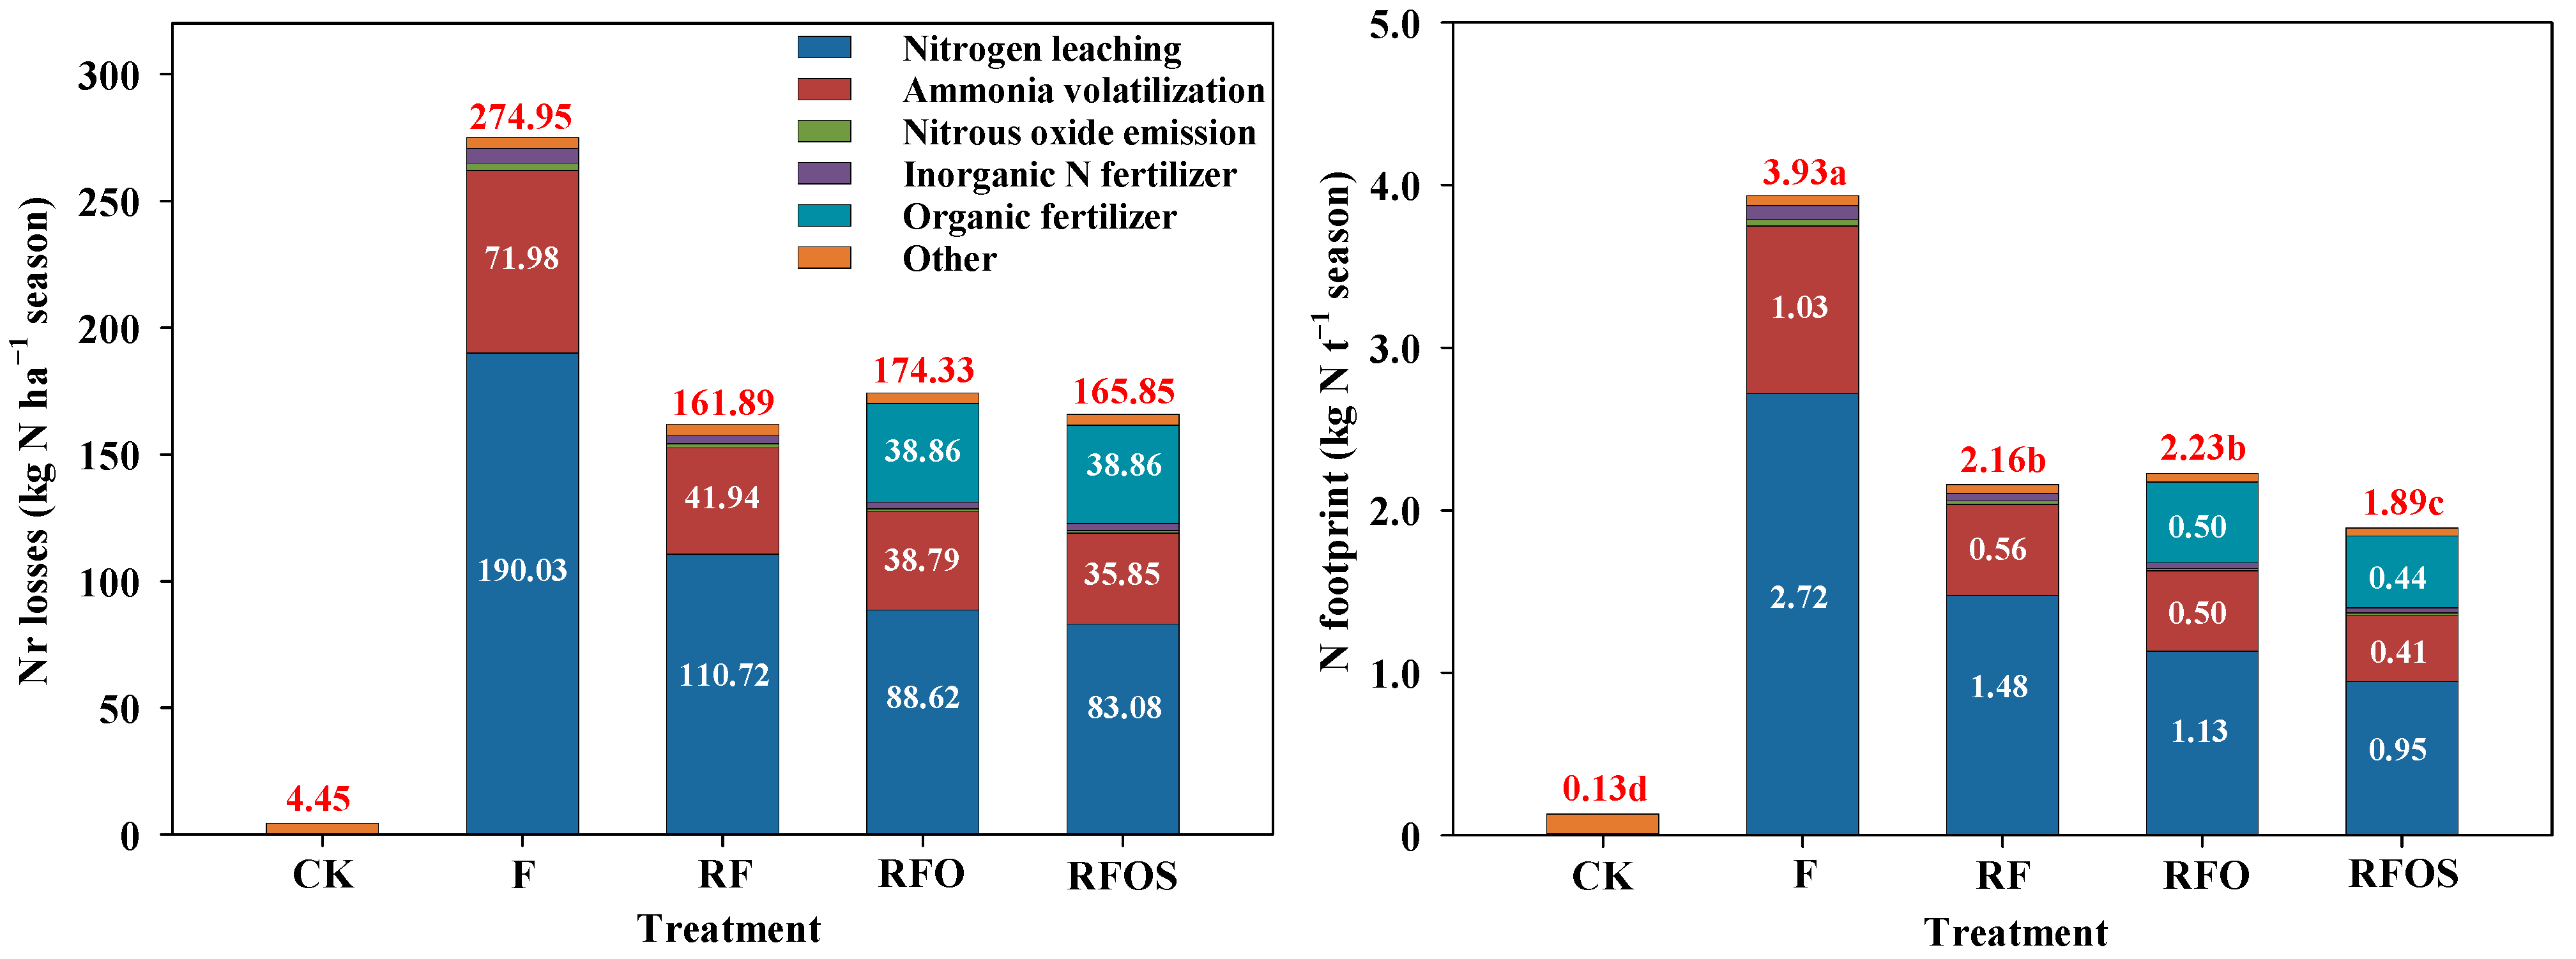
3.2. Nr Losses and NF

Compared to the CK treatment, all fertilization treatments significantly increased Nr loss and NF (Figure 4). Among all fertilization treatments, N leaching was the largest Nr loss pathway in fertilized plots (50.1–69.1%), followed by the NH3 volatilization pathway (21.6–26.2%). Organic fertilizer addition also became an important pathway for Nr loss in the RFO and RFOS treatments, accounting for 22.3% and 23.4% of the total loss rate, respectively. Agricultural inputs such as pesticides, diesel fuel, electricity and plastic mulch accounted for only 1.6–2.6% of Nr losses. Among all treatments, the F treatment showed the highest Nr loss. The Nr loss in the RF, RFO and RFOS treatments decreased dramatically compared to that in the F treatment. In comparison with the RF treatment, the Nr loss was improved by 7.7% and 2.4% for the RFO and RFOS treatments with higher Nr loss of organic fertilizer production and transportation (38.86 kg N ha−1 season), respectively, but their N leaching and NH3 volatilization were lower than that of the RF treatment. Similar to the Nr loss, the F treatment had the highest NF (3.9 kg N t−1 season), which was significantly higher than that of the other treatments (Figure 4, p < 0.05). Compared to the F treatment, the RF, RFO, and RFOS treatments had 45.0%, 43.3% and 51.9% decreases in NF, respectively. The RFO treatment showed a 3.2% increase in NF compared to the RF treatment, while the RFOS treatment had the lowest NF of 1.9 kg N t−1 season, significantly lower than the other fertilizer application treatments (p < 0.05).

3.3. GHG Emissions and CF

Among the fertilization treatments, field soils were the largest contributor to GHG emissions, accounting for 36.8–45.7% (Figure 5). This was followed by GHG emissions from N fertilizer production and transportation, which accounted for 21.2–29.5%. Other agricultural inputs, such as phosphate fertilizer, potash fertilizer, diesel, electricity, pesticides and plastic mulch, accounted for 28.3–37.2% of GHG emissions. GHG emissions were highest in the F treatment (22,991.1 kg CO2eq ha−1 season) and lowest in the CK treatment (9752.9 kg CO2eq ha−1 season). The GHG emissions decreased by 19.0%, 29.1% and 26.8% for RF, RFO and RFOS treatments compared to the F treatment, respectively, but the differences in GHG emissions between the RFO and RFOS treatments were not obvious.
The field soils (73.8–138.8 kg CO2eq t−1 season) were the largest contributor to CF, followed by N fertilizer production and transportation (48.9–97.0 kg CO2eq t−1 season) and plastic mulch (30.0–37.7 kg CO2eq t−1 season) for all fertilization treatments (Figure 5). The F treatment (329.0 kg CO2eq t−1 season) had a significantly higher CF than the other treatments (p < 0.05), followed by the CK treatment (283.6 kg CO2eq t−1 season). At the same fertilizer application rate, the RFO and RFOS treatments showed a 16.1% and 22.7% reduction in CF compared to the RF treatment, respectively (p < 0.05). Simultaneously, the CF of the RFOS treatment (191.8 kg CO2eq t−1 season) was the lowest among the treatments.

3.4. EB, EDC and NEEB

Compared with the CK treatment, all fertilizer applications showed an increase in AIC, TR and NI (Table 3). The F treatment had the highest AIC (8867 USD ha−1), but the RFOS treatment showed the highest TR (64,099 USD ha−1) and NI (55,713 USD ha−1). In comparison with the F treatment, the AIC was decreased by 9.8%, 6.2% and 5.4% for the RF, RFO and RFOS treatments, respectively; however, the NI was increased by 12.0%, 19.2% and 37.9%, respectively. In terms of the B:C ratio, the RFOS treatment exhibited the highest B:C ratio, followed by RFO and RF.
The EDC ranged from 421 USD ha−1 in the CK treatment to 1170 USD ha−1 in the F treatment (Table 3). Compared with the F treatment, the EDC of the RF, RFO and RFOS treatments decreased by 22.5%, 30.3% and 28.8%, respectively. The EDC of the RFO treatment was the lowest among all fertilization treatments. Among all the treatments, NEEB showed the following: RFOS > RFO > RF > F > CK. Additionally, the NEEB of RFOS (54,880 USD ha−1) increased by 15,658 USD ha−1, 10,545 USD ha−1 and 7534 USD ha−1 compared to F, RF and RFO, respectively.

4. Discussion

4.1. Pineapple Yield, N Uptake, NUE and PFPN of Different Fertilization Strategies

Due to the absorption of soil nutrients by pineapple, the soil nutrient content before transplantation in the first season of the CK treatment was significantly lower than that in the second season (decrease of 78.9% and 14.7% in nitrate N and ammonium N content, respectively), and the yield in the first season (more than 40 t ha−1) was significantly higher than that in the second season. Scientific and reasonable fertilization could prevent imbalances in soil nutrient ratios and “excessive growth” phenomena in the late reproductive period [49], improving the accumulation and utilization of N, P and K in crops [5,50]. Therefore, even if the amount of fertilizer applied was greatly reduced, pineapple yield and N uptake in the RF treatment were not significantly different from those in the conventional fertilization treatment in both pineapple growing seasons, but both NUE and PFPN were significantly higher than those in the conventional fertilization treatment (Figure 3, p < 0.05). The use of organic fertilizer and slow-release fertilizer could delay the release of nutrients, decrease nutrient leaching and increase nutrient uptake in crops [18,51,52]. Therefore, compared to the RF treatment, the RFO and RFOS treatments increased pineapple yield, N uptake, NUE and PFPN. Additionally, of the treatments, the RFOS treatment had the highest yield in the two growing seasons, and the yield was significantly higher in the RFOS treatment than in the RF and RFO treatments in the second season (Figure 3, p < 0.05). This result is possible because the rainfall in the second pineapple growth season was obviously lower than that in the first pineapple growth season, which resulted in the slow-release N not being easily lost during the 6-month slow-release period, thereby promoting N uptake by pineapple plants [53]. This result was similar to that of Zhang et al. [21]. However, the lower rainfall amount in the early stages of pineapple growth in the second season than in the first season resulted in lower dry matter mass in the early stages of plant nutrient growth, restricting reproductive growth in the later stages, which in turn resulted in lower pineapple yield, N uptake and NUE in all treatments in the 2019–2021 pineapple growth season than in the 2017–2019 pineapple growth season.

4.2. Nr Losses and NF of Different Fertilization Strategies

In agricultural production, N fertilizer is a key indicator that relates to quantifying and evaluating Nr losses and NF [29]. In addition, N leaching, NH3 volatilization, and N2O emissions are the primary pathways of Nr losses [33]. Of the treatments, the CK treatment had the lowest Nr losses and NF because no N fertilizer was applied (Figure 4). Due to the higher rainfall amount and temperature during pineapple production, N leaching and NH3 volatilization were the two major factors responsible for Nr losses in the fertilizer treatments, accounting for 50.1–69.1% and 21.6–26.2%, respectively. Zhang et al. [54] and Shen et al. [55] also determined that rainfall and temperature were significantly positively correlated with soil N leaching and NH3 volatilization. Therefore, reducing N leaching and NH3 volatilization is a key strategy to decrease Nr losses in pineapple field production [54,55]. Although N2O emissions from the fertilized treatments in this study accounted for only 0.7–1.0% of the Nr losses, N2O in the atmosphere causes ozone depletion and climate warming. Therefore, determining a process for reducing agricultural N2O emissions is still an urgent issue that needs to be resolved [56].
Because of the decrease in NH3 volatilization and N leaching as a result of reduced fertilizer application [46,57], in comparison with the F treatment, the RF, RFO and RFOS treatments significantly reduced Nr loss and NF by 36.6–41.1% and 43.3–51.9%, respectively (Figure 4). The application of organic fertilizers improves the nutrient and moisture adsorption capacity of the soil and enhances the fixation of mineral N by microorganisms [20,58,59], decreasing soil NH3 volatilization and N leaching and improving the water and fertility retention capacity of the soil. Therefore, N leaching and NH3 volatilization were lower in the RFO and RFOS treatments than in the RF treatment at the same fertilizer application rate. However, microorganisms decompose nitrogenous organic matter into inorganic N, such as ammonium N, at the beginning of organic fertilizer production, while nitrification is inhibited under high-temperature conditions; in addition, a large amount of N is lost through NH3 volatilization [60]. This process may have led to a large amount of N loss, which in turn caused higher Nr loss in the RFO and RFOS treatments than in the RF treatments. Despite this scenario, the strongly controlled release effect of the slow-release fertilizer N in the RFOS treatment prevented excessive N concentrations in the soil, therefore decreasing the risk of N leaching, N2O emissions and NH3 volatilization [53]. Simultaneously, because the RFOS treatment had the highest pineapple yield, the NF of the RFOS treatment was significantly lower than that of the RF and RFO treatments (Figure 4, p < 0.05). The Nr losses of the four fertilization treatments were similar to those in previous research results [30], but due to the high yield of pineapple, the NF (1.9–3.9 kg N t−1 season) of the four fertilization treatments was significantly lower than that in previous research [5,48,61].

4.3. GHG Emissions and CF of Different Fertilization Strategies

The production and transportation of chemical fertilizers and their use on farmland can account for significant amounts of GHG emissions [62]. Because of high evaporation and grass infestation in the tropics, the use of plastic film mulch can reduce soil moisture evaporation and weed growth. However, plastic film is an unsustainable mulching method in pineapple production because it pollutes the farmland environment and consumes large amounts of electricity during industrial production, which increases GHG emissions [63]. Therefore, field soils, N fertilizer production and transportation, and plastic mulch were the main contributors to GHG emissions in all fertilization treatments (Figure 5), and determining a process to reduce or replace the use of plastic film in pineapple production is also an issue that needs to be resolved in the future. N fertilizer, temperature and soil water content are important factors affecting soil GHG emissions [13,62,64]. High temperatures can increase the release of soil N2O and CO2 [2]. At the same time, high moisture content can also increase the emissions of N2O and CH4 in soil. In addition, the application of N fertilizer can first produce a large amount of N2O and NO by soil nitrification and denitrification [64]; second, its degradation can produce a large amount of CO2 [2]; and finally, it can promote the decomposition of soil organic matter and root respiration and increase CO2 emissions [65]. Therefore, GHG emissions from farmland soil account for the highest proportion of total GHG emissions due to the high temperature and high rainfall climate in tropical regions, and N fertilizer application can significantly increase soil GHG emissions. In this study, field soils and N fertilizer production and transportation decreased GHG emissions due to reduced N fertilizer application [5], which resulted in significantly lower GHG emissions and CF in the RF, RFO and RFOS treatments than in the F treatment (Figure 5).
Compared to that of inorganic N fertilizers, the application of organic fertilizers (C/N > 8) increased the substrate C required for nitrification and denitrification but provided less substrate N, which restricted the occurrence of nitrification and denitrification, leading to a reduction in N2O emissions in field production [66]. However, in the mid and late phases of organic fertilizer production, increasing nitrification leads to an increase in N2O emissions, which results in significantly higher GHG emissions from organic fertilizer production and transportation than those from inorganic fertilizers [60,67]. In this study, compared to the RF treatment, the RFO and RFOS treatments substituted 20% of N inputs with organic fertilizer and resulted in a 23.9–29.6% reduction in GHG emissions from field soils but a 7.2–8.5% increase in GHG emissions from N fertilizer production and transportation (Figure 5). Therefore, the GHG emissions and CF of the RFO and RFOS treatments were significantly lower than those of the RF treatment. The slow release of N from a slow-release fertilizer applied in the field enhanced plant root respiration and resulted in an increase in CO2 emissions [65]. Thus, the GHG emissions of the RFOS treatment were slightly higher than those of the RFO treatment. In addition, the GHG emissions of the four fertilization treatments were significantly higher than those in previous studies due to the long growth period of pineapple and the high number of agricultural inputs [1]. However, CF was similar to the results of previous research [33].

4.4. EB, EDC and NEEB of Different Fertilization Strategies

Increasing EB is an important factor for farmers to improve nutrient management in the field. Although all fertilizer treatments increased AIC, the significant increase in yield also resulted in an increased TR and NI (Table 3). The increased EB in the RF treatment compared to the F treatment was mainly attributed to the decrease in AIC and the increase in pineapple yield, which is consistent with previous studies [5]. Although the unit price of organic fertilizer (34.6 USD t−1) is lower than that of conventional urea (361.6 USD t−1), its high application rate causes an increase in the AIC of RFO treatment. The price of slow-release N fertilizer (786.2 USD t−1) was higher than that of conventional urea (361.6 USD t−1), which resulted in a higher AIC for the RFOS treatment than for the RFO treatment. However, the RFO and RFOS treatments had a significant increase in TR and NI owing to the improved pineapple yield (Table 3). In the future, with the future development of the industry and improvement of production technology, the increased nutrient content of organic fertilizers and the decreased cost of organic fertilizers and slow-release fertilizers will further contribute to the improvement of EB. In addition, fluctuations in pineapple market purchase prices will also seriously affect EB.
The assessment of EDC and NEEB can help to achieve clean and sustainable pineapple industry development [36]. The RF, RFO and RFOS treatments resulted in lower GHG emissions and Nr losses and, therefore, lower EDC (Table 3). At the same time, there was a significant increase in NEEB for the RF, RFO and RFOS treatments as a result of increased pineapple yield in comparison with F, and the highest NEEB was obtained for the RFOS treatment. Therefore, the RFOS fertilization pattern was an effective measure to improve the economic and environmental benefits of the tropical pineapple industry.

5. Conclusions

Farmland soils are the largest source of greenhouse gas emissions in pineapple production. Reducing fertilizer application could increase pineapple yield and reduce GHG emissions and Nr losses from the production system, therefore decreasing CF and NF and improving the NEEB of the pineapple production system. Although organic fertilizer substitution increased Nr losses, it decreased N leaching and NH3 volatilization in the field. At the same time, the partial substitution of chemical fertilizers with organic and slow-release fertilizers resulted in the highest pineapple yield and NEEB, and the lowest NF and CF, which is an effective strategy for clean and sustainable pineapple production in the tropics. In addition, future research is needed to reveal the different carbon and nitrogen footprints of different fertilization modes from the perspective of soil carbon and nitrogen cycles and microorganisms; and to further reduce GHG emissions from farmland soils and the Nr losses of organic fertilizer addition under RFOS treatment in pineapple production.

Supplementary Materials

The following supporting information can be downloaded at: https://www.mdpi.com/article/10.3390/su151310353/s1, Table S1: The reactive nitrogen losses and greenhouse gas emission factors of agricultural inputs in pineapple production systems; Table S2: The emission factors for ammonia volatilization and nitrogen leaching for different nitrogen sources in pineapple production systems; Table S3: The details of agricultural input spending per pineapple season under different fertilization strategies. References [68,69,70,71] are cited in the supplementary materials.

Author Contributions

J.C. investigation, data curation, formal analysis, methodology, visualization, writing—original draft preparation. W.C. investigation, data curation, methodology, formal analysis, visualization. Z.L. investigation, data curation, resources, software, methodology, visualization. C.L. (Changzhen Li) supervision, formal analysis, software, visualization, resources, writing—review and editing. Y.D. methodology, funding acquisition, data curation, resources, software, visualization. T.Y. investigation, data curation, resources, project administration, validation, software. C.L. (Changjiang Li) conceptualization, project administration, funding acquisition, validation, resources, methodology, data curation, supervision, writing—review and editing. All authors have read and agreed to the published version of the manuscript.

Funding

This research was funded by the Science and Technology Project of Hainan Province [grant number: ZDYF2021XDNY117]; the National Natural Science Foundation of China [grant number: 31860586]; the Scientific Research Funds for Hainan University [grant number: KYQD(ZR)1850].

Institutional Review Board Statement

Not applicable.

Informed Consent Statement

Not applicable.

Data Availability Statement

The data that support the findings of this study are available from the corresponding author upon reasonable request.

Conflicts of Interest

The authors declare no conflict of interest.

References

  1. Yao, Z.; Zhang, W.S.; Wang, X.Z.; Lu, M.; Chadwick, D.; Zhang, Z.; Chen, X.P. Carbon footprint of maize production in tropical/subtropical region: A case study of Southwest China. Environ. Sci. Pollut. Res. 2021, 28, 28680–28691. [Google Scholar] [CrossRef] [PubMed]
  2. Liang, Z.H.; Jin, X.; Zhai, P.F.; Zhao, Y.; Cai, J.W.; Li, S.P.; Yang, S.Y.; Li, C.Z.; Li, C.J. Combination of organic fertilizer and slow-release fertilizer increases pineapple yields, agronomic efficiency and reduces greenhouse gas emissions under reduced fertilization conditions in tropical areas. J. Clean. Prod. 2022, 343, 131054. [Google Scholar] [CrossRef]
  3. Zhang, X.; Davidson, E.A.; Mauzerall, D.L.; Searchinger, T.D.; Dumas, P.; Shen, Y. Managing nitrogen for sustainable development. Nature 2015, 528, 51–59. [Google Scholar] [CrossRef] [PubMed] [Green Version]
  4. Sun, J.B.; Li, W.B.; Li, C.Q.; Chang, W.J.; Zhang, S.Q.; Zeng, Y.B.; Zeng, C.Y.; Peng, M. Effect of Different Rates of Nitrogen Fertilization on Crop Yield, Soil Properties and Leaf Physiological Attributes in Banana under Subtropical Regions of China. Front. Plant Sci. 2020, 11, 2083. [Google Scholar] [CrossRef]
  5. Zhang, L.; Liang, Z.Y.; Hu, Y.C.; Schmidhalter, U.; Zhang, W.S.; Ruan, S.Y.; Chen, X.P. Integrated assessment of agronomic, environmental and ecosystem economic benefits of blending use of controlled-release and common urea in wheat production. J. Clean. Prod. 2021, 287, 125572. [Google Scholar] [CrossRef]
  6. FAO (Food and Agriculture Organization of United Nations). FAOSTAT Database-Resources. 2020. Available online: http://faostat.fao.org (accessed on 30 December 2020).
  7. Yan, C.M.; Zhang, J.Z.; Shi, W.Q.; Li, X.L.; Liu, Y.N.; Ma, H.Y. Nutritional characteristics of NPK of pineapple under drip fertigation. Chin. J. Trop. Crop. 2014, 35, 1688–1694. (In Chinese) [Google Scholar] [CrossRef]
  8. Yan, C.M.; Zhang, J.Z.; Shi, W.Q.; Liu, Y.N.; Ma, H.Y.; Li, X.L. Effects of drip fertigation on yield, quality and economic benefit of pineapple. Plant Nutr. Fertil. Sci. 2014, 20, 496–502. (In Chinese) [Google Scholar] [CrossRef]
  9. Galloway, J.N.; Townsend, A.R.; Erisman, J.W.; Bekunda, M.; Cai, Z.; Freney, J.R.; Martinelli, L.A.; Seitzinger, S.P.; Sutton, M.A. Transformation of the nitrogen cycle: Recent trends, questions, and potential solutions. Science 2008, 320, 889–892. [Google Scholar] [CrossRef] [Green Version]
  10. Gu, B.; Leach, A.M.; Ma, L.; Galloway, J.N.; Chang, S.X.; Ge, Y. Nitrogen footprint in China: Food, energy, and nonfood goods. Environ. Sci. Technol. 2013, 47, 9217–9224. [Google Scholar] [CrossRef]
  11. Li, S.; Wu, J.C.; Ma, L. Economic, energy and environmental consequences of shifting from maize-wheat to forage rotation in the North China Plain. J. Clean. Prod. 2021, 328, 129670. [Google Scholar] [CrossRef]
  12. Xia, L.L.; Lam, S.K.; Chen, D.L.; Wang, J.Y.; Tang, Q.; Yan, X.Y. Can knowledge-based N management produce more staple grain with lower greenhouse gas emission and reactive nitrogen pollution? A meta-analysis. Global Chang. Biol. 2017, 23, 1917–1925. [Google Scholar] [CrossRef] [PubMed]
  13. Zhang, X.X.; Yin, S.; Li, Y.S.; Zhuang, H.L.; Li, C.S.; Liu, C.J. Comparison of greenhouse gas emissions from rice paddy fields under different nitrogen fertilization loads in Chongming Island. Eastern China. Sci. Total Environ. 2014, 472, 381–388. [Google Scholar] [CrossRef] [PubMed]
  14. Chen, X.; Ma, C.; Zhou, H.; Liu, Y.; Huang, X.; Wang, M.; Cai, Y.; Su, D.; Muneer, M.A.; Guo, M.; et al. Identifying the main crops and key factors determining the carbon footprint of crop production in China, 2001–2018. Resour. Conserv. Recycl. 2021, 172, 105661. [Google Scholar] [CrossRef]
  15. Yu, K.; Fang, X.T.; Zhang, Y.H.; Miao, Y.C.; Liu, S.W.; Zou, J.W. Low greenhouse gases emissions associated with high nitrogen use efficiency under optimized fertilization regimes in double-rice cropping systems. Appl. Soil Ecol. 2021, 160, 103846. [Google Scholar] [CrossRef]
  16. Peng, S.B.; Buresh, R.J.; Huang, J.L.; Yang, J.C.; Zou, Y.B.; Zhong, X.H.; Wang, G.H.; Zhang, F.S. Strategies for overcoming low agronomic nitrogen use efficiency in irrigated rice systems in China. Field Crop. Res. 2006, 96, 37–47. [Google Scholar] [CrossRef]
  17. Guo, J.Y. Investigation on Pineapple Fertilization Situation and Study on Nutritional Characteristics and Fertilizer-Saving Technology of MD-2 Pineapple. Master’s Thesis, Hainan University, Haikou, China, 2019. (In Chinese). [Google Scholar] [CrossRef]
  18. Maillard, E.; Angers, D.A. Animal manure application and soil organic carbon stocks: A meta-analysis. Glob. Chang. Biol. 2014, 20, 666–679. [Google Scholar] [CrossRef]
  19. Liang, Q.; Chen, H.Q.; Gong, Y.S.; Yang, H.F.; Fan, M.S.; Kuzyakov, Y. Effects of 15 years of manure and mineral fertilizers on enzyme activities in particle-size fractions in a North China Plain soil. Eur. J. Soil Biol. 2014, 60, 112–119. [Google Scholar] [CrossRef]
  20. Zhou, J.; Li, B.; Xia, L.L.; Fan, C.H.; Xiong, Z.Q. Organic-substitute strategies reduced carbon and reactive nitrogen footprints and gained net ecosystem economic benefit for intensive vegetable production. J. Clean. Prod. 2019, 225, 984–994. [Google Scholar] [CrossRef]
  21. Zhang, W.S.; Liang, Z.Y.; He, X.M.; Wang, X.Z.; Shi, X.J.; Zou, C.Q.; Chen, X.P. The effects of controlled release urea on maize productivity and reactive nitrogen losses: A meta-analysis. Environ. Pollut. 2019, 246, 559–565. [Google Scholar] [CrossRef]
  22. He, H.; Peng, M.W.; Lu, W.D.; Hou, Z.A.; Li, J.H. Commercial organic fertilizer substitution increases wheat yield by improving soil quality. Sci. Total Environ. 2022, 851, 158132. [Google Scholar] [CrossRef]
  23. Möller, K.; Müller, T. Effects of anaerobic digestion on digestate nutrient availability and crop growth: A review. Eng. Life Sci. 2012, 12, 242–257. [Google Scholar] [CrossRef]
  24. Coelho, J.J.; Prieto, M.L.; Dowling, S.; Hennessy, A.; Casey, I.; Woodcock, T.; Kennedy, N. Physical-chemical traits, phytotoxicity and pathogen detection in liquid anaerobic digestates. Waste Manag. 2018, 78, 8–15. [Google Scholar] [CrossRef] [PubMed]
  25. Ma, Q.; Wang, M.Y.; Zheng, G.L.; Yao, Y.; Tao, R.R.; Zhu, M.; Ding, J.F.; Li, C.Y.; Guo, W.S.; Zhu, X.K. Twice-split application of controlled-release nitrogen fertilizer met the nitrogen demand of winter wheat. Field Crop. Res. 2021, 267, 108163. [Google Scholar] [CrossRef]
  26. Zhang, Z.S.; Chen, J.; Liu, T.Q.; Cao, C.G.; Li, C.F. Effects of nitrogen fertilizer sources and tillage practices on greenhouse gas emissions in paddy fields of central China. Atmos. Environ. 2016, 144, 274–281. [Google Scholar] [CrossRef]
  27. Sossa, E.L.; Agbangba, C.E.; Accalogoun, S.G.G.S.; Amadji, G.L.; Agbossou, K.E.; Hounhouigan, D.J. Residues Management Practices and Nitrogen-Potassium Fertilization Influence on the Quality of Pineapple (Ananas comosus (L.) Merrill) Sugarloaf Fruit for Exportation and Local Consumption. Agronomy 2017, 7, 26. [Google Scholar] [CrossRef] [Green Version]
  28. Rothé, M.; Darnaudery, M.; Thuriès, L. Organic fertilizers, green manures and mixtures of the two revealed their potential as substitutes for inorganic fertilizers used in pineapple cropping. Sci. Hortic. 2019, 257, 108691. [Google Scholar] [CrossRef]
  29. Xue, J.F.; Pu, C.; Liu, S.L.; Zhao, X.; Zhang, R.; Chen, F.; Xiao, X.P.; Zhang, H.L. Carbon and nitrogen footprint of double rice production in Southern China. Ecol. Indic. 2016, 64, 249–257. [Google Scholar] [CrossRef]
  30. Chen, Z.D.; Xu, C.C.; Ji, L.; Feng, J.F.; Li, F.B.; Zhou, X.Y.; Fang, F.P. Effects of multi-cropping system on temporal and spatial distribution of carbon and nitrogen footprint of major crops in China. Glob. Ecol. Conserv. 2020, 22, e00895. [Google Scholar] [CrossRef]
  31. Leach, A.M.; Galloway, J.N.; Bleeker, A.; Erisman, J.W.; Kohn, R.; Kitzes, J. A nitrogen footprint model to help consumers understand their role in nitrogen losses to the environment. Environ. Dev. 2012, 1, 40–66. [Google Scholar] [CrossRef] [Green Version]
  32. ISO-14067; Greenhouse Gases-Carbon Footprint of Products-Requirements and Guidelines for Quantification and Communication. International Organization for Standardization: Geneva, Switzerland, 2013.
  33. Liang, T.; Liao, D.X.; Wang, S.; Yang, B.; Zhao, J.K.; Zhu, C.F.; Tao, Z.; Shi, X.J.; Chen, X.P.; Wang, X.Z. The nitrogen and carbon footprints of vegetable production in the subtropical high elevation mountain region. Ecol. Indic. 2021, 122, 107298. [Google Scholar] [CrossRef]
  34. Meena, B.P.; Biswas, A.K.; Singh, M.; Das, H.; Chaudhary, R.S.; Singh, A.B.; Shirale, A.O.; Patra, A.K. Energy budgeting and carbon footprint in long-term integrated nutrient management modules in a cereal-legume (Zea maysCicer arietinum) cropping system. J. Clean. Prod. 2021, 314, 127900. [Google Scholar] [CrossRef]
  35. Li, S.; Wu, J.C.; Wang, X.C.; Ma, L. Economic and environmental sustainability of maize-wheat rotation production when substituting mineral fertilizers with manure in the North China Plain. J. Clean. Prod. 2020, 271, 122683. [Google Scholar] [CrossRef]
  36. Wang, Z.B.; Zhai, L.C.; Xiong, S.W.; Li, X.F.; Han, Y.C.; Wang, G.P.; Feng, L.; Fan, Z.Y.; Lei, Y.P.; Yang, B.F.; et al. February orchid cover crop improves sustainability of cotton production systems in the Yellow River basin. Agron. Sustain. Dev. 2021, 41, 67. [Google Scholar] [CrossRef]
  37. Xia, Y.Q.; Yan, X.Y. Ecologically optimal nitrogen application rates for rice cropping in the Taihu Lake Region of China. Sustain. Sci. 2012, 7, 33–44. [Google Scholar] [CrossRef]
  38. Shen, Y.Z.; Wang, B.C.; Zhu, S.X.; Xie, W.; Wang, S.Q.; Zhao, X. Single application of a new polymer-coated urea improves yield while mitigates environmental issues associated with winter wheat grown in rice paddy soil. Field Crop. Res. 2022, 285, 108592. [Google Scholar] [CrossRef]
  39. Xu, C.; Wang, J.D.; Wu, D.; Li, C.Z.; Wang, L.; Ji, C.; Zhang, Y.C.; Ai, Y.C. Optimizing organic amendment applications to enhance carbon sequestration and economic benefits in an infertile sandy soil. J. Environ. Manag. 2022, 303, 114129. [Google Scholar] [CrossRef] [PubMed]
  40. Zhang, X.; Qian, H.Y.; Hua, K.K.; Chen, H.; Deng, A.X.; Song, Z.W.; Zhang, J.; Raheem, A.; Danso, F.; Wang, D.Z.; et al. Organic amendments increase crop yield while mitigating greenhouse gas emissions from the perspective of carbon fees in a soybean-wheat system. Agric. Ecosyst. Environ. 2022, 325, 107736. [Google Scholar] [CrossRef]
  41. Horwitz, W. Official methods of analysis of AOAC International. Trends Food Sci. Technol. 1995, 6, 382. [Google Scholar] [CrossRef] [Green Version]
  42. Liang, L.; Ridoutt, B.G.; Lal, R.; Wang, D.P.; Wu, W.L.; Peng, P.; Hang, S.; Wang, L.Y.; Zhao, G.S. Nitrogen footprint and nitrogen use efficiency of greenhouse tomato production in North China. J. Clean. Prod. 2019, 208, 285–296. [Google Scholar] [CrossRef]
  43. ISO-14040; Environmental Management Life Cycle Assessment Principles and Framework. International Organization for Standardization: Geneva, Switzerland, 2006.
  44. ISO-14044; Environmental Management Life Cycle Assessment Requirements and Guidelines. International Organization for Standardization: Geneva, Switzerland, 2006.
  45. Liang, L.; Lal, R.; Ridoutt, B.G.; Du, Z.L.; Wang, D.P.; Wang, L.Y.; Wu, W.L.; Zhao, G.S. Life cycle assessment of China’s agroecosystems. Ecol. Indic. 2018, 88, 341–350. [Google Scholar] [CrossRef]
  46. Yao, Z.; Zhang, W.S.; Wang, X.B.; Zhang, L.; Zhang, W.; Liu, D.Y.; Chen, X.P. Agronomic, environmental, and ecosystem economic benefits of controlled-release nitrogen fertilizers for maize production in Southwest China. J. Clean. Prod. 2021, 312, 127611. [Google Scholar] [CrossRef]
  47. Ansari, M.A.; Saha, S.; Das, A.; Lal, R.; Das, B.; Choudhury, B.U.; Roy, S.S.; Sharma, S.K.; Singh, I.M.; Meitei, C.B.; et al. Energy and carbon budgeting of traditional land use change with groundnut based cropping system for environmental quality, resilient soil health and farmers income in eastern Indian Himalayas. J. Environ. Manag. 2021, 293, 112892. [Google Scholar] [CrossRef]
  48. Zhang, Z.G.; An, J.; Han, Y.C.; Feng, L.; Li, X.F.; Xiong, S.W.; Xing, F.F.; Xin, M.H.; Li, Y.B.; Wang, Z.B. Advantages of an Orychophragmus violaceus-maize rotation in reducing greenhouse gas emissions and reactive nitrogen losses and increasing net ecosystem economic benefits on the North China Plain. J. Clean. Prod. 2021, 317, 128426. [Google Scholar] [CrossRef]
  49. Peng, Y.L.; Fei, L.J.; Liu, X.G.; Sun, G.Z.; Hao, K.; Cui, N.B.; Zhao, L.; Liu, L.H.; Jie, F.L. Coupling of regulated deficit irrigation at maturity stage and moderate fertilization to improve soil quality, mango yield and water-fertilizer use efficiency. Sci. Hortic. 2023, 307, 111492. [Google Scholar] [CrossRef]
  50. Li, C.; Feng, H.; Luo, X.Q.; Li, Y.; Wang, N.J.; Wu, W.J.; Zhang, T.B.; Dong, Q.G.; Siddique, K.H.M. Limited irrigation and fertilization in sand-layered soil increases nitrogen use efficiency and economic benefits under film mulched ridge-furrow irrigation in arid areas. Agric. Water Manag. 2022, 262, 107406. [Google Scholar] [CrossRef]
  51. Zhang, J.; Zhu, T.; Cai, Z.; Qin, S.; Muller, C. Effects of long-term repeated mineral and organic fertilizer applications on soil nitrogen transformations. Eur. J. Soil Sci. 2012, 63, 75–85. [Google Scholar] [CrossRef]
  52. Linquist, B.A.; Liu, L.J.; van Kessel, C.; van Groenigen, K.J. Enhanced efficiency nitrogen fertilizers for rice systems: Meta-analysis of yield and nitrogen uptake. Field Crop. Res. 2013, 154, 246–254. [Google Scholar] [CrossRef]
  53. Yang, M.; Zhu, X.Q.; Bai, Y.; Sun, D.; Zou, H.T.; Fang, Y.T.; Zhang, Y.L. Coated controlled-release urea creates a win-win scenario for producing more staple grains and resolving N loss dilemma worldwide. J. Clean. Prod. 2021, 288, 125660. [Google Scholar] [CrossRef]
  54. Zhang, B.G.; Li, Q.; Cao, J.; Zhang, C.Y.; Song, Z.; Zhang, F.S.; Chen, X.P. Reducing nitrogen leaching in a subtropical vegetable system. Agric. Ecosyst. Environ. 2017, 241, 133–141. [Google Scholar] [CrossRef]
  55. Shen, S.Z.; Yang, Y.; Wang, R.Q.; Wu, F.; Hu, Y.K.; Wang, F.; Zhang, K.Q. Effects of fertilization on ammonia volatilization and garlic yield in Erhai Lake Basin of Yunnan Province. Plant Nutr. Fertil. Sci. 2021, 27, 470–479. (In Chinese) [Google Scholar] [CrossRef]
  56. Xu, Q.; Hu, K.L.; Yao, Z.S.; Zuo, Q. Evaluation of carbon, nitrogen footprint and primary energy demand under different rice production systems. Ecol. Indic. 2020, 117, 106634. [Google Scholar] [CrossRef]
  57. Cui, Z.L.; Yue, S.C.; Wang, G.L.; Zhang, F.S.; Chen, X.P. In-Season Root-Zone N Management for Mitigating Greenhouse Gas Emission and Reactive N Losses in Intensive Wheat Production. Environ. Sci. Technol. 2013, 47, 6015–6022. [Google Scholar] [CrossRef] [PubMed]
  58. Rasool, R.; Kukal, S.S.; Hira, G.S. Soil organic carbon and physical properties as affected by long-term application of FYM and inorganic fertilizers in maize–wheat system. Soil Tillage Res. 2008, 101, 31–36. [Google Scholar] [CrossRef]
  59. Xia, L.L.; Lam, S.K.; Yan, X.Y.; Chen, D.L. How does recycling of livestock manure in agroecosystems affect crop productivity, reactive nitrogen losses and soil carbon balance? Environ. Sci. Technol. 2017, 51, 7450–7457. [Google Scholar] [CrossRef]
  60. Eiland, F.; Leth, M.; Klamer, M.; Lind, A.-M.; Jensen, H.E.K.; Iversen, J.J.L. C and N Turnover and Lignocellulose Degradation during Composting of Miscanthus Straw and Liquid Pig Manure. Compos. Sci. Util. 2001, 9, 186–196. [Google Scholar] [CrossRef]
  61. Xia, L.L.; Ti, C.P.; Li, B.L.; Xia, Y.Q.; Yan, X.Y. Greenhouse gas emissions and reactive nitrogen releases during the life-cycles of staple food production in China and their mitigation potential. Sci. Total Environ. 2016, 556, 116–125. [Google Scholar] [CrossRef]
  62. Chen, X.P.; Cui, Z.L.; Fan, M.S.; Vitousek, P.; Zhao, M.; Ma, W.Q. Producing more grain with lower environmental costs. Nature 2014, 514, 486–489. [Google Scholar] [CrossRef]
  63. Rahim, R.; Raman, A.A.A. Carbon dioxide emission reduction through cleaner production strategies in a recycled plastic resins producing plant. J. Clean. Prod. 2017, 141, 1067–1073. [Google Scholar] [CrossRef]
  64. Akiyama, H.; Yan, X.Y.; Yagi, K. Evaluation of effectiveness of enhanced-efficiency fertilizers as mitigation options for N2O and NO emissions from agricultural soils: Meta-analysis. Glob. Chang. Biol. 2010, 16, 1837–1846. [Google Scholar] [CrossRef]
  65. Zhang, K.P.; Duan, M.C.; Xu, Q.W.; Wang, Z.Y.; Liu, B.Y.; Wang, L.C. Soil microbial functional diversity and root growth responses to soil amendments contribute to CO2 emission in rainfed cropland. Catena 2020, 195, 104747. [Google Scholar] [CrossRef]
  66. Li, Y.Q.; Wen, Y.C.; Lin, Z.A.; Zhao, B.Q. Effect of different manures combined with chemical fertilizer on yields of crops and gaseous N loss in farmland. Plant Nutr. Fertil. Sci. 2019, 25, 1835–1846. (In Chinese) [Google Scholar] [CrossRef]
  67. Hou, Y.; Velthof, G.L.; Oenema, O. Mitigation of ammonia, nitrous oxide and methane emissions from manure management chains: A meta-analysis and integrated assessment. Glob. Chang. Biol. 2015, 21, 1293–1312. [Google Scholar] [CrossRef] [PubMed]
  68. Pishgar-Komleh, S.H.; Omid, M.; Heidari, M.D. On the study of energy use and GHG (greenhouse gas) emissions in greenhouse cucumber production in Yazd province. Energy 2013, 59, 63–71. [Google Scholar] [CrossRef]
  69. Ren, L.J. Methodology Research and Typical Paper Products of Life Cycle Assessment. Master’s Thesis, Beijing University of Technology Press, Beijing, China, 2011. Available online: https://kns.cnki.net/kcms/detail/detail.aspx?FileName=1011282781.nh&DbName=CMFD2011 (accessed on 30 December 2020). (In Chinese).
  70. Wang, J.; Zhang, L.H.; He, X.H.; Zhang, Y.Q.; Wan, Y.; Duan, S.Y.; Xu, C.Y.; Mao, X.Y.; Chen, X.P.; Shi, X.J. Environmental mitigation potential by improved nutrient managements in pear (Pyrus pyrifoliaL.) orchards based on life cycle assessment: A case study in the North China Plain. J. Clean. Prod. 2020, 262, 121273. [Google Scholar] [CrossRef]
  71. Yadav, G.S.; Das, A.; Lal, R.; Babu, S.; Meena, R.S.; Saha, P.; Singh, R.; Datta, M. Energy budget and carbon footprint in a no-till and mulch-based rice mustard cropping system. J. Clean. Prod. 2018, 191, 144–157. [Google Scholar] [CrossRef]
Figure 1. The specific location of the field experiment and the average monthly temperature and total precipitation for the two pineapple growing seasons.
Sustainability 15 10353 g001
Figure 2. System boundaries for the life cycle assessment of the nitrogen footprint, carbon footprint and net ecosystem economic benefit in fresh pineapple production.
Sustainability 15 10353 g002
Figure 3. Pineapple fresh fruit yield, nitrogen (N) uptake, nitrogen use efficiency (NUE) and partial factor productivity of nitrogen fertilizer (PFPN) under different fertilization strategies in the 2017–2019 (First season) and 2019–2021 growth seasons (Second season). The vertical bars indicate the means ± SE (n = 3). The different lowercase letters represent significant differences between treatments at the 0.05 probability level according to LSD. The fresh fruit yield data were obtained from Liang et al. [2].
Sustainability 15 10353 g003
Figure 4. The reactive nitrogen (Nr) losses and nitrogen (N) footprint of pineapple production systems under different fertilization strategies. The vertical bars indicate the average of two pineapple growth seasons. Different lowercase letters denote significant differences at p < 0.05, according to LSD.
Sustainability 15 10353 g004
Figure 5. The greenhouse gas (GHG) emissions and carbon (C) footprint of pineapple production systems under different fertilization strategies. Field emissions: field soil GHG accumulation emissions (including N2O, CO2 and CH4), which were from Liang et al. [2]; N: nitrogen fertilizer production and transportation; P2O5: phosphate fertilizer production and transportation; K2O: potassium fertilizer production and transportation. The vertical bars indicate the average of two pineapple growth seasons. Different lowercase letters denote significant differences at p < 0.05, according to LSD.
Sustainability 15 10353 g005
Table 1. The details of fertilizer application rates for different fertilization strategies.
TreatmentTotal Nutrient (kg ha−1 Season)Basal Fertilizer (kg ha−1 Season)Topdressing Fertilizer (kg ha−1 Season)
N + P2O5 + K2ON-UreaN-Organic FertilizerN-Slow-Release FertilizerP2O5K2ON-UreaP2O5K2O
CK---------
F817 + 336 + 945294--121340523215605
RF476 + 94 + 632171--3422830560404
RFO476 + 94 + 6327695--16930523404
RFOS476 + 94 + 63259571-16930523404
P2O5: calcium superphosphate; K2O: potassium chloride. Topdressing was carried out in five stages, each at 24%, 19%, 5%, 7% and 9% of the total fertilizer application. The relevant data were obtained from Liang et al. [2].
Table 2. The details of agricultural inputs per season of pineapple under different fertilization strategies.
TreatmentN-Urea (kg ha−1)N-Organic Fertilizer
(kg ha−1)
N-Slow-Release Fertilizer
(kg ha−1)
P2O5
(kg ha−1)
K2O
(kg ha−1)
Labor
(Days p ha−1)
Electricity (kWh ha−1)Diesel
(kg ha−1)
Pesticides (kg ha−1)Herbi-Cides (kg ha−1)Bacteri-Cides (kg ha−1)Paper Bag
(kg ha−1)
Plastic Film
(kg ha−1)
CK000001809222871.6121.6403.2116
F817003369452259222871.6121.6403.2116
RF47600946322259222871.6121.6403.2116
RFO381950235732309222871.6121.6403.2116
RFOS3109571235732309222871.6121.6403.2116
P2O5: calcium superphosphate; K2O: potassium chloride. The organic fertilizer contained N 0.8%, P2O5 0.5%, K2O 0.6%.
Table 3. The economic benefit, environmental damage cost and net ecosystem economic benefit of pineapple under different fertilization strategies (average of two seasons).
TreatmentAgriculture Input Costs (USD ha−1)Total Returns (USD ha−1)Net Income (USD ha−1)B:C RatioEDC (USD ha−1)NEEB
(USD ha−1)
CK579922,82917,0303.9442116,609
F886749,25940,3925.56117039,222
RF800253,24445,2426.6590744,335
RFO831556,47748,1626.7981647,346
RFOS838664,09955,7137.6483354,880
B:C ratio: benefit to cost ratio; EDC: environmental damage cost; NEEB: net ecosystem economic benefit. Values are the average of two pineapple growth seasons.
Disclaimer/Publisher’s Note: The statements, opinions and data contained in all publications are solely those of the individual author(s) and contributor(s) and not of MDPI and/or the editor(s). MDPI and/or the editor(s) disclaim responsibility for any injury to people or property resulting from any ideas, methods, instructions or products referred to in the content.

