Article

Evolution of Soil Chemical Fertility in an Area under Recovery for 30 Years with Anthropic Intervention

by
Josiane Lourencetti
1,*,
Carolina dos Santos Batista Bonini
2,*,
Marcelo Andreotti
1,
Marlene Cristina Alves
1,
Alfredo Bonini Neto
3,
Melissa Alexandre Santos
1,
Vitor Correa de Mattos Barretto
2 and
Roberth Wicleff Rodrigues de Figueredo
2
1
Department of Plant Health, Rural Engineering and Soils, College of Engineering, São Paulo State University (Unesp), Ilha Solteira, São Paulo 15385-000, Brazil
2
Department of Plant Production, School of Agronomic and Technological Sciences, São Paulo State University (Unesp), Dracena, São Paulo 17900-000, Brazil
3
Department of Biosystems Engineering, School of Sciences and Engineering, São Paulo State University (Unesp), Tupã, São Paulo 17602-496, Brazil
*
Authors to whom correspondence should be addressed.
Sustainability 2023, 15(13), 10344; https://doi.org/10.3390/su151310344
Submission received: 8 May 2023 / Revised: 5 June 2023 / Accepted: 26 June 2023 / Published: 30 June 2023
(This article belongs to the Special Issue Vegetation Restoration and Sustainable Management)

Abstract

:
The investigation and application of recovery techniques associated with the use of qualitative and quantitative indicators enable the ecological restoration of these sites. In this context, the main difficulty consists of establishing the A horizon, capable of supporting the emergence of other horizons, choosing appropriate species, and adding organic matter to the soil in a balanced way. Thus, this study aimed to evaluate over time (1992 to 2022) the chemical properties of a stripped oxisol that has been in the recovery process for 30 years, using liming, gypsum, and plant species. All treatments were cultivated with Urochloa decumbens (Stapf.) in 1999 and tree species in 2010, and the contents of phosphorus, organic matter, pH, and base saturation. ANOVA and Scott–Knott test (5%), Pearson correlation, and response surface analysis were performed for each studied soil attribute. The results showed that the treatments with green manure + limestone + gypsum had the highest values of organic matter compared to the recovery treatments and that the treatments have been efficient in soil recovery. Therefore, the soil undergoing recovery showed an increase in P, OM, pH, and base saturation until 2011, and the response surface method was the most efficient in analyzing the results over time.

1. Introduction

The construction of the Ilha Solteira Hydroelectric Power Plant on the Paraná River, between the states of São Paulo and Mato Grosso do Sul (Brazil), in the 1960s left behind extensive degraded areas known as “borrowed areas” and characterized by the removal of the vegetation and superficial soil horizons [1].
As a consequence of the construction, several areas, annexed or not to the body of work, tend to suffer accentuated degradation, which manifests itself in the form of a rupture in the balance between the lithosphere (especially in its most fragile portion, the soils), the hydrosphere and the biosphere (especially the vegetation cover). Therefore, the preservation of ecosystems requires, in principle, preserving the original characteristics of the object in question; thus, it is necessary to use elements and techniques similar to those that gave rise to the object to restore, in addition to controlling the agents that lead to the mischaracterization or its degeneration.
The resolution of contemporary environmental problems contributes to a better understanding of the study of ecological succession [2]. According to Prach [3], restoration practices clearly benefit from the results of successional studies.
According to Bonini [4], when planning the recovery of degraded soil, the main objective to be achieved is the establishment of an A horizon so that, from there, the process is catalyzed by the biosphere, providing the possibility of the emergence of other horizons, according to natural conditioning. In soil restoration work, the initial activity is to identify and characterize the active degradation processes and analyze their environmental consequences. Thus, it is necessary to use indicators that allow us to qualify and quantify the degree of existing degradation in the area to restore as well as to monitor the evolution of soil rehabilitation through these indicators afterward [5].
The use of different techniques to recover degraded soils has become more and more frequent. In this regard, the use of waste has been reported as a possibility to reduce costs with mineral fertilizers, in addition to being an alternative for final disposal [6,7,8,9,10,11]. Several types of waste have been used in recovery actions in the Cerrado. Several studies have been carried out with the objective of verifying which materials (green manure, mineral fertilizer, sewage sludge, slag, waste from pulp production) added to the soil are more efficient in enriching soil organic matter [2,12,13].
The soil chemical properties of tropical soils have characteristics peculiar to the Cerrado biome [11]. The low content of organic matter and phosphorus and the high pH of the soil are the main characteristics. These characteristics are interconnected and are favored by the hot and humid climate, providing a very rapid degradation of soil organic matter. The main challenge in the management of Cerrado soils is the enrichment and maintenance of the soil’s organic matter content. In the recovery of degraded soils, the challenge is even greater due to the low resilience of these soils and the lack of material for regenerating this soil.
With the increase in organic matter in the soil, there is an increase in pH and, with it, greater availability of all essential nutrients for plant development, thus creating a favorable environment for the development of organisms in the soil that will act to improve the chemical and physical qualities of the soil. With the action of soil organisms, there is an improvement in soil structure by increasing cementing agents and mechanical action.
According to Machado [14], the effect of limestone application goes beyond the increase in pH and emphasizes that in oxisols, loads are dependent on pH, which can favor clay dispersion, also providing Ca+2, which works as a binder between clay particles. Not forgetting the indirect effects of increasing crop production, the addition of OM, and microbial activity.
Soil degradation has negatively altered the quality of soil chemical properties, compromising plant development, as it alters the organic matter content, increasing the challenge in soil management; that is, it makes it difficult to enrich and maintain this chemical attribute [15,16,17,18]. Research has been carried out aiming to contribute with techniques for a higher addition of organic matter to soils using plant species, mineral fertilizers, and residues [7,19,20].
The intensive use of the soil and inadequate production practices cause changes in the landscape, thus altering the microbial biomass and the composition and diversity of the edaphic macro- and mesofauna, which are important factors in the process of fragmentation and redistribution of plant residues, mineralization, and humification of soil organic matter [21,22].
The effects of the interaction of the quantity and quality of organic materials, the used species, and the climate conditions of the location are important for understanding the results in the process of recovering soil chemical properties [6,23]. In addition, the use of gypsum and alternative co-products is of paramount importance in soil recovery [2,9,24].
The increase in soil organic matter leads to an increase in pH and hence a higher availability of all essential nutrients for plant development. Thus, it creates a favorable environment for the development of organisms that will act to improve the soil’s chemical and physical qualities. The action of soil organisms causes an improvement in soil structure by increasing cementing agents and mechanical action [20].
With that, it is expected that in this work, the addition of correctives and soil conditioners can accelerate the process of recovery of soil fertility quality. They aimed to evaluate the chemical properties of a degraded oxisol that has been in the process of recovery for 30 years, using liming, gypsum, and plant species over time by different analysis methods aiming at its recovery of the fertility quality of the soil and the best treatment to be used over time.

2. Materials and Methods

The experiment was carried out at the Farm for Teaching, Research, and Extension of Unesp, in the municipality of Selvíria/MS, Brazil, located in the northwest region of the State of São Paulo, between the coordinates 20°22′ S and 51°22′ W (Figure 1a), and altitude around 327 m above sea level. The mean annual temperature is 23.5 °C, and the mean annual precipitation is 1370 mm. The characteristic soils of the study region present a sandy clay loam texture, are rich in sesquioxides, and are classified as Latossolo Vermelho-Escuro distrófico [25], that is, oxisols [26].
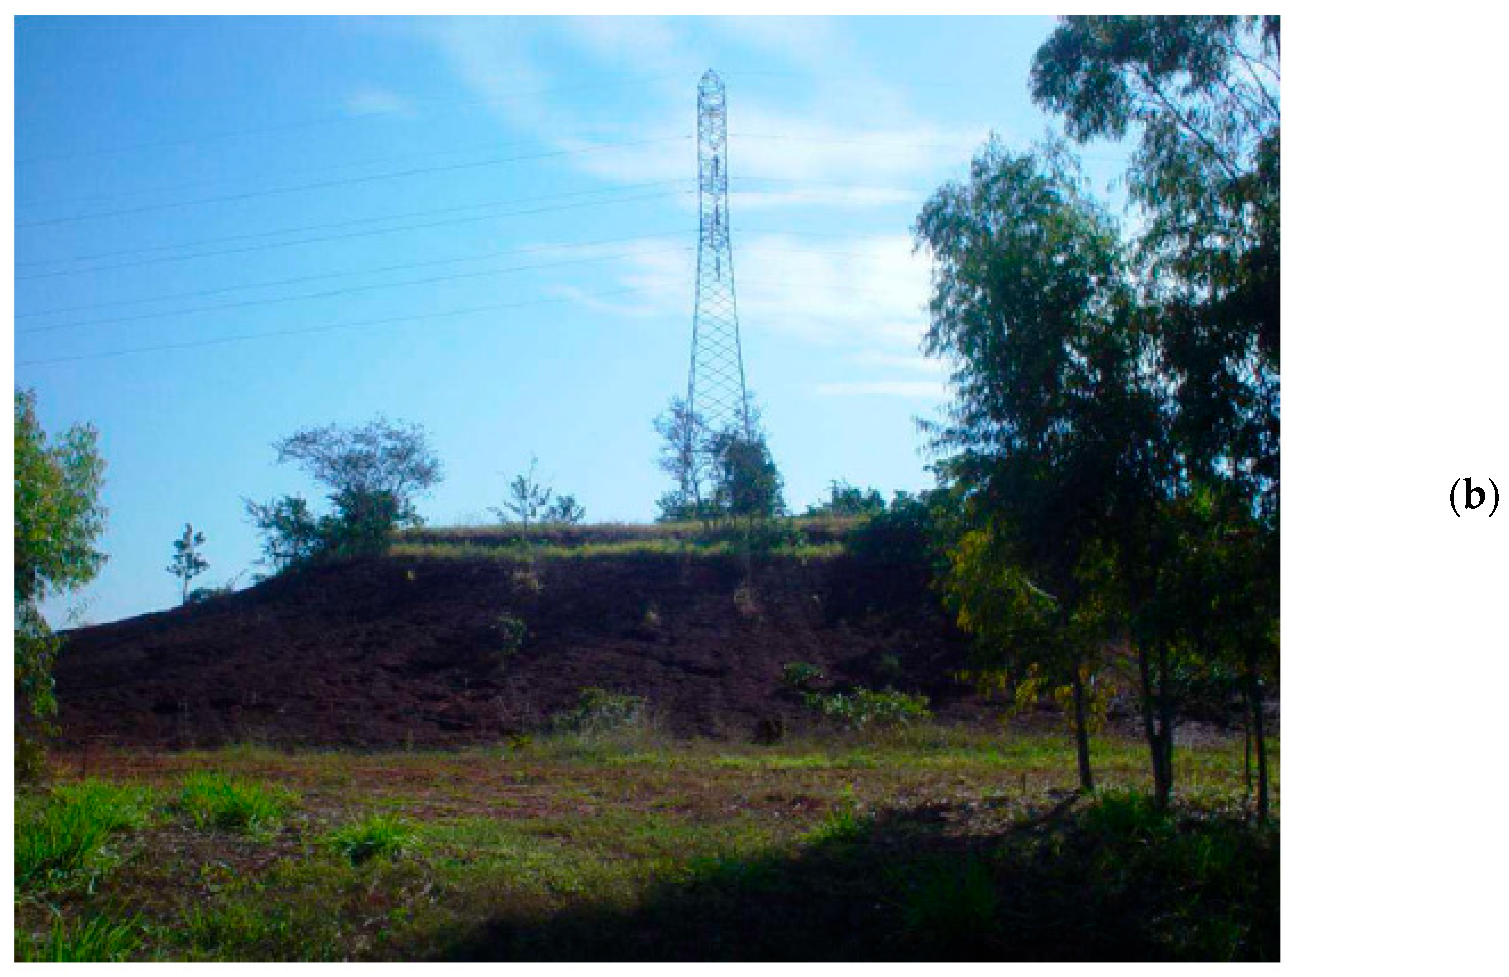
A layer of 8.6 m of the original soil profile was removed in the area under study (Figure 1b) for the earthworks and foundation of the dam for the construction of the hydroelectric plant of Ilha Solteira-SP, which began in the 1960s, and the subsoil had been exposed since 1969, creating a degraded area [27].
In 1992, the subsoil showed surface compaction and a low presence of spontaneous vegetation. The recovery work began that year, and soil tillage was carried out by subsoiling, reaching an average depth of 0.40 m. A plowing operation was also carried out, followed by a harrowing leveling operation. The chemical characterization of the area was carried out, as shown in Table 1.
Soil correction was based on the chemical characterization of the experimental area. Green manure species (velvet bean, pigeonpea, black oats, and jack bean) were manually sown from 1992 to 1996 in December–January. Corn (Zea mays L.), black oats (Avena strigosa Schreb), and signalgrass (Urochloa decumbens Stapf.) were sown in 1997, 1998, and 1999, respectively.
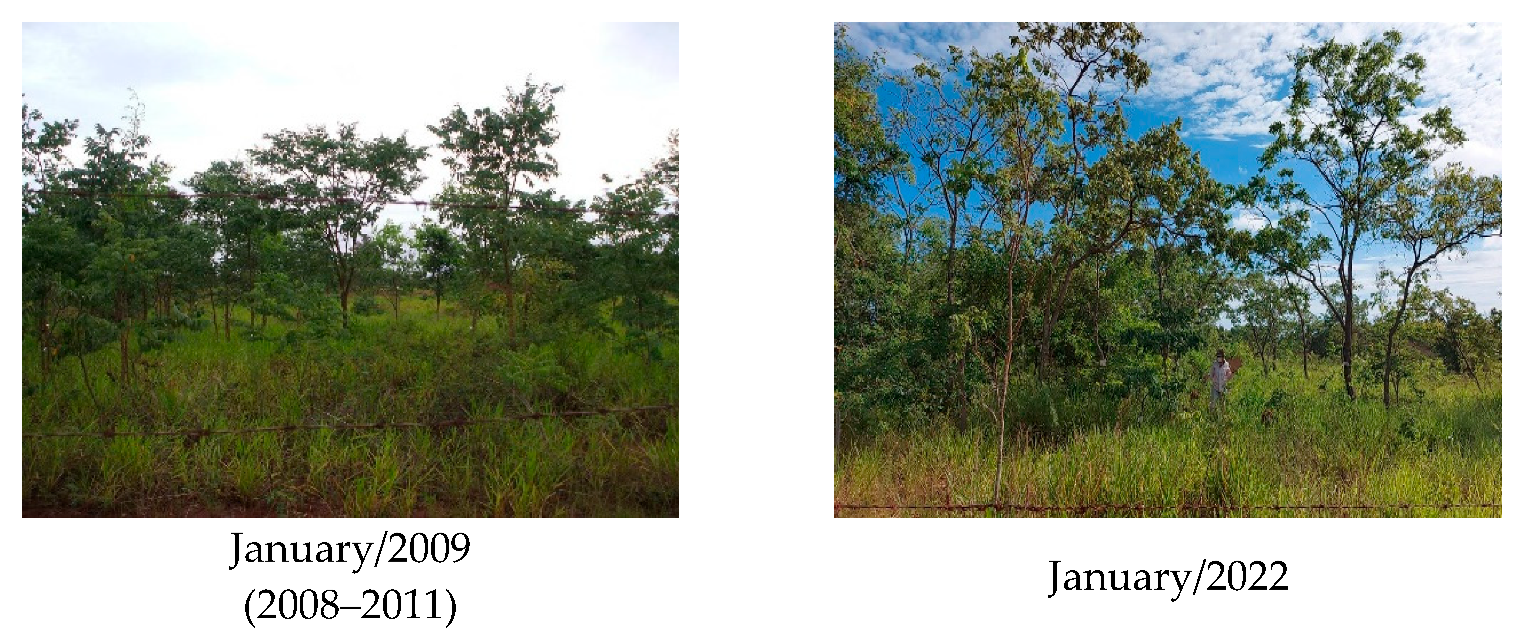
Tree species native to the Cerrado appeared naturally in 2006 as quality indicators of the stripped oxisol. Some physical and chemical soil properties, as well as signalgrass dry mass and the height and diameter of these species, were studied from 2008 to 2012. The area has been cultivated with U. decumbens (Stapf.) from 2014 to date [11].
With 14 to 15 years of influence of treatments on soil recovery, native tree plant species began to appear spontaneously in the study area. In the recovery of degraded areas, the ecosystem and the resilience of the site must be taken into account. It can be seen that, of the three species that regenerated naturally in the study area, two belonged to the Fabaceae Family (M. lacticifera and M. acutifolium), which are considered essential for the successful recovery of a degraded area due to their hardiness and high capacity to add organic matter to the soil. In order to determine which species, how, and when to introduce them in the area to be restored, it is much more important to take into account the natural succession of the area rather than being restricted to species according to their classification in successional ecological groups [2].
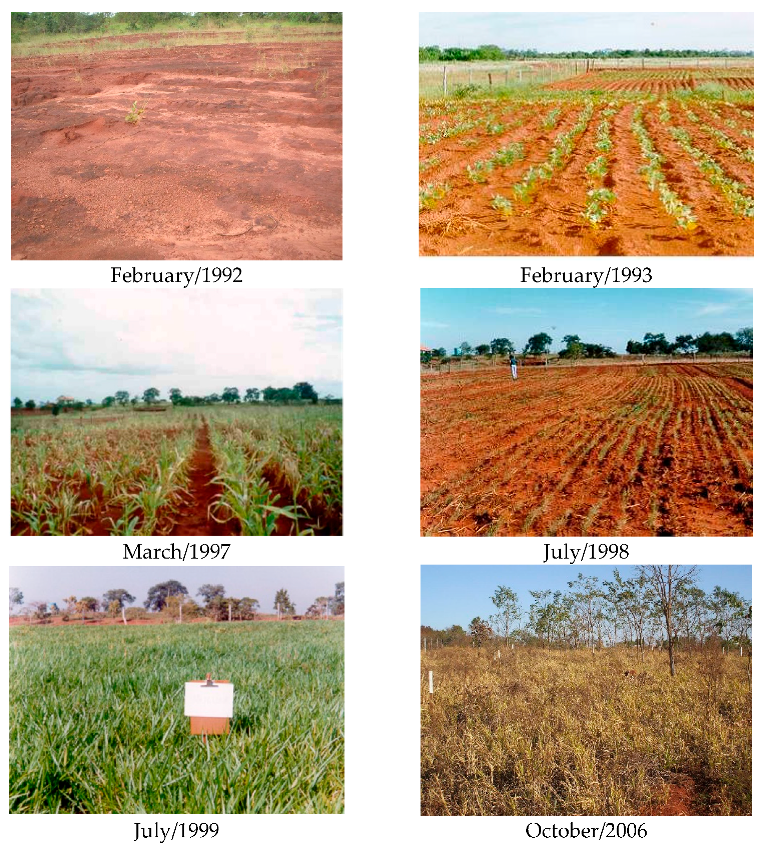
Photographic records were conducted in all studied periods (Figure 2), which are important to establish relationships with the soil data in this study.
Plots of 10 × 10 m were used for the experimental design, which consisted of randomized blocks with 2 m spacing from each other, with the application of seven treatments and four replications, as presented in Table 2.
Soil samples were collected in 1993, 1995, 1997, 1998, 2008, 2009, 2010, 2011, and 2022 from the 0.00–0.10 and 0.10–0.20 m layers for analysis.
They were analyzed according to the methodology described by Raij [27], phosphorus (P) content by the extraction method with ion-exchange resin, organic matter content was determined by the colorimetric method, and the pH in calcium chloride and base saturation, calculated as V% = (100 × SB)/CEC).
The data were analyzed by ANOVA and Scott–Knott test at a 5% probability level using the software SISVAR [28], Pearson correlation (Excel), and surface plots (MATLAB) for each studied soil attribute.

3. Results and Discussion

The data were evaluated using conventional statistics (ANOVA and Scott–Knott test at 5%), the correlation between attributes, and surface plots as a function of years and treatments. The analysis methodologies were different, but the results were similar, except for the correlation.
All soil fertility attributes were studied, but only the one that obtained significant changes over the study period is shown.
Table 3 shows the correlations of the studied soil attributes. Soil pH and V (%) in the two studied soil layers showed positive correlations higher than 0.6, as well as P with OM in the first soil layer. This behavior confirms the relationship between soil variables and shows that the OM contribution is important for the increment of nutrients in the soil, as well as the pH correction in the increase in base saturation, in agreement with Bonini [20].
The soil organic material is very important in the recovery process; in its mineralization process, it provides the soil with exchangeable cations, which are used for plant nutrition. The soil pH, when close to neutrality, immobilizes the aluminum present in the soil and makes calcium, potassium, and magnesium available to the plant, increasing base saturation.
Still corroborating this study, improvements in soil fertility due to the use of forest species in the recovery of degraded areas were observed by Giacomo [7] in a degraded area using residues from the pulp and paper industry, mainly because they serve as vegetation cover with tree species, protecting the soil from climate agents, maintaining and adding organic matter to the soil, mobilizing and recycling nutrients, and favoring soil biological activity. The other correlations were negative or very low and cannot be an indication of the soil attributes studied in this research.
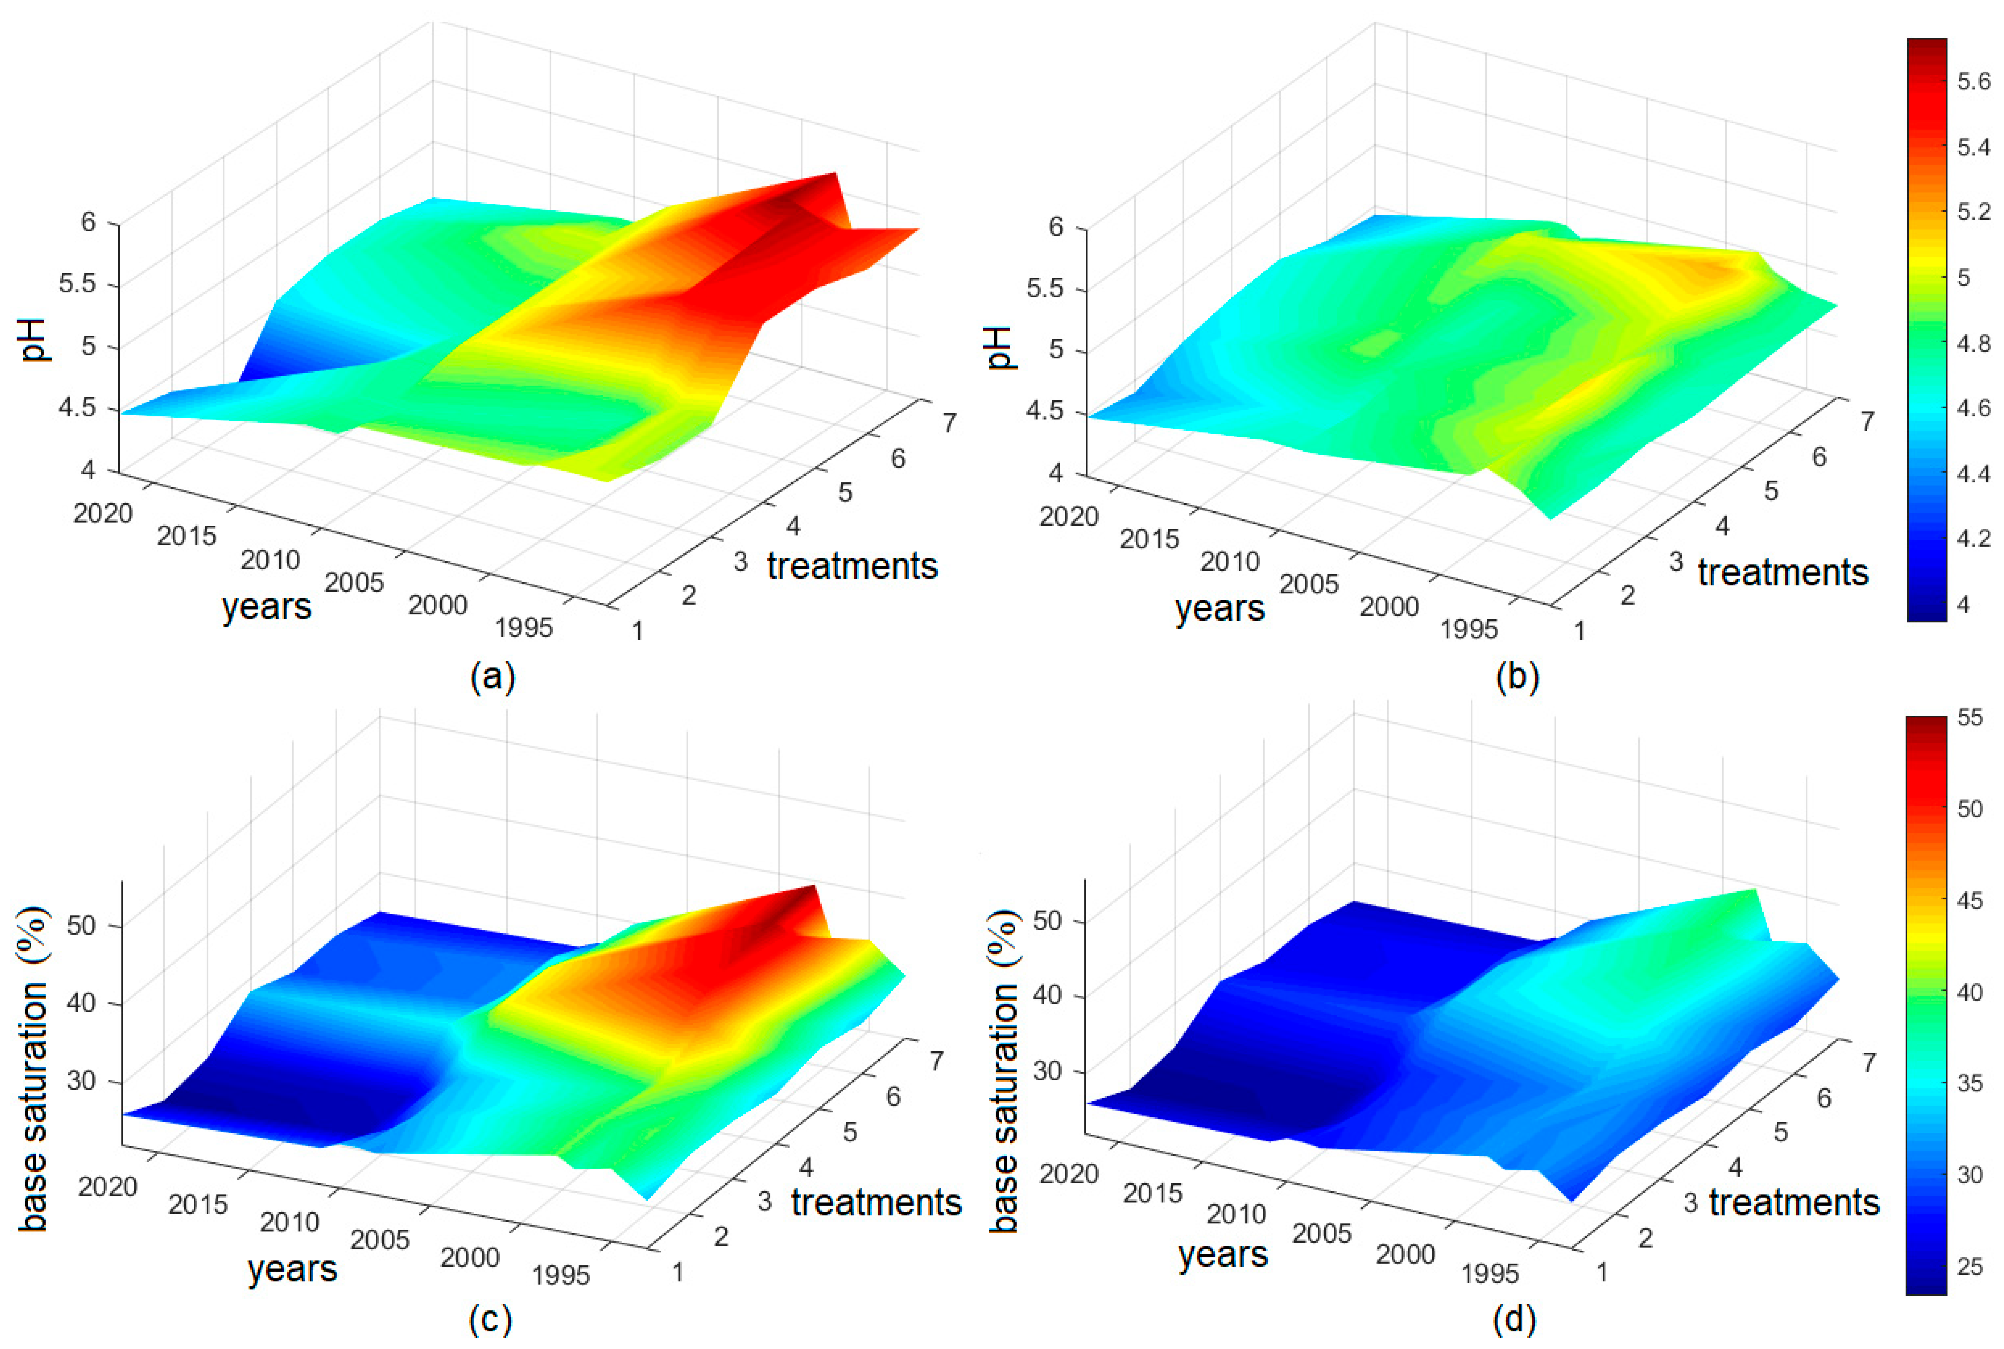
Figure 3 and Figure 4 show the response surfaces with the behavior of the soil attributes studied over 30 years as a function of the treatments. The analysis provides evidence that the first soil layer was more influenced by the treatments, mainly due to the soil protection by the vegetation cover present in the area (Figure 2).
The highest phosphorus contents were detected in the soil in 2010 and 2011, which is due to organic matter mineralization. A significant increase in tree species was observed in the area and, consequently, higher consumption of nutrients for the maintenance of plant biomass, leading to a reduction in phosphorus content from 2015.
The organic matter in the first soil layer increased throughout the studied period, showing the relation of its contribution to the vegetation present in the area. This behavior was already smaller in the area in the second soil layer. Similar data were found by Rossi [17], who studied soil carbon and reported a positive influence on vegetation and soil carbon content and phosphorus availability.
In addition, the increase in OM in the soil acts positively in the recovery process, either by providing nutrients from mineralization or also by better soil structuring (physical quality), which interferes with soil porosity and aeration [6,7,11].
Treatments with limestone and/or limestone + gypsum addition differed in the analysis of soil pH (Figure 4). However, the effect dissipated over 30 years, which indicates that a new soil correction can improve this index and increase V%, corroborating the correlation analysis (Table 3). Base saturation showed the same behavior as soil pH. Importantly, the values found in this study are below those recommended by the literature for this type of soil, according to Raij [27]. I still agree with Mota [2], who studied areas of gypsum mined over time and found that the residual effect of gypsum contributes to the primary succession of areas, as occurs in this work.
Table 4 shows the mean values of soil attributes, F (5%), and coefficients of variation as a function of treatments and years of evaluation in the 0.00–0.10 and 0.10–0.20 m layers. There was a significant difference between treatments, soil depth, and years of evaluation for phosphorus, organic matter, pH, and base saturation.
Phosphorus contents were very low in 1993, 1995, 1997, and 1998. The treatments showed the same mean value for phosphorus until 1998, but a small variation was identified in the concentrations from that period in the treatments with green manures and soil correction, as well as in the control (disturbed soil).
The highest phosphorus contents were found in 2008, 2009, 2010, and 2011, but these values are classified as low. However, the treatment with limestone plus pigeonpea in 2009 and 2011 differed from the others and the control, presenting a much higher value than that found in the other treatments in the 0.00–0.10 m layer. Similar results were found by Bonini [11], who studied chemical attributes in this same experimental area and obtained the highest phosphorus value in the application of the treatment with limestone plus pigeonpea.
The treatment with limestone + pigeonpea had the highest phosphorus content and differed statistically from the others in the 0.10–0.20 m layer in 2008. In contrast, the velvet bean treatment had the highest phosphorus contents in 2009, 2010, and 2011, not differing from the other treatments and the control. An increase in the phosphorus content was observed compared to the previous period, which shows the efficiency of the conservationist practices adopted for the recovery and improvement of this chemical property.
This parameter presented a very low result in 2022, close to that obtained in 1998 in the fertile soil layer, whose mean content should be 13–30 mg·dm−3 for perennial crops, according to Raij [27]. Treatment with velvet bean presented the highest phosphorus contents in the 0.00–0.10 m layer, not differing from the other treatments. In contrast, the treatments with velvet bean and limestone + gypsum + pigeonpea showed the highest phosphorus contents in the 0.10–0.20 m layer, not differing from the other treatments. Compared to the previous period, the treatments showed no efficiency in soil recovery for phosphorus contents.
Cordeiro and Rosolem [29,30] studied the dynamics of phosphorus in the soil and identified that signalgrass cultivation promotes an increase in the activity of the acid phosphatase enzyme, which may favor the increase in phosphorus adsorption because it is an excellent host for mycorrhizal fungi. According to Baptistella [31], signalgrass can benefit from the water available in the subsurface and absorb more phosphorus since it can explore deeper soil layers.
Table 5 shows the mean values for soil organic matter in the 0.00–0.10 m layer. The values of organic matter were the lowest in 1993, 1995, 1997, and 1998 when compared to the other years of study. On average, the control obtained the lowest organic matter contents, while the highest values were identified with the velvet bean treatment, not statistically different from the other treatments. The organic matter content in the 0.10–0.20 m layer showed slightly lower values but did not differ from each other.
The organic matter content increased significantly in 2008 compared to 1998 in the two soil layers. A small increase in the content was observed from 2008 to 2009 in the 0.00–0.10 m layer, remaining constant in 2010 and 2011. However, these contents are classified as low because the content should be between 16 and 30 g·dm−3, according to Raij [27], confirming the characteristic of soils in the Cerrado biome.
The treatment with pigeonpea and limestone + gypsum + velvet bean showed the highest organic matter contents, but there was a decrease in the content in 2009 in the 0.10–0.20 m layer, remaining constant in 2010 and 2011.
Bonini Neto [20] identified statistical differences between all treatments applied for soil recovery in 2010 and 2011 in all soil layers and stated that recovery treatments reached the 0.00–0.10 and 0.10–0.20 m layers because recovery treatments provided higher organic matter contents in these layers. A significant increase in soil organic matter was observed in 2022, with the highest values in treatments with velvet bean and limestone + gypsum + pigeonpea, reaching a content of 16.3 g·dm−3 in the soil of the Cerrado according to Raij [27], statistically differing from the control and the treatments with pigeonpea and limestone + pigeonpea.
Table 6 shows the mean soil pH values in the 0.00–0.10 m layer. The highest mean pH values in 1993, 1995, 1997, and 1998 were obtained with the limestone + velvet bean treatment, statistically differing from the control and treatment with velvet bean and pigeonpea. The 0.10–0.20 m layer showed no significant difference between treatments in 1993 and 1995, but the treatment with limestone + gypsum + velvet bean differed statistically from the control (Table 6). The pH values for the treatments classify the acidity from high to medium (pH between 4.4 and 5.5), according to Teran [18].
The pH values in 2008, 2009, 2010, and 2011 decreased, on average, in most of the treatments with no statistical differences, with the treatment with limestone + gypsum + velvet bean showing the highest pH value, remaining constant in both soil layers (Figure 4).
Bonini [6] demonstrated that the pH of the recovery treatments acted similarly in all layers for 2010 and 2011 and differed from the control (native vegetation of Cerrado). Cerrado soils are slightly acidic, and the recovery treatments were efficient, thus leading to a higher pH than the control (native vegetation of Cerrado). The pH in the surface layer was due to the contribution of signalgrass in the addition of organic matter in all experimental plots.
A new decrease in pH values was identified in 2022, with the treatment with limestone + pigeonpea and limestone + gypsum + velvet bean showing the highest pH value, differing statistically from the treatment with pigeonpea in the 0.00–0.10 m layer. The treatments with limestone + pigeonpea and limestone + velvet bean had the highest pH value in the 0.10–0.20 m layer but did not differ from the other treatments. In this case, the treatments with soil correction are no longer taking effect (see response surface in Figure 4).
According to Oliveira [32], organic matter may have been mineralized, and nutrients were released and absorbed by the plant. Thus, hydrogen and aluminum ions remained in the soil, which contributed to the pH reduction.
Table 6 shows the soil base saturation values in the 0.00–0.10 m layer. A significant difference was observed between the treatments in 1993, 1997, and 1998, with the highest content in the limestone + velvet bean treatment. No statistical difference was observed between treatments in 1995, with limestone + velvet bean and limestone + gypsum + velvet bean treatments showing the highest values.
The years 2008, 2009, 2010, and 2011 presented a decrease in the values of the sum of bases, with no statistical difference between treatments. The treatment with limestone + gypsum + velvet bean had the highest value. A decrease in the values was identified in the 0.10–0.20 m layer, and the treatment with limestone + velvet bean presented the best result (Figure 4).
According to Siqueira [17], the low base saturation indicates a small number of base-forming cations saturating the negative charges of colloids, and most of them are neutralized by H+ and Al3+, which contributes to soil acidity.
No statistical difference was observed between treatments in 2022, with the treatment with limestone + gypsum + velvet bean showing the highest value in the 0.00–0.10 m layer and the treatment with limestone + pigeon in the 0.10–0.20 m layer.
According to Teran [18], fertile soil presents a base saturation (V%) higher than 50%, and lower results are found in non-fertile or low-fertility soils. The obtained values are considered low, indicating acidic soil.

4. Conclusions

We can conclude that over time, the recovery treatments were efficient in positively improving soil fertility. The study carried out in 2022 showed that a new anthropic intervention is necessary for the levels of soil attributes to continue to recover.
The chemical attributes were suitable indicators of soil quality, standing out the treatment with velvet bean as the most efficient in the degraded soil recovery. The main evolution was identified in 2008 and was very expressive in 2009.
The response surface was the method that facilitated the visualization of results over time.

Author Contributions

J.L. formal analysis and resources; C.d.S.B.B. conceptualization, data curation, and writing—review and editing; M.A. validation and writing—review and editing; M.C.A. conceptualization and writing—original draft; A.B.N. formal analysis and data curation; M.A.S. methodology and formal analysis; V.C.d.M.B. supervision; R.W.R.d.F. investigation. All authors have read and agreed to the published version of the manuscript.

Funding

This research was funded by FAPESP (2009/50066-2).

Institutional Review Board Statement

Not applicable.

Informed Consent Statement

Not applicable.

Data Availability Statement

The data presented in this study are available on request from the corresponding authors.

Acknowledgments

The authors would like to extend their sincere appreciation to the FAPESP for the master’s and doctoral scholarship (Proc. 2009/54804-8 and 2008/50853-1) and financial support for the research project (2009/50066-2).

Conflicts of Interest

The authors declare no conflict of interest.

References

  1. Fardin, F.H.; Maltoni, K.L.; Boni, T.S.; Faria, G.A.; Rezende, A.A. Restauração ecológica de subsolo exposto condicionado com resíduos no Cerrado. Sci. For. 2021, 49, e3452. [Google Scholar] [CrossRef]
  2. Mota, J.F.; Martínez-Hernández, F.; Salmerón-Sánchez, E.; Mendoza-Fernández, A.J.; Pérez-García, F.J.; Merlo, M.E. Spontaneous Primary Succession and Vascular Plant Recovery in the Iberian Gypsum Quarries: Insights for Ecological Restoration in an EU Priority Habitat. Plants 2023, 12, 1162. [Google Scholar] [CrossRef] [PubMed]
  3. Prach, K.; Walker, L.R. Four opportunities for studies of ecological succession. Trends Ecol. Evol. 2011, 26, 119–123. [Google Scholar] [CrossRef] [PubMed]
  4. Bonini, C.S.B.; Maciel, T.M.S.; Moreira, B.R.A.; Chitero, J.G.M.; Henrique, R.L.P.; Alves, M.C. Long-Term Integrated Systems of Green Manure and Pasture Significantly Recover the Macrofauna of Degraded Soil in the Brazilian Savannah. Soil. Syst. 2023, 7, 56. [Google Scholar] [CrossRef]
  5. Neto, A.B.; Bonini, C.D.S.B.; Bisi, B.S.; dos Reis, A.R.; Coletta, L.F.S. Artificial neural network for classification and analysis of degraded soils. IEEE Lat. Am. Trans. 2017, 15, 503–509. [Google Scholar] [CrossRef] [Green Version]
  6. Kitamura, A.E.; Tavares, R.L.M.; Alves, M.C.; Souza, Z.M.; Siqueira, D.S. Soil macrofauna as bioindicator of the recovery of degraded Cerrado soil. Cienc. Rural 2020, 50, 1–8. [Google Scholar] [CrossRef]
  7. Giácomo, R.G.; Alves, M.C.; Arruda, O.G.; Souto, S.N.; Pereira, M.G.; Moraes, M.L.T. Atributos químicos de um solo degradado após aplicação de composto orgânico e crescimento de Mabea fistulifera Mart. Cienc. Florest. 2019, 29, 754–768. [Google Scholar] [CrossRef] [Green Version]
  8. Silva, J.H.C.S.; Barbosa, A.S.; Gomes, D.S.; Aquino, I.S.; Silva, J.R. Dynamics of plant organic matter decomposition in different agricultural landscapes. Rev. Caatinga 2023, 36, 135–144. [Google Scholar] [CrossRef]
  9. Souto Filho, S.N.; Alves, M.C.; Monreal, C.M.; Bonini, C.S.B. Nanoparticles and nanostructure morphology of a Red Latosol in rehabilitation. Rev. Bras. Eng. Agríc. Ambiental 2017, 21, 530–536. [Google Scholar] [CrossRef] [Green Version]
  10. Boni, T.; Pujol Pereira, E.I.; Avelino Santos, A.; Rodrigues Cassiolato, A.M.; Maltoni, K.L. Biomass residues improve soil chemical and biological properties reestablishing native species in an exposed subsoil in Brazilian Cerrado. PLoS ONE 2022, 17, e0270215. [Google Scholar]
  11. Bonini, C.S.B.; Alves, M.C.; Montanari, R. Lodo de esgoto e adubação mineral na recuperação das propriedades químicas de um solo degradado. Rev. Bras. Eng. Agríc. Ambiental 2015, 19, 388–393. [Google Scholar] [CrossRef]
  12. Mizobata, K.K.G.S. Alterações de Atributos Físicos de Subsolo Revegetado e Condicionado com Resíduos, Para Recuperação de Ambiente Degradado no Cerrado. Master’s Thesis, Faculdade de Engenharia, Universidade Estadual Paulista, Ilha Solteira, Brazil, 2017. [Google Scholar]
  13. Machado, K.S.; Maltoni, K.L.; Santos, C.M.; Cassiolato, A.M.R. Resíduos orgânicos e fósforo como condicionantes de solo degradado e efeitos sobre o crescimento inicial de Dipteryx alata Vog. Cienc. Florest. 2014, 24, 541–552. [Google Scholar] [CrossRef] [Green Version]
  14. Machado, P.L.O.A.; Benites, V.M.; Bolan, N. Liming Acidic Soils Recarbonizing Global Soils: A Technical Manual of Recommended Sustainable Soil Management. Available online: http://www.fao.org/documents/card/en/c/cb6595en2021 (accessed on 1 June 2023).
  15. Matos, A.M.S.; Bonini, C.S.B.; Moreira, B.R.A.; Andreotti, M.; Heinrichs, R.; Silva, D.T.; Souza, J.A.L.; Santos, M.A.; Andrighetto, C.; Pavan, G.M.; et al. Long-Term Integrated Crop–Livestock–Forestry Systems Recover the Structural Quality of Ultisol Soil. Agronomy 2022, 12, 2961. [Google Scholar] [CrossRef]
  16. Lal, R. Restoring Soil Quality to Mitigate Soil Degradation. Sustainability 2015, 7, 5875–5895. [Google Scholar] [CrossRef] [Green Version]
  17. Siqueira, C.C.Z. Atributos do Solo E Estoques de Carbono em Sistemas Agroflorestais na Restauração de Áreas Degradadas. Master’s Thesis, Instituto Agronômico, Campinas, Brazil, 2017. [Google Scholar]
  18. Rossi, C.Q.; Pinto, L.A.S.R.; Moura, O.V.T.; Loss, A.; Pereira, M.G. Soil organic matter in biogenic, intermediate and physicogenic aggregates under agroecological management. Rev. Caatinga 2023, 36, 167–176. [Google Scholar] [CrossRef]
  19. Teran, F.J.C.; Oliveira Santos, G.; Júnior, W.T.; Freitas, E.C.B.; Soares, J.A. Avaliação da recuperação de áreas degradadas por exploração de cascalho laterítico por meio da incorporação de lodo de esgoto. Estudo de caso no Distrito Federal. Braz. J. Anim. Environ. Res. 2022, 5, 2973–2984. [Google Scholar] [CrossRef]
  20. Bonini Neto, A.; Bonini, C.S.B.; Reis, A.R.; Piazentin, J.C.; Coletta, L.F.S.; Putti, F.F.; Heinrichs, R.; Moreira, A. Automatic Recovery Estimation of Degraded Soils by Artificial Neural Networks in Function of Chemical and Physical Attributes in Brazilian Savannah Soil. Comm. Soil Sci. Plant Anal. 2019, 50, 1785–1798. [Google Scholar] [CrossRef]
  21. Araujo, K.D.; Souza, M.A.; Santos, G.R.; Andrade, A.P.; Ferreira Neto, J.V. Atividade microbiana no solo em diferentes ambientes da região semiárida de Alagoas. Geografia 2016, 25, 5–18. [Google Scholar]
  22. Hoffmann, R.B.; Lima, S.V.; Hoffmann, G.S.S.; Araújo, N.S.F. Efeito do uso do solo sobre a macrofauna edáfica. Braz. J. Anim. Environ. Res. 2018, 1, 125–133. [Google Scholar]
  23. De Oliveira Silva, M.; Veloso, C.L.; do Nascimento, D.L.; de Oliveira, J.; de Freitas Pereira, D.; da Silva Costa, K.D. Indicadores químicos e físicos de qualidade do solo. Braz. J. Dev. 2020, 6, 47838–47855. [Google Scholar] [CrossRef]
  24. Albuquerque, A.S.; Fonsêca, N.C.; Santos, R.V. Aplicação de corretivos alternativos em solo salinizado com cultivo de Sorghum bicolor L. Rev. Verde 2018, 13, 452–458. [Google Scholar] [CrossRef]
  25. Santos, H.G.; Jocomine, P.K.T.; Anjos, L.H.C.; Oliveira, V.A.; Lumbrearas, J.F.; Coelho, M.R.; Almeida, J.A.; Araújo Filho, J.C.; Oliveira, J.B.; Cunha, T.J.F. Brazilian System of Soil Classification (Sistema Brasileiro de Classificação de Solos), 5th ed.; Embrapa: Rio de Janeiro, Brazil, 2018; p. 286. [Google Scholar]
  26. Soil Survey Staff. Keys to Soil Taxonomy, NRCS, 12th ed.; EUA: Washington, DC, USA, 2014.
  27. Alves, M.C.; Nascimento, V.; Souza, Z.M. Recovery of nativa area used for construction of hydroelectric power station. Rev. Bras. Eng. Agríc. Ambiental 2012, 16, 887–893. [Google Scholar] [CrossRef] [Green Version]
  28. Raij, B.; van Andrade, J.C.; Cantarella, H.; Quaggio, J.A. Análise Química Para Avaliação da Fertilidade de Solos Tropicais; IAC: Sao Paulo, Brazil, 2001. [Google Scholar]
  29. Ferreira, D.F. SISVAR: A computer statistical analysis system. Ciência Agrotecnologia 2011, 35, 1039–1042. [Google Scholar] [CrossRef] [Green Version]
  30. Cordeiro, S.M.A.; Carneiro, M.A.C.; Paulino, H.B.; Sagging Junior, O.J. Colonização E Densidade De Esporos De Fungos Micorrízicos Em Dois Solos Do Cerrado Sob Diferentes Sistemas De Manejo. Pesqui. Agropecu. Trop. 2005, 35, 147–153. [Google Scholar]
  31. Rosolem, C.A.; Merlin, A.; Bull, J.C.L. Soil phosphorus dynamics as affected by Congo grass and P fertilizer. Sci. Agric. 2014, 71, 309–315. [Google Scholar] [CrossRef]
  32. Oliveira, I.P.; Cunha, R.; Santos, R.S.M.; Faria, C.D.; Cunha, G.F. Efeito da correção da fertilidade do solo no desenvolvimento da Brachiaria brizantha cv. Marandu em latossolo com diferentes históricos. Pesqui. Agropecu. Trop. 2000, 30, 57–64. [Google Scholar]
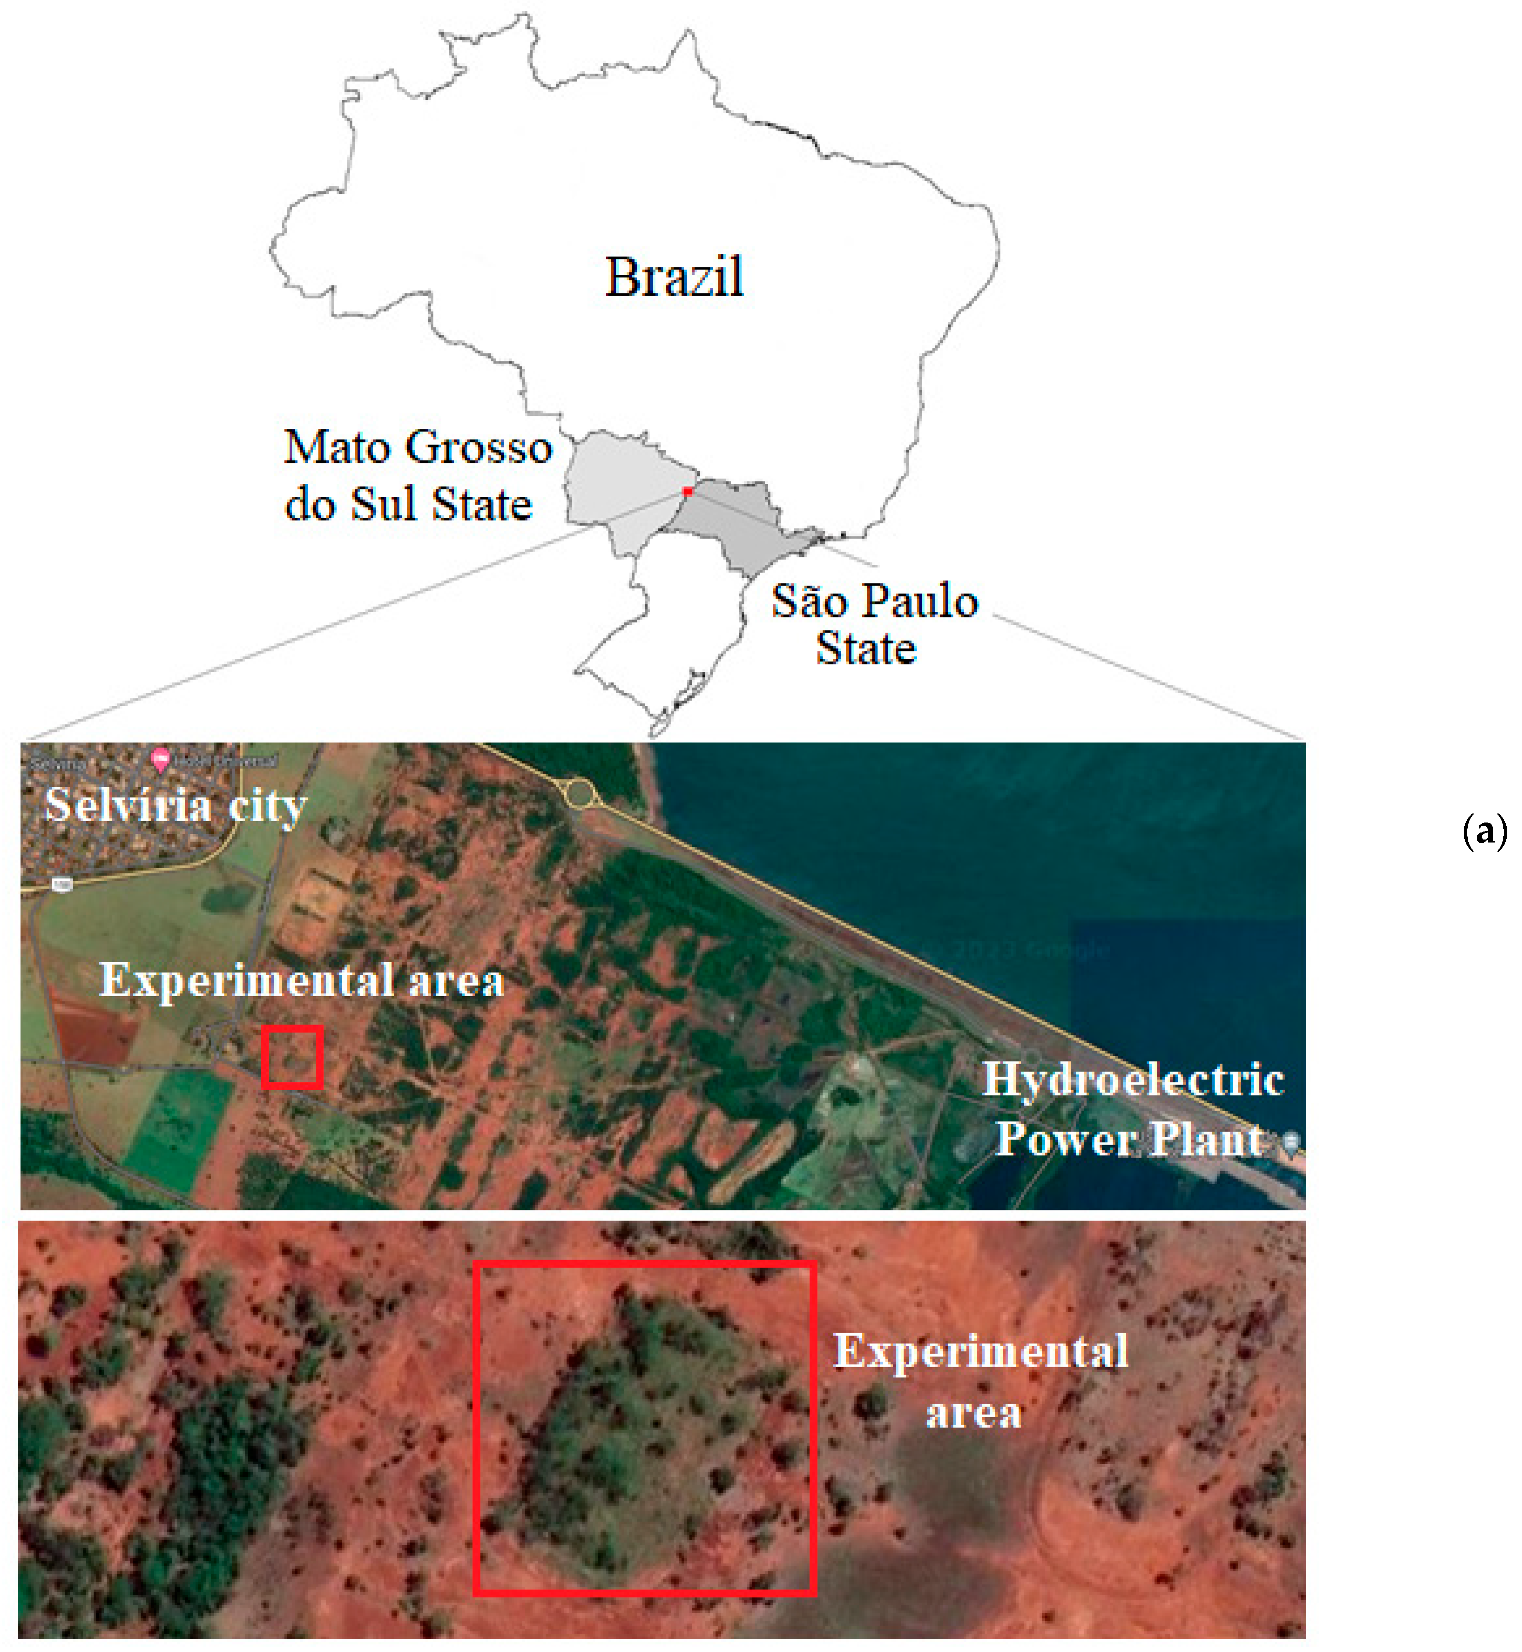
Figure 1. (a) Area map and (b) general view of the decapitated area showing the 8.6 m thick cut. Selviria—MS (Brazil).
Sustainability 15 10344 g001aSustainability 15 10344 g001b
Figure 2. Photographic record of the experimental area from 1992 to 2022, Selviria—MS (Brazil). (Source: author himself).
Sustainability 15 10344 g002aSustainability 15 10344 g002b
Figure 3. Response surface plots for phosphorus (mg·dm−3): (a) 0–0.10 m and (b) 0.10–0.20 m and organic matter (g·dm−3): (c) 0–0.10 m and (d) 0.10–0.20 m, depending on the years and treatments studied. Selviria—MS—Brazil. 1992–2022.
Sustainability 15 10344 g003
Figure 4. Response surface plots for pH: (a) 0–0.10 m and (b) 0.10–0.20 m and base saturation (%): (c) 0–0.10 m and (d) 0.10–0.20 m, depending on the years and treatments studied. Selviria—MS—Brazil. 1992–2022.
Sustainability 15 10344 g004
Table 1. Initial characterization (1992), Selviria—MS (Brazil) [21].
LayerPresinO.M.pH
(CaCl2)
KCaMgH + AlSCECV
mmg·dm−3g·dm−3mmolc·dm−3%
0.00–0.2017.04.00.22.01.020.03.223.214
0.20–0.4004.04.20.22.01.020.03.223.214
Table 2. Treatments used in the experimental area (1992–2022) Selviria—MS (Brazil).
TreatmentsTreatmentsCultures
(1992–1994)(1994–1997)19971998(1999–2008)(2009–2022)
DS/BTilling only, spontaneous vegetationTilling only, spontaneous vegetationZea maysAvena atrigosaU. decumbens+
Native tree species
VB/SStizolobium aterrimumStizolobium aterrimum
P/JB/SCajanus cajanCanavalia ensiformis
L + VB/SLime + Stizolobium aterrimumLime + Stizolobium aterrimum
L + P/JB/SLime + Cajanus cajanCanavalia ensiformis
L + G + VB/SLime + gypsum + Stizolobium aterrimumLime + gypsum + Stizolobium aterrimum
L + G + P/JB/SLime + gypsum + Stizolobium aterrimumCanavalia ensiformis
Keys: SA: Stizolobium aterrimum (Piper and Tracy); CC: Cajanus cajan (L. Millsp); CE: Canavalia ensiformis (L. DC); Zea mays (L.); Avena strigosa (Schieb) and Urochloa decumbens (Stapf.).
Table 3. Correlation of soil attributes studied (P (mg·dm−3), pH, OM (g·dm−3), and V (%)). Selviria—MS—Brazil. 1992–2022.
PP2OMOM2pHpH2VV2
P-0.6540.5430.269−0.0990.184−0.331−0.172
P2 -0.3280.171−0.0280.112−0.284−0.176
OM -0.807−0.3260.124−0.290−0.073
OM2 -−0.3140.049−0.2020.032
pH -0.4580.7790.370
pH2 -0.3250.615
V -0.473
V2 -
Legend: P = phosphorus, OM = organic matter, pH, V = base saturation in the 0.00–0.10 m layer; P2 = phosphorus, OM2 = organic matter, pH2, V2 = base saturation in the 0.10–0.20 m layer.
Table 4. Mean values and coefficients of variation for phosphorus (P)—mg·dm−3, organic matter (OM)—g·dm−3, pH, and base saturation (V)—%, depending on the treatments studied in the layers of 0.00–0.10 and 0.10–0.20 m. Selviria, MS (Brazil). 1993–2022.
TreatmentPOMpHVPOMpHV
0.00–0.10 m0.10–0.20 m
DS/B4.29 b6.484.71 b32.11 b2.134.304.52 b26.44
VB/S4.83 b7.844.65 b32.25 b2.715.234.54 b27.62
P/JB/S3.61 c7.774.61 b33.71 b2.304.584.63 b26.19
L + VB/S4.4 b7.225.10 a41.45 a2.135.004.82 a34.75
L + P/JB/S6.32 a7.225.10 a40.38 a2.864.884.72 a30.19
L + G + VB/S4.34 b7.475.13 a42.81 a2.254.754.96 a32.81
L + G + P/JB/S4.51 b7.595.00 a39.47 a2.404.774.74 a29.66
Subplot (year)
19932.00 d2.46 e5.07 a43.14 a2.00 c2.10 d4.42 c25.32 c
19951.00 e2.21 e4.95 a46.21 a1.00 d1.92 d4.49 c35.28 b
19971.25 e2.25 e5.09 a37.71 b1.46 d1.71 d4.61 c26.87 c
19982.71 c5.39 d5.17 a42.42 a1.96 c4.64 c5.13 a40.53 a
20087.35 b8.28 c4.96 a33.89 c4.00 a6.35 b4.71 b27.00 c
20098.75 a10.64 b4.80 b32.46 c3.28 b5.21 c4.83 b26.92 c
20107.55 b10.64 b4.80 b32.46 c3.28 b5.21 c4.83 b26.92 c
20118.75 a10.64 b4.80 b32.46 c3.28 b5.21 c4.83 b26.92 c
20222.18 d13.82 a4.45 c36.37 b1.33 d10.72 a4.50 c31.22 c
F treat (T)13.30 *1.70 *13.51 *6.47 *1.82 *2.98 *4.42 *2.70 *
F year (Y)308.16 *249.42 *11.61 *12.70 *49.76 *88.39 *11.51 *12.33 *
F T × Y8.21 *1.54 *3.02 *2.28 *1.10 *0.91 *1.84 *1.37 *
CV1(%)29.8328.747.7128.9652.2721.499.5039.77
CV2(%)22.0320.036.8520.9033.5532.997.4125.92
Means followed by equal letters in the column do not differ from each other by the Scott–Knott test at 5% probability. * Keys: DS/B = disturbed soil until 1999, then signalgrass implantation; VB/S = velvet bean until 1999, then replaced by signalgrass; P/JB/S = pigeonpea until 1994, then replaced by jack bean, and replaced again by signalgrass from 1999; L + VB/S = limestone + velvet bean until 1999, then replaced by signalgrass; L + P/JB/S = limestone + pigeonpea until 1994, then replaced by jack bean, and replaced again by signalgrass from 1999; L + G + VB/S = limestone + gypsum + velvet bean until 1999, then replaced by signalgrass; and L + G + P/JB/S = limestone + gypsum + pigeonpea until 1994, then replaced by jack bean, and replaced again by signalgrass from 1999. Native tree species planted in the area after 2010.
Table 5. Unfolding of the interaction between year of assessment and treatment regarding the mean values of P (mg·dm−3) and Om (g·dm−3) in the layers of 0.00–0.10 and 0.10–0.20 m. Selviria, MS (Brazil). 1993 to 2022.
Treatment/Year199319951997199820082009201020112022
(P) 0.00–0.10 m
DS/B2.00 BC1.00 ab1.00 ab1.75 bB7.50 aA7.75 ba7.75 aA7.75 ba2.12 AB
VB/S2.00 BC1.00 BC1.25 BC3.75 ab7.75 aA8.25 ba8.25 aA8.25 ba3.00 ab
P/JB/S2.00 BC1.00 BC1.50 BC2.50 BC7.00 aA5.50 cB5.50 bB5.50 cB2.00 BC
L + VB/S2.00 BC1.00 ab1.25 ab2.00 bB8.00 aA7.75 ba7.75 aA7.75 ba2.12 AB
L + P/JB/S2.00 ad1.00 ad1.00 ad3.75 BC8.25 ab15.75 aA7.41 AB15.75 aA2.00 ad
L + G + VB/S2.00 BC1.00 BC1.50 BC2.25 BC5.75 bB8.25 ba8.25 aA8.25 ba1.87 BC
L + G + P/JB/S2.00 BC1.00 ab1.25 ab3.00 ab7.25 aA8.00 ba8.00 aA8.00 ba2.16 AB
(P) 0.10–0.20 m
DS/B2.00 BC1.00 ab1.25 ab1.25 ab3.75 ba3.00 aA3.00 aA3.00 aA1.00 ab
VB/S2.00 BC1.00 ab1.25 ab2.00 BC3.75 ba4.25 aA4.25 aA4.25 aA1.66 ab
P/JB/S2.00 BC1.00 ab1.75 ab2.25 ab3.75 ba3.00 aA3.00 aA3.00 aA1.00 ab
L + VB/S2.00 BC1.00 ab1.00 ab1.50 ab3.50 ba3.00 aA3.00 aA3.00 aA1.25 ab
L + P/JB/S2.00 BC1.00 BC2.00 BC2.75 ab6.25 aA3.50 ab3.50 ab3.50 ab1.25 BC
L + G + VB/S2.00 BC1.00 ab1.25 ab1.75 ab3.75 ba3.00 aA3.00 aA3.00 aA1.50 ab
L + G + P/JB/S2.00 BC1.00 ab1.75 ab2.25 ab3.25 ba3.25 aA3.25 aA3.25 aA1.66 ab
(OM) 0.00–0.10 m
DS/B2.00 ad2.25 AD1.75 ad4.75 BC7.50 bB9.25 ab9.25 ab9.25 ab12.37 ca
VB/S3.00 BC2.75 BC3.25 BC5.00 BC10.25 BC10.00 ab10.00 ab10.00 ab16.33 aA
P/JB/S2.25 AD2.75 AD2.25 AD6.50 BC9.00 ab11.50 aA11.50 aA11.50 aA12.75 ca
L + VB/S2.25 aE2.00 aE2.25 aE5.75 AD8.00 BC10.25 BC10.25 BC10.25 BC14.00 ba
L + P/JB/S2.00 BC2.00 BC2.00 BC5.25 AB9.00 aA11.25 aA11.25 aA11.25 aA11.00 ca
L + G + VB/S2.50 ad2.00 ad2.25 AD5.50 BC6.50 BC11.50 BC11.50 BC11.50 BC14.00 ba
L + G + P/JB/S3.25 aE1.75 aE2.00 aE5.00 AD7.75 BC10.75 ab10.75 ab10.75 ab16.33 aA
(OM) 0.10–0.20 m
DS/B2.75 BC1.75 BC1.25 BC4.00 ab5.25 bB4.75 AB4.75 AB4.75 AB9.50 ba
VB/S2.00 ad2.75 AD2.75 AD4.50 BC8.25 ab4.50 BC4.50 BC4.50 BC13.33 aA
P/JB/S2.00 BC2.00 BC1.50 BC5.50 ab5.75 bB5.25 AB5.25 AB5.25 AB8.75 ba
L + VB/S2.00 BC1.75 BC1.50 BC4.50 ab7.50 ab5.75 AB5.75 AB5.75 AB10.50 ba
L + P/JB/S2.00 BC2.00 BC1.00 BC4.75 AB7.00 BC5.75 AB5.75 AB5.75 AB10.00 ba
L + G + VB/S2.00 BC1.75 BC2.25 BC4.50 ab5.50 bB5.25 AB5.25 AB5.25 AB11.00 ba
L + G + P/JB/S2.00 BC1.50 BC1.75 BC4.75 AB5.25 bB5.25 AB5.25 AB5.25 AB12.00 aA
Means followed by equal letters in the column do not differ from each other by the Scott–Knott test at 5% probability. Legend: DS/B = disturbed soil until 1999, then signalgrass implantation; VB/S = velvet bean until 1999, then replaced by signalgrass; P/JB/S = pigeonpea until 1994, then replaced by jack bean, and replaced again by signalgrass from 1999; L + VB/S = limestone + velvet bean until 1999, then replaced by signalgrass; L + P/JB/S = limestone + pigeonpea until 1994, then replaced by jack bean, and replaced again by signalgrass from 1999; L + G + VB/S = limestone + gypsum + velvet bean until 1999, then replaced by signalgrass; and L + G + P/JB/S = limestone + gypsum + pigeonpea until 1994, then replaced by jack bean, and replaced again by signalgrass from 1999. Native tree species were planted in the area after 2010.
Table 6. Breakdown of the interaction between year of evaluation and treatment regarding mean pH values and V (%) in the layers of 0.00–0.10 m and 0.10–0.20 m. Selviria, MS (Brazil). 1993 to 2022.
Treatment/Year199319951997199820082009201020112022
(pH) 0.00 a 0.10 m
DS/B4.45 cA5.00 aA4.42 cA4.65 bA5.00 aA4.80 aA4.80 aA4.80 aA4.47 aA
VB/S4.50 cA4.75 aA4.62 cA4.62 bA4.75 aA4.75 aA4.75 aA4.75 aA4.38 aA
P/JB/S4.30 cB4.92 aA4.32 cB4.75 bA5.00 aA4.77 aA4.77 aA4.77 aA3.93 bB
L + VB/S5.95 aA5.12 aB5.75 aA5.47 aA5.00 aB4.70 aB4.70 aB4.70 aB4.55 aB
L + P/JB/S5.65 aA5.15 aB5.65 aA5.32 aA5.00 aB4.82 aB4.82 aB4.82 aB4.65 aB
L + G + VB/S5.32 bA4.87 aB5.67 aA5.72 aA5.00 aB4.97 aB4.97 aB4.97 aB4.65 aB
L + G + P/JB/S5.37 bA4.87 aB5.20 bA5.65 aA5.00 aB4.80 aB4.80 aB4.80 aB4.55 aB
(pH) 0.10 a 0.20 m
DS/B4.30 aA4.47 aA4.27 bA4.57 bA4.50 bA4.70 aA4.70 aA4.70 aA4.47 aA
VB/S4.50 aA4.77aA4.35 bA4.67 bA4.25 bA4.65 aA4.65 aA4.65 aA4.40 aA
P/JB/S4.25 aB4.60 aA4.10 bB4.65 bA5.00 aA4.87 aA4.87 aA4.87 aA4.52 aA
L + VB/S4.40 aB4.40 aB5.25 aA5.45 aA4.75 aB4.85 aB4.85 aB4.85 aB4.60 aB
L + P/JB/S4.52 aB4.45 aB4.35 bB5.22 aA4.75 aA4.87 aA4.87 aA4.87 aA4.62 aB
L + G + VB/S4.45 aC4.40 aC5.37 aA5.67 aA5.00 aB5.10 aB5.10 aB5.10 aB4.50 aC
L + G + P/JB/S4.55 aB4.37 aB4.57 bB5.67 aA4.75 aB4.77 aB4.77 aB4.77 aB4.43 aB
(V%) 0.00 a 0.10 m
DS/B27.25 bB45.50 aA23.50 bB32.50 bB32.25 aB31.50 aB31.50 aB31.50 aB33.50 aB
VB/S26.25 bA42.00 aA31.25 bA32.25 bA30.25 aA31.75 aA31.75 aA31.75 aA33.00 aA
P/JB/S25.75 bB47.25 aA26.75 bB36.25 bB36.75 aB33.25 aB33.25 aB33.25 aB31.12 aB
L + VB/S61.00 aA48.00 aB48.25 aB48.75 aB36.50 aC30.75 aC30.75 aC30.75 aC38.37 aC
L + P/JB/S55.50 aA46.25 aA45.50 aA44.25 aA32.75 aB34.25 aB34.25 aB34.25 aB36.50 aB
L + G + VB/S54.25 aA48.00 aA46.25 aA51.50 aA36.25 aB35.50 aB35.50 aB35.50 aB42.62 aB
L + G + P/JB/S52.00 aA46.50 aA42.50 aA51.50 aA32.50 aB30.25 aB30.25 aB30.25 aB39.50 aA
(V%) 0.10 a 0.20 m
DS/B21.25 aA32.75 aA19.50 bA30.75 bA21.50 bA27.75 aA27.75 aA27.75 aA29.00 aA
VB/S29.75 aB39.75 aA26.00 bB36.75 bA18.00 bB23.00 aB23.00 aB23.00 aB29.33 aB
P/JB/S19.50 aB38.25 aA17.50 bB31.25 bA28.25 aB25.25 aB25.25 aB25.25 aB25.25 aB
L + VB/S28.50 aA39.00 aA37.25 aA46.00 aA31.25 aA32.50 aA32.50 aA32.50 aA33.25 aA
L + P/JB/S19.75 aB32.00 aA22.50 bB39.25 bA35.25 aA29.25 aA29.25 aA29.25 aA35.25 aA
L + G + VB/S28.50 aB31.50 aB34.87 aB49.25 aA31.00 aB29.25 aB29.25 aB29.25 aB32.50 aB
L + G + P/JB/S30.00 aB33.75 aB30.50 aB50.50 aA23.75 bC21.50 aC21.50 aC21.50 aC34.00 aB
Means followed by equal letters in the column do not differ from each other by the Scott–Knott test at 5% probability. Legend: DS/B = disturbed soil until 1999, then signalgrass implantation; VB/S = velvet bean until 1999, then replaced by signalgrass; P/JB/S = pigeonpea until 1994, then replaced by jack bean, and replaced again by signalgrass from 1999; L + VB/S = limestone + velvet bean until 1999, then replaced by signalgrass; L + P/JB/S = limestone + pigeonpea until 1994, then replaced by jack bean, and replaced again by signalgrass from 1999; L + G + VB/S = limestone + gypsum + velvet bean until 1999, then replaced by signalgrass; and L + G + P/JB/S = limestone + gypsum + pigeonpea until 1994, then replaced by jack bean, and replaced again by signalgrass from 1999. Native tree species were planted in the area after 2010.
Disclaimer/Publisher’s Note: The statements, opinions and data contained in all publications are solely those of the individual author(s) and contributor(s) and not of MDPI and/or the editor(s). MDPI and/or the editor(s) disclaim responsibility for any injury to people or property resulting from any ideas, methods, instructions or products referred to in the content.