Article

The Structural Causes and Trend Evolution of Imbalance and Insufficiency of Development of Digital Inclusive Finance in China

1
School of Economics, Shandong University of Finance and Economics, Jinan 250014, China
2
Faculty of Economics, Chiang Mai University, Chiang Mai 50200, Thailand
*
Author to whom correspondence should be addressed.
Sustainability 2023, 15(13), 10286; https://doi.org/10.3390/su151310286
Submission received: 18 May 2023 / Revised: 17 June 2023 / Accepted: 27 June 2023 / Published: 29 June 2023
(This article belongs to the Section Economic and Business Aspects of Sustainability)

Abstract

:
In this paper, to provide references for coordinating the development of digital inclusive finance between provinces and regions in China, we measure the digital financial inclusion index of 31 provinces in China from 2011 to 2020 based on three dimensions: coverage breadth, depth of use and digitalization degree. By means of the weighted Dagum Gini coefficient and quantile standardization, we explored the degree of imbalance and insufficiency of the development of digital inclusive finance in China and four major regions and its structural causes. Using the Kernel density estimation method and Markov chain analysis method, we further investigate the evolution trend of imbalance and insufficiency. The study finds that (1) the Digital Inclusive Financial Index in China and the four major regions rose significantly, with the COVID-19 epidemic reducing its growth rate. Of these, the eastern region has the highest development level. (2) The imbalance level of digital inclusive finance development obviously has reduced. The level of imbalance is highest within the eastern region, and the development gap between the eastern and western regions is the widest. The imbalance of overall development is mainly due to regional imbalance. The imbalance of coverage breadth and depth of use is the main structural cause of unbalanced development in the four major regions. There is a trend of bipolarization or multipolarization in China and the other three major regions, with the exception of the central region. (3) The western region is the least developed. The development shortcoming of digital inclusive finance in China and the four major regions is the breadth of coverage. There are the “Club Convergence” and the “Matthew Effect” in the eastern, central and western regions.

1. Introduction

Digital inclusive finance is an effective way to promote inclusive growth by using digital technology to bridge the “last mile” of inclusive financial services [1,2]. In 2016, the G20 High-Level Principles for Digital Inclusive Finance were adopted to provide direction for the global development of Digital Inclusive Finance. From 2017 to 2020, the banking and financial institutions in China processed a total of 123,220 million mobile payments, up from 37,552 million, as digital financial inclusion grew rapidly in China. At the same time, the unbalanced and insufficient development of digital inclusive finance in China is becoming increasingly evident. In 2020, the balance of inclusive micro and micro loans in Yunnan Province was RMB 209.48 billion, while the accumulative balance of Shanghai city reached RMB 520.63 billion, suggesting significant regional differences in the development of digital inclusive finance. In addition, the development shortcoming of digital inclusive finance is prominent. In 2020, the payment system of the People’s Bank of China processed a total of RMB 432.16 trillion in mobile payment, accounting for only 5.27% of all payment. The mobility of digital inclusive financial services has not been fully manifested. Given this, we measures the unbalanced and insufficiency level of the development of digital inclusive finance, and examines the causes of its main structure and dynamic evolution characteristics, which provide useful references for promoting the coordinated development of digital inclusive finance in China and even worldwide.
Digital finance refers to the use of digital technology by traditional financial institutions and Internet companies to achieve financing, payment, investment and other new financial business models. The efficient and sustainable model brought about by Internet technology has promoted the transformation and upgrading of the traditional financial industry. The launch of the Alipay account system in 2004 is considered to be the starting point of China’s digital finance. The opening of Yu’E Bao in 2013 further developed China’s digital finance. Over the past decade, China’s digital finance has become a banner leading the world. A World Bank survey found that 82% of adults in China used mobile payments to make payments to merchants in 2021. According to Ant Group’s 2021 Sustainability Report, by the end of 2021, Alipay had provided digital financial services to more than 100 million users and 800,000 enterprises worldwide.
There are regional differences in traditional finance in China. Hu et al. [3] points out that there is a significant difference in the financial development between the economically developed regions and the less developed regions in China. Jiang et al. [4] also pointed out that there are differences in the development level of inclusive finance in different provinces in China. Wang et al. [5] studied digital finance and found that the overall financial efficiency, input efficiency and output efficiency in eastern China were better than those in non-eastern China. Digital inclusive finance is a form of financial services developed on the basis of traditional finance, inclusive finance and digital finance. The level of development of digital inclusive finance may also vary depending on factors such as digital infrastructure in different regions. In addition, the large size of China’s population and the differences in the level of education of people in different regions may lead to differences in the popularity and coverage of digital accounts in different regions. Therefore, Hypothesis 1 is proposed in this paper:
Hypothesis 1 (H1).
The development of digital inclusive finance in China is imbalanced, and the imbalance of coverage breadth may be the main structural cause.
Mobile payments and loans to small and micro businesses are important forms of digital inclusive financial services in China. Lloyd et al. [6] found that Chinese residents’ willingness to make mobile payments was generally insufficient. Aziz and Naima [7] also pointed out that some digital inclusive financial services are underutilized. Chinese residents lack financial knowledge and awareness of using financial services, the integration of digital technology and traditional financial services is insufficient, and digital inclusive financial services need to be further developed. Digital accounts are underused in some remote areas and elderly groups, and it is difficult to achieve the full coverage of digital inclusive financial services. Therefore, Hypothesis 2 is proposed in this paper.
Hypothesis 2 (H2).
The development of digital inclusive finance in China is insufficient, which may be mainly affected by insufficient account coverage.
In order to verify the above hypothesis, this paper takes the imbalance and insufficiency of development of digital inclusive finance in China as the research subject. This paper uses a variety of methods to scientifically measure the level of imbalance and insufficiency of the development of digital inclusive finance in China, and reveals structural causes and dynamic evolution trends.

2. Literature Review

With the continuous development of digital technologies such as artificial intelligence, big data, blockchain, and cloud computing, the relationship between digital technology and the traditional financial field is becoming increasingly close. Relying on digital technology, traditional finance has gradually transformed to digital, and digital finance has gradually developed. Digital finance effectively lowers the threshold of financial services, improves the availability and convenience of financial services, and profoundly changes the way people obtain financial services [6]. Digital finance can not only promote household consumption and entrepreneurship [8], but also improve the financial investment efficiency of households and the participation rate of high-risk financial markets [9,10], effectively promoting the investment and business activities of groups excluded from traditional finance. With the rapid development of digital finance, some digital financial tools are also emerging. Mobile payment tools, digital credit tools, digital credit risk-assessment tools, etc., have been widely spread and used in the world, especially in China. Digital financial tools and platforms developed based on digital technologies can effectively improve financial inclusion [11] and enhance farmers’ entrepreneurial willingness in agriculture [12]. Fintech innovation can also significantly boost household consumption [13]. In addition, digital financial instruments can facilitate an inclusive agricultural transformation with their own flexible systems that meet the needs of households with different assets and beliefs [14]. At present, digital technology is still in continuous development, based on people’s financial service needs at this stage, the future innovation of digital financial tools may focus on digital supply-chain finance, intelligent investment advisory and digital insurance, to further improve the accessibility of financial services for non-professional ordinary residents.
Digital inclusive finance is a powerful engine for economic growth [15,16,17], provides entrepreneurship support [18,19,20], alleviates poverty [21,22], reduces income gap [23,24], and is also important for reducing environmental protection [25,26,27]. Therefore, there has been a great deal of research around digital inclusion finance by scholars around the world.
With the formal introduction of the concept of digital inclusive finance, the related research needs to be based on the index of digital inclusive finance. Some scholars have constructed the index system of digital inclusive finance based on the three dimensions of coverage breadth, depth of use and digitalization degree, using the massive micro data of China Ant Financial transaction accounts to measure the total digital financial inclusion index in China [28]. In addition, a few scholars have constructed a digital inclusive finance index based on web crawler technology in order to explore the inherent influence mechanism of China’s digital inclusive finance on green growth from the perspective of fairness and efficiency [29]. Taking into account the accessibility and use of traditional financial services and digital inclusive financial services, scholars measured the digital inclusive financial index for 101 countries worldwide in 2017, and the new digital inclusive financial index for 52 emerging markets and developing economies in 2014 and 2017, respectively [30,31].
The combination of inclusive finance and digital technology has made digital inclusive finance a highly geographical penetration, but the inclusive finance itself has regional disparity due to differences in populations and countries [32]. There are also disparities in inclusive finance between provinces within countries. For example, financial inclusion is better developed in the western provinces of Turkey compared to the eastern provinces [33]. Evidence suggests that the positive correlation between fintech development and financial inclusion is heterogeneous across the 16 largest emerging economies in the world [34]. Arguably, there are also national gaps in the development of digital inclusive finance. With regard to China’s regions, the introduction of digital inclusion has resulted in better financial efficiency in the east regions than in the non-east regions, with the development of digital inclusive finance in the central and west regions lagging behind [5,35].
At present, quantitative research on the insufficient development of digital inclusive finance in China is relatively scarce. Some scholars have conducted analyses based on insufficiency fund supply for infrastructure construction and insufficiency healthcare coverage for non-citizens [36,37]. With regard to inclusive finance, female entrepreneurs in the Middle East and North Africa are under-served by microfinance [38]. With regard to digital finance, there are many problems such as lack of equipment, financial exclusion, security loopholes and supervision restrictions [16]. With regard to digital inclusive finance, most scholars have found, based on simple data analysis, that there is a lack of willingness to make mobile payments in China, and a lack of financial literacy and social awareness has also left some digital-inclusion financial services underutilized [6,7].
The innovations of this paper include the (1) construction of the weighted Gini coefficient to measure the imbalance level of digital inclusive finance development from the perspective of development difference, and reveal its structural causes. (2) Based on the perspective of development shortcomings, measure the insufficiency level of the development of digital inclusive finance and identify its structural causes. The research findings are of great significance to further improve the development level of digital inclusive finance. (3) Based on a dynamic perspective, we further analyze the evolution trend of unbalanced and insufficient development of digital inclusive finance in China, so as to explore the effective path of coordinated development of digital inclusive finance in the future.
The rest of this paper consists of five sections. Section 2 describes the methodology and data sources. Section 3 includes index construction and measurement. Section 4 and Section 5 conduct the empirical analysis and presentation of the results. Section 6 focuses on conclusions and insights.

3. Study Methods and Data

3.1. Research Methods

3.1.1. Analytic Hierarchy Process

As a widely used subjective weighting method, the Analytic Hierarchy Process (AHP) is one of the more rational and systematic approaches to quantifying qualitative problems [39]. It is able to dismantle complex problems and translate people’s judgment into importance-based comparison among the disassembled factors, thus translating qualitative judgment into more operational quantitative judgment. AHP can assign weights to indicators based on subjective judgments even when sample data is missing.

3.1.2. Weighted Dagum Gini Coefficient

While retaining the traditional Dagum Gini coefficient method, the weighted Dagum Gini coefficient first calculates the difference between the indicators of each dimension and the contribution of regional difference, inter-region difference and super-variable density, and then calculates the overall difference and contribution according to the weight of each dimension [40]. This approach is able to reflect the overall level of development imbalances and its sources. Therefore, in this paper, the Gini coefficient of each dimension of digital inclusive finance is taken as the index of imbalance of each dimension, and then the overall weighted Dagum Gini coefficient is synthesized according to the weight of each dimension as the overall imbalance index. The specific equation is as follows:
G d = j = 1 k h = 1 k i = 1 n j r = 1 n h y j i y h r 2 n 2 μ
G j j d = i = 1 n j d r = 1 n j d y j d i y j d r 2 n j 2 μ j
G j h d = i = 1 n j d r = 1 n h d y j d i y h d r n j n h ( μ j + μ h )
G = d = 1 3 G d ω d
G w d = j = 1 k G j j d p j s j
G n b d = j = 2 k h = 1 j 1 G j h d ( p j s h + p h s j ) D j h d
G t d = j = 2 k h = 1 j 1 G j h d ( p j s h + p h s j ) ( 1 D j h d )
G d j j = G j j d ω d G j j
G d j h = G j h d ω d G j h
where μ donates the average value of the development level of digital inclusive finance; n donates the number of all provinces; nj (nh) is the number of provinces in the j (h)-th region; μj (μh) donates the average value of the development level of digital inclusive finance in the j (h)-th region; pj = nj/n, sj = nj μj/nμ; k donates the number of regions; d donates the d-th dimension in the index system of digital inclusive finance; yjdr (yhdr) donates the development level of the d-th dimension of digital inclusive finance of any province in the j (h)-th region; yji (yhr) donates the development level of any province in the j (h)-th region; and Djhd donates the relative gap between the development level of any province in the j (h)-th regions in the dimension d.
Gd represents the weighted Gini coefficient of each dimension, which is calculated by Equation (1). G donates the weighted Gini coefficient, which is obtained by weighting the weight ωd of each dimension obtained by combining Gd with the analytic hierarchy process, and represented by Equation (4). Gjjd and Gjhd represent the Gini coefficients of each dimensionality in the region and between regions, respectively, and similarly, the weighted Gini coefficients Gjj and Gjh in the region and between regions can be calculated by weighted processing. The source of the imbalance in the development of digital inclusive finance is calculated from Equations (5) to (7). Gwd, Gnbd, and Gtd represent the intra-region imbalance contribution, the inter-region imbalance contribution, and the supervariable density contribution, respectively, and the total contributions Gw, Gnb, and Gt are calculated by multiplying with the weight ωd of each dimension. Gdjj and Gdjh represent the contribution rate of the development imbalance of each dimension to the overall development imbalance within and between regions, respectively, and are calculated by Equations (8) and (9).

3.1.3. Quantile Standardization

In remove the influence of extreme values, in this paper, the original data is normalized by replacing extreme values with quantiles, and weighting the sum to obtain the insufficiency index of digital inclusive financial development, with the following steps:
Step one, perform quantile normalization on the raw data:
Forward   indicator :   y i s t = 0 , y i s t < y i s t Q 1 y i s t y i s t Q 1 y i s t Q 99 y i s t Q 1 100 , y i s t Q 1 y i s t y i s t Q 99 100 , y i s t > y i s t Q 99
Reverse   indicator :   y i s t = 0 , y i s t < y i s t Q 1 y i s t Q 99 y i s t y i s t Q 99 y i s t Q 1 100 , y i s t Q 1 y i s t y i s t Q 99 100 , y i s t > y i s t Q 99
where y i s t Q 1 donates the 1% quantile of the original index value, and y i s t Q 99 donates the 99% quantile of the original index value. y i s t indicates the indicator value of the indicator s of the i-th province in the t-th year. y i s t donates the normalized indicator value; the higher the value, the more fully developed the indicator is.
Step two, perform reverse operation on the normalized value:
y i s t = 100 y i s t
Step three, calculate the insufficiency index and total index of each dimension of digital inclusive financial development in t-th year of province i:
I F I d i t = s = i 1 i n y i s t ω s
I F I i t = d = 1 3 I F I d i t ω d
where ωd represents the weight of each dimension, and ωs represents the corresponding weight of each index under each dimension. IFIdit donates the insufficiency index of d-th dimension d and IFIit donates the composite index of insufficiency development of digital inclusive finance.

3.1.4. Kernel Density Estimation

Kernel Density Estimation is an important non-parametric estimation method that is weakly model-dependent and robust, and has now become a common method for the study of distribution dynamics [41]. Assuming that the density function of the random variable X is f(x), the probability density at the point x is estimated by Equation (15). In the equation, N donates the number of observed values, K(·) is the kernel function, Xi is the independent and identically distributed observed values, and x is the mean value; h is the bandwidth— the smaller the bandwidth, the higher the estimation accuracy. In terms of kernel function selection, the commonly used kernel functions are the Gaussian kernel, Epanechnikov kernel, bicangonal kernel and trigonometric kernel. Considering robustness, we used Epanechnikov kernel function to re-perform the kernel density analysis. The results show that the distribution dynamics of digital financial inclusion in China and the four major regions are very similar to the results of Gaussian kernel. Since the category of kernel function has little influence on the results, and Gaussian kernel is the most common in the existing dynamic evolution studies, this paper chooses Gaussian kernel function to describe the distribution dynamics of the imbalanced development of digital financial inclusion, as shown in Equation (16).
f ( x ) = 1 N h i = 1 N K ( X i x h )
K ( x ) = 1 2 π exp ( x 2 2 )

3.1.5. Markov Chain Analysis Method

Markov chain analysis discretizes the data into k types and calculates the probability distribution of the corresponding types and their variation over time, thus giving an approximation of the whole process of evolution. Assuming that F t = F 1 , t , F 2 , t , F k , t is the probability distribution vector of the attribute types of the object at time t, then the transition between attribute types at different times can be expressed as a traditional Markov transition probability matrix of k × k. Based on this method, the long-term transfer law of insufficiency development of digital inclusive finance was explored in this paper.

3.2. Data Sources

After 1999, China has gradually formed an overall regional development strategy of taking the lead in the eastern region, rising from the central region, developing the western region and revitalizing the northeastern region. Accordingly, China’s 31 provinces can be divided into the eastern, the central, the western and the northeastern regions. The eastern region includes Beijing, Tianjin, Hebei, Shanghai, Jiangsu, Zhejiang, Fujian, Shandong, Guangdong and Hainan; the central region includes Shanxi, Anhui, Jiangxi, Henan, Hubei and Hunan; the western region includes Inner Mongolia, Guangxi, Sichuan, Chongqing, Guizhou, Yunnan, Tibet, Shaanxi, Gansu, Qinghai, Ningxia and Xinjiang; the northeastern region includes Liaoning, Jilin, Heilongjiang. The data involved in this paper are mainly from Peking University Digital Inclusive Financial Index (2011–2020), which is calculated and released by the Research Center for Digital Financial Inclusion of Peking University in combination with the massive basic data of China’s Ant Financial. Research on the regional differences and development shortcomings of digital inclusive finance in China needs data indicators which can cover the whole country and be widely recognized. The Peking University Digital Financial Inclusion Index covers 31 provinces in China and is comprehensive. Additionally, both horizontally and vertically, this index is comparable. In addition, many scholars regard this index as the main proxy indicator when studying digital financial inclusion in China [42,43], indicating that this index has strong authority and can be used as the main data source of this paper. The other data involved in this paper are, respectively, from China Inclusive Financial Index Analysis Report (2017), China Inclusive Financial Index Analysis Report (2020), Yunnan Financial Operation Report (2021), Shanghai Financial Operation Report (2021) and Overall Operation of Payment System of 2020. The above reports are all authoritative data released by the People’s Bank of China, the central bank in China. The comparison of some data can initially explain the regional differences and development shortcomings of digital inclusive finance in China, so as to provide reference for the subsequent research of this paper.

4. Construction and Level Measurement of Digital Inclusive Financial Index

4.1. Index System of Digital Inclusive Finance

Digital inclusive finance is a new inclusive financial model developed by banks and other traditional financial institutions as well as internet enterprises. In constructing the index system for digital inclusive finance, it should reflect the digital innovation of traditional financial institutions to the original products, as well as the Internet financial services provided by some emerging financial-like institutions. The consistency of data and the reasonableness of cross-year comparisons should also be taken into account. Hence, based on the index system of Peking University Digital Inclusive Finance Index (2011–2020), we excluded secondary indicators of money funds, investment and credit investigation, which are not available in some years under the depth of use, and construct a revised digital inclusive finance-indicator system. Then, considering the consistency of the data, we constructed a judgment matrix by using the analytic hierarchy process to determine the weights of the corresponding secondary indicators under the depth of use (see Table 1). All other indicator weights were calculated and determined using the judgment matrix shown in the original report. The revised digital financial inclusion indicator system and the weights of some indicators are shown in Table 2. The descriptive statistics of the main indicators and indexes of digital inclusive finance are shown in Table 3.

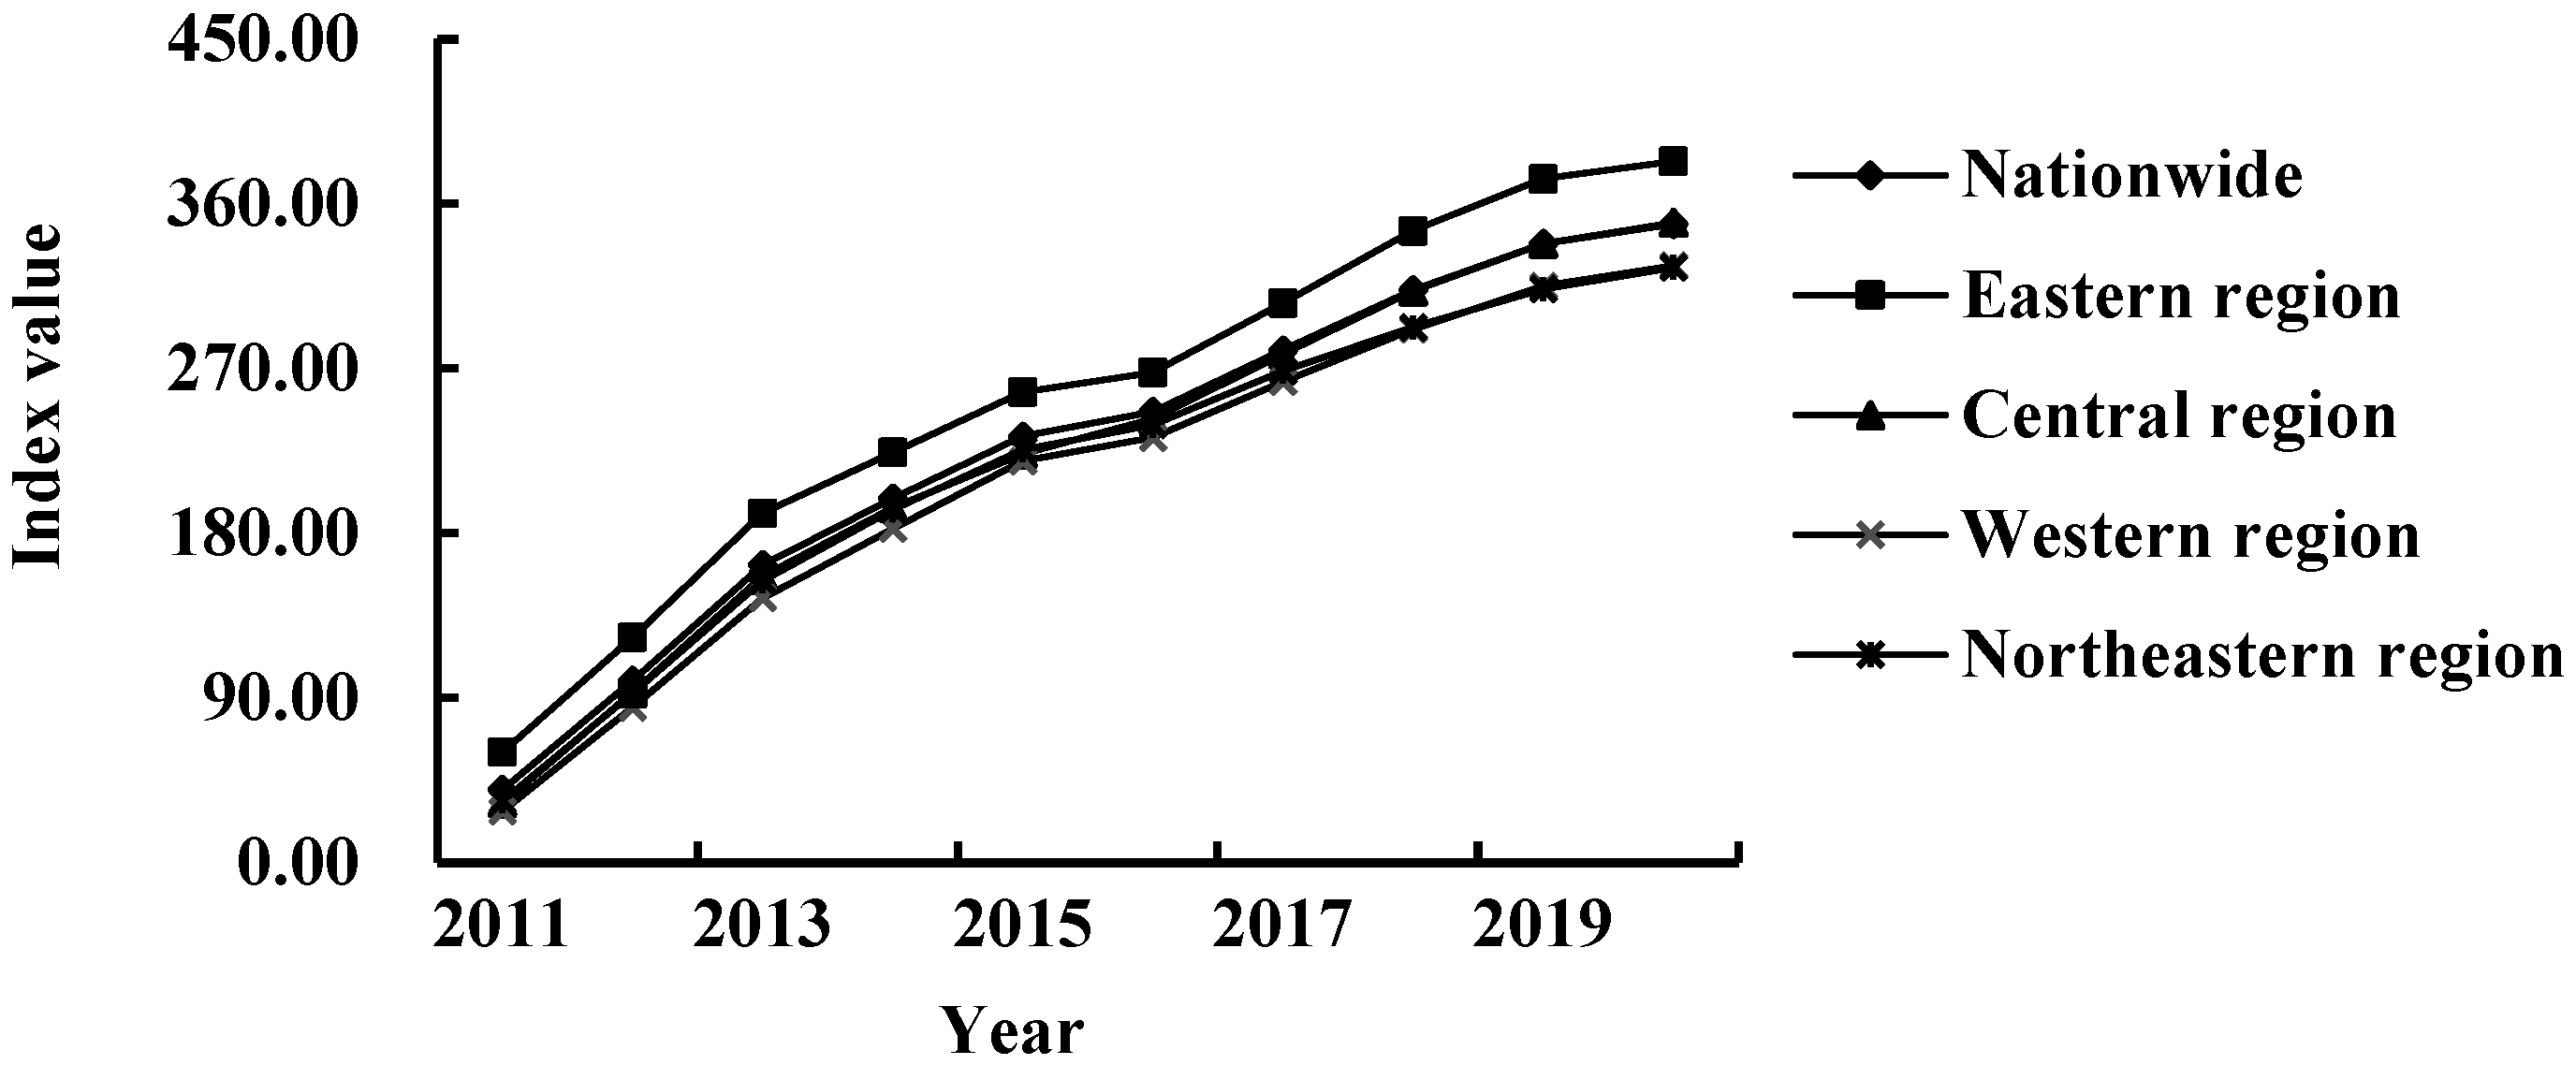
4.2. Measurement of Digital Inclusive Finance Level

Figure 1 illustrates the digital inclusive finance index in China and four major regions from 2011 to 2020. As can be seen from the figure, the national and four regional digital inclusion indices show a clear year-on-year increase. The average value of the national digital inclusive finance index is 226.04, showing a rapid increase over the sample period, with an average annual growth rate of 27.21%. In terms of regional development, the eastern region has the highest development level, with the average index value of 253.11, followed by the central and northeastern regions.

5. Analysis of the Imbalance of Development of Digital Inclusive Finance

5.1. Imbalance Level and Source

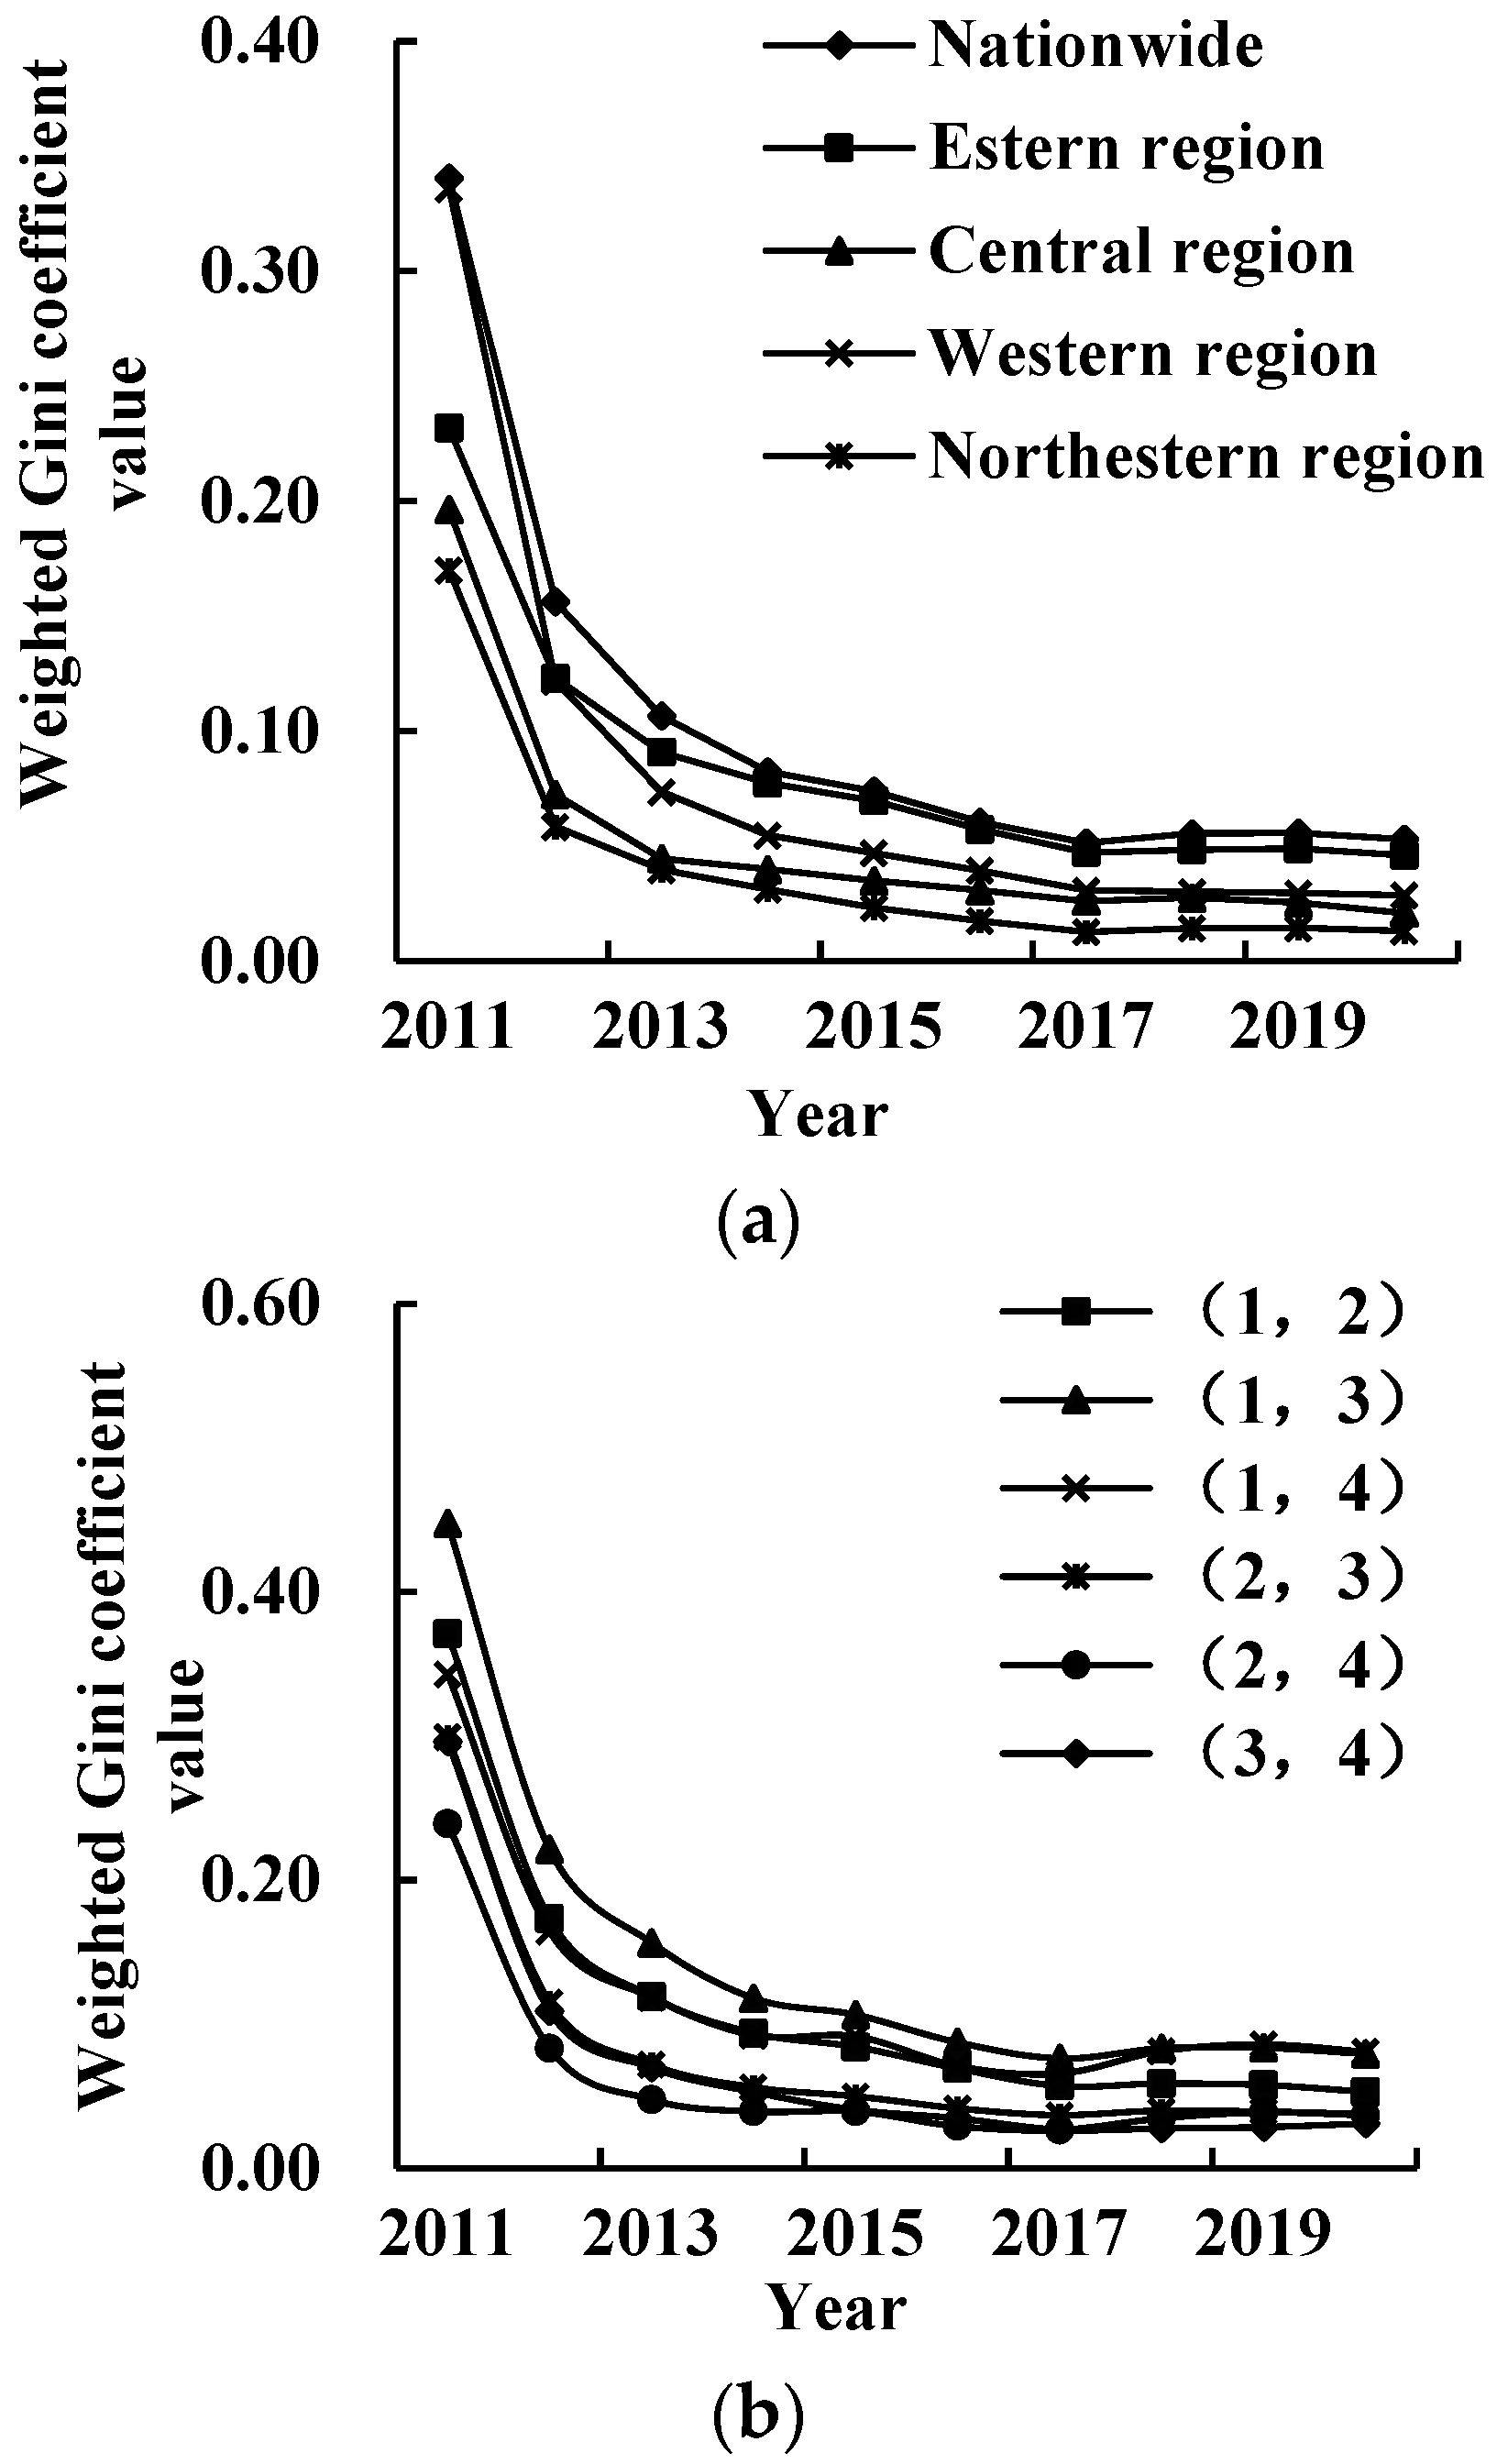
5.1.1. Imbalance Level

The national digital inclusion development imbalance index has maintained an overall downward trend (Figure 2a), indicating that the development of digital inclusive finance is becoming more balanced across the country. The imbalance index declined rapidly from 2011 to 2012 with an average annual decline of 54.11%; the declining trend slowed down from 2013 to 2020, with an annual decline rate of 9.50%.
At the regional level, the average imbalance index of digital inclusive finance in the eastern region is the highest, reaching 0.0841, which suggests that the development of digital inclusive finance in the eastern region is the most unbalanced. In terms of the change trend, all four regions show an overall downward trend in the Imbalance Index. Among them, the average annual decline rate of northeastern region has the highest average annual rate of decline at 24.82%, while the eastern region has the lowest average annual rate of decline at 16.44%. In general, the imbalance of the development of digital inclusive finance in the four major regions has declined, suggesting that the development gap of digital inclusive finance in each region has gradually narrowed.
The overall trend of the inter-regional imbalance index is all declining (Figure 2b), suggesting that the digital inclusive finance inclusion gap between the two major regions has narrowed. The highest average annual rate of decline in the imbalance index was recorded between the western and the northeastern regions at 22.14%, which indicates that the development gap between the western and the northeastern regions is narrowing at the fastest speed. With the largest mean value of 0.1461, the imbalance index between the eastern and western regions shows the most unbalanced development of digital inclusion finance between regions. This may be due to the lack of favorable conditions for the development of digital inclusive finance in the western region, which makes its service acceptance and utilization much lower than that in the eastern region. It is worth noting that the trend of decline in the imbalance index between the eastern region and the other three regions in 2020 was more pronounced than in the previous year. This situation suggests that the development gap between the eastern region and the other three regions can be narrowed rapidly under the impact of the epidemic, showing the strong development toughness of digital inclusive finance to a certain extent.

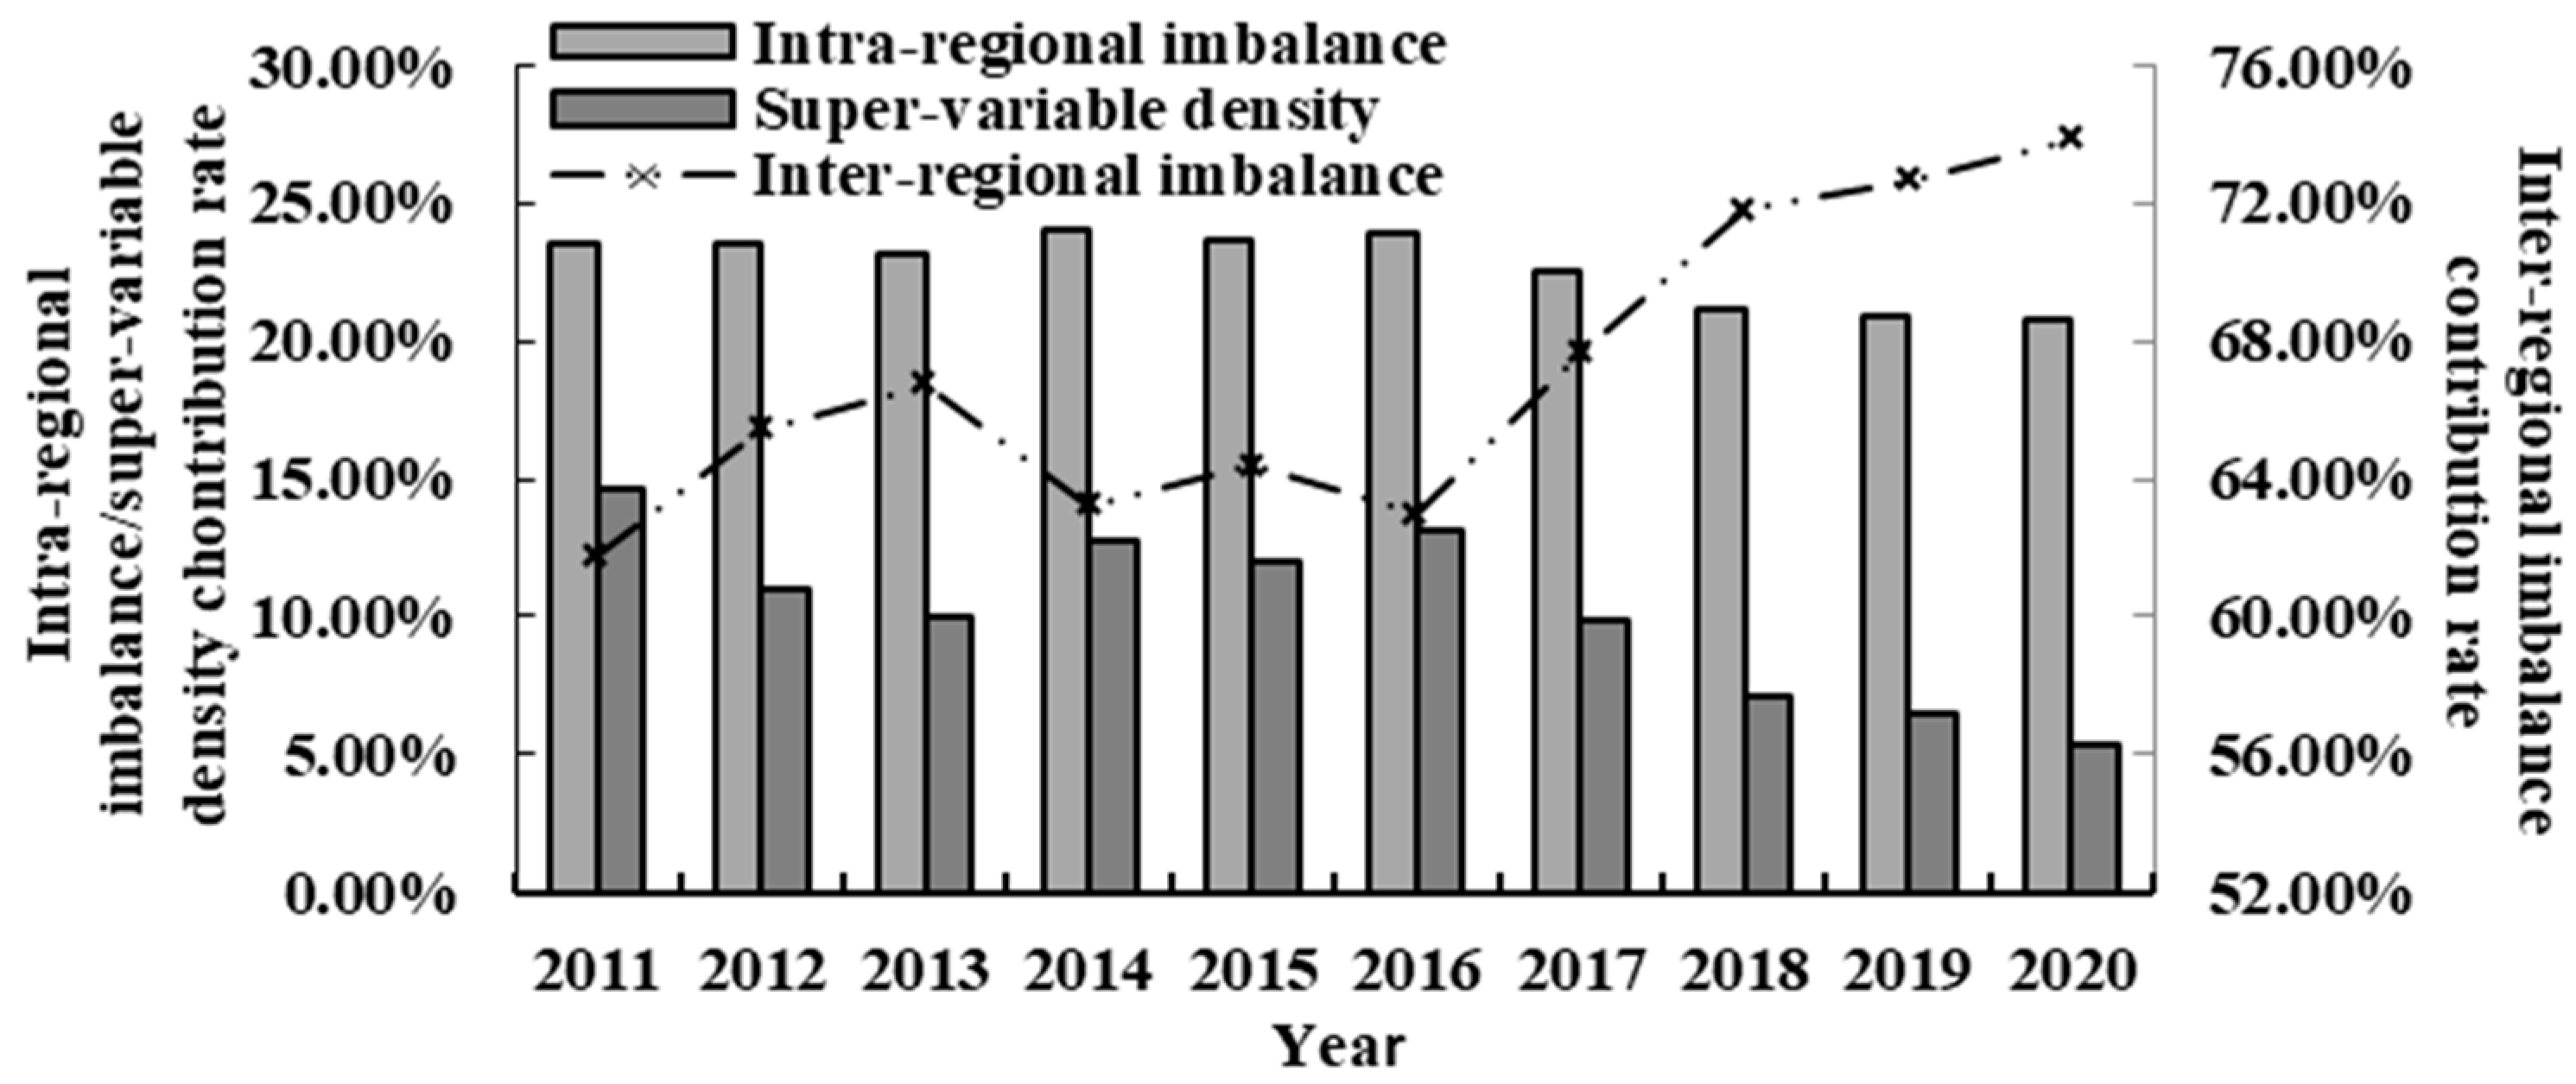
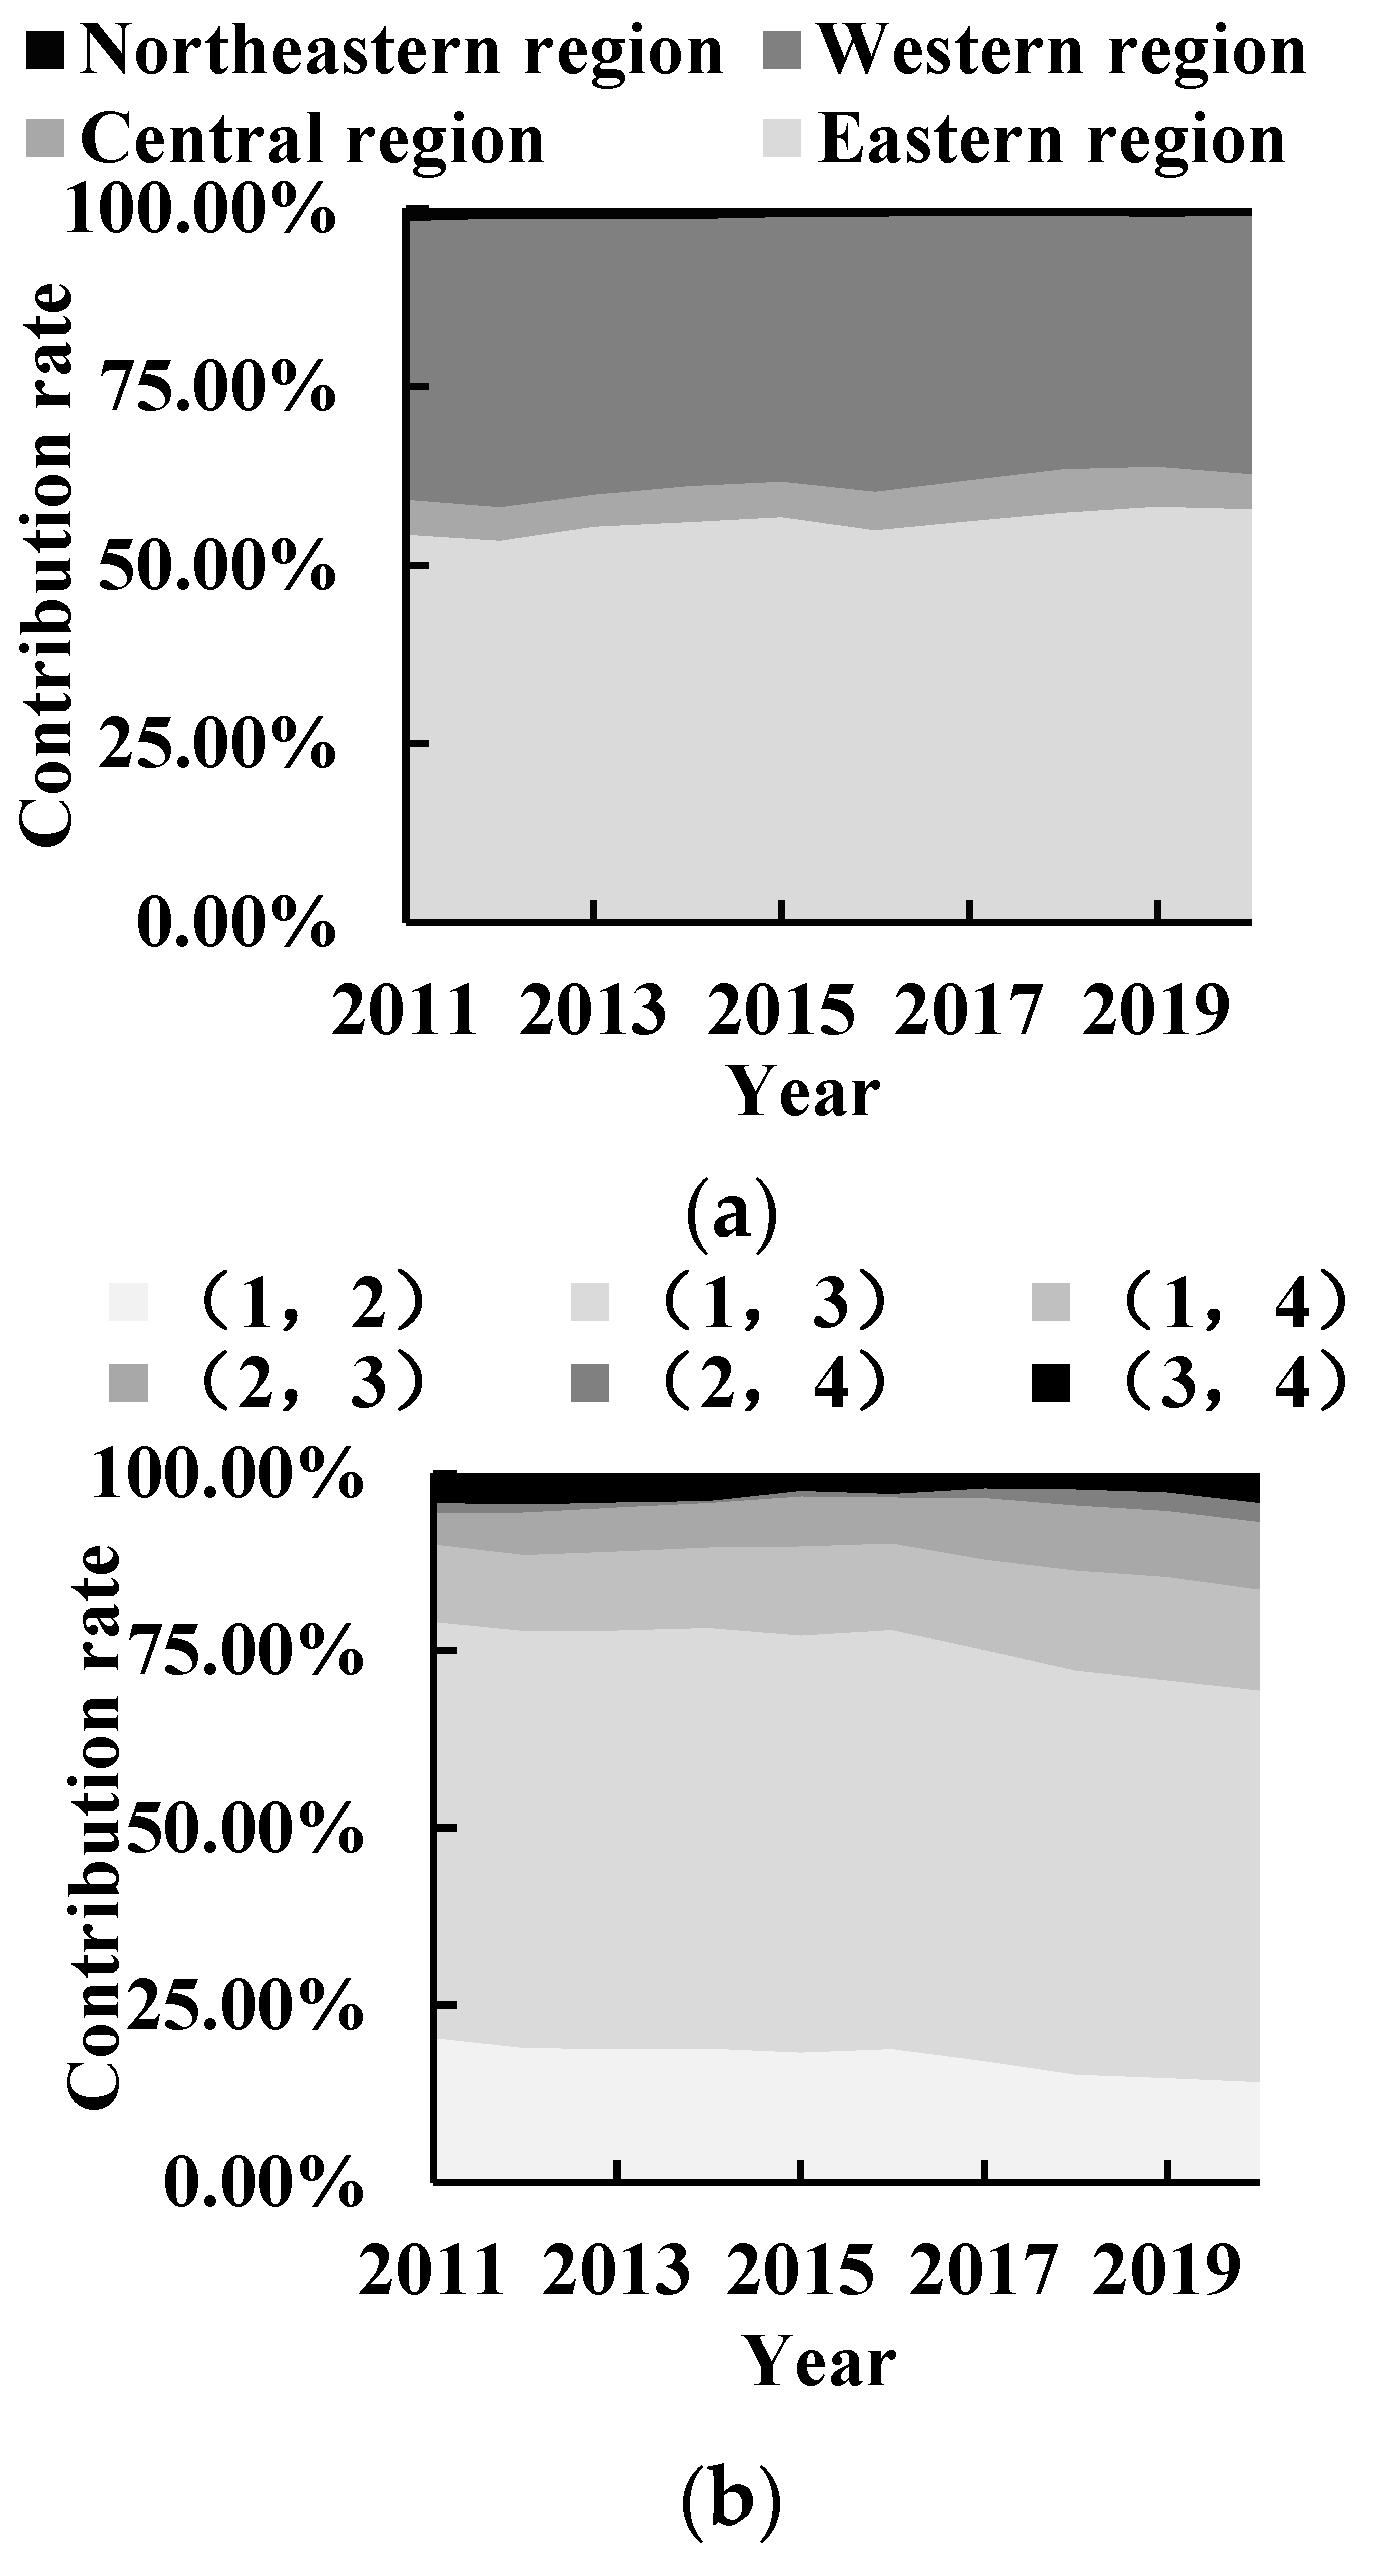
5.1.2. Sources of Imbalance and Their Contribution

Figure 3 shows the sources and contribution rates of China’s overall digital inclusive finance development imbalance. The contribution of inter-regional imbalance shows a clear upward trend during the sample period, with values consistently above 61.79% and an average annual growth rate of 2.01%, which suggests that inter-regional imbalance is the main source of overall development imbalance. The contribution rate of regional imbalance is between 20.77% and 24.07%, with an overall stable decreasing trend and an average annual decrease of 1.38%. The contribution rate of supervariable density is the lowest, with its average value being only 10.22%, and the overall decline trend being 10.60%.
The decomposition of the intra-regional and inter-regional imbalance contributions are shown in Figure 4. From the perspective of the imbalance contribution within the region, the unbalanced contribution rate in the eastern region consistently is the largest over 50.00%, with an average value of 56.11%, increasing at an average annual rate of 0.70%. The contribution rate of northeastern region is the lowest, with its average value being only 1.24%; meanwhile, the unbalance contribution rate of northeastern region decreases the most, with the annual decline rate of 5.48%.
From the perspective of the contribution of inter-regional imbalance, the contribution rate of the imbalance between the eastern and western regions to the overall imbalance is the largest, with an average of 57.98%, but the overall trend is declining, with an annual decline rate of 0.67%. This suggests that the large gap in digital inclusive financial development between the eastern and western regions is the main source of inter-regional imbalance. The imbalance between the central and northeastern regions contributed the least to the overall imbalance, with an average contribution of only 1.38%, but the contribution rate shows an upward trend, with an average annual growth rate of 6.10%.

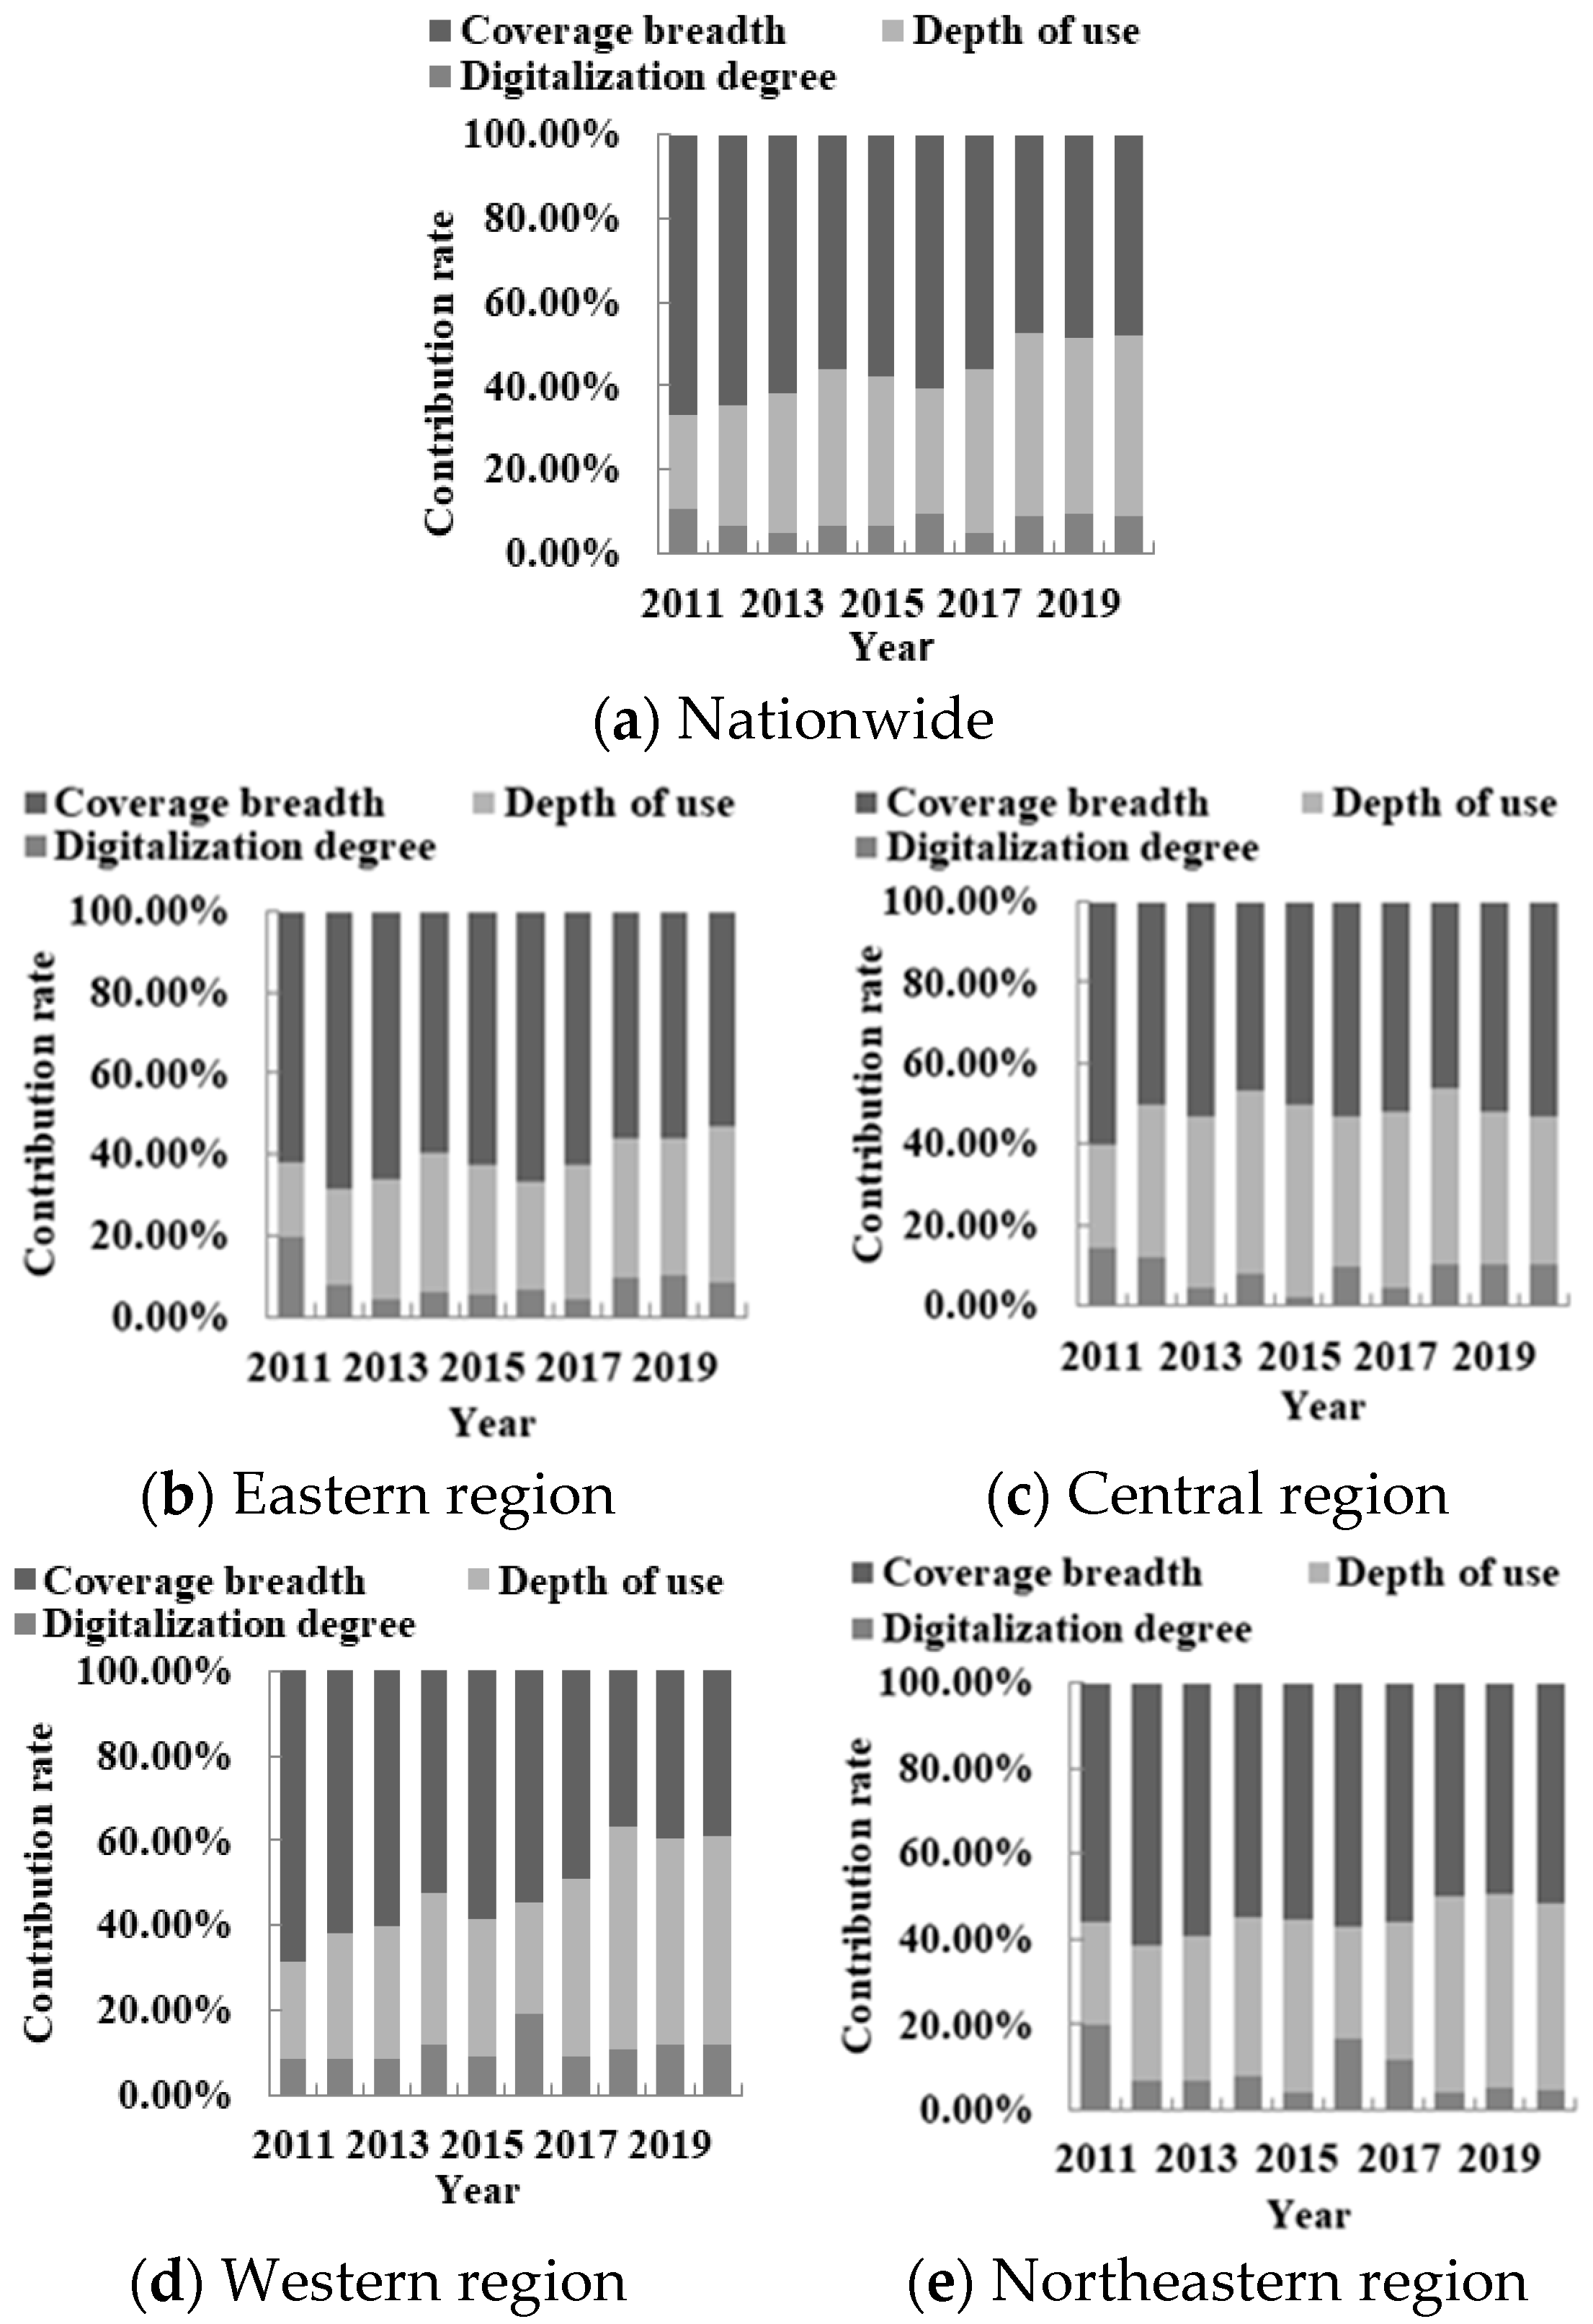
5.2. Structural Causes of Imbalance Development

Figure 5 reflects the structural causes of imbalance of development of digital inclusive finance in China as well as the four major regions. At the national level, the imbalance in coverage breadth is the main structural cause of the overall imbalance in development, with an average contribution rate of 56.82%. The contribution of the imbalance of the digitalization degree is the smallest, with an average value of only 7.78%. In addition, the imbalance contribution rates of coverage breadth and digitalization degree imbalance show an overall declining trend, while the contribution rate of depth of use imbalance shows a larger increase, with an average annual growth rate of 7.49%, suggesting that the imbalance in depth of use is increasingly becoming an important structural factor affecting the overall development imbalance of digital inclusive finance nationwide.
From the regional level, the structural causes of unbalanced development in the four major regions are heterogeneous. Specifically, the main structural causes of the overall unbalanced development in the eastern, central and northeastern are the unbalanced coverage breadth, with the average value of its contribution exceeding 50%. Among them, the eastern region has the highest coverage breadth imbalance contribution rate, with its average value reaching 61.36%, but the coverage breadth imbalance contribution rate is on a decreasing trend, while the depth of use imbalance contribution rate shows a faster rising trend, with an average annual growth rate of 8.55%. In addition, the imbalance in the development of the western region was mainly affected by the imbalance of coverage breadth from 2011 to 2017, with its contribution rate declining continuously, and an average annual decline rate of 2.34%. However, the contribution rate of depth of use imbalance continues to rise during this period and surpasses the coverage breadth imbalance contribution rate from 2018 to 2020, making the depth of use imbalance the biggest structural cause affecting the imbalance of the western region. Generally speaking, the contribution rate of the imbalance of coverage breadth is the largest in the four regions, the second is the imbalance of the depth of use, and the contribution rate of the imbalance of the digitalization degree is the smallest.

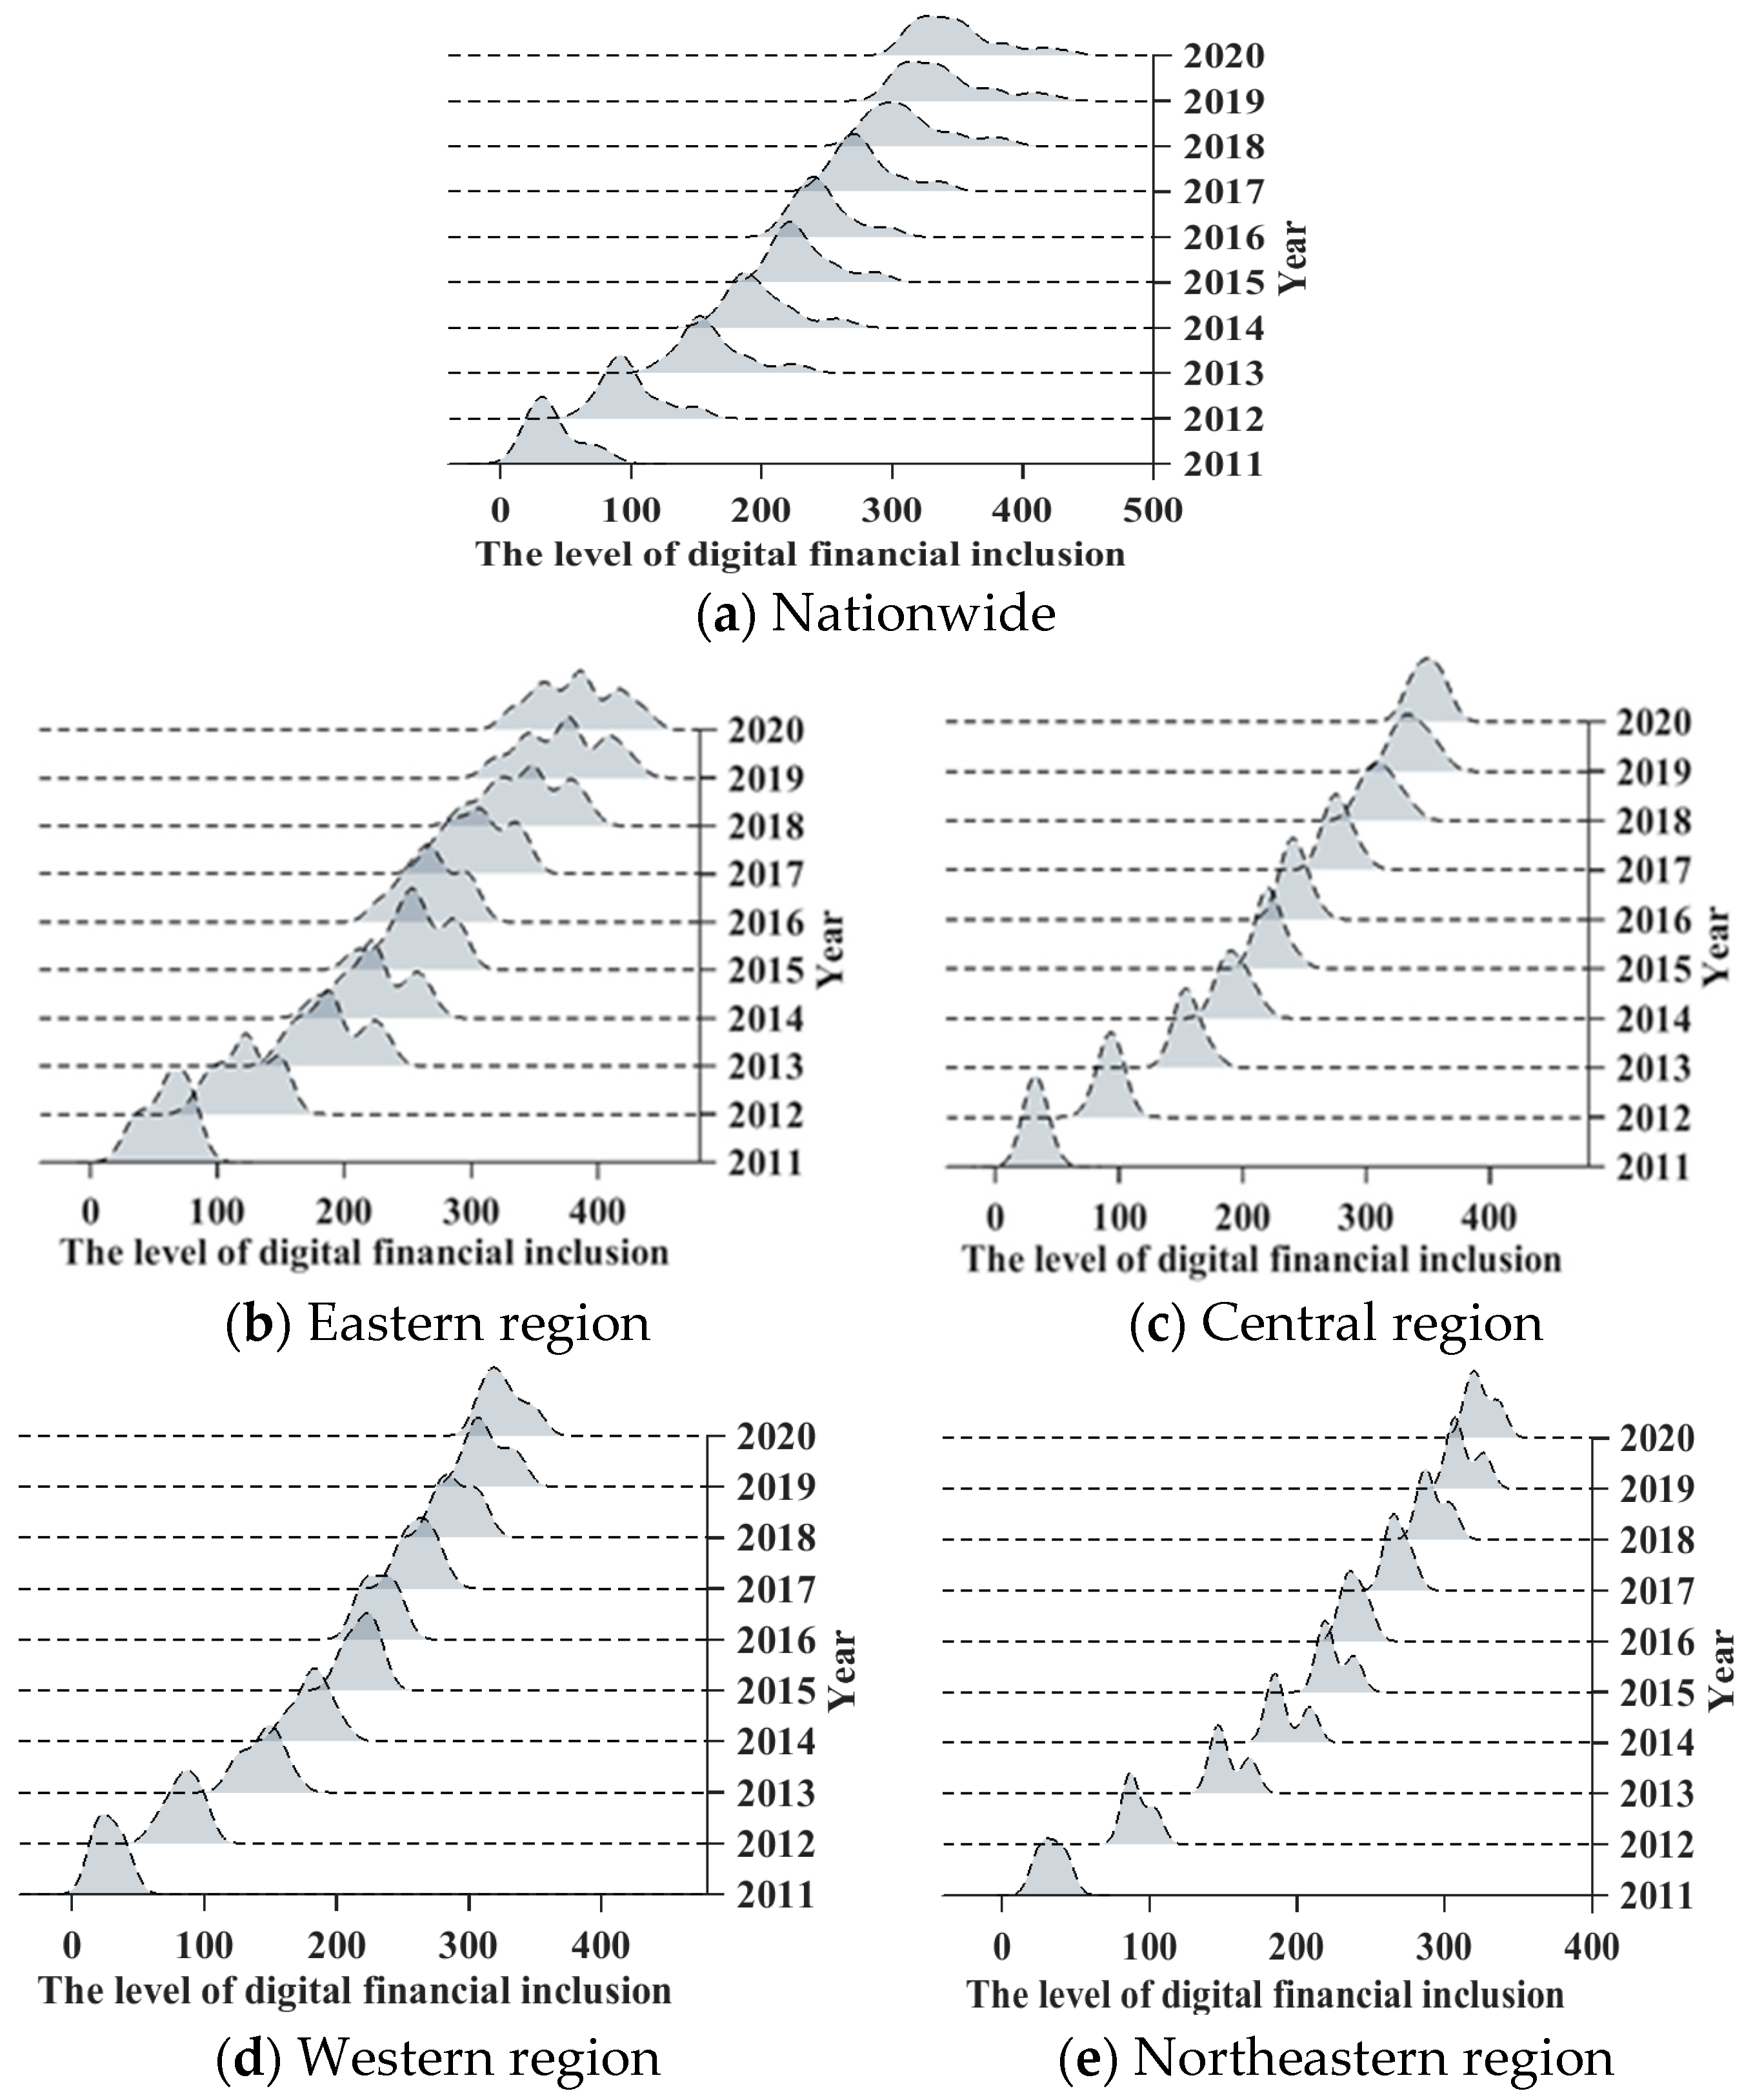
5.3. Trend Evolution of Imbalance Development

The analysis of the weighted Dagum Gini coefficient provides a clear picture of the imbalance development of digital inclusive finance in China and its structural causes. Then, we used the Kernel density estimation method to explore the dynamic trend evolution characteristics of the imbalance development of digital inclusive finance in China and the four major regions from an absolute difference perspective, as shown in particular in Figure 6.
(1)
The rightward shift in the distribution of digital inclusive finance across China and in the four major regions indicates an increasing level of development of digital inclusive finance across the country and in the four major regions, which is consistent with the objective facts presented in the previous section. Bounded by 2015, the rightward shift is greater until 2015, after which the shift decreases significantly. In addition, the right shift is relatively large across the country and in the eastern region, while the right shift decreases in the central, western and northeastern regions. This suggests that digital inclusive finance is growing faster nationwide and in the eastern region, and relatively slowly in the other three regions. Hence, the development gap of digital inclusive finance between the eastern region and the other three major regions has gradually widened.
(2)
The main peaks show a downward trend nationally and in the eastern, central and western regions, with the width of the main peaks widening. In the northeastern region, the peak value of the main peak increases slightly, and the width of the main peak is obviously reduced. This indicates that the development of digital inclusive finance is gradually dispersed nationwide and in the eastern, central and western regions, and the absolute difference in the internal development of digital inclusive finance tends to expand. However, the development of the northeastern region is gradually concentrated, which represents the improvement in the absolute difference.
(3)
From a national perspective, the distribution curve of digital inclusion shows a more pronounced trailing to the right, with a widening trend of distribution extension. This indicates that the provinces with a higher development degree of digital inclusive finance (such as Beijing and Shanghai) have been further improved, and the gap between the development level of the provinces and that of other provinces nationwide is gradually increasing, with the situation of “the best getting better”. From the regional perspective, there is no obvious tailing in the distribution curves of the four regions. This indicates that the provinces in the region have similar levels, with the highest level of development having a very small gap with other provinces in the region.
(4)
The development of digital inclusive finance is multi-polar nationwide and in the eastern region. The western and northeastern region shows polarization and the central region shows no polarization. Specifically, the national Kernel density curve develops from one side peak to two side peaks, but the peaks of the side peaks are both lower. It is indicated that the digital inclusive finance in China is gradually shifting from polarization to multi-polarization, but the degree of polarization is always weak. The density curve in the eastern region is mainly composed of a main peak and two lateral peaks distributed on both sides of the main peak. The left-hand peak tends to diverge into two lateral peaks, with a gradual deepening of multipolar differentiation. In most years, the western and northeastern regions consist of one main peak and one lateral peak, showing obvious polarization. The distribution curve in the central region has only one peak, and there is no polarization phenomenon. The development of digital inclusive finance in the central region is balanced.

6. Analysis of the Insufficiency of Development of Digital Inclusive Finance

6.1. Level Measures of Insufficiency

Figure 7 shows the development trend of the national digital inclusive finance insufficiency index and those of the four regions. The national insufficiency index shows a steady and fluctuating development trend, rising slightly on the whole. The average annual growth rate of it is only 0.53%, suggesting that the insufficiency level of the national digital inclusive finance development is relatively stable. The level and development trend of the digital inclusive finance insufficiency index vary among the four regions. In terms of index level, the western region has the largest mean insufficiency index (76.69), followed by the northeastern and central regions, and the eastern region has the smallest (41.68). In terms of the development trend, the insufficiency index in the eastern and central regions rose first and then fell, and the overall value decreased slightly. The insufficiency indices for the western and northeastern regions rose twice from 2011 to 2020. Among them, the second rising time was longer and the rising range was larger. Hence, the insufficiency index as a whole has a high growth.

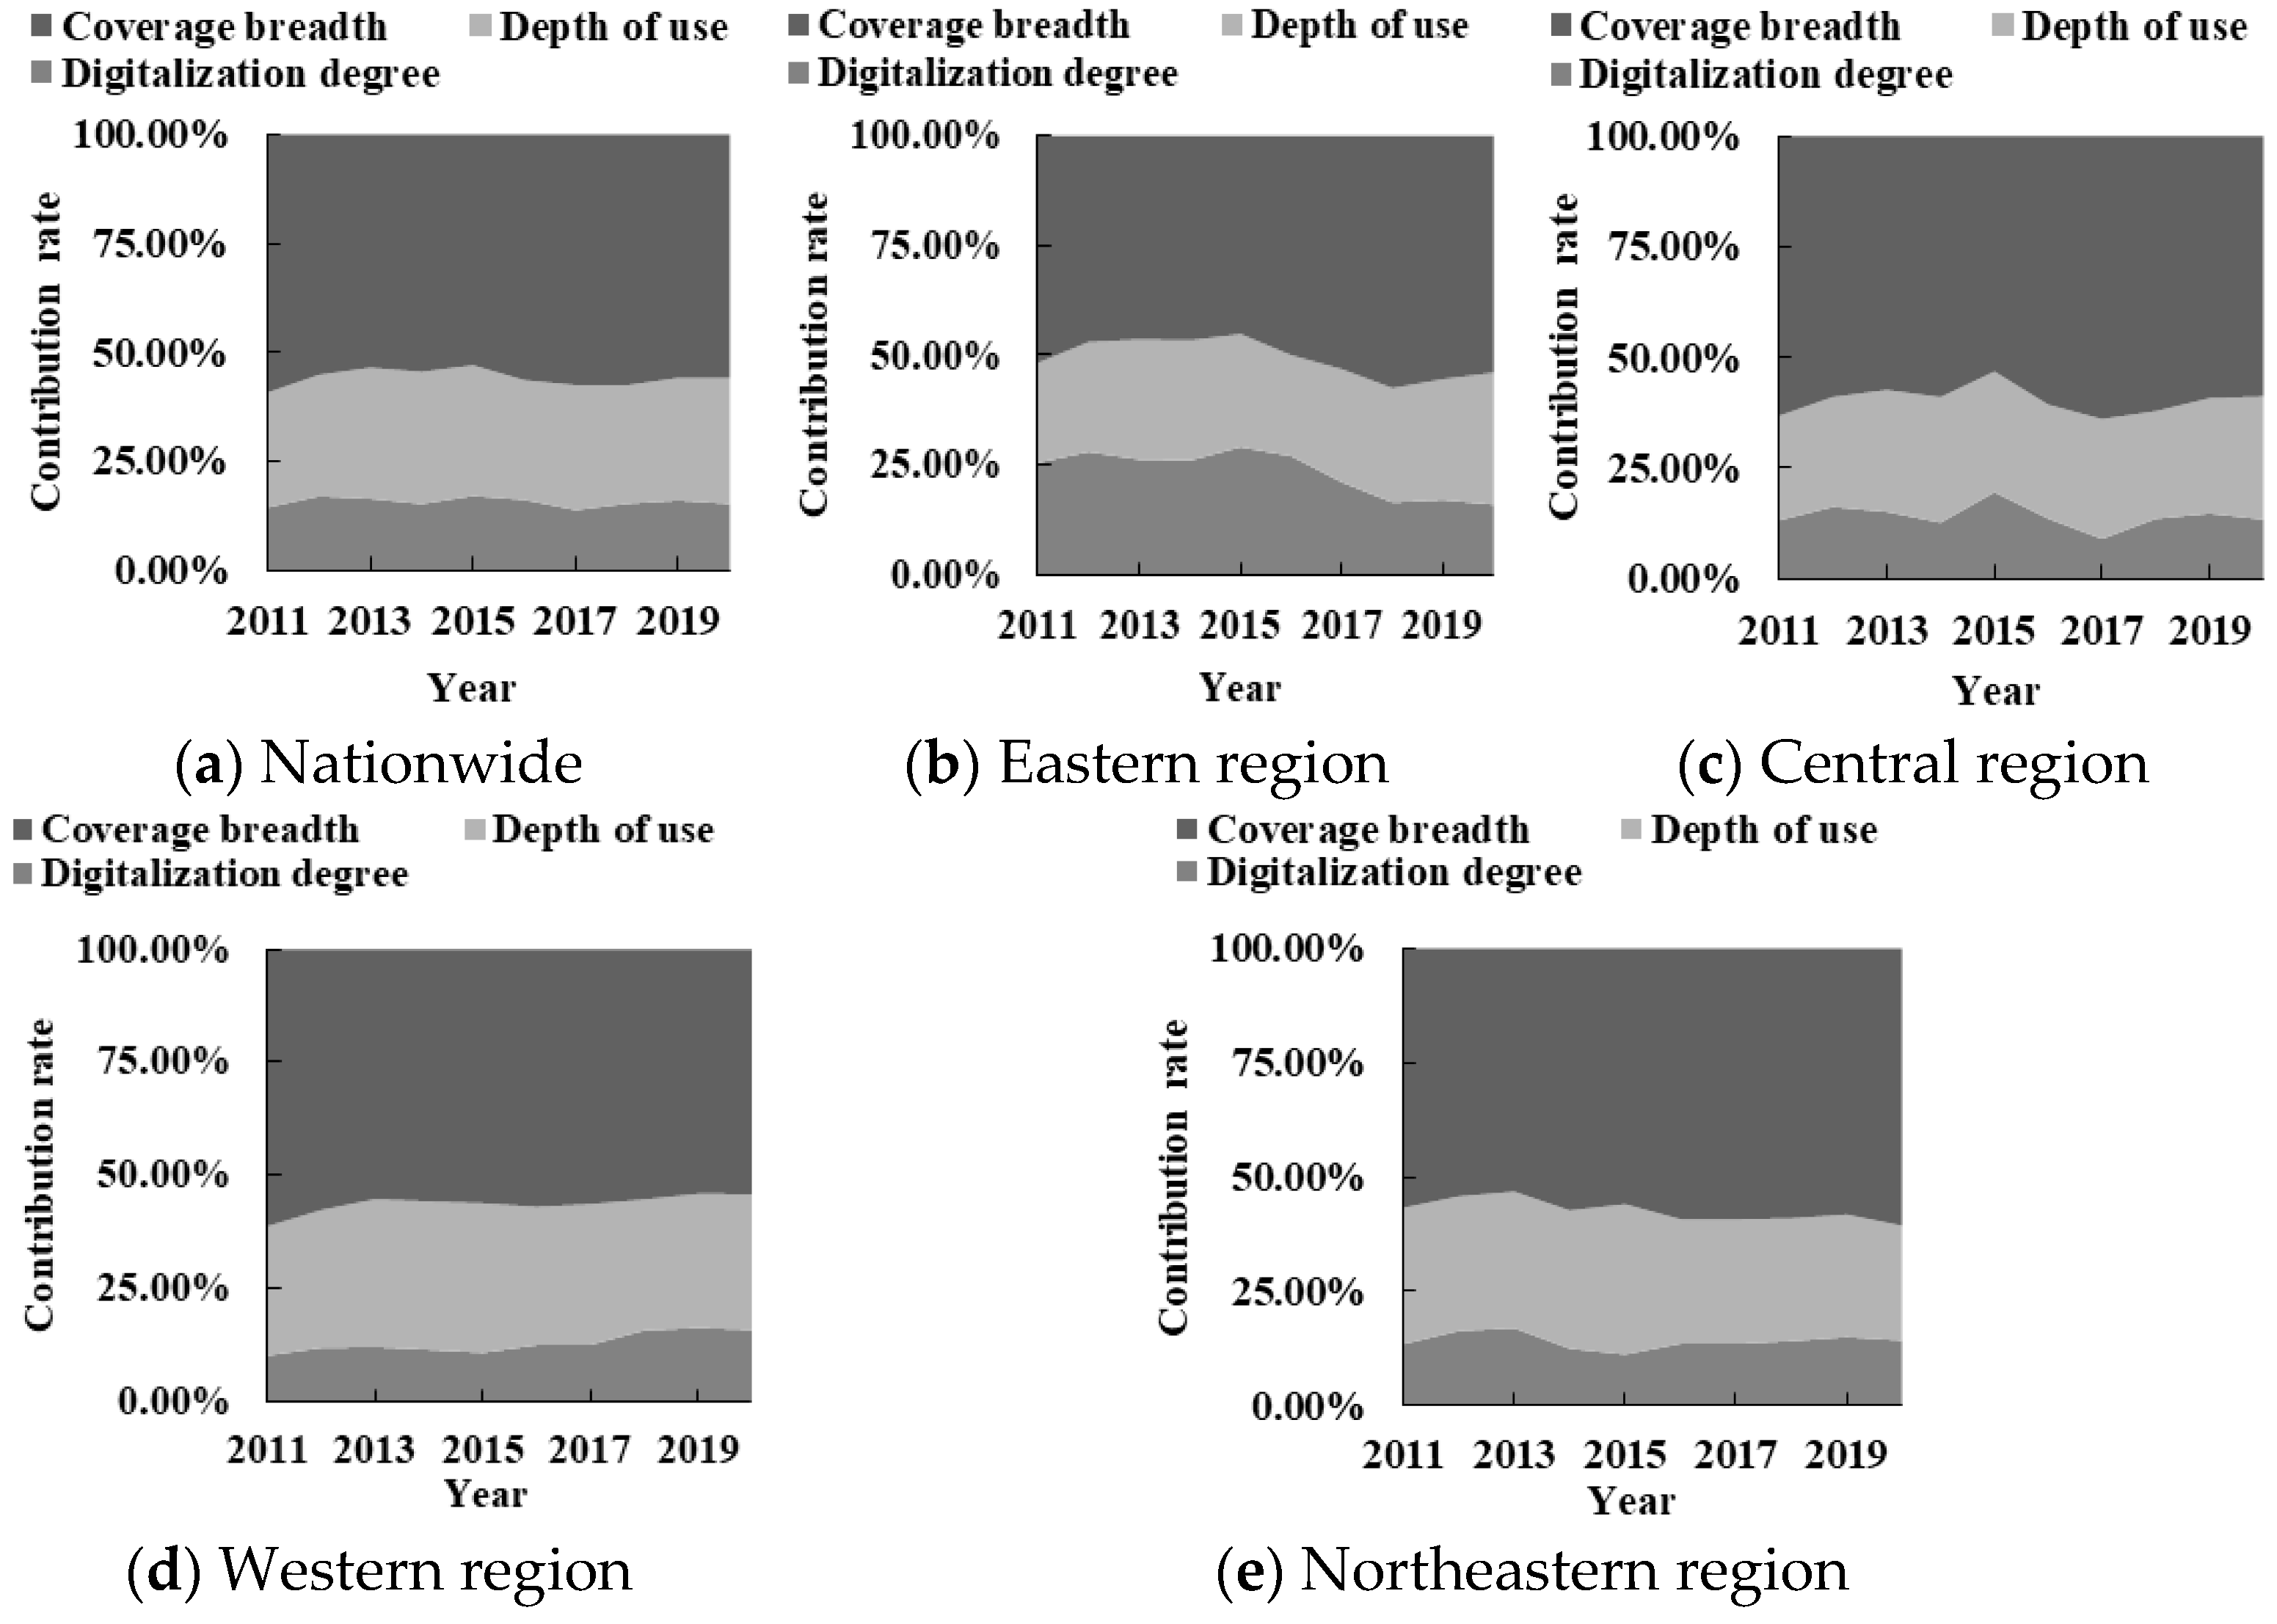
6.2. Structural Causes of Insufficiency Development

Figure 8 shows the structural causes of insufficiency development of digital inclusive finance nationwide and in the four major regions. The main structural cause of the insufficiency of digital inclusive finance nationwide is the insufficient breadth of coverage, the contribution of which is consistently above 50% with an average value of 55.83% over the sample period examined. From the perspective of the change trend, the insufficient contribution rates of the three dimensions all show a steady fluctuation trend. The contribution rate of coverage breadth insufficiency decreased slightly with an annual decline rate of 0.65%, and the contribution rate of depth of use and digitalization degree insufficiency increased slightly.
Overall, the structural causes in the insufficiency of the development of digital inclusive finance in all four regions is the insufficiency of coverage breadth, with the average value of its insufficiency contribution exceeding 50.00%. The average contribution rate of coverage breadth insufficiency is the highest (59.66%) in the central region and the smallest (50.67%) in the eastern region. Specifically, the contribution rate in the eastern region fluctuates greatly, showing the characteristic of decreasing first, then rising and then decreasing, with an overall average annual growth rate of 0.47%. Digitalization degree and depth of use insufficiency alternate from 2011 to 2016 as a secondary cause of insufficiency development of digital inclusive finance in the eastern region. After 2016, the contribution of digitalization degree sufficiency fell by an average of 8.81% per year, while the contribution of depth of use sufficiency rose significantly, with an average annual growth rate of 5.53%. The insufficiency contribution rate of each dimension in the central region shows a fluctuating trend, and the overall variation range is relatively small. Overall, the insufficiency contribution rate of coverage breadth in the western region dropped slightly, while the insufficient contribution rate of digitalization degree showed an obvious upward trend. The overall contribution rate of coverage breadth insufficiency in northeastern region has increased, with an average annual increase of 0.74%, and the development shortage is more significant.
Further investigation of the impact of COVID-19 on the development shortcomings in four major regions shows that the insufficiency contribution rate of digitalization degree in all four major regions would decrease in 2020. This may be due to the implementation of contactless prevention and control measures during the epidemic led to the widespread popularity of mobile payments. Therefore, mobile payment means such as QR-code payments were widely used in major establishments, and the advantages of digital financial inclusion in terms of mobility and convenience were fully utilized in the epidemic era.

6.3. Trend Evolution of Insufficiency Development

Then, the characteristics of the trend evolution of digital inclusive finance are revealed in this paper through the long-term transfer law of insufficiency development of digital inclusive finance. The state transition probability matrix of insufficiency development of digital inclusive finance in China and the four major regions is shown in Table 4.
(1)
There is a significant “Club Convergence” in the sufficiency development of digital inclusive finance in the whole country and in the eastern, central and western regions. The transfer probability on the main diagonal is higher than that on the non-main diagonal in the transfer matrix. From the national transfer matrix, the mean of the main diagonal shift probability is 0.7779, suggesting that the overall insufficiency level is likely to remain stable. According to the regional transfer matrix, it is easy to self-solidify if the main diagonal of the eastern, central and western regions is not sufficient. In the transfer matrix of the northeastern region, the medium- and low-level transfer probability is less than the corresponding downward transfer probability. It indicates that the development of digital inclusive finance in the northeastern region is not fully self-reinforcing, and the structural weakness will be more obvious.
(2)
There is a “Matthew Effect” of insufficient development of digital inclusive finance nationwide and in the four major regions. Provinces at low and high levels are less likely to transfer, especially the low ones. The low-level stable probability of the whole country and the four major regions is more than 65%. It indicates that the insufficiency development of the low-level provinces will not be expanded basically, and it is difficult for the high-level provinces to make up for the development gaps, and the sufficiency development of digital inclusive finance is easy to fall into spatial disequilibrium.
(3)
The probabilities on both sides of the diagonal of the shift matrix are mostly non-zero nationwide and in the four major regions, suggesting that the insufficiency level of digital inclusive finance development is shifted upward or downward within one year. In addition, there is no leapfrog transfer in the whole country and in the eastern, central and northeastern regions, and the level of insufficiency tends to remain stable. With the exception of the low- and medium-level provinces, provinces with other insufficiency level in the western region are likely to experience leapfrogging, but the probability is small, not exceeding 0.0811. For provinces in the western region, no matter whether there is a high or low level of insufficiency development of digital inclusive finance, there will be little leapfrogging or further improvement in a year.

7. Discussion

Digital inclusive finance is an inclusive digital financial service that uses digital technology to make full use of its inclusiveness [42]. Most of the existing studies focus on the impact mechanism of digital inclusive finance on economic development, residents’ consumption, farmers’ entrepreneurship, and financing constraint alleviation. The study found that digital inclusive finance can significantly promote the above aspects, and its availability and convenience play a crucial role in people’s lives and national development. Different from the above studies, this paper takes the imbalance and insufficiency of development of digital inclusive finance as the research subject, takes China, which is currently leading in the development of digital inclusive finance, as the research scope, adopts the weighted Gini coefficient and quantile standardization methods to explore the regional differences and development shortcomings of digital financial inclusion in China, and reveals the structural causes. The kernel density estimation method and Markov chain method are further used to explore the dynamic evolution trend of imbalance and insufficiency. Compared with existing studies, this paper focuses on the following issues:
(1)
The imbalance of development of digital financial inclusion in China. It was found that there are regional differences in the development of digital financial inclusion in China, and the development of the eastern region is generally better than that of other regions, which is consistent with the study of Wang et al. [5]. The digital financial inclusion in the western region has the fastest growth, but the development gap between western and eastern regions is still large. This indicates that with the effective implementation of China’s financial poverty alleviation policy, the development of digital financial inclusion in the western region has achieved initial results, but the favorable conditions for the development of digital inclusive finance in the western region are insufficient, so that its service acceptance and usage are still far lower than that in the eastern region. Further examination found that the development within the eastern region is the most imbalanced, which may be due to the large differences between the provinces with higher levels of digital financial inclusion development (Beijing, Shanghai, Zhejiang, Guangdong, etc.) and the provinces with lower levels of development (Hebei, Hainan, Shandong, etc.) in the eastern region. In addition, in terms of structural causes, affected by the size of China’s population, the imbalance of coverage breadth has the greatest impact on the imbalance of development of digital inclusive finance in China’s four major regions. The above confirms hypothesis 1. In terms of the evolution trend, the rightward shift of the distribution of digital financial inclusion in 2020 is significantly smaller than that of the previous year, which may be because the COVID-19 pandemic has hindered the development of digital financial inclusion to a certain extent.
(2)
The insufficiency of development of digital inclusive finance in China. In order to better promote the further development of digital inclusive finance, this paper takes this as a starting point to conduct empirical research and reveal the shortcomings of China’s digital inclusive finance. The study found that the current development of digital inclusive finance in China is not sufficient, which is mainly affected by insufficiency of coverage breadth. For a country with a large population, it is difficult to achieve full coverage of digital accounts. The above also confirms hypothesis 2. In addition, from the specific point of view of each region, there are deficiencies in the use of financial services in the eastern region; the overall insufficiency level in the central region has not decreased significantly; the financial environment in the western region is relatively poor, and the use scenario of credit score is limited to some extent, which leads to the increase in the contribution rate of insufficiency of the digitalization degree; the population loss in the northeastern region leads to the decrease in effective financial accounts and the increase in the contribution rate of insufficiency of coverage breadth. Further examining the impact of COVID-19 on the shortcomings of digital inclusive finance in the four major regions, it was found that the contribution rate of insufficiency of digitalization degree in the four major regions has declined in 2020. This may be due to the implementation of contactless prevention and control measures during the epidemic period, which has made mobile payment widely used; mobile payment means such as two-dimensional code payments are widely used in major places, and the mobile and convenience advantages of digital inclusive finance have been fully brought into play in the era of the epidemic.
Compared with other studies on digital inclusive finance, this paper not only scientifically measures the imbalance and insufficiency of the development of digital inclusive finance, but also deeply examines its structural causes and evolution trend, which is innovative to a certain extent. Limited by the availability of research data, this paper still has some limitations in terms of research scope and research subject. In the future, we can further strengthen the research on the development level, development differences and development shortcomings of digital financial inclusion worldwide, and deeply explore the spatial correlation of digital inclusive finance among different regions.

8. Conclusions and Insights

Based on the revised Digital Inclusive Finance Index, we have measured the imbalance and insufficiency level of digital inclusive finance development in China from 2011 to 2020, further investigated its structural causes and analyzed the evolution trend. The main findings of this study are as follows:
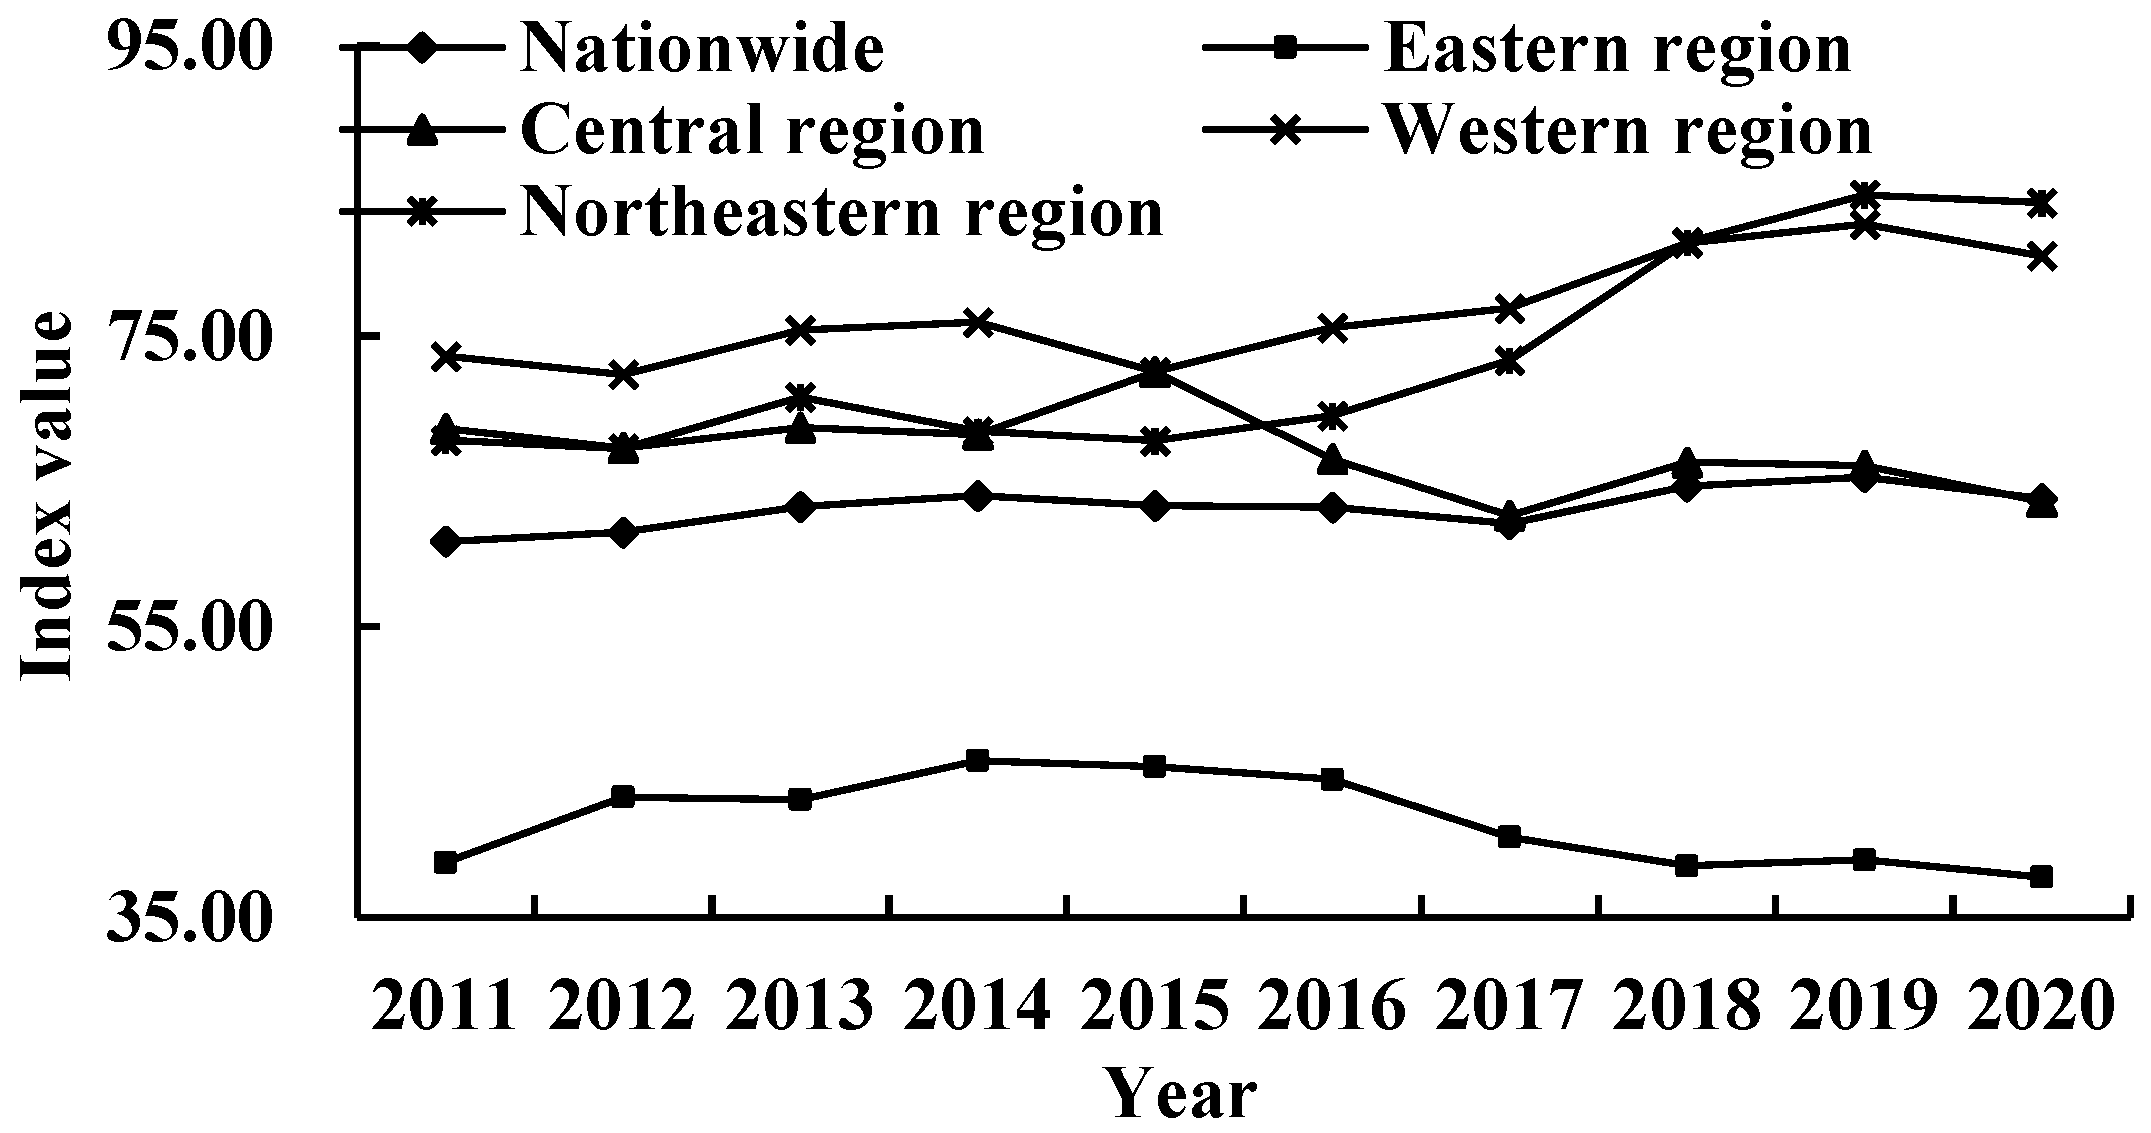
  • Over all, the Digital Inclusive Financial Index in China and the four major regions show an upward trend, maintaining positive growth under the impact of the COVID-19 epidemic in 2020, but the growth rate has declined. Specifically, the eastern region has the highest development level. The western region has the highest annual growth rate.
  • In terms of the imbalance of development, the imbalance level of digital inclusive finance development shows an downward trend. The eastern region has the highest imbalance level, and the development between the eastern and western regions is the most unbalanced. Inter-regional imbalance is the main source of overall development imbalance. The imbalance in coverage breadth is the main structural cause of imbalance development in China and the four major regions. The development gap of digital inclusive finance between the eastern region and the other three major regions has gradually widened, and the absolute difference tends to expand nationwide and in the eastern, central and western regions. The gap between the provinces with higher development degree and other provinces nationwide is gradually increasing, and there is a trend of bipolarization or multipolarization in China and the other three major regions, with the exception of the central region.
  • In terms of the insufficiency of development, the insufficiency level of digital inclusive finance rose slightly in China. The eastern region is relatively fully sufficient, and the western region is the most insufficient. The development shortcoming of digital inclusive finance in China and the four major regions is the coverage breadth. There is a significant “Club Convergence” nationwide and in the eastern, central and western regions. There is a “Matthew effect” of insufficient development of digital inclusive finance nationwide and in the four major regions. With the exception of the low- and medium-level provinces, provinces with other insufficiency levels in the western region are likely to experience leapfrogging.
According to the above research findings, the specific insights are as follows:
First, it should accelerate the construction of digital inclusive finance to promote the upward catch-up of low-level regions and the sustainable improvement of high-level regions. Regions with a low development level of digital inclusive finance should deepen the application of digital technology in the field of inclusive finance and improve the level of intelligent services in various fields such as payment, credit and insurance. At the same time, it should strengthen the training of digital innovative talents and further reduce the threshold of financial services. Regions with a high development level of digital inclusive finance should accelerate innovation in digital inclusive financial products and services to continuously meet people’s needs for comprehensive and differentiated financial services, and strengthen digital inclusive financial risk management to prevent and control possible infringements of consumer rights and interests arising from the application of digital technology.
Second, it should coordinate the development of digital inclusive finance among regions and narrow the development gap within the region. On the one hand, the government should accelerate the construction of inter-regional digital inclusive financial infrastructure connection, make full use of the pull effect and radiation effect of developed regions, further extend the coverage of digital inclusive financial institutions by utilizing the geographic penetration of digital inclusive finance to provide advanced experience for backward regions. On the other hand, the regional governments should strengthen the cooperation and exchange of digital inclusive finance in the region, establish and improve the financial benign operation mechanism serving the low-income groups, and improve the coverage of effective digital accounts and the utilization degree of financial services such as insurance and credit.
Third, it should focus on the development gaps of digital inclusive finance to break self-solidification. Provinces that are more fully developed should focus on the weak links in the early development process, carry out financial-knowledge popularization activities aiming at specific groups, improve people’s digital economic literacy [44], deepen the construction of a rural digital credit system, and narrow the “digital gap” between urban and rural areas. Provinces with less adequate development should combine the development experience of advanced provinces with the development characteristics of the province to build a characteristic digital inclusive financial system. At the same time, it should further improve the coverage of effective digital accounts in the region, promote the organic linkage among financial services to expand the depth of use, and optimize the online payment, micro-credit and other facilitation services to improve the digitalization degree.

Author Contributions

Conceptualization, M.C. and Q.C.; methodology, Q.L. and T.Z.; software, J.L. and W.Y.; validation, Q.C., Q.L. and T.Z.; formal analysis, M.C.; investigation, Q.C. and Q.L.; resources, T.Z. and J.L.; data curation, W.Y.; writing—original draft preparation, M.C. and Q.C.; writing—review and editing, Q.L.; visualization, T.Z., J.L. and W.Y.; supervision, M.C.; project administration, Q.C. and Q.L.; funding acquisition, M.C. All authors have read and agreed to the published version of the manuscript.

Funding

This research was funded by National Social Science Foundation of China (NSSFC) (22BJY191).

Institutional Review Board Statement

Not applicable.

Informed Consent Statement

Not applicable.

Data Availability Statement

Not applicable.

Acknowledgments

The authors would like to thank the editors and reviewers for their insightful comments and efforts toward improving this manuscript.

Conflicts of Interest

The authors declare no conflict of interest.

References

  1. Joia, L.A.; Cordeiro, J.P.V. Unlocking the Potential of Fintechs for Financial Inclusion: A Delphi-Based Approach. Sustainability 2021, 13, 11675. [Google Scholar] [CrossRef]
  2. Morgan, P.J. Fintech and Financial Inclusion in Southeast Asia and India. Asian Econ. Policy Rev. 2022, 17, 183–208. [Google Scholar] [CrossRef]
  3. Hu, M.; Zhang, J.; Chao, C. Regional financial efficiency and its non-linear effects on economic growth in China. Int. Rev. Econ. Financ. 2019, 59, 193–206. [Google Scholar] [CrossRef]
  4. Jiang, L.L.; Tong, A.; Hu, Z.; Wang, Y. The impact of the inclusive financial development index on farmer entrepreneurship. PLoS ONE 2019, 14, e0216466. [Google Scholar] [CrossRef] [PubMed] [Green Version]
  5. Wang, Q.; Yang, J.B.; Chiu, Y.H.; Lin, T.Y. Cross-regional comparative study on digital finance and finance efficiency in China: The eastern and non-eastern areas. Manag. Decis. Econ. 2022, 44, 68–83. [Google Scholar] [CrossRef]
  6. Lloyd, A.D.; Antonioletti, M.; Sloan, T.M. Able but not willing? Exploring divides in digital versus physical payment use in China. Inf. Technol. People 2016, 29, 250–279. [Google Scholar] [CrossRef]
  7. Aziz, A.; Naima, U. Rethinking digital financial inclusion: Evidence from Bangladesh. Technol. Soc. 2021, 64, 101509. [Google Scholar] [CrossRef]
  8. Li, J.; Wu, Y.; Xiao, J.J. The Impact of Digital Finance on Household Consumption: Evidence from China. Econ. Model. 2020, 86, 317–326. [Google Scholar] [CrossRef] [Green Version]
  9. Guo, C.; Wang, X.J.; Yuan, G.C. Digital Finance and the Efficiency of Household Investment Portfolios. Emerg. Mark. Financ. Trade 2022, 58, 2895–2909. [Google Scholar] [CrossRef]
  10. Ye, Y.; Pu, Y.J.; Xiong, A.L. The impact of digital finance on household participation in risky financial markets: Evidence-based study from China. PLoS ONE 2022, 17, e0265606. [Google Scholar] [CrossRef]
  11. Kouladoum, J.C.; Wirajing, M.A.K.; Nchofoung, T.N. Digital technologies and financial inclusion in Sub-Saharan Africa. Telecommun. Policy 2022, 46, 102387. [Google Scholar] [CrossRef]
  12. Li, F.H.; Zang, D.G.; Chandio, A.A.; Yang, D.M.; Jiang, Y.S. Farmers’ adoption of digital technology and agricultural entrepreneurial willingness: Evidence from China. Technol. Soc. 2023, 73, 102253. [Google Scholar] [CrossRef]
  13. Luo, S.M.; Sun, Y.K.; Zhou, R. Can fintech innovation promote household consumption? Evidence from China family panel studies. Int. Rev. Financ. Anal. 2022, 82, 102137. [Google Scholar] [CrossRef]
  14. Carter, M.R. Can digitally-enabled financial instruments secure an inclusive agricultural transformation? Agric. Econ. 2022, 53, 953–967. [Google Scholar] [CrossRef]
  15. Kim, D.W.; Yu, J.S.; Hassan, M.K. Inclusive finance and economic growth in OIC countries. Res. Int. Bus. Financ. 2017, 43, 1–14. [Google Scholar] [CrossRef]
  16. Ozili, P.K. Impact of digital finance on inclusive finance and stability. Borsa Istanb. Rev. 2018, 18, 329–340. [Google Scholar] [CrossRef]
  17. Duvendack, M.; Mader, P. Impact of inclusive finance in low- and middle-income countries: A systematic review of reviews. Campbell Syst. Rev. 2019, 15, e1012. [Google Scholar] [CrossRef] [Green Version]
  18. Liang, C.A.; Du, G.M.; Cui, Z.D.; Faye, B. Does Digital Inclusive Finance Enhance the Creation of County Enterprises? Taking Henan Province as a Case Study. Sustainability 2022, 14, 14542. [Google Scholar] [CrossRef]
  19. Liu, S.; Koster, S.; Chen, X.Y. Digital divide or dividend? The impact of digital finance on the migrants entrepreneurship in less developed regions of China. Cities 2022, 131, 103896. [Google Scholar] [CrossRef]
  20. Li, L.; Li, Z.L.; Li, L.H.; Wang, Z.H. Digital financial inclusion and environmental entrepreneurship: Evolution of state legal environmental responsibility in China. Environ. Sci. Pollut. Res. 2023, 30, 50309–50318. [Google Scholar] [CrossRef]
  21. Chen, B.; Zhao, C.K. Poverty reduction in rural China: Does the digital finance matter? PLoS ONE 2021, 16, e0261214. [Google Scholar] [CrossRef] [PubMed]
  22. Xiong, M.Z.; Li, W.Q.; Teo, B.S.X.; Othman, J. Can China’s Digital Inclusive Finance Alleviate Rural Poverty? An Empirical Analysis from the Perspective of Regional Economic Development and an Income Gap. Sustainability 2023, 14, 16984. [Google Scholar] [CrossRef]
  23. Xiong, M.Z.; Fan, J.J.; Li, W.Q.; Xian, B.T.S. Can China’s digital inclusive finance help rural revitalization? A perspective based on rural economic development and income disparity. Front. Environ. Sci. 2022, 10, 985620. [Google Scholar] [CrossRef]
  24. Li, Q.Q.; Liu, Q.L. Impact of Digital Financial Inclusion on Residents’ Income and Income Structure. Sustainability 2023, 15, 2196. [Google Scholar] [CrossRef]
  25. Ding, X.M.; Gao, L.F.; Wang, G.J.; Nie, Y. Can the development of digital financial inclusion curb carbon emissions? Empirical test from spatial perspective. Front. Environ. Sci. 2022, 10, 1045878. [Google Scholar] [CrossRef]
  26. Zhao, H.; Yang, Y.R.; Li, N.; Liu, D.S.; Li, H. How Does Digital Finance Affect Carbon Emissions? Evidence from an Emerging Market. Sustainability 2021, 13, 12303. [Google Scholar] [CrossRef]
  27. Wang, H.L.; Guo, J.G. Impacts of digital inclusive finance on CO2 emissions from a spatial perspective: Evidence from 272 cities in China. J. Clean. Prod. 2022, 355, 131618. [Google Scholar] [CrossRef]
  28. Guo, F.; Wang, J.; Wang, F.; Kong, T.; Zhang, X.; Cheng, Z. Measuring the Development of Digital Inclusive Finance in China: Index Compilation and Spatial Characteristics. China Econ. Q. 2020, 19, 1401–1418. [Google Scholar]
  29. Razzaq, A.; Yang, X.D. Digital finance and green growth in China: Appraising inclusive digital finance using web crawler technology and big data. Technol. Forecast. Soc. Chang. 2023, 188, 122262. [Google Scholar] [CrossRef]
  30. Shen, Y.; Hueng, C.J.; Hu, W.X. Measurement and spillovereffect of digital financial inclusion: A cross-country analysis. Appl. Econ. Lett. 2021, 28, 1738–1743. [Google Scholar] [CrossRef]
  31. Khera, P.; Ng, S.; Ogawa, S.; Sahay, R. Measuring Digital Financial Inclusion in Emerging Market and Developing Economies: A New Index. Asian Econ. Policy Rev. 2022, 17, 213–230. [Google Scholar] [CrossRef]
  32. Vasile, V.; Panait, M.; Apostu, S.A. Financial Inclusion Paradigm Shift in the Postpandemic Period. Digital-Divide and Gender Gap. Int. J. Environ. Res. Public Health 2022, 18, 10938. [Google Scholar] [CrossRef]
  33. Takmaz, S.; Sari, E.; Alatas, S. Financial inclusion in Turkey: Unpacking the provincial inequality and its determinants. Appl. Econ. Lett. 2022. [Google Scholar] [CrossRef]
  34. Lyons, A.C.; Kass-Hanna, J.; Fava, A. Fintech development and savings, borrowing, and remittances: A comparative study of emerging economies. Emerg. Mark. Rev. 2022, 51, 100842. [Google Scholar] [CrossRef]
  35. Li, H.J.; Shi, Y.; Zhang, J.X.; Zhang, Z.K.; Zhang, Z.S.; Gong, M.G. Digital inclusive finance & the high-quality agricultural development: Prevalence of regional heterogeneity in rural China. PLoS ONE 2023, 18, e0281023. [Google Scholar] [CrossRef]
  36. Bacha, O.I.; Mirakhor, A. Funding development infrastructure without leverage: A risk-sharing alternative using innovative sukuk structures. World Econ. 2018, 41, 752–762. [Google Scholar] [CrossRef]
  37. Loganathan, T.; Chan, Z.X.; Pocock, N.S. Healthcare financing and social protection policies for migrant workers in Malaysia. PLoS ONE 2020, 15, e0243629. [Google Scholar] [CrossRef] [PubMed]
  38. Saviano, M.; Nenci, L.; Caputo, F. The financial gap for women in the MENA region: A systemic perspective. Gend. Manag. Int. J. 2017, 32, 203–217. [Google Scholar] [CrossRef]
  39. Spires, E.E. Using the Analytic Hierarchy Process to Analyze Multiattribute Decisions. Multivar. Behav. Res. 1991, 26, 345–361. [Google Scholar] [CrossRef]
  40. Dagum, C. A New Approach to the Decomposition of the GiNi Income Inequality Ratio. Empir. Econ. 1997, 22, 515–531. [Google Scholar] [CrossRef]
  41. Quah, D. Galton’s Fallacy and Tests of the Convergence Hypothesis. Scand. J. Econ. 1993, 95, 427–443. [Google Scholar] [CrossRef]
  42. Peng, P.; Mao, H. The Effect of Digital Financial Inclusion on Relative Poverty Among Urban Households: A Case Study on China. Soc. Indic. Res. 2023, 165, 377–407. [Google Scholar] [CrossRef]
  43. Xu, S.; Wang, J.W. The Impact of Digital Financial Inclusion on the Level of Agricultural Output. Sustaninability 2023, 15, 4138. [Google Scholar] [CrossRef]
  44. Xie, B.; Charness, N.; Fingerman, K.; Kaye, J.; Kim, M.T.; Khurshid, A. When Going Digital Becomes a Necessity: Ensuring Older Adults’ Needs for Information, Services, and Social Inclusion During COVID-19. J. Aging Soc. Policy 2020, 32, 460–470. [Google Scholar] [CrossRef]
Figure 1. The digital inclusive finance index in China and four major regions from 2011 to 2020.
Sustainability 15 10286 g001
Figure 2. China’s national and four major regions’ imbalance index and inter-regional imbalance index from 2011 to 2020. (a) National and four major regions’ imbalance index, (b) Inter-regional imbalance index. In Figure (b), 1 represents the eastern region, 2 represents the central region, 3 represents the western region, and 4 represents the northeast region.
Sustainability 15 10286 g002
Figure 3. Sources and contribution rates of China’s overall digital inclusive finance development imbalance.
Sustainability 15 10286 g003
Figure 4. Results of the decomposition of the contribution of intra-regional and inter-regional imbalances in the four major regions of China. (a) The decomposition of intra-regional imbalance, (b) The decomposition of inter-regional imbalance. In (b), 1 represents the eastern region, 2 represents the central region, 3 represents the western region, and 4 represents the northeast region.
Sustainability 15 10286 g004
Figure 5. The structural contribution to the imbalance of China and the four major regions.
Sustainability 15 10286 g005
Figure 6. The trend evolution of digital financial inclusion in China and the four major regions from 2011 to 2020.
Sustainability 15 10286 g006
Figure 7. China’s national and four major regions’ insufficiency index from 2011 to 2020.
Sustainability 15 10286 g007
Figure 8. The structural contribution to the insufficiency of China and the four major regions.
Sustainability 15 10286 g008
Table 1. Judgment matrix of depth of use.
PaymentInsuranceCredit
Payment11/21/3
Insurance211/2
Credit321
Table 2. Revised digital financial inclusion evaluation indicators and weights.
Level 1 DimensionLevel 2 DimensionIndicator
Coverage breadth
0.540
Account coverage rate
1.000
Number of Alipay accounts owned by per 10,000 people
Proportion of Alipay users who have bank cards bound to their Alipay accounts
Average number of bank cards bound to each Alipay account
Depth of use
0.297
Payment
0.163
Number of payments per capita
Amount of payments per capita
Proportion of number of high frequency active users (50 times or more each year) to number of users with frequency of once or more each year
Credit
0.540
Individual userNumber of users with an Internet loan for consumption per 10,000 adult Alipay users
Number of loans per capita
Total Amount of loan per capita
Small and Micro BusinessNumber of users with an Internet loan for small and micro businesses per 10,000 adult Alipay users
Number of loans per small and micro business
Average amount of loan among small and micro businesses
Insurance
0.297
Number of insured users per 10,000 Alipay users
Number of insurance policies per capita
Average insurance amount per capita
Digitalization degree
0.163
Mobility
0.497
Proportion of the number of mobile payments
Proportion of total amount of mobile payments
Affordability
0.248
Average loan interest rate for small and micro businesses
Average loan interest rate for Individuals
Credit
0.095
Proportion of number of Ant Check Later payments
Proportion of total amount Ant Check Later payment
Proportion of number of ‘Zhima Credit as deposit’ case (to number of full-deposit cases)
Proportion of total amount of ‘Zhima Credit as deposit’ (to amount of full-deposit)
Convenience
0.160
Proportion of number of QR-code payments by users
Proportion of as above, please clarify with ‘average amount’ or ‘total amount’ of QR-code payments by users
Table 3. Descriptive statistics.
MeanStd. Dev.MediansMinMax
Coverage breadth196.669696.5560197.23001.9600397.0000
Depth of use244.2729108.3670255.27137.1574500.7732
Digitalization degree290.1423117.2522323.25007.5800462.2300
Nationwide226.0438100.5417238.911716.0615435.5007
Eastern region253.1093104.4651263.674531.3925435.5007
Central region221.9263100.7315236.247927.5815361.7904
Western region208.635695.1380227.075016.0615351.8110
Northeastern region213.693393.2581233.305524.4965336.1731
Table 4. Traditional Markov transfer matrix for digital financial inclusion in China as a whole and in the four major regions.
Regiont/t + 1LMLMHH
NationwideL0.84000.023800
ML0.04000.83330.01400
MH00.07140.74830.1600
H000.16780.6900
Eastern regionL0.68180.137900
ML0.18180.58620.12500
MH00.17240.71880.1765
H000.06250.7647
Central regionL0.80000.100000
ML00.70000.09090
MH000.54550.2609
H000.31820.6522
Western regionL0.70270.17860.05560
ML0.13510.50000.16670
MH0.08110.25000.41670.3158
H0.027000.22220.5263
Northeastern regionL0.8333000
ML0.16670.20000.15380
MH00.80000.61540
H000.15380.6667
Note: L: low-level provinces; ML: medium- and low-level provinces; MH: medium- and high-level provinces; H: high-level provinces.
Disclaimer/Publisher’s Note: The statements, opinions and data contained in all publications are solely those of the individual author(s) and contributor(s) and not of MDPI and/or the editor(s). MDPI and/or the editor(s) disclaim responsibility for any injury to people or property resulting from any ideas, methods, instructions or products referred to in the content.

