Abstract
The recovery of municipal solid waste incineration (MSWI) fly ash is currently considered to be the most viable solution for its management. However, in developing resource recovery technologies, it is crucial to consider the overall environmental impact. This study employed a life-cycle assessment (LCA) to compare environmentally friendly red bricks partially utilizing MSWI fly ash as a raw material with conventional red bricks. The results demonstrate that the use of phosphoric acid during the resource recovery process imposes the most significant environmental burden, followed by electricity consumption. To address this issue, in this study, we simulated the replacement of phosphoric acid with phosphoric acid monohydrate recovered from discarded fire extinguishers, resulting in the production of second-generation environmentally friendly red bricks. The analysis revealed that the environmentally friendly red bricks exhibited a mere 5.52% increase in total environmental impact compared with traditional red bricks. Moreover, by stabilizing heavy metals using recovered phosphoric acid monohydrate, the second-generation environmentally friendly red bricks achieved an 8.75% reduction in total environmental impact relative to traditional red bricks. These findings highlight the environmental benefits of fly ash reuse in red brick production, and the incorporation of other industrial waste or byproducts could further enhance its efficacy. The application of the LCA facilitated the identification of key areas for improvement and enabled precise evaluation of the environmental benefits associated with waste reuse.
1. Introduction
Incineration is widely employed as a primary method for municipal solid waste management in many countries and regions. However, fly ash produced during the incineration process contains various hazardous heavy metals (e.g., lead and cadmium) and dioxins, rendering it noncompliant with leaching tests mandated by legal regulations, thereby classifying it as hazardous waste [1]. In Taiwan, the current approach for fly ash disposal involves solidification and subsequent landfilling [2]. Nevertheless, the high concentration of soluble salts (notably, chloride salts) in fly ash adversely affects the long-term stability of the solidified materials [3]. Furthermore, the solidification process leads to a significant increase in volume, necessitating substantial landfill space. Considering the imperative of efficient land utilization, this approach has proven to be suboptimal. Consequently, there is a growing trend of treating fly ash appropriately, either by transforming it into general waste or by repurposing it as a raw material for other industries, or even as a direct input for industrial products. China has already implemented technical pollution-control regulations for fly ash, enabling treated fly ash to be categorized as general waste or utilized as a valuable resource for other industries [2].
There are several research directions for the reuse of fly ash, including chemical stabilization, mechanical–chemical stabilization or activation [4], extraction, sintering, melting, partial substitution of cement clinker, and raw material substitution. These technologies have been extensively researched for over a decade and have demonstrated technical feasibility. However, the number of commercial applications remains limited. The utilization of fly ash in cement production has been one relatively successful approach, due to the substantial demand for fly ash in the cement industry [5]. However, concerns persist regarding the substitution of cement clinker. In the case of substituting cement clinker, uncertainties exist regarding the residual chloride salts and heavy metals in fly ash after the washing process, which could potentially affect the properties and long-term stability of cement products [6]. Similarly, for technologies aiming to substitute cement raw materials, the high temperatures required in cement manufacturing contribute to high carbon emissions, making it a less environmentally friendly method from a life-cycle assessment perspective. Moreover, there are concerns about the volatilization of heavy metals stored in fly ash during the high-temperature cement production process, leading to secondary pollution [7].
Other reuse technologies also face various challenges. For instance, the chemical stabilization of heavy metals and dioxins in fly ash results in very low leaching concentrations, rendering it non-hazardous waste. Similarly, different physicochemical methods can extract heavy metals and chloride salts, transforming them into non-hazardous waste [8]. However, without considering the appropriate reuse products, the overall waste management problem remains unsolved, and the disposal of byproducts, including waste chemicals, needs to be addressed. Additionally, although melting can physically stabilize heavy metals and destroy dioxins, concerns arise regarding the environmental impact and cost associated with the high temperatures required [9]. Therefore, in the process of developing waste reuse technologies, two key considerations should be thoroughly addressed: Firstly, it is essential to identify suitable reuse products that comply with current performance standards. For instance, if fly ash is utilized as lightweight aggregates or bricks for construction purposes, it should meet specified requirements for compressive strength and water permeability. Furthermore, for hazardous waste such as municipal solid waste incineration fly ash, careful evaluation of the environmental safety of the reuse products is crucial. Secondly, a comprehensive comparison of the entire technical treatment process is necessary, encompassing factors such as energy consumption and resource utilization (e.g., chemicals or additives), in relation to existing market products. This holistic evaluation is crucial for assessing costs, environmental impacts, market acceptance, and government policy support. In this regard, life-cycle assessment (LCA) can provide valuable insights into addressing environmental impact concerns associated with reuse technologies and identifying areas for improving technical parameters.
Many waste recycling studies have used LCA analysis. For example, a studycompared three MSWI fly ash recycling technology solutions (washed and used as a substitute for part of the cement raw material; washed and used as a substitute for part of the burnt brick raw material; and reused as an alkali in the Waelz steelmaking process) with the current solidification landfill disposal method [10]. This article establishes the concept of a comparison benchmark value, which is to use solidification landfill as the comparison benchmark of reuse technology, and identifies the solidification landfill used. Large amounts of raw materials are used in construction; cement is the main cause for the high environmental impact. This study only evaluated the environmental impact. The reuse of fly ash for brickmaking is the best way, but it also demonstrates cost-effectiveness, product trends, and risks. Management factors should also be considered in the evaluation of reuse, which represents very valuable research. However, recycling technology is not developed by itself, and it is not easy to know the detailed parameters of the entire technical process; thus, the evaluation results may have large errors. A studyevaluated the environmental impacts of two different types of lignite fly ash geopolymer bricks and compared them with traditional Portland cement (PC) bricks. Their study covered the brick life-cycle from cradle to grave. Studying the 12 main impact categories in the grave stage requires a comprehensive LCA evaluation. PC bricks and two polymer bricks have different compressive strengths and different uses; therefore, this study adopted the concept of impact strength and integrated an LCA. The total impact determined from the analysis was divided by the compressive strength to obtain its impact strength. The study found that the use of fly ash instead of cement to make bricks in the manufacturing stage has considerable potential for reducing environmental impacts. Moreover, recycling can significantly reduce emissions and energy consumption, showing that reusing waste as bricks is environmentally beneficial. The study also found that the durability of reused products should be evaluated, and it is believed that increasing durability can improve the sustainability of construction applications; however, this study did not actually assess the durability of reused bricks [11]. A studytook Shanghai, China—a city with a population of over 20 million—as an example and established a reuse optimization model for the sustainable management of household waste incineration fly ash (IFA), incorporating hybrid life-cycle assessment (HLCA) and multi-objective optimization (MOO). Two non-thermal processing IFA reuse technologies (washing for reuse as bricks and producing salt as a byproduct; and washing for reuse as brick and wastewater treatment as a byproduct) and the most widely used cement kiln co-treatment (washing raw material for cement manufacture and the production of salt as a byproduct) were compared. The study found that byproduct offsets can significantly improve the environmental performance of IFA utilization methods, while the global warming potential of non-thermal utilization is much lower than that of cement kiln co-processing. The study determined that the market acceptance of the non-thermal processing of byproducts will be influenced through price shocks. Therefore, a win–win scenario would involve economic benefits; additional marketing policies and industrial symbiosis methods are crucial to develop sustainable IFA utilization technologies. This study determined the optimal utilization of IFA through the integration of HLCA and MOO. The optimal design and operation plan provide a scientific basis for improving the environmental and economic performance of IFA reuse. The only drawback is that only the environmental impact of GWP100 was evaluated, and other environmental impacts (such as toxicity, acidification, and eutrophication) were not evaluated. Important factors pertaining to sustainability, such as social impacts, were also overlooked. In summary, the relevant waste LCA research literature indicates that the two above considerations in the research and development process of waste reuse technology are indeed necessary [12].
This study aimed to assess the environmental impact of environmentally friendly red bricks produced by partially replacing natural raw materials with fly ash, using a life-cycle assessment (LCA) approach. The key technology for manufacturing these environmentally friendly red bricks involves the application of mechanical–chemical principles to stabilize heavy metals in fly ash and promote sintering efficiency. This technology was developed by our team and is one of the first applications of mechanical–chemical principles in fly ash reuse [13]. The objective of this study was to analyze the environmental impacts of fly ash reuse in bricks and identify areas for improvement. The bricks produced by substituting fly ash for a portion of the raw materials meet current performance standards, including for compressive strength, and have undergone and passed durability assessments. The environmental safety aspects, such as heavy metal leaching and dioxin destruction, comply with regulatory limits. Thus, these bricks can be considered to be more marketable as reuse products, representing a more consistent benchmark for comparison. Additionally, this study is the first to conduct a comprehensive LCA specifically evaluating the environmental impacts of the mechanical–chemical approach in fly ash reuse. The assessment results demonstrate a high level of precision, novelty and, most importantly, accurate evaluation of the environmental impact associated with the partial replacement of raw materials in the production phase with fly ash. This study provides an objective and scientific basis for assessing the value of waste reuse.
2. Research Methods
2.1. Life-Cycle Assessment
In order to clearly understand the environmental load of the developed fly ash recycling technology, we introduced the life-cycle assessment method, which was established by the Society of Environmental Toxicology and Chemistry (SETAC) in 1990 [14]. A set of technology incorporates its methods into ISO 14040. According to ISO 14040, the life-cycle assessment method framework can be divided into the following four steps [15]:
- (1)
- Purpose and scope definition.
- (2)
- Life-cycle inventory analysis.
- (3)
- Life-cycle assessment and impact assessment.
- (4)
- Interpretation of results.
This study was carried out according to the four steps one by one; the process of recycling fly ash was divided into red brick raw materials in the first stage and the burning of red bricks into environmentally friendly red bricks in the latter stage. The operation of the manufacturing process in the actual factory is also two separate processes; in this evaluation, we introduce them separately [16].
2.2. Inquiry Data Acquisition Part
In the process of life-cycle assessment, the most important stage is the inventory stage, because the information obtained from the inventory has a decisive impact on the analysis of the results, and the most accurate method of inventory is to assess the actual factory, but contemporary resource technology is still in the research and development stage. There was no factory available for inspection in this study; therefore, we organized the data simulation and acquisition methods as follows.
2.2.1. Fly Ash Conversion into Red Bricks
Fly ash is turned into red bricks as raw materials. Based on the laboratory data, a simulation was performed to design the operation process of the actual plant and the raw materials needed for the actual operation. Then, following the process, the materials required for the actual operation of the plant were evaluated. Equipment was used to simulate the energy resource usage during actual operation.
2.2.2. Fly Ash Red Bricks Are Fired into Environmentally Friendly Red Bricks
In order to accurately simulate the process of feeding fly ash red bricks into environmentally friendly red bricks in red brick factories, as well as the use and pollution of energy resources, we first cooperated with red brick manufacturers to assess the production process, energy, and resources of general red bricks to determine their use and pollution, and then we held discussions with relevant red-brick-firing experts and scholars to evaluate the actual manufacturing process and equipment use of environmentally friendly red bricks in the future from the perspectives of feasibility, economy, law, and environmental protection, with reference to the previous tradition. The red brick inspection data were simulated so that the data could be closer to the operation of the actual factory.
2.3. SimaPro Software
In the life-cycle impact assessment, this study used SimaPro software to perform the analysis. This software was developed by Leiden University in the Netherlands in 1990, and it continued to be developed by PRé Consultants to SimaPro version 7.21. SimaPro is a leading brand in the field of life-cycle assessment and is widely used. The most important thing is that this software has a rich internal database, which allows users to customize and classify data from different sources. The assessment of impact can compare the impact on the environment produced by different procedures and raw materials [17].
There are many assessment methods in SimaPro software but, in this study, Eco-Indicator 99 was chosen as the impact assessment method. Eco-Indicator 99 is a damage-oriented assessment method developed by PRé Consultants. Using this assessment method to assist in the analysis can help to analyze the inventory data of the life-cycle quickly; it has five analysis items of normalization, damage assessment, weighting, and single-point scoring [18].
3. Results and Discussion
3.1. Life-Cycle Assessment of the Process of Turning Incineration Fly Ash into the Red Brick Feedstock
3.1.1. Goals and Scope Definition
The goal was to simulate the environmental damage assessment of the actual plant in the fly ash recycling process, and the scope of this assessment included the water extraction process and the grinding stabilization process, as shown in Figure 1.
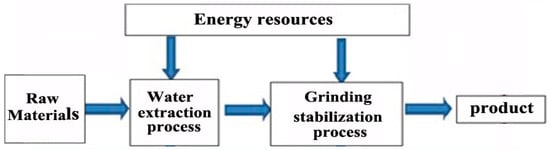
Figure 1.
Fly ash resource utilization in the red brick feed process.
In addition, in this process, the generated water extraction waste liquid contained usable substances and could be used as a raw material for other products; thus, it was recycled.
3.1.2. Assumptions and Limitations
In the process of turning incineration fly ash into red bricks, we did not consider the environmental load of fly ash itself for the raw material fly ash, because fly ash is a hazardous waste product produced in incinerators. It contains large amounts of heavy metals and dioxins; if it is discharged randomly, it will cause great harm to the environment. Therefore, if the fly ash is recycled and reused, it should be beneficial for the environment. Therefore, for the raw material fly ash, the environmental load was considered to be zero.
In addition, in the process of turning fly ash into red bricks as raw materials, wastewater is recycled and reused; the wastewater is processed into economically valuable products and then discharged after meeting the discharge water standards. This could pollute the environment; therefore, there is no pollution discharge during the process of turning fly ash into red bricks as raw materials.
3.1.3. Definition of a Functional Unit
Taking the production of 1 kg of red brick raw materials as the basic unit, its functions can partially replace the raw materials of ordinary red bricks and become the components of red bricks.
3.1.4. Inquiry Information
Here, according to the scope of this study, we turned the fly ash into red brick feed; the raw materials used in the system, the use of energy resources, and the discharge of pollutants are shown in Figure 2 after being sorted. Although recycled water is discharged, it will not pollute the environment because it is recycled and reused after discharge; the recycling process is not within the scope of this analysis.
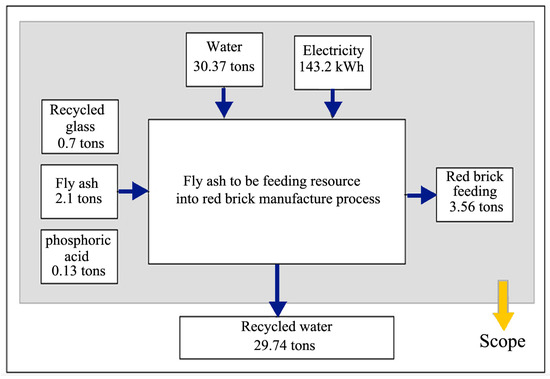
Figure 2.
Process of recycling fly ash into red brick feed.
3.1.5. Life-Cycle Assessment and Impact Assessment
Here, the results of the evaluation and analysis of the above data through Eco-Indicator 99 in the life-cycle assessment software SimaPro are briefly described.
- (a)
- Characterization
Characterization was performed to classify the results of the life-cycle inspection according to its influence on the following 11 environmental factors stipulated in Eco-Indicator 99: carcinogens, respiratory organics and respiratory inorganics, climate change, radiation, the ozone layer, ecotoxicity, radiation, acidification/eutrophication, land use, minerals, and fossil fuels [19].
Among them, the units of carcinogens, respirable organic substances, respirable inorganic substances, climate change, radiation, and the ozone layer were DALY (disability adjusted life years, life reduction years), which means that the pollutants are produced as a functional unit that causes human bodily harm, i.e., the number of years of life lost. In addition, the unit of ecotoxicity was PAF × m2 × year, which represents the ecological impact at a specific time and place; PAF (potentially affected fraction) is the potential value of ecosystem impact. The units of acidification/eutrophication and land use were PDF × m2 × year, along with the potential value of species reduction; PDF (potentially disappeared fraction) is calculated as each kilogram of emissions at a specific time and a specific location against the disappearance potential of the species. Minerals and fossil fuels were expressed as surplus energy (MJ surplus). The definition of residual energy is that when people are mining minerals, they often prioritize those that are more accessible and, as such, require lower energy consumption. However, when the more accessible minerals are mined, those that are more difficult to mine remain, and more energy is required to mine them; the energy consumption of the more difficult-to-mine materials minus the energy consumption of the better-to-mine materials is the “residual energy” [20].
After characterization, it was determined that when the fly ash was converted into 1 kg of red bricks, the carcinogens produced would have an impact of 4.68 × 10⁻⁹ DALY. In addition, as shown in Figure 3, the carcinogens from electricity and phosphoric acid have the greatest impact on the human body. Among the inhalable organic substances, the damage to the human body and life is 7.84 × 10⁻¹¹ DALY, and the use of phosphoric acid accounts for the largest proportion: 6.29 × 10⁻¹¹. The damage caused by inhalable inorganic substances entering the human body is 6.02 × 10⁻⁸ DALY. Among them, the inhalable inorganic substances caused by phosphoric acid cause damage to the human body at 4.26 × 10⁻⁸ DALY, contributing 70.7% and ranking first. Electricity has the second-highest contribution, with 21.3%, accounting for 1.28 × 10⁻⁸ DALY.
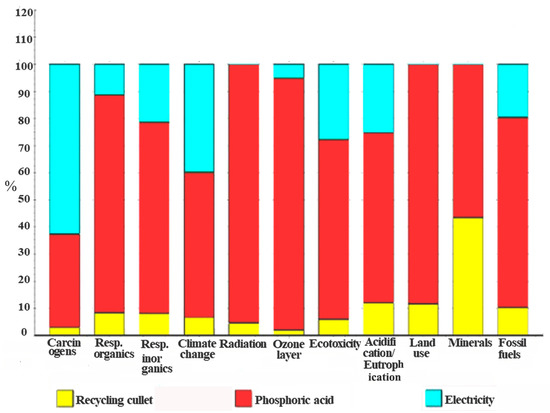
Figure 3.
Feed characterization results of recycling fly ash into red bricks.
Climate change hazards, i.e., pollutants produced that cause climate change, impact people’s life expectancy to the degree of 1.33 × 10⁻⁸ DALY, of which phosphoric acid and electricity contribute 7.07 × 10⁻⁹ DALY and 5.23 × 10⁻⁹ DALY, or 53.3% and 40.1%, respectively. The impact on the human body caused by radiation hazards is 3.45 × 10⁻¹⁰ DALY, most of which is contributed by phosphoric acid. In addition, radiation enters the Earth’s atmosphere from outer space through holes in the ozone layer and causes human bodily harm; this damage is 3.26 × 10⁻¹¹ DALY. Figure 3 shows that phosphoric acid contributes the largest proportion of environmental load: 92.8%.
The raw materials and energy resources used in the manufacture of fly ash as a raw material for red bricks are discharged, and the ecologically toxic substances are discharged into the atmosphere, water, and soil, causing damage to the ecosystem of 1.85 × 10⁻² PAF·m2·yr. The proportions of environmental load contributed by phosphoric acid and electricity are 66.3% and 27.9%, respectively.
Acidification/optimization is the emission of acidic substances into the atmosphere, which threatens the ecosystem. The impact of fly ash resources in red brick feed is 1.58 × 10⁻³ PDF·m2·yr, of which the emission of acidic substances is presented in Figure 3. According to the tree diagram in Figure 3, recycled broken glass contributes 12.1%, phosphoric acid contributes 62.6%, and electricity contributes 25.2%.
Land use is the impact of land development on the diversity of species on a unit of land. Here, the impact of land use is 6.33 × 10⁻⁴ PDF·m2·yr, of which recycled cullet contributes 11.6%, while phosphoric acid contributes 88.4%.
Fly ash is recycled into red bricks; therefore, the residual energy of minerals is 2.81 × 10⁻⁴ MJ surplus. Figure 3 shows that recycled glass and phosphoric acid contribute 43.4% and 56.6%, respectively. The recycling of fly ash resources into red brick feedstock causes damage to fossil fuels; thus, its residual energy is 7.58 × 10⁻² MJ surplus. The contribution of recycled cullet is 10.4%, the contribution of phosphoric acid is 69.9%, and the contribution of electricity is 19.7%.
- (b)
- Damage assessment
After characterization, in order to more clearly and simply distinguish the impacts of the 11 factors in the characterization, the characterization factors were classified and transformed into “Human health”, “Ecosystem quality”, and “Resources consumption”, expressed as percentages, to enable a damage assessment [21].
In the damage assessment of fly ash resource conversion into red brick feed, as shown in Figure 4, regardless of human health, ecosystem quality, and resource consumption, the percentage of phosphoric acid is still the highest, and electricity usage is the second-highest. The impact on human health is 7.86 × 10⁻⁸ DALY, and that on the quality of the ecosystem is 4.07 × 10⁻³ DALY.
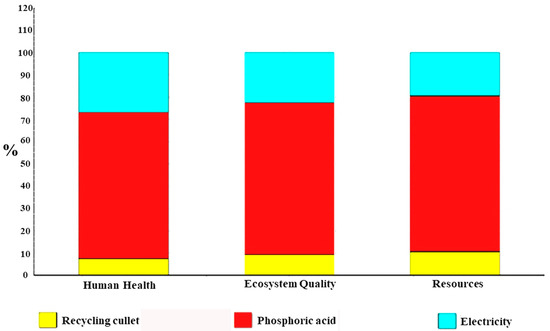
Figure 4.
Feed damage assessment map of recycling fly ash into red bricks.
- (c)
- Normalization
Normalization was performed to assign an index to the average damage caused to each European due to environmental load within one year, according to the magnitude of the effect, and taking 1993 as the base year. Therefore, after normalization analysis of Eco-Indicator 99, Figure 5 shows that its score is 5.12 × 10⁻⁶ in terms of human health, 7.93 × 10⁻⁷ in terms of ecosystem quality, and 9.05 × 10⁻⁶ in terms of resource consumption.
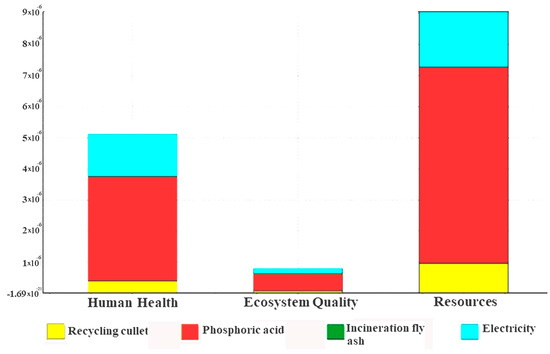
Figure 5.
Normalization diagram of recycling fly ash into red brick feed.
- (d)
- Weights
After characterization, damage assessment, and normalization, the issues that people focus on, along with the severity and size of the damage, were weighted by factors determined by the LCA peer group and relevant experts at a meeting; the values after the weight calculation are shown in Figure 6 and Table 1. In order from highest to lowest, the human health score is 2.05 × 10⁻³ Pt, the resource consumption score is 1.81 × 10⁻³ Pt, and the ecosystem quality score is 3.17 × 10⁻⁴ Pt.
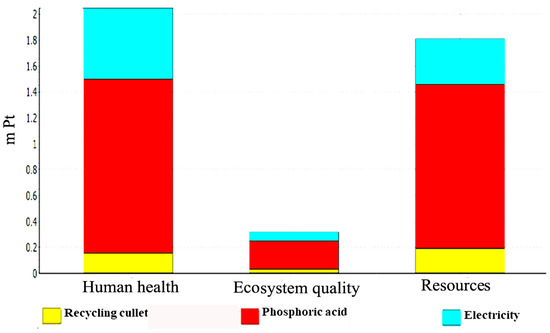
Figure 6.
Feed weight map of recycling fly ash resources into red bricks.

Table 1.
Weight table of fly ash resource conversion into red brick feed.
- (e)
- Point Scoring
The single-point scores are shown in Figure 7, after analyzing the above data using the Eco-Indicator 99 damage assessment in the life-cycle assessment software SimaPro.
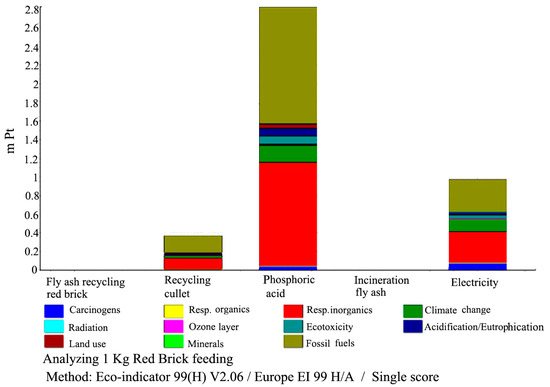
Figure 7.
Score diagram of single-point feed for fly ash resource conversion into red bricks.
Figure 7 indicates that among the feed materials of 1 kg of red bricks made from fly ash, the use of phosphoric acid to produce red bricks results in the highest environmental load. This is because phosphoric acid produces respirable non-toxic inorganic substances, which are very harmful to the human body, and the production process of phosphoric acid also requires a lot of energy; secondly, the environmental load brought by the red brick feeding is a product of the use of electricity; the lowest environmental load is caused by the recycling of broken glass.
In addition, because incineration fly ash is recycled and used as a raw material, it is theoretically beneficial to the environment. However, because there is no relevant information available at present, it was calculated as zero. In addition, in the production of fly ash resources into red brick feed materials, because the wastewater generated is recycled and reused by the laboratory as a byproduct, it does not cause any environmental pollution, so the environmental load caused by this process is also zero.
3.2. Comparison of the Life-Cycles of Red Bricks, Environmentally Friendly Red Bricks, and Second-Generation Environmentally Friendly Red Bricks
3.2.1. Definition of Goals and Scope
The goal of this study was to evaluate traditional red bricks, environmentally friendly red bricks, and second-generation environmentally friendly red bricks through life-cycle assessment analysis. By grinding and stabilizing the heavy metal fly ash resources of red brick feed, second-generation environmentally friendly red bricks can be used in the manufacture of fire extinguishers. The waste heat introduced into red brick kilns reaches 130 °C. It was hoped that the comparison between generic red bricks and the environmentally friendly red bricks could demonstrate the differences between them in terms of their environmental impacts. Additionally, scenario simulation was utilized to evaluate the second-generation environmentally friendly red bricks for comparison, as a reference for future research and development.
Figure 8 presents the scope of the system; for this reason, the three raw materials entered the factory and were studied until the red bricks had been produced.
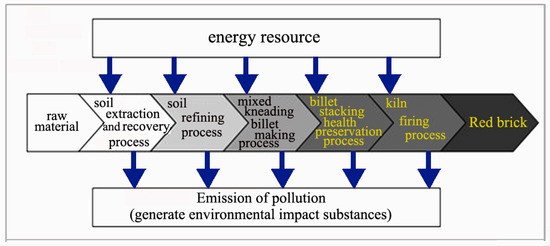
Figure 8.
General scope of the red brick production system.
The process units within the scope of this system include the soil extraction and recovery processes, the soil refining process, the mixed kneading billet-making process, the billet-stacking health preservation process, and the kiln-firing process—a total of five key processes. The inspection of the red bricks, environmentally friendly red bricks, and second-generation environmentally friendly red bricks was the same.
3.2.2. Assumptions and Limitations
It was assumed that waste ammonium dihydrogen phosphate was used instead of phosphoric acid in the production of the environmentally friendly red bricks, which did not change the engineering properties of the red brick products.
3.2.3. Definition of Functional Units
For the convenience of research, the functional units of the red bricks, environmentally friendly red bricks, and second-generation environmentally friendly red bricks were all defined the same; the production of 1 kg of red bricks was the basic unit.
3.2.4. Inquiry Information
The data of the red brick study after sorting and cleaning are shown in Figure 9. The presented interrogation data were obtained from the actual factory. The time period was from September 1998 to April 1999. In total, 20 values were calculated and averaged. The location of the investigation was a red brick factory in Longtan, Taoyuan, China.
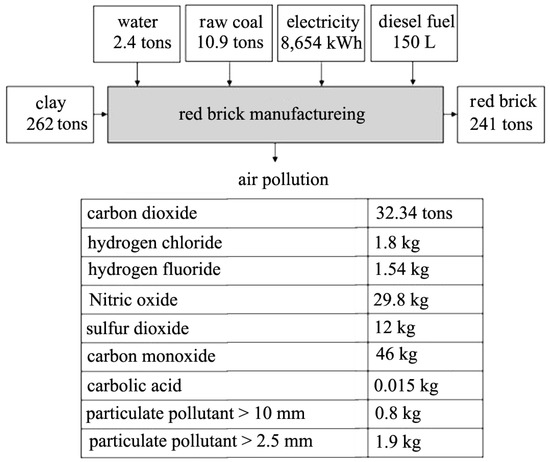
Figure 9.
Red brick manufacturing process inventory data map.
In the analysis of environmentally friendly red bricks, the raw materials used were a mixture of clay and fly ash recycled into red brick feedstock. Therefore, in the factory simulation, the optimal ratio deployed in the laboratory could be used. Combined with the data obtained from the red brick factory, hypothetical simulations were carried out. In addition, in practice, if a brick factory wants to reuse fly ash, it must comply with the reuse regulations pertaining to hazardous industrial waste. Therefore, investment in pollution prevention equipment is necessary. Then, in the rest of the data simulations, simulations were performed in accordance with the relevant legal requirements.
In terms of electricity use, because environmentally friendly red bricks have higher requirements in terms of pollution prevention and control, the increase in air pollution prevention and control equipment can lead to an increase in electricity. However, in the emission of air pollutants, due to the increases in regulation and equipment for environmentally friendly red bricks, the emissions of pollutants are lower than those in the red brick manufacturing process. Here, we used real equipment manufacturers and laboratories, and we performed estimates to simulate the amounts of air pollutants produced in the manufacture of environmentally friendly red bricks.
In addition to the use of diesel, the amount of diesel used by excavators will be reduced due to the reduction in the amount of clay to be stirred. However, because the fly ash is to be recycled into red bricks, a pusher must be used to feed them into the machinery; this will increase the use of diesel oil, although the overall difference will be negligible due to the simultaneous increase and decrease in machine use. Therefore, the use of diesel oil in the process was assumed to be the same across the study.
The addition of water in the manufacturing process depends on the dryness of the clay itself and the water content in the feed material for turning fly ash into red bricks. Therefore, it is not a fixed value but depends wholly on the site conditions. After performing research with manufacturers, it was assumed in this study that the water consumption of environmentally friendly red bricks was the same as that of red bricks. Finally, because the sintering conditions were the same, the amount of coal used in all processes was also the same. The simulated inventory information of the environmentally friendly red bricks is detailed in Figure 10.
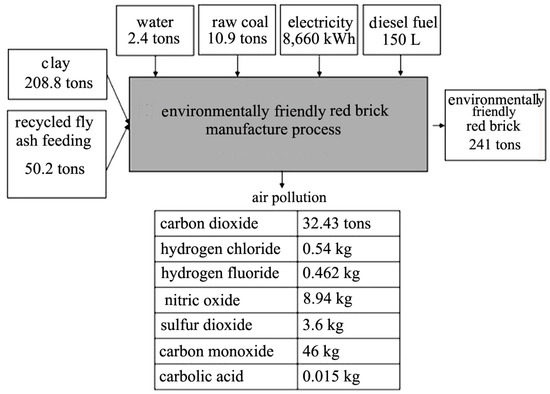
Figure 10.
Inventory data map of the environmentally friendly red brick manufacturing process.
In the simulated inventory of the second-generation environmentally friendly red bricks, it was assumed that the use of waste ammonium dihydrogen phosphate would not change the process and would have no impact on the pollution emissions of the environmentally friendly red brick manufacturing process, as shown in Figure 11.
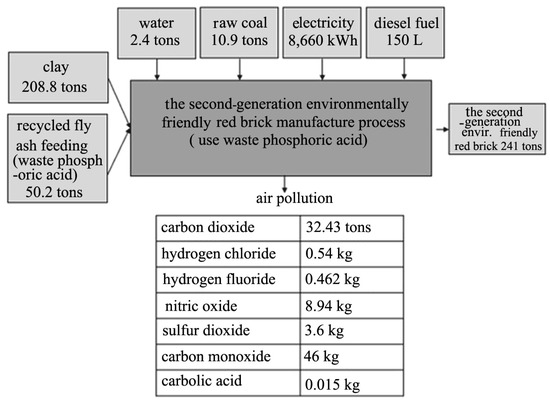
Figure 11.
Inquiry map of the second-generation environmentally friendly red bricks.
3.2.5. Life-Cycle Assessment Impact Assessment of Red Bricks, Environmentally Friendly Red Bricks, and Second-Generation Environmentally Friendly Red Bricks (Using Waste Ammonium Dihydrogen Phosphate)
- (a)
- Characterization
Comparing the characterization of red bricks, environmentally friendly red bricks, and second-generation environmentally friendly red bricks (made using waste ammonium dihydrogen phosphate), in terms of carcinogens, the damage caused by red bricks is 1.77 × 10⁻⁸ DALY, while that caused by environmentally friendly red bricks is 1.86 × 10⁻⁸ DALY, and that caused by second-generation red bricks is 1.83 × 10⁻⁸ DALY.
Among the respirable organic substances, the overall reduction to people’s lifespans is 2.66 × 10⁻¹¹ DALY, that of the environmentally friendly red bricks is 4.20 × 10⁻¹¹ DALY, and that of the second-generation environmentally friendly red bricks is 2.84 × 10⁻¹¹ DALY. The damage caused by red bricks is 4.27 × 10⁻⁸ DALY, the damage caused by environmentally friendly red bricks is 3.58 × 10⁻⁸ DALY, and the damage caused by second-generation environmentally friendly red bricks is 2.66 × 10⁻⁸ DALY. The damage caused by the emission of pollutants from climate change hazards is 3.59 × 10⁻⁸ DALY for the red bricks, 3.86 × 10⁻⁸ DALY for the environmentally friendly red bricks, and 3.71 × 10⁻⁸ DALY for the second-generation environmentally friendly red bricks. The radiation hazard values are 3.35 × 10⁻¹¹ DALY for red bricks, 1.08 × 10⁻¹⁰ DALY for environmentally friendly red bricks, and 3.64 × 10⁻¹¹ DALY for second-generation environmentally friendly red bricks. The damage to the human body caused by holes in the ozone layer is 4.72 × 10⁻¹² DALY for red bricks, 1.17 × 10⁻¹¹ DALY for environmentally friendly red bricks, and 5.15 × 10⁻¹² DALY for second-generation environmentally friendly red bricks.
The ecological toxicity is 8.91 × 10⁻³ PAF·m2·yr of damage for red bricks, 1.29 × 10⁻² PAF·m2·yr for environmentally friendly red bricks, and 1.02 × 10⁻² PAF·m2·yr for second-generation environmentally friendly red bricks. The impact is 1.53 × 10⁻³ PDF·m2·yr for red bricks, 1.11 × 10⁻³ PDF·m2·yr for environmentally friendly red bricks, and 8.92 × 10⁻⁴ PDF·m2·yr for second-generation environmentally friendly red bricks. The species impacts caused by land use are 1.12 × 10⁻³ PDF·m2·yr for red bricks, 1.12 × 10⁻³ PDF·m2·yr for environmentally friendly red bricks, and 9.95 × 10⁻⁴ PDF·m2·yr for second-generation environmentally friendly red bricks. The mineral residual energy is 5.53 × 10⁻⁵ MJ surplus for red bricks, 1.09 × 10⁻⁴ MJ surplus for environmentally friendly red bricks, and 7.43 × 10⁻⁵ MJ surplus for second-generation environmentally friendly red bricks. The remaining fossil fuel energy is 4.15 × 10⁻² MJ surplus for red bricks, 5.66 × 10⁻² MJ surplus for environmentally friendly red bricks, and 4.51 × 10⁻² MJ surplus for second-generation environmentally friendly red bricks.
Figure 12 indicates that the level of carcinogenic damage caused by the environmentally friendly red bricks is higher than that caused by the second-generation environmentally friendly red bricks, while that caused by the red bricks is the lowest, although the ratio between the three is almost the same. Red bricks are significantly better in terms of environmental protection; in terms of inhalable inorganic substances, red bricks produce the highest amounts, assumed to be mainly the dust emitted during the manufacturing process. There is little difference between the three in terms of climate change impacts. Regarding the aspects of radiation and the ozone layer, the environmentally friendly red bricks have the greatest impact. Concerning ecological toxicity, the environmentally friendly red bricks are the most toxic, while the least toxic are the red bricks. In terms of acidification/optimization, the red bricks have the greatest influence. The effects of all three bricks are almost the same in terms of land use. The greatest mineral influences are from the environmentally friendly red bricks. The impact of the environmentally friendly red bricks is the greatest, that of the second-generation environmentally friendly red bricks is second, and the normal red bricks have the lowest impact. Finally, the impact of environmentally friendly red bricks in raw petrochemical materials is the largest, that of second-generation environmentally friendly red bricks is second, and that of red bricks is the lowest.
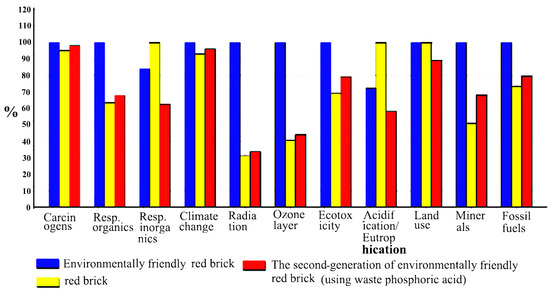
Figure 12.
Characterization comparison chart.
- (b) Damage assessment
The damage assessment demonstrated the impacts of red bricks, environmentally friendly red bricks, and second-generation environmentally friendly red bricks on human health, ecosystem quality, and resource consumption. The impact of red brick production on human health is 9.63 × 10⁻⁸ DALY, the impact on the quality of the ecosystem is 3.54 × 10−38 DALY, and the resource consumption is 4.15 × 10⁻² MJ surplus. The impact of environmentally friendly red bricks on human health is 9.32 × 10⁻⁸ DALY, the impact on the quality of the ecosystem is 3.51 × 10⁻³ DALY, and the resource consumption is 5.67 × 10⁻² MJ surplus. The impact of second-generation environmentally friendly red bricks on human health is 8.20 × 10⁻⁸ DALY, the impact on the quality of the ecosystem is 2.91 × 10⁻³ DALY, and the resource consumption is 4.52 × 10⁻² MJ surplus.
Figure 13 shows that red bricks have the greatest impact on human health, followed by environmentally friendly red bricks, while second-generation environmentally friendly red bricks have the lowest impact. In terms of ecosystem quality, red bricks are similar to environmentally friendly red bricks, while second-generation environmentally friendly red bricks have the smallest impact. In terms of resource consumption, environmentally friendly red bricks consume the most resources, followed by second-generation environmentally friendly red bricks, while red bricks consume the fewest resources.
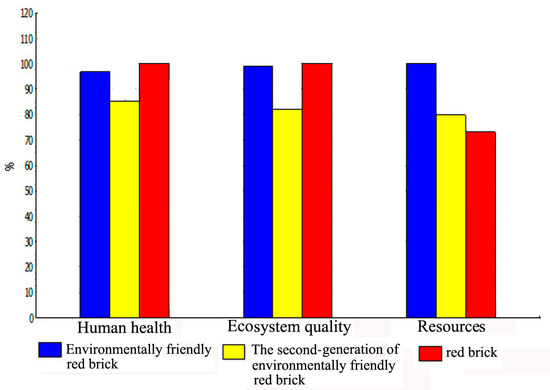
Figure 13.
Comparison chart of damage assessment.
- (c) Normalization
Figure 14 shows that, after normalization, red bricks have a human health impact of 6.27 × 10⁻⁶, an ecosystem quality impact of 6.91 × 10⁻⁷, and a resource consumption value of 4.94 × 10⁻⁶; environmentally friendly red bricks have a human health impact of 6.27 × 10⁻⁶, an ecosystem quality impact of 6.85 × 10⁻⁷, and a resource consumption value of 6.75 × 10⁻⁶; the second-generation environmentally friendly red bricks have a human health impact of 5.34 × 10⁻⁶, an ecosystem quality impact of 5.67 × 10⁻⁷, and a resource consumption value of 5.38 × 10⁻⁶.
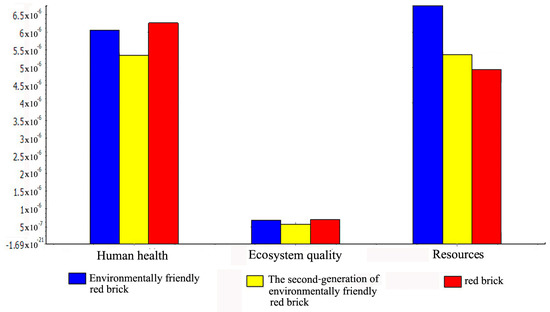
Figure 14.
Normalization comparison chart.
- (d) Weights
As shown in Figure 15, after weighting, the red bricks had a human health impact of 2.51 × 10⁻³ Pt, an ecosystem quality impact of 2.76 × 10⁻⁴ Pt, and a resource consumption value of 9.88 × 10⁻⁴ Pt; the environmentally friendly red bricks had a human health impact of 2.43 × 10⁻³ Pt, an ecosystem quality impact of 2.74 × 10⁻⁴ Pt, and a resource consumption value of 1.35 × 10⁻³ Pt; the second-generation environmentally friendly red bricks had an ecosystem quality impact of 2.27 × 10⁻⁴ Pt and a resource consumption value of 1.08 × 10⁻³ Pt.
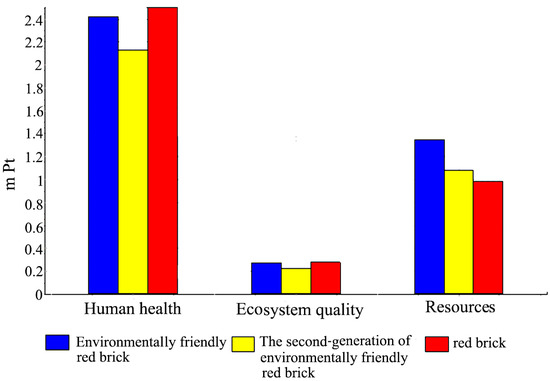
Figure 15.
Weight comparison chart.
- (e) Single-Point Score Table
In the single-point scoring section, Table 2 and Figure 16 show that the score for the environmentally friendly red bricks is 4.05 × 10⁻³ Pt, while the score for the red bricks is 3.77 × 10⁻³ Pt; the difference between the two is only 2.08 × 10⁻⁴ Pt. This difference is very small; however, if waste ammonium dihydrogen phosphate is used to stabilize heavy metals, the resulting score of the second-generation environmentally friendly red brick is 3.44 × 10⁻³ Pt, indicating that they are the most environmentally friendly.
Table 2.
Single-point scoring comparison of 1 kg of red bricks, second-generation environmentally friendly red bricks, and environmentally friendly bricks.
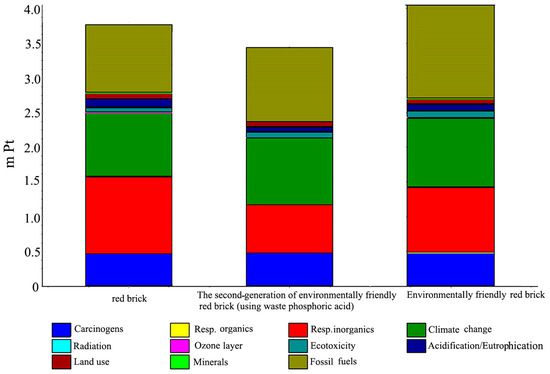
Figure 16.
Single-point score comparison table.
After performing the evaluation and comparison, we can clearly see that the environmental load of red bricks produced today is not much different from that of environmentally friendly red bricks (only about 7.43%), and most of the pollution caused by the manufacture of environmentally friendly red bricks is from the use of phosphoric acid. Therefore, from the perspective of research and development, if it is assumed that waste ammonium dihydrogen phosphate is used to make red bricks, it can be seen from Figure 16 that the overall environmental load of second-generation environmentally friendly red bricks is smaller than that of ordinary red bricks; the simulation indicated that this could reduce pollution by approximately 8.75%, meaning that research and development in this field is still promising.
4. Conclusions
4.1. Recycling Incineration Fly Ash as a Raw Material for Red Bricks
The life-cycle assessment clearly determined that, in the process of turning fly ash into red bricks, the use of phosphoric acid is the most harmful factor and is also the most in need of improvement. This is because phosphoric acid emits hydrogen fluoride and particulate pollutants into the air during the production process. In addition, it emits waste acid, sulfides, and some insoluble substances into water, which are very harmful to human health. Phosphoric acid is ground together with fly ash in the process of turning fly ash into red brick material, to stabilize heavy metals; therefore, its replacement with waste ammonium dihydrogen phosphate could be regarded as a future direction of research and development.
In addition, this study assumed that the source of electricity was thermal power generation using coal, and the assessment indicated that electricity is one of the key load providers for the conversion of fly ash resources into red brick feed. If the studied plant is to be realized in future, it could operate with clean energy provided by the government, thereby making the fly ash recycling process more environmentally friendly.
4.2. Comparison between Red Bricks, Environmentally Friendly Red Bricks, and Second-Generation Environmentally Friendly Red Bricks
After conducting a comparative impact assessment, the environmental burden of environmentally friendly bricks was not significantly different from that of conventional red bricks. Furthermore, the overall environmental burden of second-generation environmentally friendly bricks was notably smaller than that of red bricks. This is particularly true in terms of human health, as both environmentally friendly bricks and second-generation environmentally friendly bricks have lower impacts compared with red bricks. There is also little difference among the three types of bricks in terms of ecosystem quality. These findings challenge the perception that the resource utilization of fly ash is highly energy-intensive and environmentally detrimental. In reality, the differences are negligible. Moreover, if waste ammonium dihydrogen phosphate is used to stabilize heavy metals, the second-generation environmentally friendly bricks produced in this manner have an even lower score (3.44 × 10⁻³ Pt) compared with red bricks. Thus, they are more environmentally friendly. This could be a promising direction for future research. However, limitations to this study should be considered, such as the source of waste ammonium dihydrogen phosphate and the potential presence of substances other than regulated heavy metals that could have ecological or human health impacts.
Author Contributions
Conceptualization, C.-J.S.; Methodology, S.-H.G.; Software, H.-J.S.; Formal analysis, J.-H.K. and M.-G.L.; Resources, J.-H.K.; Data curation, H.-J.S.; Writing—original draft, T.-H.L., H.-J.S. and M.-G.L.; Writing—review & editing, T.-H.L. and H.-J.S.; Project administration, C.-J.S. All authors have read and agreed to the published version of the manuscript.
Funding
This research received no external funding.
Informed Consent Statement
Informed consent was obtained from all subjects involved in the study.
Data Availability Statement
Not applicable.
Conflicts of Interest
The authors declare no conflict of interest.
References
- Xue, Y.; Liu, X. Detoxification, solidification and recycling of municipal solid waste incineration fly ash: A review. Chem. Eng. J. 2021, 420, 130349. [Google Scholar] [CrossRef]
- Young, C.-Y.; Ni, S.-P.; Fan, K.-S. Working towards a zero waste environment in Taiwan. Waste Manag. Res. 2010, 28, 236–244. [Google Scholar] [CrossRef] [PubMed]
- Wang, Y.; Hu, Y.; Xue, C.; Khan, A.; Zheng, X.; Cai, L. Risk assessment of lead and cadmium leaching from solidified/stabilized MSWI fly ash under long-term landfill simulation test. Sci. Total Environ. 2021, 816, 151555. [Google Scholar] [CrossRef] [PubMed]
- Grabias-Blicharz, E.; Franus, W. A critical review on mechanochemical processing of fly ash and fly ash-derived materials. Sci. Total Environ. 2023, 860, 160529. [Google Scholar] [CrossRef] [PubMed]
- Li, X.-G.; Lv, Y.; Ma, B.-G.; Chen, Q.-B.; Yin, X.-B.; Jian, S.-W. Utilization of municipal solid waste incineration bottom ash in blended cement. J. Clean. Prod. 2012, 32, 96–100. [Google Scholar] [CrossRef]
- Wong, S.; Mah, A.X.Y.; Nordin, A.H.; Nyakuma, B.B.; Ngadi, N.; Mat, R.; Amin, N.A.S.; Ho, W.S.; Lee, T.H. Emerging trends in municipal solid waste incineration ashes research: A bibliometric analysis from 1994 to 2018. Environ. Sci. Pollut. Res. 2020, 27, 7757–7784. [Google Scholar] [CrossRef] [PubMed]
- Wang, L.; Jin, Y.; Nie, Y.; Li, R. Recycling of municipal solid waste incineration fly ash for ordinary Portland cement production: A real-scale test. Resour. Conserv. Recycl. 2010, 54, 1428–1435. [Google Scholar] [CrossRef]
- Youcai, Z.; Lijie, S.; Guojian, L. Chemical stabilization of MSW incinerator fly ashes. J. Hazard. Mater. 2002, 95, 47–63. [Google Scholar] [CrossRef] [PubMed]
- He, D.; Hu, H.; Jiao, F.; Zuo, W.; Liu, C.; Xie, H.; Dong, L.; Wang, X. Thermal separation of heavy metals from municipal solid waste incineration fly ash: A review. Chem. Eng. J. 2023, 467, 143344. [Google Scholar] [CrossRef]
- Wang, F.-H.; Zhang, F.; Chen, Y.-J.; Gao, J.; Zhao, B. A comparative study on the heavy metal solidification/stabilization performance of four chemical solidifying agents in municipal solid waste incineration fly ash. J. Hazard. Mater. 2015, 300, 451–458. [Google Scholar] [CrossRef] [PubMed]
- Zhang, J.; Fernando, S.; Law, D.W.; Gunasekara, C.; Setunge, S.; Sandanayake, M.; Zhang, G. Life Cycle Assessment for Geopolymer Concrete Bricks Using Brown Coal Fly Ash. Sustainability 2023, 15, 7718. [Google Scholar] [CrossRef]
- Wang, Y.; Dong, J.; Liu, J.; Zheng, R.; Yue, Y.; Zhang, Y.; Qian, G. Toward a sustainable municipal solid waste incineration fly-ash utilization network: Integrating hybrid life cycle assessment with multiobjective optimization. ACS Sustain. Chem. Eng. 2022, 10, 7635–7647. [Google Scholar] [CrossRef]
- Li, M.-G.; Sun, C.-J.; Gau, S.-H.; Chuang, C.-J. Effects of wet ball milling on lead stabilization and particle size variation in municipal solid waste incinerator fly ash. J. Hazard. Mater. 2010, 174, 586–591. [Google Scholar] [CrossRef]
- Fava, J.A.; Smerek, A.; Heinrich, A.B.; Morrison, L. The role of the Society of Environmental Toxicology and Chemistry (SETAC) in Life Cycle Assessment (LCA) development and application. In Background and Future Prospects in Life Cycle Assessment; Springer: Berlin/Heidelberg, Germany, 2014; pp. 39–83. [Google Scholar]
- Finkbeiner, M.; Inaba, A.; Tan, R.; Christiansen, K.; Klüppel, H.-J. The new international standards for life cycle assessment: ISO 14040 and ISO 14044. Int. J. Life Cycle Assess. 2006, 11, 80–85. [Google Scholar] [CrossRef]
- Finkbeiner, M. The international standards as the constitution of life cycle assessment: The ISO 14040 series and its offspring. In Background and Future Prospects in Life Cycle Assessment; Springer: Berlin/Heidelberg, Germany, 2014; pp. 85–106. [Google Scholar]
- Colón, J.; Cadena, E.; Pognani, M.; Barrena, R.; Sánchez, A.; Font, X.; Artola, A. Determination of the energy and environmental burdens associated with the biological treatment of source-separated municipal solid wastes. Energy Environ. Sci. 2012, 5, 5731–5741. [Google Scholar] [CrossRef]
- Michailidou, A.V.; Valachokostas, C.; Achillas, C.; Maleka, D.; Moussiopoulos, N.; Feleki, E. Green tourism supply chain management based on life cycle impact assessment. Eur. J. Environ. Sci. 2016, 6, 30–36. [Google Scholar] [CrossRef]
- van den Heede, P.; De Belie, N. Environmental impact and life cycle assessment (LCA) of traditional and ‘green’concretes: Literature review and theoretical calculations. Cem. Concr. Compos. 2012, 34, 431–442. [Google Scholar] [CrossRef]
- Carvalho, M.; Serra, L.M.; Lozano, M.A. Optimal synthesis of trigeneration systems subject to environmental constraints. Energy 2011, 36, 3779–3790. [Google Scholar] [CrossRef]
- Margni, M.; Curran, M.A. Life cycle impact assessment. In Life cycle Assessment Handbook: A Guide for Environmentally Sustainable Products; Wiley and Sons: Hoboken, NJ, USA, 2012; pp. 67–104. [Google Scholar]
Disclaimer/Publisher’s Note: The statements, opinions and data contained in all publications are solely those of the individual author(s) and contributor(s) and not of MDPI and/or the editor(s). MDPI and/or the editor(s) disclaim responsibility for any injury to people or property resulting from any ideas, methods, instructions or products referred to in the content. |
© 2023 by the authors. Licensee MDPI, Basel, Switzerland. This article is an open access article distributed under the terms and conditions of the Creative Commons Attribution (CC BY) license (https://creativecommons.org/licenses/by/4.0/).