Abstract
Given that the production process in the manufacturing industry is a significant contributor to carbon emissions, many governments have implemented carbon emission-related policies to incentivize manufacturers to optimize their production process or invest in green production technology, with the aim of reducing their carbon footprint. Therefore, it is necessary to determine the effectiveness of carbon policies considering manufacturers always tend to prioritize economic profits in their actual operations. We compare the effects of three different carbon emission policies—carbon tax, cap-and-trade, and intensity target—on manufacturers’ production strategies and technology innovation investments, which include production and carbon emission quantities, price of goods and emission permit, and technological innovation of the production improvement and the emission abatement. The study results show that the intensity target policy increases the carbon market price and decreases the carbon emission rate. For the manufacturers with higher (lower) initial emission intensity, intensity target policy induces them to decrease (increase) production quantities and carbon emission quantities. For the technology innovation choice, cap-and-trade induces more incentive on production improvement technology innovation for manufacturers with lower initial emission intensity and carbon emission abatement technology innovation for manufacturers with higher level initial emission intensity.
1. Introduction
Since the 1980s, the world has been increasingly concerned about global warming, which has spurred debates and led to numerous agreements. These agreements cover scientific issues, voluntary actions, and legally binding targets for reducing greenhouse gas emissions. To achieve the goal of curbing carbon emissions and reaching net-zero emissions by midcentury, governments worldwide have implemented or planned to implement various carbon regulations. The three most common primary types of carbon regulations are carbon taxes, cap-and-trade, and intensity targets [1]. As of now, a total of 61 regions and nations have implemented or planned for the implementation of carbon pricing instruments [2]. Out of these, 30 regions adopt carbon taxes, while 31 regions choose Emissions Trading Systems (ETSs). Those regions cover around 22% of the yearly global greenhouse gas emissions. In China, the carbon emissions trading policy was initially piloted in 7 provinces and has since been implemented in approximately 3000 firms across more than 20 industries as of the end of 2020 [3].
Among this trend of attention on carbon emissions, academia has recently focused on reducing carbon intensity, which reflects emissions per unit of output or revenue. This emerging trend has also been advocated in various studies, such as ref. [4]. According to ref. [5], companies facing rising CO2 prices should aim to increase production quantity while simultaneously reducing the volume of emissions, which requires a significant reduction in emission intensity.
The implementation of carbon emission regulations (CERs) will compel manufacturers to seek out green or high-efficiency technologies such as sustainable design or high-efficiency manufacturing to enhance products’ carbon abatement levels. On the one hand, one might argue that implementing carbon regulations will add to the costs for manufacturers, leading to a decline in profits. On the other hand, research has shown that consumers are willing to purchase low-carbon products [6], which could potentially increase revenue for manufacturers who adopt new technologies. Accordingly, manufacturers should carefully consider whether the increased revenue can offset the additional investment in technology [7], taking into account government carbon policies, production strategies, and technology investments.
The actual implications of carbon regulations can be more complex. For instance, ref. [8] has demonstrated that the adoption of green technology is not always guaranteed by imposing a carbon tax, and improper tax rates may even encourage the adoption of dirty technology. Similarly, a study on the implementation of carbon taxes in British Columbia, Canada, revealed that the province’s economy was not adversely affected by the introduction of the tax, despite effectively reducing carbon emissions [9]. Thus, the effects of CERs on manufacturers’ productions and profitability are not clear and warrant further investigation.
Thus, in this study, we examine the operational decisions of manufacturers when they encounter carbon regulations. Specifically, we attempt to answer the following questions: How can individual manufacturers effectively respond to CERs? What operational decisions, such as production quantities and product pricing, should they modify to comply with these regulations? Is investing in technology innovation to lower their carbon intensity always the optimal choice? What is the impact of CERs on the profitability of manufacturers, overall emissions, and industry profit?
The remaining sections of the paper are organized as follows: Section 2 reviews the relevant literature, Section 3 presents the notation and model setup, Section 4 analyzes the incentives for technological innovation under different policies and compares them, Section 5 gives a discussion of the results, and Section 6 concludes the paper.
2. Literature Review
The literature related to our study can be broadly classified into three streams: Operations Management (OM) with a focus on carbon emissions, design of environmental policies and incentive schemes, and technology investment strategies in response to carbon emission regulations.
2.1. OM with Carbon Emissions Concerns
The OM community has witnessed the increasing interest in issues related to carbon emissions. Within this research stream, scholars primarily examine how firms respond operationally to environmental concerns [10,11,12]. For example, ref. [13] provides a review of models that incorporate carbon constraints in OM. Ref. [14] presents two mathematical models to determine firms’ optimal product mix while considering various environmental constraints, including emission threshold values, emission taxes, trading allowances, and transaction costs. Ref. [15] proposes a multi-period stochastic optimization problem to formulate CO2 emissions trading planning for a power producer. Ref. [16] presents a methodology and computer model developed by the International Energy Agency that utilizes a real option analysis approach to quantify the impacts of uncertainties in climate change policies on power investments. Ref. [17] examines the decision-making process of a firm that is “carbon-aware”, either voluntarily or due to regulation, and is reevaluating its selection of transportation modes.
Some other research also pays attention to the regulatory effects and their policy implications. For instance, ref. [18] suggests that implementing a low-carbon production strategy can have a positive impact on a firm’s profits under cap-and-trade regulation. Ref. [19] considers a transportation carbon emission problem under carbon taxation and production technologies changes to optimize the production location. Ref. [3] develops a theoretical model to explore the selection of product strategies under a cap-and-trade policy. Ref. [20] proposes a method to optimize resource management and reduce carbon emissions in manufacturing production processes by selecting low-carbon production techniques for product structure and batch.
Our study differs from existing research as we jointly consider the manufacturers’ production strategies and technology choices under a carbon tax, cap-and-trade, and intensity target regulation individually and compare them.
2.2. Design of Environmental Policies and Incentive Schemes
The second stream of literature focuses on the design of government policies and incentive schemes to limit carbon emissions. Refs. [21,22] provides a review of the interaction between environmental management and operations research. Ref. [23] provides a thorough examination of the theoretical advancements in carbon taxes throughout the last three decades. Ref. [24] proposes a conceptual model of environmental operations management, which suggests that the investment pattern in environmental technologies is intrinsically related to the directions of managers on environmental issues. Ref. [25] analyzes the optimal strategies for firms that are considering retrofitting their facility to reduce pollution and avoid purchasing emissions allowances. Ref. [26] integrates carbon emission constraints into multi-sourcing lot-sizing problems, where four different types of constraints are proposed and analyzed.
In addition, several studies have examined various financial incentive policies for firms (e.g., cap-and-trade and subsidy policies). Ref. [27] conducted a comparative analysis of the effectiveness of cap-and-trade policy and low-carbon subsidy policy in reducing carbon emissions by firms. Ref. [28] examined the impact of two different carbon tax policies, a flat carbon tax policy, and an increasing block carbon tax policy, on carbon emission reduction and social welfare. Their study found that the increasing block carbon tax policy could mitigate the burden on manufacturers. A study conducted by ref. [29] explored the impact of government intervention on the adoption of low-carbon technology by firms during the product development stage. Their analysis compares the effects of carbon pricing and technology subsidy policies on the firm’s investment in low-carbon technology. While these previous studies utilized either empirical or simulation methodologies to examine the impacts of different government policies on a firm’s decisions related to reducing carbon emissions, research on the influence of cap-and-trade, intensity target, and carbon tax policies on production strategy and technology decisions is relatively limited.
2.3. Technology Investment under Carbon Emission Regulations
The third stream of literature is about firms’ technology investment under CERs. Firms are expected to respond positively to carbon emission regulations imposed by governments, such as investing in green or high-efficiency technologies [7]. Some literature examines optimal production planning or technology innovation investments under carbon emission or environmental constraints. The research by ref. [30] suggest that policies based on carbon tax or auctioned carbon permits are more effective in reducing carbon emissions compared to regimes that offer free permits or impose technological standards. Ref. [31] proposed a general equilibrium model considering permit trading and irreversible abatement investment to analyze how cost uncertainties affect firms’ investment decisions. Ref. [32] examined the effects of emissions trading on technology deployment when technology learning is endogenized. Ref. [33] studied whether price controls influence the firm-level innovation in carbon-abatement technologies under optimal cap-and-trade schemes. Ref. [34] presented three optimization models to identify the optimal remanufacturing quantity in considering the maximization of total profits and the impact of CERs. Ref. [35] examined the optimal strategy for firms under cap-and-trade regulation, analyzing whether it is more profitable for a firm to invest in green technology to reduce carbon emissions or to purchase carbon quotas directly. Ref. [36] highlights that the implementation of government subsidy policies can encourage firms to adopt green technology and contribute to the expansion of the green product market. Ref. [37] employed a game-theoretical framework to investigate the role of emission asymmetry in influencing firms’ investment in green technologies. The majority of the aforementioned literature does not take into account the simultaneous investment decisions of manufacturers in both emission abatement technology and production improvement technology.
In summary, from the analysis above, it can be seen that many literatures analyze the cap-and-trade, intensity target, and carbon taxes policies from different points. However, there is no paper considering the goods and carbon emission quantities and prices simultaneously. Additionally, while some scholars have examined firms’ decision to adopt low-carbon production or green technology strategies under government policies, none of them have compared the effects of cap-and-trade and intensity target regulations or the incentives for technological innovation for different policies. To address these gaps, we establish a theoretical model to explore the manufacturer’s optimal production strategies. Furthermore, we examine the impact of the three carbon emission policies on the manufacturer’s production strategy decisions and emission reduction technology selection. Our study contributes significantly to the existing literature.
3. Model Description
Considering manufacturer i () with a fixed carbon emission quota (absolute quantities or relative rates) for each period, usually one year, they must control the carbon emission not to exceed the limit. Otherwise, the manufacturer will be penalized. There thus exists a carbon emission market for the manufacturer to buy/sell emission permits. The manufacturer can achieve the aim through following one or more mechanisms: (i) purchasing additional emission allowance from the spot market with a certain probability and stochastic price; (ii) decreasing the production quantity but thus suffering from the shortage cost; (iii) choosing new technology or using new energy to abate the carbon emission but thus suffering from the higher per unit production cost. We have developed a profit-maximization model to analyze the optimal decisions of the production quantity and the carbon emission quantity, the price of goods and carbon emission permits, and a technology-selecting mechanism.
3.1. Notation
The notation we use in this paper is defined as follows:
: the optimal production quantity of manufacturer ;
: the optimal carbon emission quantity of manufacturer ;
: the unit production cost;
: the unit carbon emission cost;
: price of per unit goods, , is a random variable;
: price of per unit carbon emission permit, , is a random variable;
: initial carbon emission intensity of manufacturer ;
To study the technology choice of a firm, we use a simple adaption of the model of refs. [38,39]. We assume manufacturer i’s total cost function is,
where, are i.i.d. random variables with an expected value of zero and a strictly positive variance . They can be positively correlated among the manufacturers, so that , where (for ) is the correlation coefficient between two manufacturers’ random influences. Here, we assume that are intertemporally independent. denotes the technology innovation cost, which is a joint convex function of and , as ref. [39]. Therefore, the total cost includes the carbon emission cost , the production cost , and the technology innovation cost .
3.2. Model Setup
Consider three carbon emission policies, carbon tax, cap-and-trade, and intensity target, each of the policies has a carbon emission quota and a penalty price for the excess emission, j = (TX, CAT, IT), where TX denotes carbon tax policy, CAT denotes cap-and-trade policy, and IT denotes intensity target policy. For the carbon tax policy, the manufacturer needs to pay tax for any unit of carbon emission; for the cap-and-trade policy, the manufacturer receives an initial carbon emission quota , and they can trade their emission permit on the carbon market for price ; for the intensity target policy, the manufacturer obtains an average emission rate limit , and they can trade their emission permit on the carbon market for price . According to the definition of each policy, and can be denoted as follows:
Therefore, for the carbon tax policy, the penalty price for each excess emission equals the unit tax rate , and there exists no carbon emission quota, that is, ; for the cap-and-trade policy, the penalty price for each excess emission equals the price of per unit carbon emission permit , and the carbon emission quota equals the initial carbon emission quota, that is, ; for intensity target policy, the penalty price for each excess emission equals the price of per unit carbon emission permit , and the carbon emission quota equals the average emission rate limit determined by the government multiplied by the production quantity produced by the manufacturer, that is, .
The profit function of manufacturer i under carbon policy j is as follows:
Manufacturer maximizes the profit function (1) with respect to and while they observe the realization of random variable . The first order condition of (1) is as follows:
where, .
Then, we can obtain the optimal production quantities and carbon emission quantities by the following:
By (2) and (3), we can obtain the optimal carbon emission rate is,
where, .
From (4), we observe that if , the optimal carbon emission rate of manufacturer i will decrease, otherwise, the optimal carbon emission rate will increase.
Next, we analyze the equilibrium price of the carbon market and goods market under different carbon emission policies.
Carbon tax policy. As the carbon tax makers cannot observe the , they decide the carbon tax rate according to the expected emission quantity.
where denotes the emission quota of a country or sector, is the average emission quota of each manufacturer. We assume that there are manufacturers on the market.
where denotes the total production quantity of a country or sector, is the average goods quantity of each manufacturer. Similarly, we assume that there are manufacturers on the market.
By (5) and (6), we obtain,
Let denote the average initial emission intensity, and denote the deviation of the initial emission intensity.
According to (7) and (8), we obtain the carbon tax rate by the following:
Given t, we assume the prices of the goods market are clearing price, then ; therefore, the goods market equilibrium price with carbon tax policy is,
where, .
Cap-and-trade and intensity target policy. We assume the prices of the carbon market and goods market are all clearing price, then the following equations hold:
where is the average emission permit input () from or output () to other carbon markets.
Rewriting (11) and (12), we have the following equations,
Let denote the correlation between and .
For the cap-and-trade policy, , therefore, .
For the intensity target policy, , therefore, , where, , denotes the correlation between and .
Solving (13) and (14), we obtain the equilibrium price of per unit carbon emission permit and the equilibrium price of per unit goods as follows:
where, .
Substituting (10) and (16) into (2) and (3), we obtain the following equilibrium quantities of goods and carbon emission for different policies:
According to (17) and (18), we obtain the optimal carbon emission rate as follows:
The equilibrium results of the carbon tax, cap-and-trade, and intensity target policy are shown in Table 1.

Table 1.
The equilibrium results.
From the equilibrium results in Table 1, we can see that the differences in optimal price of the carbon market and optimal carbon emission quantity, the optimal price of the goods market and the optimal production quantity, and the optimal carbon emission rate caused by three different emission abatement policies mainly depend on the relative value of manufacturers’ initial carbon emission intensity and the average initial carbon emission intensity , as well as the relative value of the coefficient of carbon emission cost and the average coefficient of carbon emission cost . The intuitive understanding behind this lies in that for industries or areas with lower attention to carbon emissions, enterprises generally have a higher emission rate. Meanwhile, implementing an intensity target policy can achieve a better result to control carbon emissions through unit emission rates. For enterprises or areas with better carbon emission management, the cap-and-trade policy can usually achieve a better result to control carbon emissions through the total volume of carbon emissions.
Comparing the equilibrium results of different carbon emission policies, we obtain the following propositions:
Proposition 1.
The equilibrium price of carbon emission, quantity of goods, quantity of carbon emission, and carbon emission rate for different carbon emission policies have the following characteristics:
- (i)
- ;
- (ii)
- ;
- (iii)
- ;
- (iv)
- , iff ;
- (v)
- , iff .
By Proposition 1, we observe that intensity target policy increases the carbon market price and decreases the carbon emission rate. For the manufacturers with higher initial emission intensity, i.e., , the intensity target policy has the incentive to decrease the goods quantities and carbon emission quantities. On the contrary, for the manufacturers with lower initial emission intensity, i.e., , the cap-and-trade policy has the incentive to decrease the goods quantities and carbon emission quantities.
The intuitive interpretation of proposition 1 lies in that compared with the absolute carbon emissions control of the cap-and-trade policy, the intensity target policy focuses on the relative carbon emissions control. Therefore, enterprises tend to focus on the control of unit carbon emission, which leads to the reduction in carbon emission rate. For manufacturers with higher initial emission intensity, that is, enterprises that are “dirty” before the implementation of carbon policy, the effect of the intensity target policy is much better. Since the intensity target policy sets a carbon emission rate for each unit of product, it allows enterprises to focus on carbon intensity for each unit of product. On the contrary, for enterprises that are relatively “clean” before the implementation of the carbon policy, the implementation of the cap-and-trade policy tends to have a better emission abatement effect. This is also the reason why developed countries such as the European Union generally adopt the cap-and-trade policy to promote emission reduction in practice, while developing countries are more inclined to adopt the intensity target policy.
We next use some numerical examples to illustrate the results we have obtained in the above analyses and highlight some key results we have gained. In the examples, we assume that there are two manufacturers (manufacturer and manufacturer −) in the market, and manufacturer is of lower initial emission intensity and manufacturer − is of higher initial emission intensity, i.e., and .
We assume that the initial carbon emission intensity of manufacturer and − satisfies that , ; thus, we have , and we assume that the average emission permit output . We assume that , ; thus, we have . Furthermore, let , and . Let the unit carbon emission cost be and the unit production cost be . Let and thus . Therefore, we can compare manufacturer ’s optimal decisions with the changing initial carbon emission quota.
We show the results comparisons of the equilibrium price of per unit carbon emission permit under different carbon emission policies in Figure 1. We can observe that the equilibrium price of per unit carbon emission permit under the intensity target policy is larger than that under the cap-and-trade policy. The intensity target policy increases the carbon market price in equilibrium.
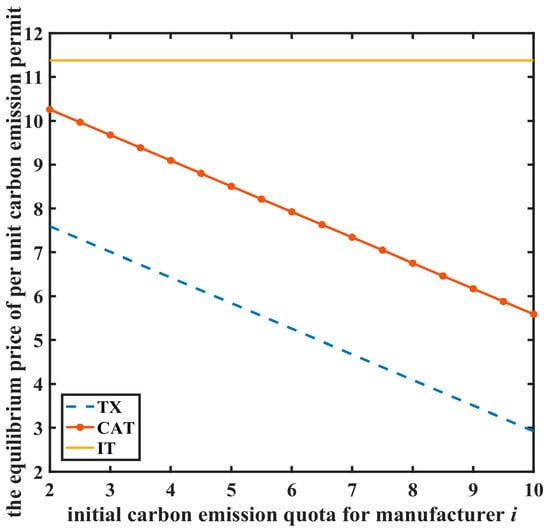
Figure 1.
Comparison of equilibrium price of per unit carbon emission permit.
Figure 2 shows the results comparisons of the equilibrium price of per unit goods of manufacturer . The optimal prices of per unit goods under different carbon emission policies are given in the figure.
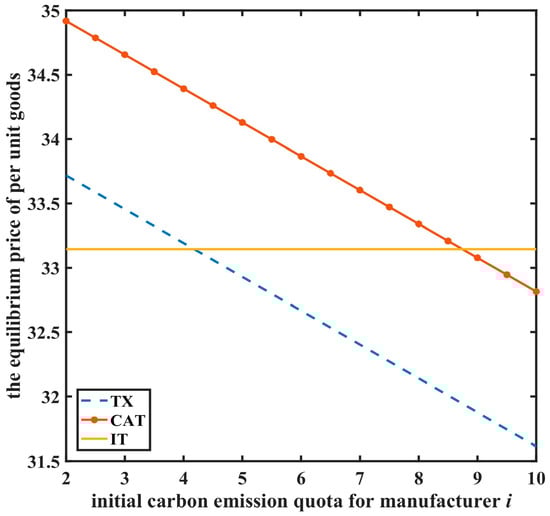
Figure 2.
Comparison of equilibrium price of per unit goods.
We show the results comparisons of the optimal production quantity of the manufacturer in Figure 3. We can see that the optimal production quantity under the intensity target policy is larger than that under the cap-and-trade policy. For the manufacturers with lower initial emission intensity, the cap-and-trade policy has the incentive to decrease the goods quantities.
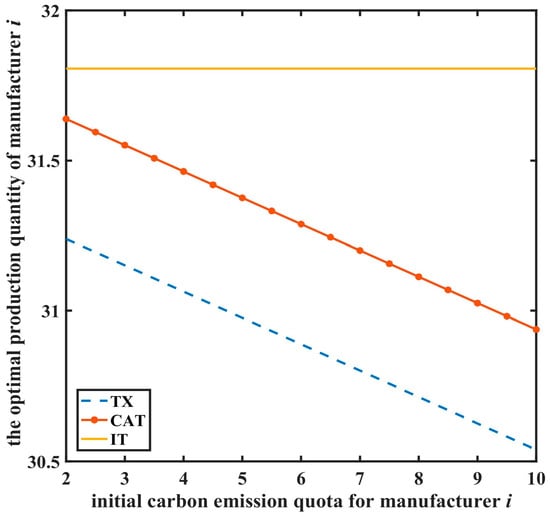
Figure 3.
Comparison of optimal production quantity.
The results comparisons of the optimal carbon emission quantity of the manufacturer are shown in Figure 4. We can obtain that the optimal carbon emission quantity under the intensity target policy is larger than that under the cap-and-trade policy. For the manufacturers with lower initial emission intensity, the cap-and-trade policy has the incentive to decrease the carbon emission quantities.
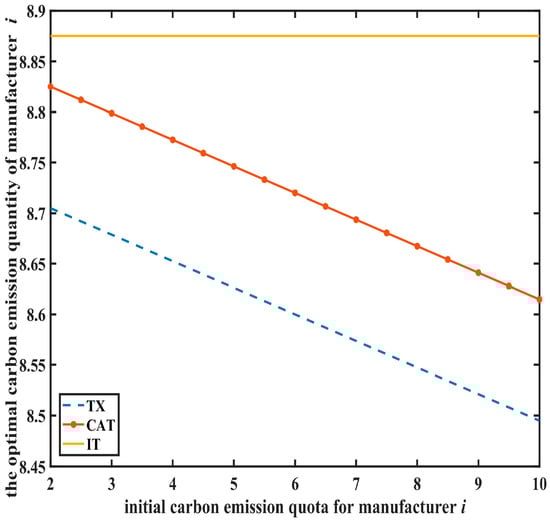
Figure 4.
Comparison of optimal carbon emission quantity.
Manufacturer ’s optimal carbon emission rates under different carbon emission policies are given in Figure 5. We can observe that the optimal carbon emission rate under the cap-and-trade policy is larger than that under the intensity policy. The intensity target policy decreases the manufacturer’s carbon emission rate in equilibrium.
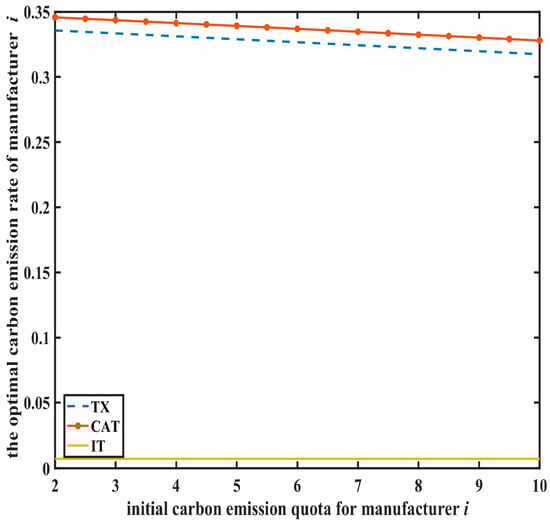
Figure 5.
Comparison of optimal carbon emission rate.
4. Technology Innovations
We compare the incentives of technological innovation for different policies in the following section. Because manufacturer i cannot observe the random variable when they invest in technological innovation, then their decisions in this stage are based on their expected profit.
Let , , then the expected profit function of manufacturer i is as follows:
4.1. Carbon Tax Policy
According to the preceding solutions, we compute the manufacturer’s expected profit under the carbon tax policy.
By the first order conditions of (20) with respect to and , we obtain the following results:
where, , ,
Consider a special case, i.e., , , that is, , . Thus, we have the following:
We can see that the carbon tax policy can promote the investment motivation of production improvement and technology innovation, while the investment in carbon emission abatement technology innovation depends on whether exceeds zero. If exceeds zero, then the carbon tax policy can promote investment in carbon emission abatement technology innovation; otherwise, it will inhibit investment in carbon emission abatement technology innovation. This is a trade-off between marginal benefits from investment in carbon emission abatement technology and carbon tax. Only when marginal benefits from investment in carbon emission abatement technology are greater than carbon tax will enterprises be motivated to invest in technological innovation; otherwise, it is more favorable for enterprises to pay carbon tax.
4.2. Cap-and-Trade Policy
For the cap-and-trade policy, the expected profit of the manufacturer i is as follows:
By the first order conditions of (23) with respect to and , we obtain the following results:
where,
Consider a special case, i.e., , , that is, , . Thus, we have the following:
We can see that the cap-and-trade policy can promote the investment motivation of production improvement technology innovation as well as carbon emission abatement technology innovation.
4.3. Intensity Target Policy
For the intensity target policy, the expected profit of manufacturer i is as follows:
By the first order conditions of (26) with respect to and , we obtain the following results:
where,
Consider a special case, i.e., , , that is, , . Thus, we have the following:
We can see that the intensity target policy does not directly promote the investment motivation of production improvement technology innovation and carbon emission abatement technology innovation, but influences the price of carbon emission permit through the carbon emission rate limit, and then indirectly influences the investment motivation of enterprises in technology innovation.
Summarizing the preceding technology innovation incentive results in Table 2 as follows:
Table 2.
The technology innovation results.
Table 2 shows that for different policies the innovation incentive on production improvement technology depend on , , and , , , and the innovation incentive on carbon emission abatement technology depend on , , and , , .
Comparing , and , , and directly, we have the following conditions:
- (1)
- If , then ;
- (2)
- .
According to above conditions, we compare (21), (24), and (27) and find that the cap-and-trade policy can induces more incentive on production improvement technology innovation for manufacturers with lower initial emission intensity.
Comparing , and , , and directly, we have the following results:
- (1)
- ;
- (2)
- If , then .
According to above conditions, we compare (22), (25), and (28) and find that the cap-and-trade policy can induces more incentives on carbon emission abatement technology innovation for manufacturers with higher initial emission intensity.
The results in Table 2 intuitively show that compared with carbon tax policy and intensity target policy controlled by unit emission rate, the cap-and-trade policy based on total volume control can play a more effective role in technological innovation. The main reason is that due to the control of volume emissions, enterprises can only avoid being penalized by improving production efficiency or reducing emission quantities as much as possible. Whether to choose high production efficiency or to reduce emission quantities, different enterprises may make different choices. For enterprises with poor carbon emission control, such as extensive production enterprises, significant effects can be obtained through carbon emission abatement technology, so such enterprises are often more motivated to innovate carbon emission abatement technology. On the contrary, for enterprises that have already done well in carbon emission reduction, such as relatively green enterprises, further innovation of carbon emission abatement technology brings limited benefits. Therefore, such enterprises have more incentives to innovate production technology and improve production efficiency, so that less input can obtain more output. Therefore, enterprises usually choose the best way of technological innovation by making a trade-off between improving production efficiency and improving carbon reduction efficiency.
Incorporating all these results, we have the following proposition:
Proposition 2.
Given and , the cap-and-trade policy induces more incentive on production improvement technology innovation for manufacturers with lower initial emission intensity and carbon emission abatement technology innovation for manufacturers with higher initial emission intensity.
Proposition 2 shows that given the total goods quantity and total emission quantities, the cap-and-trade policy tends to have a greater effect on technological innovation of enterprises. The reason is that the cap-and-trade policy implements total volume control, in which enterprises can only avoid being penalized if they increase production efficiency or reduce emission quantities. Therefore, enterprises with poor carbon emission control, namely “dirty” enterprises, can obtain significant effects through carbon emission abatement technology, so such enterprises are often more motivated to innovate carbon emission abatement technology. For enterprises that have already done well in carbon reduction, namely “clean” enterprises, further innovation in carbon emission abatement technology brings limited effects, so such enterprises have more incentive to innovate production technology and improve production efficiency, so that they can obtain more output with less input.
5. Discussion
From the perspective of enterprises, the operational strategies adopted to deal with different carbon emission policies are different. For the intensity target policy, enterprises will try to reduce their carbon emission rate as much as possible, either by reducing total carbon emission quantities or by increasing production quantities. Under the cap-and-trade policy, enterprises can only avoid penalties by reducing either carbon emission quantities or production quantities. As for the motivation of technological innovation, since carbon tax policy and intensity target policy both focus on per-unit emission, enterprises will focus on the innovation of carbon emission abatement technologies. As the cap-and-trade policy implements total volume control, enterprises will face both choices of investing in carbon emission abatement technology innovation and production improvement technology innovation. Enterprises with lower carbon emission efficiency (higher initial emission intensity) are more inclined to invest in carbon emission abatement technology innovation to reduce emissions. Enterprises with higher carbon emission reduction efficiency (lower initial emission intensity) will be more motivated to invest in production improvement technology innovation and reduce total carbon emissions by improving production efficiency.
From the perspective of the government, the implementation of carbon emission policies must fully consider both the operation strategy and technology innovation investment strategy of enterprises. For government departments who wishes to reduce carbon emission intensity, implementing the intensity target policy would be most effective. For government who wants to promote technological innovation, the cap-and-trade policy will be the best choice. Whether it is to directly reduce carbon emissions by investing in technological innovation of carbon emission abatement, or indirectly reduce carbon emissions by investing in technological innovation of production to improve production efficiency, the goal of technological innovation will be achieved.
6. Conclusions
Manufacturers face the challenge of reducing carbon emissions while maintaining profitability under carbon policies. Hence, they require guidance on reactive or proactive strategies to comply with carbon regulations. Governments are also keen to understand the impact of these policies on manufacturers’ responses, carbon emissions, and profitability. This paper develops a profit maximization model to document the optimal joint decision of the production quantity, carbon emission quantity, and technology innovation investment choice. The paper compares the effects of three different climate policies, carbon tax, cap-and-trade, and intensity target, on companies’ operations strategies of production and carbon emission quantities, price of goods and emission permit, and technological innovation of production improvement and emission abatement. We obtain the equilibrium decisions of production and carbon emission quantities, price of goods and emission permit, and technology innovation incentive of production improvement and emission abatement. The research results show that the intensity target policy increases the carbon market price and decreases the carbon emission rate. For the manufacturers with higher initial emission intensity, the intensity target policy induces the manufacturers to decrease the goods quantities and carbon emission quantities. On the contrary, for the manufacturers with lower initial emission intensity, the intensity target policy induces the manufacturers to increase the goods quantities and carbon emission quantities. For the technology innovation investment incentive, the results show that the cap-and-trade policy induces more incentive on production improvement technology innovation for manufacturers with low level initial emission intensity and it also induces more incentive on carbon emission abatement technology innovation for manufacturers with higher level initial emission intensity.
For carbon emission policy-makers, they must fully consider the enterprise’s operational strategy and technology innovation investment strategy when formulating carbon emission abatement policies, and integrate the enterprise’s strategy into the overall goal of policy making. The intensity target policy can be most effective for policy-makers who wish to reduce the carbon emission rate, as the intensity target policy focuses on the carbon emitted per unit production and thus can keep the rate within a certain range. For policy-makers who want to promote technological innovations, the cap-and-trade policy will be the best choice. Whether by investing in technological innovation of carbon emission abatement to directly reduce carbon emissions, or by investing in technological innovation of production to improve production efficiency and indirectly reduce carbon emissions, the goal of technological innovation will be achieved.
By the analyses, the effectiveness of regulatory policies can be clearly predicted at the manufacturers’ operational level. Our research findings offer support for alleviating the economic concerns of both governments and businesses regarding the impact of tightening environmental regulations. Policy-makers can use well-designed carbon regulations to encourage the adoption of green and efficient production technologies. This can benefit not only the environment but also the profitability of businesses in the long run.
The limitation of the paper lies in the following two aspects: on the one hand, in order to obtain the explicit solutions, we ignore many actual conditions in reality; on the other hand, the main conclusions of this paper are based on the analysis of mathematical models, and there is a lack of verification analysis of the rationality of the results by using actual data. Therefore, the future extension research can further relax the assumptions on the basis of the research in this paper; for example, we can consider the cost function which is more in line with that in practice. Through building a more general model, we can analyze the more general results. Due to the complexity of the general model, sometimes, it is difficult to obtain the explicit solutions. It can be considered to apply the data for empirical analysis or simulation analysis, so as to obtain the research results that can better reflect the practice of enterprises in reality.
Author Contributions
Conceptualization, Y.M. and J.Z.; methodology, Y.M.; writing—original draft preparation, Y.M.; writing—review and editing, J.Z.; supervision, Y.M. All authors have read and agreed to the published version of the manuscript.
Funding
This research was funded by National Key Research and Development Program of China, Grant/Award Number: 2021YFB3300801.
Institutional Review Board Statement
Not applicable.
Informed Consent Statement
Not applicable.
Data Availability Statement
The data presented in this study are available in this article.
Conflicts of Interest
The authors declare no conflict of interest.
References
- Stavins, R.N. Carbon Taxes vs. Cap and Trade: Theory and Practice; Harvard Project on Climate Agreements: Cambridge, MA, USA, 2019. [Google Scholar]
- Ramstein, C.; Dominioni, G.; Ettehad, S.; Lam, L.; Quant, M.; Zhang, J.; Mark, L.; Nierop, S.; Berg, T.; Leuschner, P. State and Trends of Carbon Pricing 2019; The World Bank: Washington, DC, USA, 2019. [Google Scholar]
- Li, X.; Tang, Y.; Tang, Y. Production strategy selection and carbon emission reduction with consumer heterogeneity under cap-and-trade regulation. Complexity 2022, 2022, 8602997. [Google Scholar] [CrossRef]
- Jaller, M.; Matthews, S. Reducing Carbon Emissions Is Important. But Tackling Carbon Intensity Might Be Even More. Available online: https://fortune.com/2021/06/25/carbon-intensity-emissions-climate-change-paris-agreement/ (accessed on 25 June 2021).
- Petersen, T. Making CO2 Pricing Socially Just. Available online: https://www.ips-journal.eu/topics/economy-and-ecology/making-CO2-pricing-socially-just-5378/ (accessed on 5 June 2023).
- Li, Q.; Long, R.; Chen, H. Empirical study of the willingness of consumers to purchase low-carbon products by considering carbon labels: A case study. J. Clean. Prod. 2017, 161, 1237–1250. [Google Scholar] [CrossRef]
- Wang, Q.; Zhao, D.; He, L. Contracting emission reduction for supply chains considering market low-carbon preference. J. Clean. Prod. 2016, 120, 72–84. [Google Scholar] [CrossRef]
- Krass, D.; Nedorezov, T.; Ovchinnikov, A. Environmental taxes and the choice of green technology. Prod. Oper. Manag. 2013, 22, 1035–1055. [Google Scholar] [CrossRef]
- Elgie, S.; McClay, J. Policy Commentary/Commentaire BC’s carbon tax shift is working well after four years (attention Ottawa). Can. Public Policy 2013, 39, S1–S10. [Google Scholar] [CrossRef]
- Bai, Q.; Xu, J.; Gong, Y.; Chauhan, S.S. Robust decisions for regulated sustainable manufacturing with partial demand information: Mandatory emission capacity versus emission tax. Eur. J. Oper. Res. 2022, 298, 874–893. [Google Scholar] [CrossRef]
- Turken, N.; Carrillo, J.; Verter, V. Strategic supply chain decisions under environmental regulations: When to invest in end-of-pipe and green technology. Eur. J. Oper. Res. 2020, 283, 601–613. [Google Scholar] [CrossRef]
- Lin, X.; Chen, D.; Zhou, Y.-W.; Lin, Q. Horizontal mergers in low carbon manufacturing. Eur. J. Oper. Res. 2022, 297, 359–368. [Google Scholar] [CrossRef]
- Zhou, P.; Wen, W. Carbon-constrained firm decisions: From business strategies to operations modeling. Eur. J. Oper. Res. 2020, 281, 1–15. [Google Scholar] [CrossRef]
- Letmathe, P.; Balakrishnan, N. Environmental considerations on the optimal product mix. Eur. J. Oper. Res. 2005, 167, 398–412. [Google Scholar] [CrossRef]
- Rong, A.; Lahdelma, R. CO2 emissions trading planning in combined heat and power production via multi-period stochastic optimization. Eur. J. Oper. Res. 2007, 176, 1874–1895. [Google Scholar] [CrossRef]
- Yang, M.; Blyth, W. Modeling Investment Risks and Uncertainties with Real Options Approach; International Energy Agency: Paris, France, 2007; p. 23. [Google Scholar]
- Hoen, K.; Tan, T.; Fransoo, J.C.; van Houtum, G.-J. Effect of carbon emission regulations on transport mode selection under stochastic demand. Flex. Serv. Manuf. J. 2014, 26, 170–195. [Google Scholar] [CrossRef]
- Du, S.; Tang, W.; Song, M. Low-carbon production with low-carbon premium in cap-and-trade regulation. J. Clean. Prod. 2016, 134, 652–662. [Google Scholar] [CrossRef]
- Gaigné, C.; Hovelaque, V.; Méchouar, Y. Carbon tax and sustainable facility location: The role of production technology. Int. J. Prod. Econ. 2020, 224, 107562. [Google Scholar] [CrossRef]
- Zheng, J.; Shi, J.; Lin, F.; Hu, X.; Pan, Q.; Qi, T.; Ren, Y.; Guan, A.; Zhang, Z.; Ling, W. Reducing manufacturing carbon emissions: Optimal low carbon production strategies respect to product structures and batches. Sci. Total Environ. 2023, 858, 159916. [Google Scholar] [CrossRef] [PubMed]
- Bloemhof-Ruwaard, J.M.; Van Beek, P.; Hordijk, L.; Van Wassenhove, L.N. Interactions between operational research and environmental management. Eur. J. Oper. Res. 1995, 85, 229–243. [Google Scholar] [CrossRef]
- Inman, R.A. Environmental management: New challenges for production and inventory managers. Prod. Inventory Manag. J. 1999, 40, 46. [Google Scholar]
- Timilsina, G.R. Carbon taxes. J. Econ. Lit. 2022, 60, 1456–1502. [Google Scholar] [CrossRef]
- Klassen, R.D.; Whybark, D.C. Environmental management in operations: The selection of environmental technologies. Decis. Sci. 1999, 30, 601–631. [Google Scholar] [CrossRef]
- Insley, M.C. On the option to invest in pollution control under a regime of tradable emissions allowances. Can. J. Econ. /Rev. Can. D’économique 2003, 36, 860–883. [Google Scholar] [CrossRef]
- Absi, N.; Dauzère-Pérès, S.; Kedad-Sidhoum, S.; Penz, B.; Rapine, C. Lot sizing with carbon emission constraints. Eur. J. Oper. Res. 2013, 227, 55–61. [Google Scholar] [CrossRef]
- Cao, K.; Xu, X.; Wu, Q.; Zhang, Q. Optimal production and carbon emission reduction level under cap-and-trade and low carbon subsidy policies. J. Clean. Prod. 2017, 167, 505–513. [Google Scholar] [CrossRef]
- Zhou, D.; An, Y.; Zha, D.; Wu, F.; Wang, Q. Would an increasing block carbon tax be better? A comparative study within the Stackelberg Game framework. J. Environ. Manag. 2019, 235, 328–341. [Google Scholar] [CrossRef] [PubMed]
- Lu, J.; Sun, X. Carbon regulations, production capacity, and low-carbon technology level for new products with incomplete demand information. J. Clean. Prod. 2021, 282, 124551. [Google Scholar] [CrossRef]
- Jung, C.; Krutilla, K.; Boyd, R. Incentives for advanced pollution abatement technology at the industry level: An evaluation of policy alternatives. J. Environ. Econ. Manag. 1996, 30, 95–111. [Google Scholar] [CrossRef]
- Zhao, J. Irreversible abatement investment under cost uncertainties: Tradable emission permits and emissions charges. J. Public Econ. 2003, 87, 2765–2789. [Google Scholar] [CrossRef]
- Barreto, L.; Kypreos, S. Emissions trading and technology deployment in an energy-systems “bottom-up” model with technology learning. Eur. J. Oper. Res. 2004, 158, 243–261. [Google Scholar] [CrossRef]
- Weber, T.A.; Neuhoff, K. Carbon markets and technological innovation. J. Environ. Econ. Manag. 2010, 60, 115–132. [Google Scholar] [CrossRef]
- Liu, B.; Holmbom, M.; Segerstedt, A.; Chen, W. Effects of carbon emission regulations on remanufacturing decisions with limited information of demand distribution. Int. J. Prod. Res. 2015, 53, 532–548. [Google Scholar] [CrossRef]
- Zhang, T. Which policy is more effective, carbon reduction in all industries or in high energy-consuming Industries? From dual perspectives of welfare effects and economic effects. J. Clean. Prod. 2019, 216, 184–196. [Google Scholar] [CrossRef]
- Yang, R.; Tang, W.; Zhang, J. Technology improvement strategy for green products under competition: The role of government subsidy. Eur. J. Oper. Res. 2021, 289, 553–568. [Google Scholar] [CrossRef]
- Fu, K.; Li, Y.; Mao, H.; Miao, Z. Firms’ production and green technology strategies: The role of emission asymmetry and carbon taxes. Eur. J. Oper. Res. 2023, 305, 1100–1112. [Google Scholar] [CrossRef]
- Weitzman, M.L. Prices vs. quantities. Rev. Econ. Stud. 1974, 41, 477–491. [Google Scholar] [CrossRef]
- Krysiak, F.C. Prices vs. quantities: The effects on technology choice. J. Public Econ. 2008, 92, 1275–1287. [Google Scholar] [CrossRef]
Disclaimer/Publisher’s Note: The statements, opinions and data contained in all publications are solely those of the individual author(s) and contributor(s) and not of MDPI and/or the editor(s). MDPI and/or the editor(s) disclaim responsibility for any injury to people or property resulting from any ideas, methods, instructions or products referred to in the content. |
© 2023 by the authors. Licensee MDPI, Basel, Switzerland. This article is an open access article distributed under the terms and conditions of the Creative Commons Attribution (CC BY) license (https://creativecommons.org/licenses/by/4.0/).