Article

On the Substitution and Complementarity between Robots and Labor: Evidence from Advanced and Emerging Economies

1
Intellectual Property Research Institute, Xiamen University, Xiamen 361005, China
2
School of Applied Economics, Renmin University of China, Beijing 100872, China
*
Author to whom correspondence should be addressed.
Sustainability 2023, 15(12), 9790; https://doi.org/10.3390/su15129790
Submission received: 8 May 2023 / Revised: 6 June 2023 / Accepted: 12 June 2023 / Published: 19 June 2023
(This article belongs to the Special Issue Labor Economics and Sustainability)

Abstract

:
This paper aims to empirically study the short-term relationship between robot adoption and the labor market across a diverse set of advanced and emerging economies. Additionally, it seeks to analyze the impact of macroeconomic and institutional factors on this relationship. This study reveals robot adoption promotes employment growth in advanced economies, while it has a negative effect on employment in emerging economies. This heterogeneity can be attributed to both direct and indirect linkages between robots and labor in production. Directly, robots can either substitute or complement human labor. Indirectly, robot adoption stimulates output growth, leading to increased labor demand. We also show that the robot–labor relationship is influenced by macroeconomic variables such as development stage, unemployment rate, and education level, as well as institutional variables such as business regulation and structural reforms. These findings suggest the need for a more inclusive and sustainable approach to the advancement of robot adoption and automation.

1. Introduction

The current resurgence of interest in the impact of robot adoption on the labor market builds on a long tradition of research starting with technological unemployment, and it is renewed by the rapid advances in robotics, artificial intelligence (AI), machine learning, and networks. Some studies consider using robots in production as improving productivity and enriching job opportunities, while others warn about a jobless future. This paper aims to systematically examine the short-term relationship between robot adoption and the labor market.
Theoretically, this paper is motivated by the ongoing debate on the impact of robot adoption on the labor market. Such an impact can be unpacked into a substitution effect and a creation effect [1,2,3]. The substitution effect describes the influence that robotics and automation directly replace labor input in production [4]. On the other hand, the creating effect is about advancement in technology improving production efficiency, reducing prices, and promoting economic growth, which in turn increases labor demand [5]. This paper is also motivated by the studies on the heterogeneous impacts of robotics and automation. Abuselidze and Mamaladze [6] argue that with the in-depth development of robotics and automation, the reduced cost of machine use will benefit advanced economies, while some emerging economies will benefit from technological change if they can provide the labor force to match the new technology. Alonso et al. [7] discuss that robot adoption has a greater positive impact in advanced economies and regions than in emerging economies and regions, which can lead to a wider gap between them.
Empirically, this paper is related to the growing literature that studies the macroeconomic effects of robotics and automation. Within this field, this paper particularly relates to the studies that investigate the impact of robotics and automation on the labor market. Using panel data on robot adoption in 17 economies from 1993 to 2007, Graetz and Michaels [8] find that robot adoption reduces low-skilled workers’ employment share, but not total employment. Acemoglu and Restrepo [9] show that total employment in the US increased by 17.5% from 1980 to 2015, and nearly half of the increase was caused by automation creating new occupations. Acemoglu and Restrepo [10] study the degree of competition between robots and labor in different tasks and find that each additional robot installation per thousand workers increases the unemployment rate by 0.18–0.34 percentage points. Gregory et al. [11] find that while routine-replacing technological change has indeed had strong displacement effects in the European Union between 1999 and 2010, it has simultaneously created new jobs through increased product demand, outweighing displacement effects and resulting in net employment growth.
Despite a growing body of research on the macroeconomic effects of robots and automation, most of the studies focus almost exclusively on advanced economies. Furthermore, there has been very limited systematic analysis, and it remains a great challenge to pin down the direction and magnitude of the impact of robots on the labor market. This paper fills this gap by directly estimating the short-term association between robot installation and the labor market for a large panel of advanced and emerging economies. We focus on the following research questions: First, is there heterogeneity in the impact of robot adoption on the labor market between advanced economies (AEs) and emerging markets (EMs)? Second, do the channels through which robot adoption affects the labor market differ between AEs and EMs? Third, what factors drive the heterogeneous impacts of robot adoption across different economies?
Regarding whether robot adoption benefits or hinders the labor market, the debate focuses on whether it creates more job opportunities than it eliminates. Affected by the development stage [9,12] and labor market conditions [13], the impact of robot adoption on the labor market could be heterogeneous in different economies. Following the International Monetary Fund (IMF) classification based on an economy’s income level and development stage of financial market and structural change, we focus our analysis on the difference between advanced and emerging economies. Our empirical results confirm that robot adoption generally promotes employment growth in AEs, while it is negatively associated with total employment in EMs.
To understand the different responses between the two income groups, this paper uses a mediation analysis to further unpack the overall relationship between robot adoption and total employment into two channels: a direct linkage that robots and labor substitute or complement each other as two inputs in production [7], and an indirect linkage that robot adoption promotes productivity and stimulates economic growth [8,14], and consequently increases labor demand [15]. On the one hand, EMs often feature in a labor-rich and capital-scarce production, as well as a lower level of education, in comparison with AEs. Compared with high-skill jobs that can be more complementary with robots in production, low-skilled and routine jobs are more likely to be substituted by robots [16,17]. On the other hand, the ability to utilize robots to promote economic growth [8,18], as well as the sensitivity of the labor market to economic growth also differs between AEs and EMs [19]. Therefore, it is more difficult for EMs to adapt to robot adoption in the short term.
This paper contributes to the literature and provides new empirical evidence on the impact of robot adoption on the labor market in AEs and EMs. More importantly, this paper investigates the channels through which robot adoption affects the labor market and quantifies how macroeconomic and institutional determinants alter the robot–labor relationship. The empirical findings in this paper offer valuable insights for inclusive and sustainable development, especially for EMs.
The rest of this paper proceeds as follows. Section 2 discusses the research background. Section 3 describes the methods and scope. Section 4 reports the empirical findings and robustness checks. Section 5 studies the macroeconomic and institutional factors that could affect the heterogeneous robots–labor relationship. Section 6 compares the findings in this paper with the literature. Section 7 concludes.

2. Research Background

Since the turn of the 21st century, there has been rapid technological advancement, particularly in the internet and information technology. Robotic technology innovation has made significant progress worldwide and has become increasingly integrated into the economy and society, propelling human civilization into the era of intelligence. As a transformative technology, robotics has unleashed the vast potential for technological revolution and industrial transformation, profoundly altering human production methods and lifestyles. It has substantial and far-reaching impacts on economic development and social progress.
Similar to traditional technologies, the emergence of robotics technology promotes economic growth, optimizes production structures, and enhances productivity. However, it also brings about “creative destruction”. As early as the early 20th century, economist John M. Keynes famously predicted that humanity would face “technological unemployment”. However, unlike traditional technological progress that primarily displaces specific occupations, robotics, as a production factor, directly substitutes for labor. Therefore, compared to traditional technological progress, robotics has a broader and more profound impact on production methods and the labor market. Robotics not only replaces labor but also creates new ways of working, driving employment opportunities [9].
On the one hand, robots directly participate in the production process as a production factor. The relationship between robots and labor can be substitutive or complementary, representing the direct effect. On the other hand, the introduction of robots enables companies to automate tasks, replacing labor with cheaper capital, reducing costs, improving productivity, stimulating consumer demand, expanding output, and promoting employment. This represents the indirect effect of robots on employment, known as the productivity effect. The overall theoretical logic of robotics’ impact on employment can be summarized based on these factors.
Building upon this analysis, the theoretical framework of this article further divides the overall impact of robots on employment into direct effects and indirect effects mediated through various channels. On this basis, this article discusses the regional heterogeneity of this impact in advanced and emerging economies. To understand the impact of industrial robots on labor markets in advanced economies, we refer to the relevant literature that explores how the rise of robots affects labor markets in advanced economies like Europe and the United States [8,10,20]. Additionally, evidence from emerging economies such as China is also considered in the discussion [21].

3. Methods and Scope

This section discusses the econometric methods used in this paper. It also provides detailed information and stylized facts related to robot adoption and other macroeconomic and institutional variables. The main goal is to (1) examine the overall association between robot adoption and the labor market; (2) unpack the overall association into a direct substitutive or complementary relationship and an indirect growth effect using a mediation analysis; and (3) quantify the impacts of macroeconomic and institutional factors on the robot–labor relationship using an interacted variable analysis.

3.1. Methods

3.1.1. Baseline Specification

Defining the percentage deviations of total employment and robot installation from their potential levels as employment gap and robot installation gap, respectively, we estimate the short-term responsiveness of the labor market to robot adoption using the following gaps specification (following Ball et al. [22], among other empirical studies on Okun’s law):
E i t E i t * = β R i t R i t * + μ t + ε i t
where Eit denotes the total employment of country i in year t, Rit is the robot installation, both transformed by natural logarithm, and * indicates their long-term natural levels. Time fixed effects, denoted by µt, are included to act as the control for any big global shocks, and the error term εit is assumed to be zero-mean and uncorrelated with the employment gap. The coefficient β measures the short-term responsiveness of the employment gap to the robot installation gap. Despite a growing body of discussion on the impact of robot adoption on the labor market, the sign and magnitude of coefficient β are both difficult to pin down.
We estimate the above specification using least squares regression for panel data, with standard errors robust to heteroskedasticity and autocorrelation. In contrast to Ball et al. [22], who estimate country-specific responsiveness, this paper focuses on the pooled coefficient estimates by income groups. Pooling data allows us to overcome the data limitation, especially on robot installation. A similar strategy has been applied by Huang and Yeh [23] and Ibragimov and Ibragimov [24] who estimate Okun’s law based on panel data.
Our analysis distinguishes between AEs and EMs. On the one hand, the typically higher capital-scarce and labor-rich production, as well as the lower general level of education in EMs than in AEs, motivates this choice. In the debate about whether robot adoption benefits or hinders the labor market, a main concern is whether robot adoption generates more job opportunities than it eliminates. It is straightforward that a country with a larger number of lower-skilled labor has more difficulties to adapt to robot adoption in the short term. On the other hand, the ability of utilizing robots to promote economic growth, as well as the response of the labor market to economic growth (i.e., Okun’s law) also differs between AEs and EMs. Consequently, we expect the responsiveness of the group of EMs to be different from that of AEs.

3.1.2. Mediation Analysis

To understand the potential channels that robot installation affects total employment, we rely on the mediation analysis to decompose such an overall association into two parts: a direct linkage that robots and labor substitute or complement each other as two production inputs; and an indirect linkage that robot adoption boosts economic growth and aggregate demand conditions, which in turn promotes total employment. Such a decomposition is conducted with the following system of equations:
E i t E i t * = β 1 R i t R i t * + β 2 Y i t Y i t * + μ t E + ε i t E
Y i t Y i t * = β 3 R i t R i t * + μ t Y + ε i t Y
where Yit denotes the total output, and other notations stay the same. Controlling for output gap (YitYit*) in Equation (2), coefficient β captures the direct responsiveness of the employment gap to the robot adoption gap, and it is expected to be positive if robots and labor are complementary in production, and negative if substitutive. The Okun coefficient β2 measures how sensitive the employment gap is to the output gap, and it is expected to be positive with larger magnitudes in AEs than in EMs [19,25]. Coefficient β3 captures how much robot installation, as a production input, promotes economic growth, and it is expected to be positive. Therefore, the overall responsiveness β in Equation (1) is decomposed into β1 and β2 × β3, where the latter measures the indirect linkage between employment and robots via growth. We estimate the above specifications as a system of equations using a seemingly unrelated regression method.

3.1.3. Interacted Variable Analysis

This paper is also interested in the cross-country difference in the relationship between robot adoption and the labor market, and more importantly, what factors affect such heterogeneity. As discussed in Acemoglu and Restrepo [9], due to the complex impacts of robot adoption, different economies and regions with different levels of development could expect different responses in the labor market. From a different angle, Barbieri et al. [13] argue that due to different labor market conditions, the effect of robot adoption on employment differs. We rely on an interacted variable regression to capture such effects. Specifically, we focus on the overall relationship between robot installation and employment and estimate the following extension of Equation (1):
E i t E i t * = γ 1 R i t R i t * + γ 2 R i t R i t * × I i t + γ 3 I i t ω t + ϵ i t
where Iit denotes the factor that potentially affects a nonlinear responsiveness of employment to robot installation, hence the parameter γ2 captures such impact. A positive coefficient estimate indicates that such a factor amplifies the impact of robot adoption on employment, and a negative indicates a dampened effect. Parameter γ3 measures any direct effects of such a factor on employment. The interacted variable analysis has been widely used in the empirical analysis of nonlinear relationships. Particularly related to our study, Furceri et al. [26] use this method to study the determinants of the Okun coefficient across economies and different periods. An et al. [25] study the asymmetric Okun’s coefficient between recession and regular episodes. We follow the literature and rely on this method to conduct a comprehensive study on the factors that affect the responsiveness of the labor market to robot adoption.

3.2. Scope

We focus our empirical analysis on a large panel of advanced and emerging economies. The classifications follow that of the IMF, which are identified based on a country’s income level, development stage of the financial market, and structural reforms (detailed income groups are documented in Table A1). Restricted by the data on robot adoption, our data consist of 28 advanced economies and 13 emerging economies spanning from 1993 to 2019 with a yearly frequency.
As the key explanatory variable, the data on robot adoption used in this paper are retrieved from the International Federation of Robotics (IFR), and it measures the stock of multipurpose industrial robots in different economies. The primary source of this data is the robot installation statistics of major industrial robot suppliers, collected directly by IFR. The primary source is also validated by the secondary data collected by several national robotics associations. For its coverage and reliability, the IFR data has been widely used in the literature [8,10,27].
Figure 1 plots the dynamics of robot installation as a ratio of GDP and growth rate of robot installation by income groups. We can see that the ratio of robot installation to GDP is generally higher in AEs than in EMs; however, there shows a trend of catching up, as the robot installation growth rate in EMs is much higher than that in AEs. This catching up mainly occurs in the 20th century, and the gap in growth rates between the two income groups starts to close up afterwards. Robot adoption growth is relatively stable at around 10% before the early 2000s, and it starts to accelerate and shows significant cross-country divergence as the 25–75 percentile range broadening up. Robot adoption growth decreases during the 2007–08 recession, and it gradually slows down after that, meanwhile, the pace of emerging economies catching up slows down as well.
Table 1 reports the definition, source, and time range of other variables used in this paper. Our data on total employment comes from ILOSTAT of the International Labour Organization (ILO). The data on real GDP comes from the Penn World Table version 10.0 (PWT), and we use the output-side measure at chained PPPs, which is more suitable for comparing relative productive capacity across economies and over time. Due to data availability, mostly restricted by AI data, the panel is unbalanced. The remaining data used in this paper, unemployment rate and the informal labor force, come from ILOSTAT, and data on the shares of service and manufacturing sectors come from the Organization for Economic Cooperation and Development (OECD) database. Data on education levels are retrieved from the Barro and Lee [28] education database. Measures of business regulation are from the Economic Freedom of the World, published by the Fraser Institute and Center. Structural reforms in labor and product market come from Alesina et al. [29].
Figure 2 plots the growth rates of robots, real GDP, and employment by income groups, and Table 2 reports on summary statistics and pooled correlation coefficients. Three points are worth noting. First, the growth rates in robot installation, real GDP, and total employment are higher in EMs than in AEs. Second, the growth rate of robot installation is much higher than that of real GDP and total employment, as the average growth rate is 15.2% for robots, while it is 3.7% and 1.3% for real GDP and employment, respectively (Table 2 Panel A). Such a gap is even larger in EMs. Third, they tend to move together, with the exception of robot adoption and employment in EMs. As shown in Table 2 Panel B, pooled correlation coefficients show similar results, pointing to a potentially different relationship between income groups.

4. Results

4.1. Baseline Results: Heterogeneous Relationship in AEs and EMs

The overall relationship between the labor market and robot adoption is estimated based on Equation (1). The results are reported in Table 3 Panel A by income groups. For the complete sample of countries (Column 1), though total employment tends to be positively associated with robot installation, it is statistically insignificant. Splitting the results by income groups suggests that the relationship between employment and robots is quite different between AEs and EMs; that robot adoption promotes employment growth in AEs, while it has negative impacts on total employment in the EMs.
The employment gap in AEs is estimated to be 0.0156 percentage points higher for each 1 percentage point rise in the robot installation gap. Considering that the average deviation in robot installation is 16% and the average total employment gap is 0.3%, it is a relatively large impact on the labor market. Such a positive association supports the argument by Autor [5], that automation can increase productivity and augment labor demand. By comparing development levels and analyzing the impacts of robotics innovation in different countries, Van Roy et al. [30] also point out that although AI and robotics innovation can reduce some jobs, it tends to create more jobs and overall boost the workforce.
In contrast, the employment gap in emerging economies is estimated to be 0.0104 percentage points lower for each 1 percentage point rise in the robot installation gap. The heterogeneous relationship between robot adoption and labor market has been discussed in the literature. Nedelkoska and Quintini [31] find that the ratio of machine replacement of labor varies greatly in different countries, and the ratio of replacement is higher in southern and eastern Europe than in northern Europe and North America. Abuselidze and Mamaladze [6] argue that with the in-depth development of robots and AI, the reduced cost of machine use will encourage companies to move away from countries with lower labor costs. This could benefit advanced economies while leading to a job loss in emerging economies.
The overall relationship between robot installation and total employment can be further decomposed into a direct relationship that robots and labor substitute or complement each other as two production factors, and an indirect relationship that robot adoption boosts economic growth and aggregate demand conditions, which in turn promotes total employment. Such a decomposition can be estimated through a mediation analysis (Equations (2) and (3)), and the results are reported in Table 3 Panel B. Comparing the two income groups, we can see that the heterogeneous robot–labor relationship is driven by both their direct and indirect components. On the one hand, robots and labor tend to be complementary in AEs, while they are substitutive in EMs. In other words, robot adoption directly promotes total employment in AEs, while it worsens the employment situation in EMs. On the other hand, robot adoption significantly promotes output growth in AEs, but not in EMs.
In AEs (Column 2), the positive relationship between robots and total employment is mainly driven by their direct linkage, and the indirect component accounts for roughly one-third of the overall effect. As of their direct complementary relationship, total employment is estimated to be 0.0109 percentage points higher for each 1 percentage point rise in the robot installation gap. As of their indirect relationship, a 1 percentage point gap in robot installation is associated with a 0.0240 percentage point increase in the output gap and is in turn associated with a 0.0047 (=0.1940 × 0.0240) percentage point increase in the total employment gap.
In contrast, the negative association between robots and total employment in EMs is dominated by their direct linkage, that total employment gap is estimated to be 0.0105 percentage points lower for each 1 percentage point rise in the robot installation gap. As of their indirect relationship, robot adoption has little impact on output (0.0012), which leads to no stimulative effect on total employment. As for the short-term responsiveness of labor markets to output fluctuations, the Okun-type coefficient is estimated to be 0.1940 in AEs and 0.0866 in EMs. These results are consistent with the literature, that the Okun coefficient is about half as large in emerging as in advanced countries [19,25].
To sum up, the baseline results show that the short-term relationship between robot installation and total employment tends to be positive in AEs, while negative in EMs. With a mediation analysis, we show that the direct linkage varies substantially between the two income groups. Robots and labor are complementary in AEs, while they are substitutive in EMs. However, the indirect linkage, that robot adoption boosts economic growth and in turn, leads to better employment conditions, only holds in AEs.

4.2. Robustness Checks: Filtering Technique, Underlying Assumption, and Endogeneity

We conducted several robustness checks regarding the filtering technique used to construct the cyclical components, the underlying assumption of economic fluctuations, and the estimation method. As a first robustness check, we constructed the cyclical component in each series using a new filtering technique proposed by Hamilton [32]. As Hamilton [32] discussed, the HP filter could introduce spurious dynamics that have no basis in the underlying data generation process, and the filtered values at the end of the series are different from those in the middle. Considering our data has a relatively short time span, such issues with the HP filter could affect the estimated relationship between robot adoption and the labor market.
Second, we considered a specification with a different underlying assumption of economic fluctuation. Specifically, growth rates in the potential value of total employment, robot installation, and output are assumed to be constant. That allows us to first-difference Equation (1) and derive an alternative first-difference specification. Such a specification complements the baseline specification with cyclical components, and it does not require us to obtain measures of the potential level of each series. In practice, we estimate the following specification.
Third, the panel regressions are potentially subject to the concern that coefficient estimates with the panel regression might be biased due to endogeneity. To address this point, we conducted an instrumental variables (IV) regression analysis, in which the number of technology-related patents in each country was included as an instrument for AI development. Finally, we examined the robustness of our baseline results using the dynamic panel GMM method developed by Arellano and Bond [33], and included lagged dependent variables as instruments. A point that needs to be made is that, to the best of our knowledge, no suitable instruments have been used to estimate the Okun-type relationship between the output and the labor market. Hence, we focus on the overall relationship between robot adoption and the labor market in the IV analysis.
Results from these robustness checks are reported in Table A2, Table A3 and Table A4 in Appendix A. All estimates are similar to those obtained from the baseline regressions, which reassures us about the robustness of our results. In carrying out the rest of the analysis, we follow our baseline specification.

5. Determinants of Heterogeneity

As shown in Section 4, the short-term relationship between robot adoption and the labor market varies substantially by development stage. Underlying the overall development stage, there are many differences between AEs and EMs in terms of macroeconomic and institutional conditions. In terms of macroeconomic conditions, AEs generally tend to have a relatively lower unemployment rate, more developed tertiary industry, smaller informal economy share, and higher education level, compared with the EMs. In terms of institutional conditions, AEs tend to have more advanced regulations and structural reforms. In this section, we delve into the factors that could potentially affect such a heterogeneous relationship. Specifically, we rely on two approaches: a simple correlation analysis between country-specific estimates and each potential factor, and an interacted variable regression analysis that formally quantifies how these factors alter the robot–labor relationship.

5.1. Country-Specific Estimation

We first estimate the country-specific relationship between robot adoption and the labor market. To overcome the short time span in each country, we conduct the country-specific estimation using panel regression specified as follows:
E i t E i t * = R i t R i t * θ + μ t c + ε i t c
where  E i t E i t *  is the cyclical component of total employment. Different from the baseline specification (Equation (1)),  R i t R i t *  is  N × K  matrix, where  N  is the number of observations in the unbalanced panel data and  K  is the number of countries. Each entry ( i t ) equals the cyclical components of robot installation if such an entry belongs to country  i , and zero if otherwise.  μ t c  and  ε i t c  denote the time fixed effects and the error term, respectively. With this specification, we can estimate  θ  as a  K × 1  vector of country-specific coefficients.
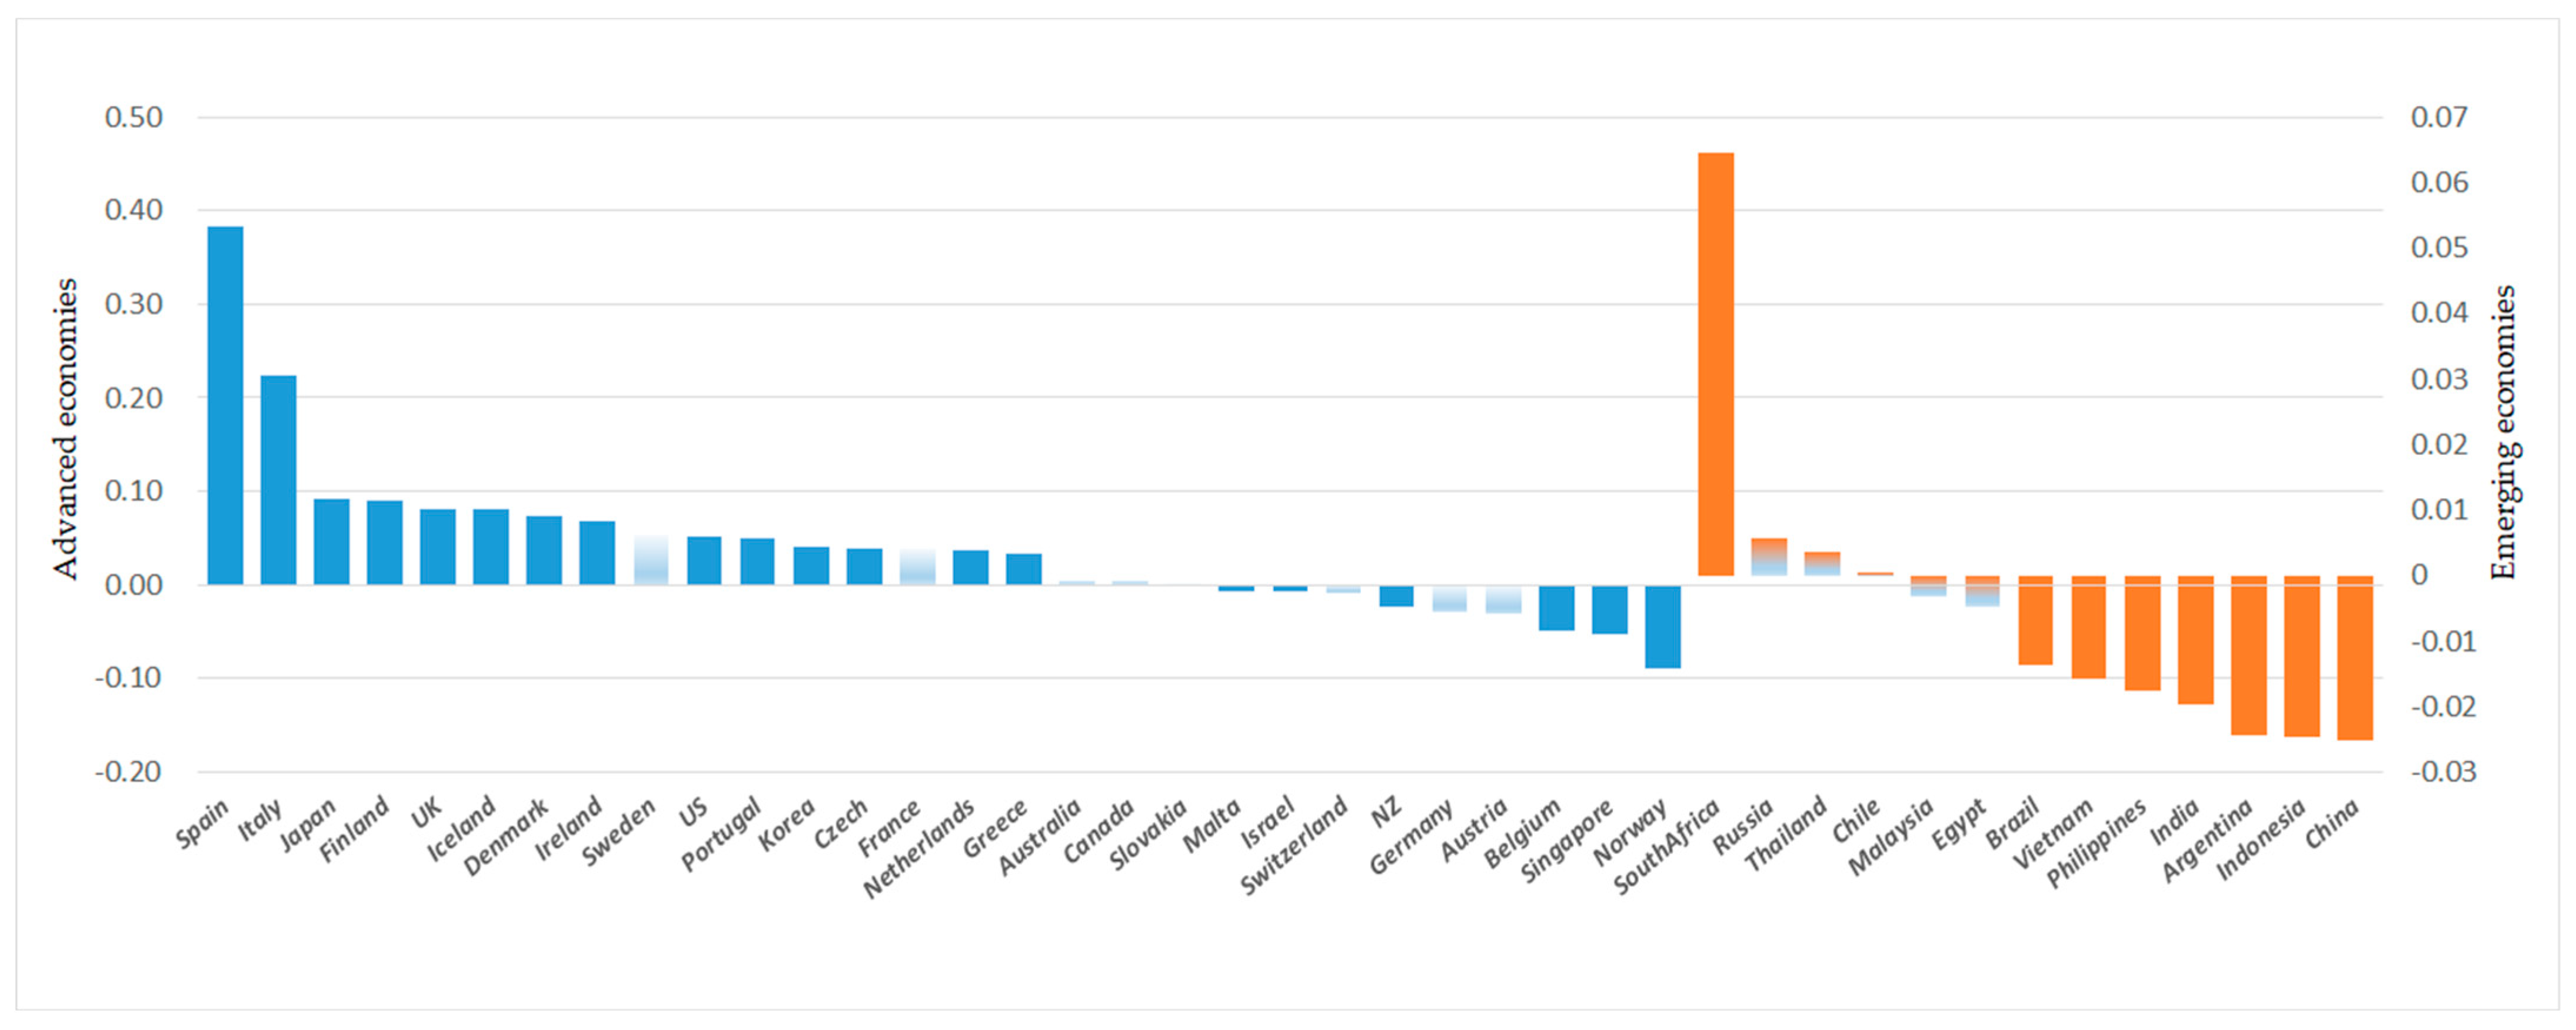
As shown in Figure 3, the short-term elasticity of total employment to robots varies substantially among different countries, with an average of 0.041 for AEs and −0.011 for EMs. Among the total number of 28 AEs, the estimate is positive and statistically significant in 14 countries (Czech Republic, Denmark, Finland, Greece, Iceland, Ireland, Italy, Japan, Korea, The Netherlands, Portugal, Spain, UK, and the USA); negative and significant in 5 countries (Belgium, Marta, New Zealand, Norway, and Singapore). Among the 13 EMs, the estimate is negative and significant in 7 countries (Argentina, Brazil, China, India, Indonesia, the Philippines, and Vietnam), while statistically positive only in South Africa.
Utilizing these country-specific coefficient estimates, we can calculate their correlations with the factors of interest. Two groups of potential determinates of interest are drawn from the literature and they have been shown to affect the responsiveness of the labor market. The first group is related to macroeconomic conditions, including the overall development stage, unemployment rate, shares of manufacturing and service sectors, and overall education level. The second group relates to the institutional conditions, including business regulation, and structural reform in labor and product markets.
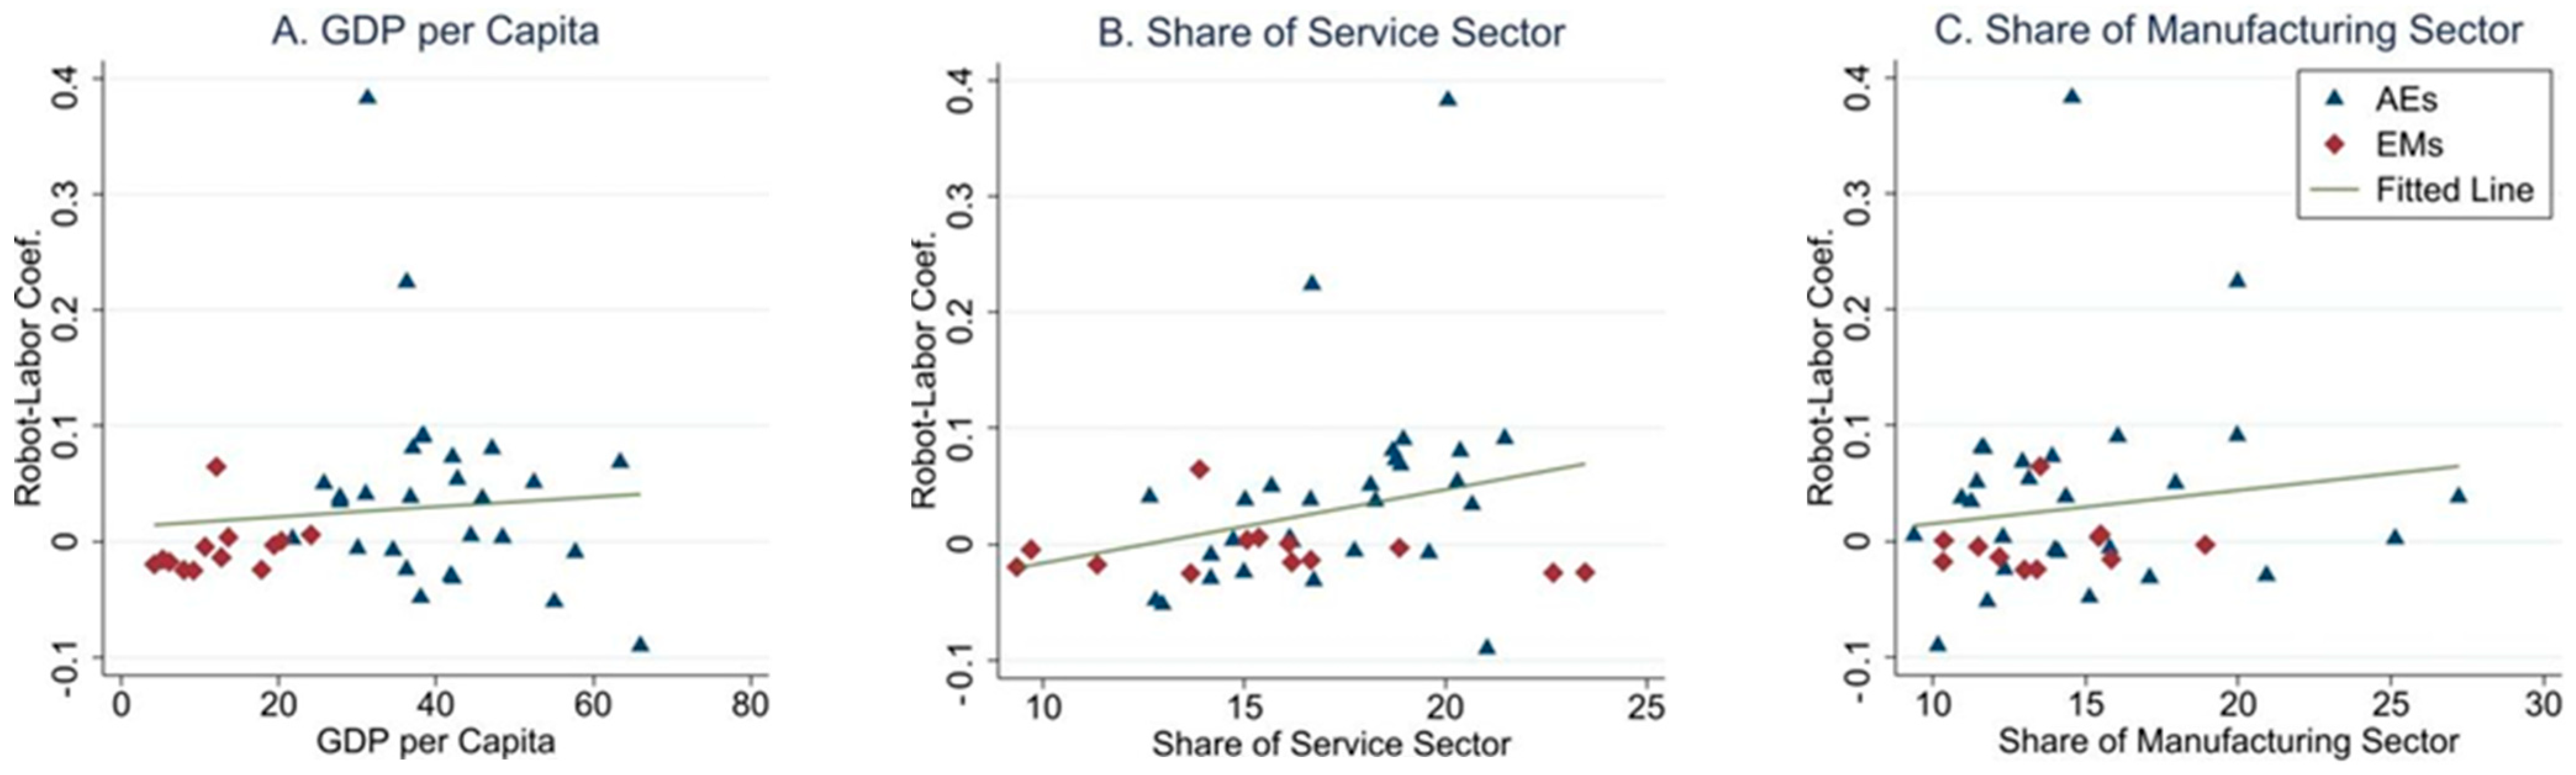
GDP per capita. As shown in Figure 4 Panel A, country-specific coefficients are positively related to the level of GDP per capita, which is a proxy of the general stage of economic development. This is consistent with the baseline results by income groups. Bloom et al. [3] argue that on the one hand, advanced countries generally have a steady demand for labor; and on the other hand, advanced countries also face an aging population and declining growth rate in labor supply. Such a combination makes an advanced economy more likely to benefit from faster employment growth from robot adoption.
Share of service sector. Berriman and Hawksworth [34] argue that the development and application of robots will create new jobs and provide more employment opportunities, and these new jobs tend to appear in the service industry. Deming [35] also discusses that with the development of computer technology, cognitive and creative jobs in the service industry become more difficult to be replaced, and employment growth is more likely to occur in jobs requiring high-level cognitive and social skills. Results in Figure 4 Panel B support these arguments, and country-specific coefficients are positively related to the share of the service sector in total output.
Share of manufacturing sector. Autor and Dorn [36] argue that labor in the manufacturing sector is easily replaced by machines, but the labor force which is replaced will shift to the service sector, in order to realize the re-employment. Dauth et al. [20] and Mann and Puttmann [37] also suggest that while robot adoption reduces the number of jobs in the manufacturing sector, it also increases the opportunity for employment in the service industry. Nevertheless, such a positive correlation between the share of the manufacturing sector and the short-term robot–labor coefficient (Figure 4 Panel C) is somewhat surprising.
Unemployment rate. Ball et al. [19] and Ball et al. [
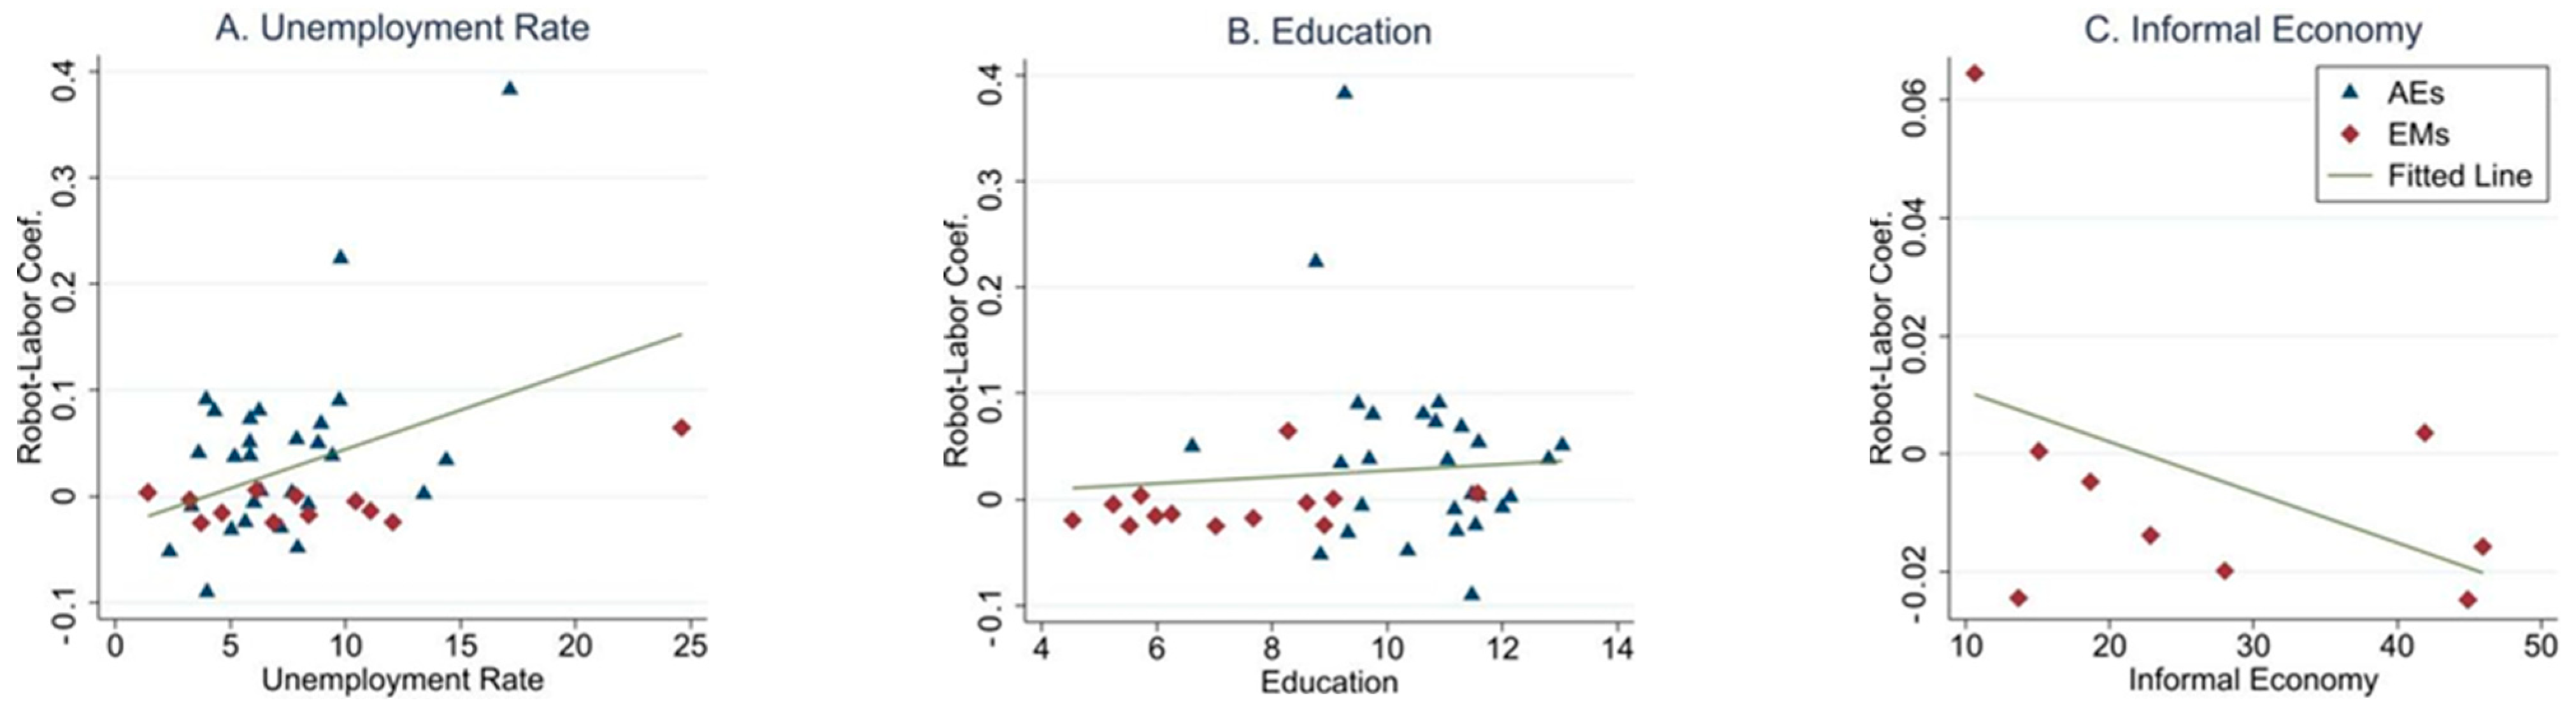
22] document a positive relationship between the Okun coefficient and the average level of unemployment in advanced countries and emerging economies, and they argue that in countries where the unemployment rate is higher, the labor market fluctuates more in response to aggregate economic conditions. In Figure 5 Panel A, we show a similar correlation, that the higher the unemployment rate is, the greater the promotion effect of robot adoption on the labor market.
Education level. As shown in Figure 5 Panel B, for countries with a lower level of education, the labor market is more likely to be hurt by robot adoption. The impact of education on the robot–labor relationship has been widely discussed in the literature. Among others, Acemoglu and Restrepo [10] point out that the impact of robot adoption on the labor market is influenced by education, and robots show a more obvious substitution effect on low-educated and low-skilled labor. Aghion et al. [38] find that uneducated workers were more likely to be negatively affected by robots than educated workers. Korinek and Stiglitz [39] also point out that robots and AI would suppress the employment of low-skilled labor through two channels: efficiency wage effect and employment structure transformation, and this is due to the fact that low-skilled labor cannot adjust in a timely manner.
Informal economy. The wide existence and importance of informal or shadow economy have been studied in the literature [40,41]. Related to our study, Bernal-Verdugo et al. [42] and Ball et al. [22] find that the existence of an informal economy obscures the responsiveness of the formal market. Figure 5 Panel C shows similar results that country-specific coefficients are negatively related to informal employment as a share of the total population.
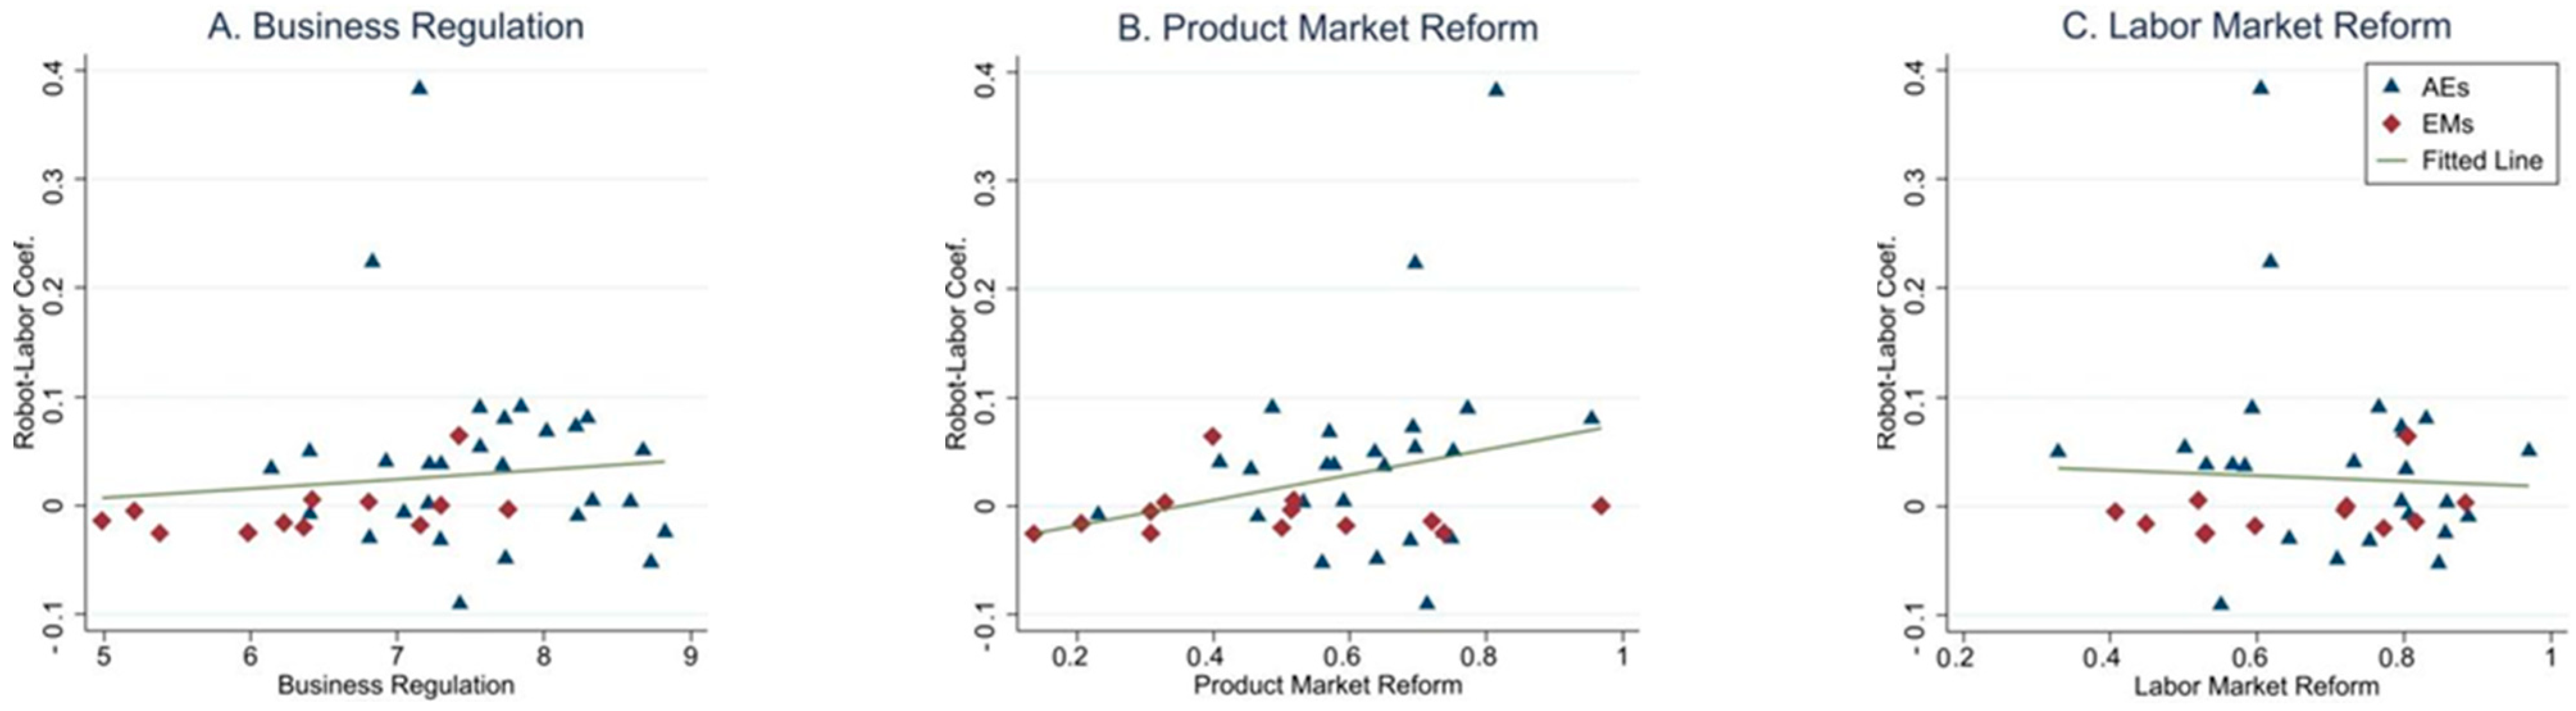
Business regulation. As for the institutional factors, many studies suggest that the responsiveness of the labor market depends on business regulations. For instance, in discussing hiring and firing regulations in Middle Eastern and North African (MENA) countries, Ahmed et al. [43] argue that such regulations can discourage “firms from expanding employment in response to favorable changes in the economic climate”. That is, greater employment protection can dampen hiring and firing as output fluctuates, which in turn reduces the responsiveness of total employment. Figure 6 Panel A shows supporting results that the country-specific coefficient is negatively related to the degree of business regulation.
Structural reforms. As for the structural reforms, we consider two fields particularly relevant to our study: product market reform measures the level of competition, state ownership, independent regulation, and government intervention; labor market reform measures the employment protection legislation (EPL) related to procedural requirements (such as third-party approval), firing costs (e.g., severance payments and note requirements, and grounds for dismissal with the possibility of redress). Economic theory suggests that structural reforms remove obstacles to an efficient allocation. As shown in Figure 6, the country-specific coefficient is positively related to product market reform (Panels B), while it is negatively related to labor market reform (Panels C). In other words, countries with a higher level of product market reform or lower labor market reform are expected to benefit from faster employment growth from robot adoption.

5.2. Interacted Variable Analysis

As an alternative approach, we use an interacted variable analysis to explore the nonlinear relationship between robot adoption and the labor market. Specifically, we include an interaction term between the cyclical component of robot installation and each potential determinant, which can quantify how each factor alters the responsiveness of total employment to robot installation. In principle, the explanatory variable should interact with all potential factors in the same panel analysis system; however, due to high collinearity, we follow An et al. [25] and restrict the interaction to one determinant at a time.
The candidate factors are drawn from the same pool of macroeconomic and institutional variables as the previous section. The interacted variable analysis complements the simple correlation analysis based on country-specific estimates. Though it cannot estimate the responsiveness of employment to robot installation for each country, it can directly quantify the amplifying or dampening impact of different factors. In our case, it also helps to overcome the data limitation of the short time span in robot installation data in each country.
Table 4 reports coefficient estimates of the interacted term, which captures the influence of each potential factor on the robot–labor relationship ( γ 2  in Equation (4)). These results are consistent with those from the simple correlation analysis above. As expected, countries in an advanced development stage (proxied by GDP per capita) tend to have a positive and greater association between robot installation and the labor market (0.018 ***), and this is mainly driven by AEs. The share of service sector in total output amplifies the responsiveness of total employment to robot installation in AEs (0.752 ***), while the share of the manufacturing sector amplifies the responsiveness in EMs (0.313 **).
Among other macroeconomic variables in labor markets, the unemployment rate amplifies the responsiveness of total employment to robot installation, with a 1 percentage point increase in the unemployment rate, the coefficient increases by 0.091, and this is also driven by AEs. Countries with a higher level of education tend to benefit more from robot adoption. Data on the informal economy are available only in EMs, and the results show that for countries with a higher level of informal economy, their labor markets tend to have a more negative response to AI development. As for the institutional variables, EMs with a higher level of business regulation tend to benefit a faster employment growth (0.016 *) from robot adoption. Between two structural reform indicators, product market reform amplifies the robot–labor relationship in AEs (0.058 *), and labor market reform matters mainly in EMs (0.064 ***).

6. Discussion

The fourth industrial revolution, with a focus on AI innovation, is profoundly reshaping the world order. The “digital divide” has further widened the gap between developed and developing countries. Studying the heterogeneity of AI’s impact on labor markets in different regions is not only of significant theoretical importance but also holds practical significance. However, the current literature mostly focuses on theoretical research or separately examines the actual effects on developed economies and emerging economies, lacking empirical studies that compare these two types of economies.
The existing literature often focuses on the impact of AI on labor markets in specific countries or regions without considering a global perspective or the underlying reasons for heterogeneity among economies. Furthermore, the existing literature assumes a negative direct impact of AI on labor markets in all countries, implying a substitutive relationship between AI and labor. However, it is uncertain whether factors exhibit substitutability or complementarity due to differences in production technologies and production functions across countries.
This paper fills this research gap by studying and comparing the impact of robots on labor markets in developed and emerging countries. We directly measure the overall impact of AI on labor markets in major developed and emerging economies. Building upon existing analytical frameworks, we decompose the overall impact into direct effects (the aforementioned substitution effect) and indirect effects (the creation effect). We compare these two types of effects and explore the heterogeneity of their impact in developed and emerging countries, as well as further investigate the factors driving this heterogeneity.

7. Conclusions

Our results show that first, there is heterogeneity in the impact of robot adoption on the labor market between AEs and EMs. Second, the heterogeneity in the impact of robot adoption is driven by both direct and indirect linkages between robots and labor. In terms of direct linkages, robots and labor tend to be complementary in AEs, whereas they are substitutive in EMs. Regarding indirect linkages, the responsiveness of employment to output growth is only half as large in EMs compared to AEs. Third, we identify macroeconomic and institutional factors as drivers of the heterogeneous impacts of robot adoption across economies. Among the macroeconomic variables, the stage of development, unemployment rate, the share of the service sector, and education level influence the robot–labor relationship in AEs, while the share of the manufacturing sector and the informal economy are important in EMs. Regarding institutional variables, business regulation plays a role both in AEs and EMs, while structural reforms are significant in EMs.
These findings argue for a more inclusive advancement of new technologies. There are significant differences in the short-term sensitivities of the labor market across different countries by level of development. Recognizing these differences is essential to better understanding the labor market “cost” and equality under the fast development of robots, automation, and AI. Future research could aim at further exploring these differences by demographics and identifying their deeper determinants. The research contributes to discussions on economic development, particularly in developing economies. By examining the impact of robot adoption on employment growth and economic output, this study highlights the potential challenges and opportunities associated with technological advancements in these contexts. This paper contributes to the literature by providing a comprehensive analysis of the robot–labor relationship across advanced and developing economies. The findings offer valuable insights for policymakers, businesses, and practitioners, guiding policy formulation, strategic decision-making, and sustainable economic development in the era of automation.

Author Contributions

J.L.: Proposing the research idea, Performing the analysis, Drafting the manuscript, Editing the manuscript and responding to the editor/referees. Z.A.: Proposing the research idea, Performing the analysis, Drafting the manuscript, Editing the manuscript and responding to the editor/referees. Y.W.: Proposing the research idea, Performing the analysis, Drafting the manuscript, Editing the manuscript and responding to the editor/referees. All authors have read and agreed to the published version of the manuscript.

Funding

This work was supported by the Science Foundation of the Ministry of Education of China (20231JY0003).

Institutional Review Board Statement

Not applicable.

Informed Consent Statement

Not applicable.

Data Availability Statement

Data sharing not applicable.

Acknowledgments

We are grateful to the assistant editor, and two anonymous referees for very useful comments that have significantly improved this paper.

Conflicts of Interest

The authors declare no conflict of interest.

Appendix A

Table A1. Income Groups.
Advanced EconomiesDeveloping Economies
Australia, Austria, Belgium, Canada, Czech Republic, Denmark, Finland, France, Germany, Greece, Iceland, Ireland, Israel, Italy, Japan, Korea, Malta, NZ, The Netherlands, Norway, Portugal, Singapore, Slovakia, Spain, Sweden, Switzerland, UK, USArgentina, Brazil, Chile, China, Egypt, India, Indonesia, Malaysia, the Philippines, Russia, South Africa, Thailand, Vietnam
Notes: The country classification follows that of the IMF. “Advanced Economies” (AEs) include economies with highly developed economies, high-income levels, and mature financial markets, while “Emerging Market and Developing Economies” (EMs) include economies with lower income levels but fast economic growth, undergoing structural changes, and relatively less developed financial markets.
Table A2. Robustness Check—Hamilton Filter.
AllAEEM
Panel A. Overall Effect
Emp—Robots
Robots−0.00560.0105 *−0.0220 **
(0.0046)(0.0054)(0.0090)
R-sq0.170.310.12
Panel B. Mediation Analysis
Output—Robots
Robots0.02140.0486 **−0.0246
(0.0157)(0.0196)(0.0265)
R-sq0.290.310.42
Emp—Robots, Output
Robots−0.00710.0072−0.0208 **
(0.0045)(0.0052)(0.0085)
Output0.0624 ***0.0626 ***0.0499 ***
(0.0101)(0.0108)(0.0227)
R-sq0.210.350.14
Obs777552185
Notes: This table shows the estimated overall impact of robot adoption on employment (Panel A) based on Equation (1) and the mediation analysis (Panel B) based on Equations (2) and (3). Cyclical components are constructed using the Hamilton (2018) filter. All regressions control for time-fixed effects. *, ** and *** denote statistical significance at 10%, 5% and 1% levels, respectively.
Table A3. Robustness Check—Growth Rates in Employment, Robot Installation, and Output.
AllAEEM
Panel A. Overall Effect
Emp—Robots
Robots0.0137 ***0.0192 ***−0.0149 *
(0.0036)(0.0047)(0.0085)
R-sq0.140.250.14
Panel B. Mediation Analysis
Output—Robots
Robots0.0676 ***0.0270 **0.0488 ***
(0.0097)(0.0124)(0.0176)
R-sq0.300.280.52
Emp—Robots, Output
Robots0.00440.0153 ***−0.0184 **
(0.0034)(0.0042)(0.0081)
Output0.1390 ***0.1450 ***0.0727 ***
(0.0123)(0.0134)(0.0305)
R-sq0.250.370.17
Obs868648220
Notes: This table shows the estimated overall impact of robot adoption on employment (Panel A) and the mediation analysis (Panel B) based on growth rates in total employment robot installation and output. All regressions control for time-fixed effects. *, ** and *** denote statistical significance at 10%, 5% and 1% levels, respectively.
Table A4. Robustness Check—IV Regression.
AllAEEM
Panel A. Second Stage
Emp—Robots
Robots0.0190 ***0.0216 ***−0.0412 **
(0.0054)(0.0079)(0.0177)
R-sq0.1460.2550.114
Durbin0.230.740.11
Wu-Hausman0.240.750.12
Panel B. First Stage
Robots—Patent
Patent0.0954 ***0.0646 **0.1716 **
(0.0262)(0.0261)(0.0667)
R-sq0.380.290.15
Obs861644217
Notes: This table reports the estimated overall impact of robot adoption on employment based on instrumental variable regression. All regressions control for time-fixed effects. ** and *** denote statistical significance at 5% and 1% levels, respectively.

References

  1. Aghion, P.; Howitt, P. Growth and unemployment. Rev. Econ. Stud. 1994, 61, 477–494. [Google Scholar] [CrossRef] [Green Version]
  2. Acemoglu, D.; Restrepo, P. Artificial intelligence, automation, and work. In The Economics of Artificial Intelligence: An Agenda; Agrawal, A., Gans, J., Goldfarb, A., Eds.; University of Chicago Press: Chicago, IL, USA, 2019; pp. 197–236. [Google Scholar]
  3. Bloom, D.E.; McKenna, M.; Prettner, K. Demography, unemployment, automation, and digitalization: Implications for the creation of (decent) jobs, 2010–2030. Natl. Bur. Econ. Res. 2018, w24835. [Google Scholar] [CrossRef]
  4. Susskind, D. A model of technological unemployment. Oxf. Rev. Econ. Policy 2017, 33, 541–554. [Google Scholar]
  5. Autor, D.H. Why are there still so many jobs? The history and future of workplace automation. J. Econ. Perspect. 2015, 29, 3–30. [Google Scholar] [CrossRef] [Green Version]
  6. Abuselidze, G.; Mamaladze, L. The impact of artificial intelligence on employment before and during pandemic: A comparative analysis. J. Phys. Conf. Ser. 2021, 1840, 012040. [Google Scholar] [CrossRef]
  7. Alonso, C.; Berg, A.; Kothari, S.; Papageorgiou, C.; Rehman, S. Will the AI revolution cause a great divergence? J. Monet. Econ. 2022, 127, 18–37. [Google Scholar] [CrossRef]
  8. Graetz, G.; Michaels, G. Robots at work. Rev. Econ. Stat. 2018, 100, 753–768. [Google Scholar] [CrossRef] [Green Version]
  9. Acemoglu, D.; Restrepo, P. The race between man and machine: Implications of technology for growth, factor shares, and employment. Am. Econ. Rev. 2018, 108, 1488–1542. [Google Scholar] [CrossRef] [Green Version]
  10. Acemoglu, D.; Restrepo, P. Robots and jobs: Evidence from US labor markets. J. Political Econ. 2020, 128, 2188–2244. [Google Scholar] [CrossRef] [Green Version]
  11. Gregory, T.; Salomons, A.; Zierahn, U. Racing With or Against the Machine? Evidence on the Role of Trade in Europe. J. Eur. Econ. Assoc. 2022, 20, 869–906. [Google Scholar] [CrossRef]
  12. Josten, C.; Lordan, G. Robots at work: Automatable and non-automatable jobs. In Handbook of Labor, Human Resources and Population Economics; Zimermann, K.F., Ed.; Springer: Berlin/Heidelberg, Germany, 2020; pp. 1–24. [Google Scholar]
  13. Barbieri, L.; Mussida, C.; Piva, M.; Vivarelli, M. Testing the employment and skill impact of new technologies. In Handbook of Labor, Human Resources and Population Economics; Zimmermann, K.F., Ed.; Springer: Berlin/Heidelberg, Germany, 2020; pp. 1–27. [Google Scholar]
  14. Damioli, G.; Van Roy, V.; Vertesy, D. The impact of artificial intelligence on labor productivity. Eurasian Bus. Rev. 2021, 11, 1–25. [Google Scholar] [CrossRef]
  15. Okun, A.M. Potential GNP: Its Measurement and Significance; Yale University, Cowles Foundation for Research in Economics New Haven: New Haven, CT, USA, 1963. [Google Scholar]
  16. Gaggl, P.; Wright, G.C. A short-run view of what computers do: Evidence from a UK tax incentive. Am. Econ. J. Appl. Econ. 2017, 9, 262–294. [Google Scholar] [CrossRef] [Green Version]
  17. Charnoz, P.; Orand, M. Technical change and automation of routine tasks: Evidence from local labour markets in France, 1999–2011. Econ. Stat. 2017, 497, 103–122. [Google Scholar] [CrossRef] [Green Version]
  18. Bartelsman, E.J.; Falk, M.; Hagsten, E.; Polder, M. Productivity, technological innovations and broadband connectivity: Firm-level evidence for ten European countries. Eurasian Bus. Rev. 2019, 9, 25–48. [Google Scholar] [CrossRef]
  19. Ball, L.; Furceri, D.; Leigh, D.; Loungani, P. Does one law fit all? Cross-country evidence on Okun’s law. Open Econ. Rev. 2019, 30, 841–874. [Google Scholar] [CrossRef]
  20. Dauth, W.; Findeisen, S.; Suedekum, J.; Woessner, N. Adjusting to Robots: Worker-Level Evidence. Opportunity and Inclusive Growth Institute Working Papers 13. 2018. Available online: https://www.minneapolisfed.org/research/institute-working-papers/adjusting-to-robots-worker-level-evidence (accessed on 7 May 2023).
  21. Wang, Y.; Dong, W. How Does the Rise of Robots Affect the Chinese Labor Market? Evidence from Listed Manufacturing Companies. Econ. Res. 2020, 55, 159–175. [Google Scholar]
  22. Ball, L.; Leigh, D.; Loungani, P. Okun’s law: Fit at 50? J. Money Credit. Bank. 2017, 49, 1413–1441. [Google Scholar] [CrossRef]
  23. Huang, H.-C.; Yeh, C.-C. Okun’s law in panels of countries and states. Appl. Econ. 2013, 45, 191–199. [Google Scholar] [CrossRef]
  24. Ibragimov, M.; Ibragimov, R. Unemployment and output dynamics in CIS countries: Okun’s law revisited. Appl. Econ. 2017, 49, 3453–3479. [Google Scholar] [CrossRef]
  25. An, Z.; Bluedorn, J.C.; Ciminelli, G. Okun’s law, development, and demographics: Differences in the cyclical sensitivities of unemployment across economy and worker groups. Appl. Econ. 2021, 54, 4227–4239. [Google Scholar] [CrossRef]
  26. Furceri, D.; Loungani, P.; Ostry, J.D.; Pizzuto, P. Will COVID-19 affect inequality? Evidence from past pandemics. COVID Econ. 2020, 12, 138–157. [Google Scholar]
  27. Acemoglu, D.; Restrepo, P. Demographics and automation. Rev. Econ. Stud. 2022, 89, 1–44. [Google Scholar] [CrossRef]
  28. Barro, R.J.; Lee, J.W. A new data set of educational attainment in the world, 1950–2010. J. Dev. Econ. 2013, 104, 184–198. [Google Scholar] [CrossRef]
  29. Alesina, A.F.; Furceri, D.; Ostry, J.D.; Papageorgiou, C.; Quinn, D.P. Structural reforms and elections: Evidence from a world-wide new dataset. Natl. Bur. Econ. Res. 2020, w26720. [Google Scholar] [CrossRef]
  30. Van Roy, V.; Vertesy, D.; Damioli, G. AI and robotics innovation. In Handbook of Labor, Human Resources and Population Economics; Zimmermann, K.F., Ed.; Springer: Berlin/Heidelberg, Germany, 2020; pp. 1–35. [Google Scholar]
  31. Nedelkoska, L.; Quintini, G. Automation, skills use and training. In OECD Social, Employment and Migration Working Papers; OECD Publishing: Paris, France, 2018. [Google Scholar]
  32. Hamilton, J.D. Why you should never use the Hodrick-Prescott filter. Rev. Econ. Stat. 2018, 100, 831–843. [Google Scholar] [CrossRef]
  33. Arellano, M.; Bond, S. Some tests of specification for panel data: Monte Carlo evidence and an application to employment equations. Rev. Econ. Stud. 1991, 58, 277–297. [Google Scholar] [CrossRef] [Green Version]
  34. Berriman, R.; Hawksworth, J. Will Robots Steal Our Jobs? The Potential Impact of Automation on the UK and Other Major Economies. UK Economic Outlook. 2017, pp. 30–47. Available online: https://www.pwc.co.uk/economic-services/ukeo/pwcukeo-section-4-automation-march-2017-v2.pd (accessed on 7 May 2023).
  35. Deming, D.J. The growing importance of social skills in the labor market. Q. J. Econ. 2017, 132, 1593–1640. [Google Scholar] [CrossRef] [Green Version]
  36. Autor, D.; Dorn, D. The growth of low-skill service jobs and the polarization of the US labor market. Am. Econ. Rev. 2013, 103, 1553–1597. [Google Scholar] [CrossRef] [Green Version]
  37. Mann, K.; Puttmann, L. Benign effects of automation: New evidence from patent texts. Rev. Econ. Stat. 2023, 105, 562–579. [Google Scholar] [CrossRef]
  38. Aghion, P.; Antonin, C.; Jaravel, X.; Bunel, S. What are the labor and product market effects of automation? New evidence from France. In Handbook of Labor, Human Resources and Population Economics; Springer: Berlin/Heidelberg, Germany, 2020. [Google Scholar]
  39. Korinek, A.; Stiglitz, J.E. Artificial intelligence and its implications for income distribution and unemployment. In The Economics of Artificial Intelligence: An Agenda; University of Chicago Press: Chicago, IL, USA, 2018; pp. 349–390. [Google Scholar]
  40. Elgin, C.; Oztunali, O. Institutions, informal economy, and economic development. Emerg. Mark. Financ. Trade 2014, 50, 145–162. [Google Scholar] [CrossRef] [Green Version]
  41. Jain-Chandra, S.; Mohommad, A. Inclusive Growth, Institutions, and the Underground Economy; IMF Working Paper; International Monetary Fund: Washington, DC, USA, 2012. [Google Scholar]
  42. Bernal-Verdugo, L.E.; Furceri, D.; Guillaume, D. Labor market flexibility and unemployment: New empirical evidence of static and dynamic effects. Comp. Econ. Stud. 2012, 54, 251–273. [Google Scholar] [CrossRef] [Green Version]
  43. Ahmed, M.; Guillaume, D.; Furceri, D. Youth unemployment in the MENA region: Determinants and challenges. In Addressing the 100 Million Youth Challenge—Perspectives on Youth Employment in the Arab World in 2012; World Economic Forum: Cologny, Switzerland, 2012; Available online: https://www.imf.org/external/np/vc/2012/061312.htm?id=186569 (accessed on 7 May 2023).
Figure 1. Robot Adoption by Income Groups. Notes: This figure shows robot adoption by income groups from 1994 to 2019. The left panel (A) shows the average ratio of robot installation to GDP; the right panel (B) shows the average growth rate.
Sustainability 15 09790 g001
Figure 2. Growth Rates of Robot Installation, Employment, and GDP by Income Groups. Notes: This figure shows the growth rates of robot installation, total employment, and real GDP by income groups from 1994 to 2019.
Sustainability 15 09790 g002
Figure 3. Response of Total Employment to Robot Installation in Each Country. Notes: This figure reports the responsive coefficient of total employment to robot installation in each country, estimated from Equation (5). Dark−shaded bars denote statistically significant coefficients at the 10% level or higher, and light−shaded bars denote statistically insignificant coefficient estimates.
Sustainability 15 09790 g003
Figure 4. Determinants of Robot−Labor Relationship: Output and Components by Sectors. Notes: This figure reports the correlation between country−specific robot−labor relationship and GDP per capita (Panel (A)), shares of service (Panel (B)), and manufacturing (Panel (C)) sectors.
Sustainability 15 09790 g004
Figure 5. Determinants of Robot−Labor Relationship: Labor Market Indicators. Notes: This figure reports the correlation between country-specific robot−labor relationship and unemployment rate (Panel (A)), education level (Panel (B)), and the share of informal economy (Panel (C)).
Sustainability 15 09790 g005
Figure 6. Determinants of Robot−Labor Relationship: Institutional Factors. Notes: This figure reports the correlation between country−specific robot−labor relationship and business regulation index (Panel (A)) and structural reforms in the product (Panel (B)) and labor (Panel (C)) markets.
Sustainability 15 09790 g006
Table 1. Variables and Definitions.
Data SeriesDefinitionData SourceTime Range
A. Dependent Variable
EmploymentNumber of persons engaged (in millions).PWT10.01993–2019
B. Independent Variable
Robot AdoptionThe primary source of this data is robot installation statistics of major industrial robot suppliers.IFR1993–2019
C. Mediating Variable
OutputOutput-side real GDP at chained PPPs (2017 US$).PWT10.01993–2019
D. Chanel Variables
Development StagePer capita GDP as a proxy for the development stage.PWT10.01993–2019
Manufacture/
Service Sector
Shares of service and manufacturing sectors.OECD2000–2019
Unemployment RatePercentage of the labor force that is unemployed.ILOSTAT1993–2019
Informal EconomyNumber of workers engaged in the informal economy.ILOSTAT2000–2019
EducationAverage years of education for the labor force in each country.Barro & Lee Database1995–2019
Business RegulationAssess the level of business regulation in a country, including government size, legal system and property rights protection, financial freedom, labor market freedom, and trade freedom, among others.Economic Freedom of the World1993–2019
Product Market ReformAdjustment and reform of regulations, laws, and institutions governing the product market to promote market competition, reduce market barriers, enhance market efficiency, and encourage innovation.Alesina et al. [29]1993–2019
Labor Market ReformAdjustment and reform of regulations, laws, and institutions governing the labor market to improve its flexibility, efficiency, and competitiveness.Alesina et al. [29]1993–2019
Table 2. Summary Statistics and Correlations.
All EconomiesAdvancedEmerging
RobotsEMPGDPRobotsEMPGDPRobotsEMPGDP
Panel A. Summary Statistics
Mean15.21.33.710.11.23.128.01.75.2
St Dev(16.4)(3.7)(6.6)(12.8)(1.7)(4.7)(19.0)(1.8)(6.0)
Panel B. Correlation
Robots1 1 1
EMP0.181 0.201 0.031
GDP0.290.4210.140.4710.360.271
Notes: This table shows summary statistics (Panel A) and unconditional correlation coefficients (Panel B) among growth rates in robot installation, total employment, and real GDP.
Table 3. Baseline Results.
AllAEEM
Panel A. Overall Effect
Emp-Robots
Robots0.00400.0156 ***−0.0104 **
(0.0036)(0.0050)(0.0051)
R-sq0.160.290.17
Panel B. Mediation Analysis
Output-Robots
Robots0.01320.0240 **0.0012
(0.0087)(0.0108)(0.0129)
0.250.280.57
Emp-Robots, Output
Robots0.00170.0109 **−0.0105 **
(0.0032)(0.0044)(0.0047)
Output0.1770 ***0.1940 ***0.0866 ***
(0.0121)(0.016)(0.0238)
0.320.420.21
Obs917681236
Notes: This table shows the estimated overall impact of robot adoption on employment (Panel A) based on Equation (1) and the mediation analysis (Panel B) based on Equations (2) and (3). All regressions control for time-fixed effects. ** and *** denote statistical significance at the 5% and 1% level, respectively.
Table 4. Determinants of Robot–Labor Relationship: Interacted–variable Analysis.
(1)(2)(3)
AllAEsEMs
Panel A. Macroeconomic Variables
Development stage0.018 ***0.026 *0.009
(0.004)(0.013)(0.009)
Service Sector0.214 *0.752 ***−0.0948
(0.111)(0.247)(0.088)
Manufacture sector0.014−0.1130.313 **
(0.084)(0.119)(0.136)
Unemployment rate 0.091 ***0.100 ***0.016
(0.024)(0.037)(0.029)
Education0.051 ***0.073 *0.022
(0.013)(0.042)(0.025)
Informal Economy −0.144 ***
(0.046)
Panel B. Institutional Variables
Business regulation0.005−0.0100.016 *
(0.005)(0.007)(0.007)
Product market reform0.043 *0.058 *−0.001
(0.023)(0.036)(0.019)
Labor market reform0.070 ***−0.0400.064 ***
(0.025)(0.058)(0.019)
Notes: This table reports the estimated influence of each potential factor on the robot–labor relationship ( γ 2  in Equation (4)). Coefficient estimates for the robot installation gap and each factor are not reported in the table. All regressions control for time-fixed effects. *, ** and *** denote statistical significance at 10%, 5% and 1% levels, respectively.
Disclaimer/Publisher’s Note: The statements, opinions and data contained in all publications are solely those of the individual author(s) and contributor(s) and not of MDPI and/or the editor(s). MDPI and/or the editor(s) disclaim responsibility for any injury to people or property resulting from any ideas, methods, instructions or products referred to in the content.

